
Time–Frequency Characteristics and SARIMA Forecasting of Atmospheric Water Vapor in East Asia

1
School of Electrical & Information Engineering, Anhui University of Science and Technology, Huainan 232001, China
2
State Key Laboratory of Space Weather, Chinese Academy of Sciences, Beijing 100190, China
3
School of Internet, Anhui University, Hefei 230039, China
*
Author to whom correspondence should be addressed.
Atmosphere 2023, 14(5), 899; https://doi.org/10.3390/atmos14050899
Submission received: 12 April 2023
/
Revised: 17 May 2023
/
Accepted: 19 May 2023
/
Published: 21 May 2023
(This article belongs to the Section Meteorology)
Abstract
:Given the increasing impact of extreme rainfall and flooding on human life, studying and predicting changes in atmospheric water vapor (AWV) becomes particularly important. This paper analyzes the moderate-resolution imaging spectroradiometer (MODIS) data of the East Asian region from January 2003 to February 2023. The AWV data are examined in the time and frequency domain using methods such as empirical orthogonal function (EOF), Mann–Kendall (MK) analysis, and others. Additionally, four prediction models are applied to forecast the monthly average AWV data for the next year. The accuracy of these models is evaluated using metrics such as mean square error (MSE), mean absolute error (MAE), root mean square error (RMSE), and coefficient of determination (R2). The findings reveal several key insights: (1) The East Asian region exhibits highly variable seasonal variability in AWV, with identified mutation points after the MK test. (2) Spatial analysis shows high AWV data in the southern coastal areas of China, Thailand, Myanmar, Nansha Islands, and other regions during winter, while the Qinghai-Tibet Plateau region experiences low AWV during summer. (3) The first mode obtained through EOF decomposition contributes over 60% of the variance. Analysis of this mode reveals an increasing trend in AWV data for regions such as the Indian peninsula, Mongolia, and central and northeastern China over the past nine years. Conversely, the Bay of Bengal, Spratly Islands, eastern coast, and certain areas display a decreasing trend. (4) Employing the ensemble empirical mode decomposition (EEMD), the study identifies AWV data as a non-stationary series with an overall decreasing trend from 2003 to 2022. The filtered AWV series undergoes fast Fourier transform (FFT), uncovering periodicities of 2.6 years, 5 years, and 19 years. (5) Among the four forecasting models compared, the seasonal autoregressive integrated moving average model (SARIMA) demonstrates superior performance with the smallest MSE of 0.00782, MAE of 0.06977, RMSE of 0.08843, and the largest R2 value of 0.98454. These results clearly indicate that the SARIMA model provides the best fit. Therefore, the SARIMA forecasting model can be effectively utilized for forecasting AWV data, offering valuable insights for studying weather variability.
1. Introduction
Atmospheric water vapor (AWV) is an important factor that affects winter precipitation in East Asia [1]. Its impact is particularly pronounced in arid and flood-prone regions [2]. This paper analyzes the data on AWV obtained by the MODIS instrument. These data refer to water molecules existing in the gaseous state [3] and are an important component of the Earth’s atmosphere, with units expressed in centimeters. The transport of water vapor has a significant impact on various aspects of the water cycle and solar radiation [4,5]. AWV also plays a critical role in absorbing long-wave radiation from the Earth’s surface, thereby maintaining a temperature range that is suitable for human survival [5]. However, during tropical cyclones and heavy rainfall events, water vapor can promote convection and precipitation patterns in the atmosphere, which can exacerbate the occurrence of extreme climate events [6]. Given its influence on important factors such as climate change, the study of AWV is crucial.
Over the past few decades, various techniques have been developed to measure precipitable water vapor, and a range of methods have been utilized to investigate its spatial and temporal characteristics. As far back as 1996, Ross and Elliott conducted a study on AWV in North America, using radiosonde measurements to analyze its trends [7]. Subsequently, radiosonde measurements were further refined, and in 2004, Bengtsson et al. used data from the ECMWF Re-Analysis forty-year project (ERA40) dataset to obtain temperature and AWV measurements. Their findings indicated a global increasing trend in AWV [8]. In 2008, Nilsson et al. conducted a study on AWV trends in Sweden and Finland, based on global positioning system (GPS) data collected over a 10-year period [9]. This paper investigates data measured from 2002 to the present using the MODIS instrument. The MODIS has 36 channels that cover the spectrum region between 0.4 and 15 μm, with five near-infrared channels (0.8 to 1.3 μm) available for remote sensing of water vapor [10]. This dataset provides highly accurate infrared multispectral hyperspectral data, which can be used to reflect the atmospheric state and changes in land and ocean characteristics.
In the field of water vapor research, Wei et al. [11] investigated the Zhengzhou region in China. They employed a hybrid model combining wavelet and complementary combined empirical mode decomposition, recurrent neural network, and ARIMA model to predict annual precipitation. Their findings reveal a relative prediction error of 14.1% for the period 2013–2017. Similarly, Hellen W. Kibunja et al. [12] utilized the SARIMA model to analyze precipitation prediction in a mountainous region of Kenya. The forecasting assessment statistics yielded ME = −0.0053687, MSE = 0.96794, RMSE = 0.98384, and MAE = 0.75197. Furthermore, Valipour et al. [13] conducted a comparative study on runoff in the United States, exploring the effectiveness of SARIMA and ARIMA models.
The variation trends of AWV data detected by MODIS and atmospheric infrared sounder (AIRS) can reflect a wealth of meteorological information [14]. Moreover, East Asia occupies a unique geographical location, encompassing several climatic zones simultaneously [1]. Therefore, it is of great significance to analyze the spatial characteristics and interannual variation trends of AWV in East Asia, using MODIS and AIRS detected data as reference values. Such analysis can help to shed light on the causes of droughts and floods in the region. Predicting the trend of AWV is of utmost importance in various fields such as agricultural production, climate change, and human life [15]. For instance, it can play a crucial role in mitigating the hazards caused by heavy rainfall [16] and facilitating early intervention in agricultural production during drought years. Therefore, understanding the trends and changes in AWV is critical for taking proactive measures to address the impact of these changes on human life and society as a whole.
This paper explores the characteristics and forecasting of the variation of AWV in the time and frequency domains in the East Asia region. This study employs several methods, including the MK mutation test, EOF, EEMD, FFT, SARIMA, and others. The innovations of this paper can be summarized as follows:
- (1)
- Comprehensive analysis: The paper investigates AWV time series not only in the time domain but also in the frequency domain, providing a more comprehensive understanding of its behavior.
- (2)
- Spatio-temporal analysis: Various aspects such as period and mode are studied based on the use of spatio-temporal analysis techniques. This allows for a deeper exploration of the AWV characteristics.
- (3)
- EEMD decomposition and filtering: The EEMD decomposition method is utilized to observe the smoothness of AWV data. Non-smooth AWV time series data are filtered, and FFT is applied to study the filtered data.
- (4)
- Multiple forecasting models: The paper employs multiple forecasting models to forecast the AWV time series and determine the optimal model for prediction.
The structure of the paper is outlined as follows: in Section 2, this study explores the sources of MODIS and AIRS data, compares and analyzes these datasets, and introduces the principles of the time–frequency domain analysis methods and evaluation indexes used in the study. In Section 3, this study investigates the interannual and seasonal trends of AWV and performs MK trend tests on the collected data. In Section 4, this study utilizes the EOF model to examine the spatial characteristic scores of AWV in the four seasons. In Section 5, this study explores the frequency domain variation characteristics of AWV using the EEMD decomposition method and applies FFT after filtering. In Section 6, this study constructs multiple forecasting models, including regression models, SARIMA models, Holt–Winters models, and GRNN neural network forecasting models, to forecast the AWV time series.
2. Sources and Analysis Methods of Detection Data
2.1. Data Sources and Processing
This study analyzes the temporal and spatial characteristics of AWV in East Asia using product information from both MODIS and AIRS instrument retrievals. The time frame of the analysis spans from January 2003 to February 2023. In this study, the seasonal year data range spans from March 2003 to February 2023, while the natural year data range covers January 2003 to December 2022. The MODIS spectral detector consists of 36 spectral bands with a spectral range spanning from 0.4 μm to 15 μm. Among these bands, five near-infrared channels located in the spectral region of 0.8 μm to 1.3 μm can be used for remote sensing of water vapor [10]. The MODIS instrument features 490 detectors with a swath width of 2330 km. This study mainly utilizes data from MYD08_M3_ product, which has a spatial resolution of 1° × 1° and a temporal resolution of 1 month.
AIRS is an atmospheric infrared instrument installed on the Aqua satellite [17]. The instrument has a total of 2378 thermal infrared channels and high spectral resolution, which enables remote sensing observations of various atmospheric parameters, such as atmospheric temperature, pressure, water vapor, methane, and ozone [18]. The AIRS data used in this study are Level-3 data from the V6 version [19], obtained from the East Asian region for nearly 20 years from January 2003 to February 2023. The data have a spatial resolution of 1° × 1° and a temporal resolution of 1 month.
2.2. MODIS and AIRS Data Products Comparison Discussion and Analysis
This section aims to verify the reliability of the AWV data obtained by the MODIS instrument in East Asia. To achieve this, both the AIRS’s Total Column Water Vapor (TotH2OVap) daytime data and MODIS’s AWV data were selected for the time period from January 2003 to February 2023. The comparison between the two datasets was conducted to evaluate the consistency and reliability of the MODIS data. Figure 1a displays the time series analysis of the monthly average values of MODIS and AIRS data. Despite having different units, both datasets show the same trend of change. Figure 1b presents the regression analysis of MODIS and AIRS data, showing a high goodness of fit of the regression equation (0.98) and an almost linear scatter. The equation of the fitted line is Y = 0.11X − 0.14. The data collected by the two satellites were compared and their correlation was found to be high, which indicates that the data collected by the MODIS probe can be used for research and analysis. In the next section, we use MODIS data to analyze the variation characteristics of AWV in the time–frequency domain and predict its behavior.
2.3. Time–Frequency Domain Analysis Methods
This section describes the analysis method of AWV data in time and frequency domain as well as forecasting, the specific relationship is shown in Figure 2.
2.3.1. Regression Analysis
Regression analysis is a statistical method used to determine the linear dependence between two or more variables. In the case where there is only one independent and one dependent variable, and the relationship between them can be represented by a straight line, it is referred to as univariate linear regression analysis. On the other hand, if there are two or more independent variables that exhibit a linear relationship with the dependent variable, then it is called multiple regression analysis [20].
When conducting regression analysis, the first step is to determine the dependent and independent variables. Then, the data for these variables are used to build a linear regression model. The model is evaluated using R2 to assess the degree of fit of the linear regression analysis. If the model meets the required level of fit, then the regression equation can be derived from the model. The equation can be expressed as:
In above Equation (1), represents the intercept of the fitted line, while to represent the slope of the fitted line. If n equals 1, then the equation is a linear regression equation. However, if n ≥ 2, then the equation is a multiple regression equation. The variable represents the random error. By using the regression equation and the available data of the independent variables, it becomes possible to predict the outcomes of the dependent variables. However, regression analysis is limited to studying data with linear correlations, making it challenging to create regression models for data with nonlinear correlations. As a result, alternative forecasting models will be considered and compared in this study’s forecasting models to overcome this limitation.
2.3.2. Mann–Kendall Mutation Test
The MK test is a nonparametric statistical method used to detect changes in the trend of time series data. It operates by comparing the relationship between the values of data arranged in successive order and calculating their slopes.
Under the assumption that the time series data {x1, x2, …, xn} are independent, we define the following statistical quantity:
where .
Under the given significance level, if the absolute value of UFK is greater than the significance level, the null hypothesis is rejected and the time series is considered to have a significant trend change. Furthermore, if UFK > 0, it indicates that the time series shows an upward trend, and if UFK < 0, it indicates that the time series shows a downward trend.
The method is then used to test for significant changes in the slopes. This test can be utilized to determine the occurrence of sudden changes in long time series data of water vapor content. Moreover, it is helpful in evaluating the significance of trends in water vapor across different seasons and years [21]. The MK test is suitable for studying different types of data, such as linear, nonlinear, and periodic trends. However, it is more effective for longer time series as opposed to shorter ones.
2.3.3. Pearson Correlation Coefficient
The Pearson correlation coefficient is a statistical method used to analyze possible correlation links between two or more variables. The degree of correlation is calculated through the analysis. For instance, when examining the correlation coefficient between variables a and b, the correlation coefficient formula (rab) is utilized. The formula is expressed below:
where ai and bi represent the data of the ith pair of samples, and are the means of the samples of the two variables, and n is the total number of samples studied. The coefficient rab takes values in the range of [−1, 1]. If 1 > rab > 0, it indicates a positive correlation between a and b. However, if 0 > rab > −1, it indicates a negative correlation between a and b. The larger the absolute value of rab, the stronger the correlation between a and b. The primary objective of this paper is to use the Pearson correlation coefficient to verify the reliability between MODIS data and AIRS data. Additionally, the study aims to analyze the main factors that influence water vapor variability [22]. The results of this analysis will then be applied to subsequent research.
2.3.4. Empirical Orthogonal Function
The EOF is a decomposition method used to separate the field of a physical quantity that varies with time [23,24]. It is utilized to obtain the main spatial distribution type that does not vary with time and the temporal part that changes only with time. It also provides the weight of each spatial type, where the spatial type with high weight can derive the primary spatial variation characteristics. Therefore, when analyzing the spatial and temporal variability characteristics of water vapor in the East Asian region [25] using EOF, it is essential to combine the primary spatial distribution part and the temporal coefficient part of water vapor to provide a comprehensive narrative.
2.3.5. Ensemble Empirical Mode Decomposition
EEMD is a signal processing technique that aims to increase the uniformity of the polar point distribution of a signal in order to suppress the aliasing between modes [26]. Since the original time series often has an uneven distribution of polar points, Gaussian white noise with uniform spectral distribution is added to the signal. This allows for the white noise to be adaptively distributed to different scales, thereby avoiding the issue of uneven distribution of extremum points. The white noise is added to the original signal as a background reference scale and automatically projected onto the associated scale of the white noise, which helps to prevent over-envelope or under-envelope.
However, the additional white noise can complicate the results of independent tests. To address this, zero-mean noise can be used instead. The solution is to add the white noise several times and average the results to eliminate the additional noise. The final output is the original signal itself. This processing improves the analysis of the signal’s characteristics and properties, leading to increased accuracy and reliability in signal processing.
2.3.6. Fast Fourier Transform
The FFT algorithm can break down complex signals into simpler components, enabling the conversion of a signal in the time domain to its equivalent in the frequency domain [27,28]. This technique allows for versatile observation of signals, as it facilitates the calculation of the signal’s amplitude and phase at various frequencies, which can then be processed in the frequency domain. In particular, the frequency domain processing method is often simpler and more efficient than its time domain counterpart, making it especially useful for processing challenging signals. By leveraging FFT, this paper is able to significantly reduce the computational burden of signal processing.
2.3.7. Seasonal Autoregressive Integrated Moving Average
The SARIMA method is used in this paper to analyze and forecast time series data with seasonality [29], using the AWV data captured by MODIS as an example. The modeling process consists of the following steps:
- (1)
- Obtain a long-term water vapor time series dataset;
- (2)
- Plot the water vapor data and conduct autocorrelation and partial correlation tests, as well as a unit root test to determine whether the data is stationary. If it is non-stationary, the data need to be differenced to obtain a stationary series;
- (3)
- Conduct autocorrelation and partial correlation tests on the stationary water vapor data to determine the approximate range of parameters, and then obtain optimal parameters through model training [30];
- (4)
- Use the optimal parameters to build a SARIMA model, then examine the model to ensure its stability, and finally use it to forecast the long-term water vapor time series.
The SARIMA model is well-suited for capturing seasonal patterns that occur at fixed time intervals. However, it may struggle to handle irregular or multiple seasonal patterns effectively. Additionally, SARIMA models are more complex and demanding in terms of computing resources compared to other forecasting models.
2.3.8. Holt–Winters Forecasting Model
The Holt–Winters model, also known as the Three-Exponential Smoothing Model, assumes that points closer in time to the forecasting point are assigned greater weighting factors than those further away [31]. The model takes a weighted average of data from different time points, where historical values closer to the most recently trained data have a greater impact than those further away. One-time exponential smoothing is suitable for time series with no significant trend change, secondary exponential smoothing is suitable for time series with trend change characteristics but no seasonal change, while three-exponential smoothing is suitable for time series with both trend and seasonal change characteristics. Therefore, it is particularly well-suited for predicting the seasonal water vapor trend changes in this paper [32]. However, the Holt–Winters model is suitable only for predicting models with a single trend of change; nonetheless, it remains relatively easy to implement.
2.3.9. Generalized Regression Neural Network Forecasting Model
The Generalized Regression Neural Network (GRNN) is a radial basis neural network renowned for its exceptional approximation and nonlinear mapping capabilities [15]. With a faster learning speed, fault tolerance, and robustness, GRNN is well-suited to address nonlinear problems. Moreover, it demonstrates effectiveness in predicting unstable data and remains reliable even with limited sample data [33]. Consequently, GRNN is employed to construct the AWV data forecasting model. However, due to the manual selection of GRNN parameters, choosing larger parameter values enhances the network’s ability to approximate the sample data but also increases the risk of overfitting. Conversely, opting for smaller parameter values facilitates a smoother approximation process, albeit with a trade-off of increased error. Thus, in this study, an iterative approach will be employed to determine the optimal spread value.
2.4. Evaluating Indicator
In order to evaluate the forecasting effectiveness of the model, several evaluation metrics are chosen in this section. The following indicators are used, where n represents the number of samples, yi represents the actual value of AWV, represents the mean value of AWV, and f(xi) represents the model forecasting:
- (1)
- MAE measures the average absolute value of the prediction error of a model. It provides a measure of the accuracy of the predictions compared to the true values. It is calculated as follows:
- (2)
- MSE measures the mean squared difference between the predicted values and the true values. It is calculated as follows:
- (3)
- RMSE represents the standard deviation of MSE. It is calculated as follows:
- (4)
- R2 indicates the model’s ability to explain the observed data. It takes a value between 0 and 1, with a higher value indicating a better forecasting effect. When R2 is equal to 1, it represents a perfect fit of the model to the data, indicating optimal performance. The formula for calculating R2 is as follows:
3. Inter-Annual Variability Analysis of AWV
3.1. Inter-Annual Variability Trend of Latitude and Longitude AWV
This section analyzes the interannual trends of water vapor data in East Asia from January 2003 to February 2023, as provided by MODIS. Figure 3a illustrates the variation of water vapor content with longitude. In the region spanning from 100° E to 150° E, the water vapor content generally increases with increasing longitude, with two sudden decreases occurring near 75° E and 100° E. This could be attributed to the impact of the Qinghai-Tibet Plateau on atmospheric circulation and water vapor transport, resulting in a failure to transport water vapor eastward along the wind direction in its southeastern and southern regions. As a consequence, water vapor content decreases. Figure 3b illustrates the variation of water vapor content with latitude, which shows a gradual decrease with increasing latitude. This could be due to the decrease in temperature and relative air humidity as latitude increases, leading to a corresponding reduction in water vapor content in the air.
3.2. Annual Average AWV Change and MK Analysis in East Asia
The water vapor data of East Asia from 2003 to 2022, detected by MODIS, were subjected to annual average and MK analyses. Figure 4a illustrates the annual average of water vapor content in East Asia from 2003 to 2022, revealing that water vapor content peaked in 2010 and reached a trough in 2022. Figure 4b presents the results of the MK test for the annual average of water vapor content. The UFK represents the forward sequence curve, while UBK represents the reverse sequence curve. The mutation point falls within the range of , indicating that the mutation point is statistically significant with 95% confidence. From 2012 to 2022, UFK is less than 0, suggesting a general decrease in water vapor content during this period. The water vapor content exceeds the critical value from 2018 to 2022, indicating a significant decreasing trend of water vapor during this period. This trend is consistent with the year-by-year change line graph on the left. The intersection of UFK and UBK in 2015 and the intersection point lies within the confidence interval, indicating that the intersection point corresponds to the moment when the mutation starts in 2015, and because UFK is less than 0 in 2015, indicating that AWV decreases more significantly in 2015. This reduction could be attributed to major natural disasters or anthropogenic factors in those years.
3.3. Inter-Annual Variability Trend of AWV in Different Seasons in East Asia
In this section, data provided by MODIS for East Asia from March 2003 to February 2023 were analyzed to determine the interannual trends of AWV by season, as illustrated in Figure 5. The x-axis represents the year, while the y-axis represents the AWV, which ranges from 1.5 cm to 4 cm across all seasons. The highest water vapor content was observed in summer, while the lowest content was in winter, with the spring and autumn values falling between these two extremes. In 2010, the water vapor content peaked in summer and autumn, likely due to typhoons and rainy seasons. However, since 2010, the water vapor content for all seasons has generally been decreasing, which may be attributed to global warming and other factors.
3.4. MK Seasonal Analysis of AWV in East Asia
The MK analysis of AWV data detected by MODIS from March 2003 to February 2023 is shown in Figure 6. It is observed that the mutation points of all four seasons are within the range of , which indicates that these mutation points meet the 95% confidence interval and are of reference significance. In the summer and autumn MK examinations, the UFK changes from “−” to “+” from 2009 to 2010, indicating that the water vapor content changes from a decreasing trend to an increasing trend in summer and autumn in these two years. In late 2013, the curves of UFK and UBK intersect in the spring MK test, which means a sudden change point, and UFK < 0, indicating that the spring water vapor content changed abruptly after 2013, and the overall trend is decreasing. From around 2009, UFK started to be less than 0 in spring and winter, and from around 2012, UFK also started to be less than 0 in summer and autumn, and kept decreasing until it exceeded the critical value. This indicates that the water vapor content in East Asia gradually decreased from 2012 and has no increasing trend, which is more consistent with the trend of the annual average value of the four seasons.
4. Spatial Characteristic Analysis of AWV
After analyzing the temporal variation of AWV in East Asia, it becomes apparent that the region has experienced substantial economic development and human activities in the last two decades. The process of urbanization has led to the emission of considerable amounts of waste gas and water, thereby influencing the formation and distribution of water vapor. Additionally, human activities such as agricultural development and deforestation have had a notable impact on the water cycle. Consequently, these factors have contributed to heightened fluctuations of AWV in the area. Therefore, this section aims to investigate the spatial distribution characteristics of AWV in East Asia.
4.1. Spatial Characteristic Distribution of Four-Season and Multi-Year Average AWV in East Asia
Figure 7 illustrates the spatial distribution of AWV in East Asia during four seasons from 2003 to 2022. The x-axis represents longitude, ranging from 0° N to 60° N, while the y-axis represents latitude, ranging from 70° E to 150° E. The color scale ranges from 0 to 5 to represent the variation of water vapor content, with an average range of 1.5 cm to 4 cm across different seasons. The spatial distribution of water vapor content in East Asia shown in Figure 7 reveals some interesting patterns. Firstly, there is a gradual decrease in water vapor content with increasing latitude, which may be due to the fact that precipitation tends to be lower in higher latitude regions. During winter, the higher latitude regions of East Asia have low water vapor content, with only the southern coastal areas of China, Thailand, Myanmar, Spratly Islands, Indian Peninsula, and the Philippines exhibiting higher water vapor content. In contrast, the water vapor content is significantly higher during summer, except for the Tibetan Plateau region which has a low water vapor content. This is likely due to the high altitude of the Tibetan Plateau region resulting in low air pressure, making it difficult for water vapor to accumulate. In spring and autumn, the spatial variation of water vapor content in northern China and coastal areas is relatively similar, with a slight increase in water vapor content observed in the Philippines, Taiwan, and eastern coastal regions of China.
4.2. The Annual Average Spatiotemporal Characteristic EOF of AWV in East Asia
In this section, we utilize the monthly average data of water vapor content in East Asia from January 2003 to December 2022 to conduct an EOF analysis. Table 1 presents the variance contribution of the first three modes of water vapor content, which are 63.81%, 9.72%, and 6.72% respectively. The cumulative variance of these modes is 80.25%, indicating that they effectively capture the main variation characteristics of water vapor in the East Asia region. Notably, the first mode accounts for the largest variance contribution and thus best reflects the changes in water vapor content. Therefore, we primarily utilize the first mode’s spatial distribution and time coefficient maps to analyze the water vapor situation in East Asia.
From the spatial distribution map of the first mode in Figure 8, it is evident that there are negative values in the Bay of Bengal, Spratly Islands, eastern coast, southern coastal areas of China, Qinghai-Tibet Plateau, Xinjiang, and some regions of Inner Mongolia. On the other hand, the regions of the Indian peninsula, Mongolia, central China, and northeast China show positive values, with larger values in the three northeastern provinces of China. These positive values indicate more drastic changes in water vapor content in these regions. When considering the time coefficient diagram of the first mode, as depicted in Figure 9, it is evident that the time coefficients were predominantly negative from 2003 to 2013, while they were mostly positive from 2014 to 2022. This indicates that the water vapor content in regions such as peninsular India, Mongolia, central China, and northeast China has generally exhibited an upward trend over the past nine years, with the northeast region showing the most pronounced increase. On the other hand, the water vapor content in the Bay of Bengal, Spratly Islands, eastern coast, southern coastal areas of China, Qinghai-Tibet Plateau, Xinjiang, and parts of Inner Mongolia shows an overall decreasing trend. This trend can be attributed to various factors such as South Asian monsoon circulation, overgrazing, deforestation, and rapid urbanization.
5. Analysis of the Frequency Domain Variation of AWV in East Asia
The analysis of AWV variation was conducted in the time domain as described above. However, due to the complex nature of water vapor variation, it can be challenging to discern its periodic characteristics solely in the time domain. Therefore, a frequency domain analysis was employed to investigate its periodic variations more comprehensively.
5.1. EEMD Decomposition of AWV Time Series
This section employs the EEMD technique to decompose the time series of AWV in East Asia from 2003 to 2022, as illustrated in Figure 10.
A total of four intrinsic mode functions (IMF) components are obtained in Figure 10, with the first three IMF components representing the periodic terms of the water vapor content time series at different time scales, while the last IMF component represents the long-term trend variation. The IMF1 component signifies high-frequency variations or fluctuations in the AWV data. With its substantial amplitude, the IMF1 component emerges as the predominant feature of these high-frequency variations. Moreover, the absence of notable periodic patterns suggests that these variations are minimally affected by seasonal or long-term trends. The rule for determining the long-term trend change term states that if the trend term of IMF4 exhibits a monotonic change, it means that the original signal is non-stationary. From IMF4 in Figure 10, it can be seen that the water vapor content time series variation process in East Asia follows a monotonic function, indicating that the water vapor content time series is non-stationary. Moreover, the IMF2–4 components all exhibit clear periodicity, with change patterns resembling sinusoidal functions. The long-term trend change term further suggests that the water vapor content in East Asia has been decreasing from 2003 to 2022.
5.2. Fast Fourier Transform with Filtering
The EEMD method has some limitations in signal processing, which is why the FFT was employed next to analyze the AWV data from 2003 to 2022. Since there may be unwanted noise signals in the AWV time series, a filtering step was applied prior to FFT analysis to mitigate their effects. The FFT was then used to analyze the characteristics of the AWV data.
In this study, the AWV sequence was filtered using a Butterworth filter. Figure 11a–c display the results of high-pass, low-pass, and band-pass filters, respectively. The high-pass filter is designed to allow high-frequency signals to pass through, while attenuating signals below the critical cut-off frequency. This is achieved by setting the cut-off frequency to effectively filter out low-frequency signals. In this study, high-pass filters are applied to select the AWV time series with a period of less than three years. The results in Figure 11d show the outcome after performing the FFT on the high-pass filtered series. It reveals the existence of a period of 2.6 years in the filtered AWV time series. The low-pass filter operates in the opposite manner to the high-pass filter, allowing signals with frequencies lower than the cut-off frequency to pass through. In this study, the cut-off frequency for the low-pass filter is set at 1/10, which means that AWV time series with a period of 10 years or longer are retained. The results of the FFT on the low-pass filtered sequence are shown in Figure 11e, which indicates the presence of a 19-year period in the low-pass filtered AWV time series. In the band-pass filtering process, the low and high frequency cutoff frequencies are set at 1/3 and 1/10, respectively, resulting in a selection of AWV time series with periods ranging from 3 to 10 years. The results, as shown in Figure 11f, were obtained after applying the FFT on the band-pass filtered series. It revealed that the band-pass filtered AWV time series exhibits periods of 5 and 3.3 years. The magnitude of the amplitude indicates that the 5-year period in the band-pass filtered signal is the most prominent.
6. Construction of Predictive Model and Result Analysis
Previous studies illustrated that AWV can be influenced by various factors, including the natural environment and human activities. For example, Zhai et al. [34] demonstrated that AWV is closely related to interannual trends in surface skin temperature. Samuels-Crow et al. [35] found that changes in water circulation due to convection can affect water vapor, making factors associated with the troposphere important in understanding AWV variability. Rangwala et al. [36] also showed that humidity and long-wave radiation can impact changes in water vapor, and the rate of surface warming can affect surface humidity. Furthermore, Liu et al. [37] found that the surface warming rate is influenced by the altitude of the station, which in turn is influenced by air pressure. Lee et al. [38] illustrated that the water vapor mass mixing ratio at the surface is closely related to AWV.
In this part, we consider several factors when predicting water vapor, including surface skin temperature (SurfSkinTemp), temperature of the atmosphere (AirTemp), temperature of the tropopause (TropTemp), height of the tropopause (TropHeigh), pressure of the tropopause (TropPres), relative humidity at the surface over equilibrium phase (RelHumSurf), relative humidity at the surface over liquid phase (RelHumSurf_liquid), outgoing long-wave radiation flux (OLR), clear-sky outgoing long-wave radiation flux (ClrOLR), combined cloud top pressure (CloudTopPres), combined cloud top temperature (CloudTopTemp), and water vapor mass mixing ratio (H2O_MMR_Surf). Pearson correlation coefficients between these factors and water vapor is used to identify the main variables affecting water vapor. Regression analysis, Holt–Winter model, GRNN neural network, and SARIMA models is applied for water vapor forecasting.
For model construction, we selected the time period from January 2003 to January 2017 as the training data, and the time period from February 2017 to February 2023 as the test data. This division of data allowed us to train our models on historical data and evaluate their performance on recent data to ensure their predictive accuracy.
6.1. Construction of Multiple Regression Model and Result Analysis
6.1.1. Variable Selection
After calculating the Pearson correlation coefficients between various variables and water vapor, the results are presented in Table 2 as follows:
This study identifies the main influencing factors of water vapor by considering variables with absolute Pearson correlation coefficients greater than 0.8. The results reveal that the height of the tropopause, the pressure of the tropopause, water vapor mass mixing ratio, land surface temperature, temperature of the atmosphere, combined cloud top pressure, and clear-sky outgoing long-wave radiation flux are the key variables affecting water vapor, as shown in Table 2.
6.1.2. Forecasting Result of AWV Based on Multiple Regression
The trend of water vapor is plotted by fitting a regression equation, as illustrated in Figure 12. The blue curve represents the training data, while the orange curve represents the test data. Additionally, the purple curve depicts the predicted result on the test data, based on the regression analysis.
6.2. Construction of SARIMA Model
6.2.1. Stationarity Test
Before constructing a time series model for forecasting, we first plotted the time domain graph of the original data and conducted an autocorrelation test (ACF), a partial autocorrelation test (PACF), and a unit root test (DF) to obtain Figure 13. It can be observed from the time domain graph that the water vapor exhibits strong periodicity, and in combination with the results of the autocorrelation test, its period was determined to be 12. Additionally, Figure 13 illustrates that the p-value was 0.33195, which is greater than 0.05, indicating that the null hypothesis is accepted, and suggesting that the water vapor data are non-stationary. This finding is consistent with the conclusion drawn after the EEMD decomposition analysis above.
As the water vapor data are non-stationary, it is necessary to perform seasonal differencing before constructing the time series model. Additionally, since the water vapor data exhibit seasonality, seasonal factors should be incorporated into the model. Therefore, in this study, a SARIMA model was constructed for forecasting.
6.2.2. Seasonal Difference
After applying seasonal differencing to the water vapor data to remove seasonality, a unit root test was conducted on the differenced data, as well as autocorrelation and partial correlation tests. The results are shown in Figure 14. The unit root test shows that p = 0.00103, which is less than the significance level of 0.05, indicating that the differenced data are a stationary series. This suggests that the seasonal differencing effectively addressed the issue of non-stationarity in the water vapor data.
For the seasonal parameters (P, D, Q) in the SARIMA model, it is assumed that D = 1 since only one seasonal differencing is performed on the water vapor data. Additionally, the PACF (partial autocorrelation function) diagram shows a significant lag at order 36, suggesting that P = 3. On the other hand, the ACF (autocorrelation function) diagram shows that the seasonally differenced data are truncated at order 12, indicating that Q should be chosen around 1.
6.2.3. Residual Test
Using the grid search method based on the minimum AIC (Akaike Information Criterion) criterion, the optimal parameters for the water vapor time series model were determined as SARIMA (1,0,0) × (2,1,1,12). Subsequently, an error test was performed, and the results are shown in Figure 15.
Figure 15 depicts the residual test results. In the top left plot, it can be observed that the residuals fluctuate around the line x = 0, indicating that the residual mean is close to zero. The top right plot shows the histogram of the residuals, with the green line closely fitting the orange ones, suggesting that the residuals follow a standard normal distribution. The bottom left plot displays a scatter plot of the residuals, which is evenly distributed along the red diagonal, further supporting the assumption of residuals obeying a standard normal distribution. The lower right plot presents the autocorrelation plot of the residuals, showing that the autocorrelation coefficient is close to 1 at the 0th order lag and insignificant at other order lags, indicating that there is no significant autocorrelation in the residuals at different lags.
6.2.4. Forecasting Result of AWV Based on SARIMA
Figure 16 displays the results of AWV time series forecasting using the SARIMA model. The blue line represents the training set, the orange line represents the test set, the green line represents the forecasting results, and the gray interval represents the 95% confidence interval. It can be observed from the figure that the orange line closely aligns with the green line, and the gray confidence interval is narrow, indicating that the model predicts well. The model also provides predictions for the water vapor content in the later period, based on the green line.
6.3. Construction of Holt–Winters Model and Forecasting Result
In this study, the Holt–Winters model with additive error, additive seasonal term, and additive trend is utilized for predicting the water vapor content. Errors are also calculated to assess the accuracy of the predictions.
The forecasting of water vapor content in the East Asian region is based on the constructed Holt–Winters summation model. Figure 17 illustrates that the orange curve represents the training data of water vapor content, the green curve represents the test set of data, and the purple curve represents the predicted set of AWV from February 2017 to February 2024. The range enclosed by the gray dashed line represents the 95% confidence interval.
6.4. Construction of GRNN Neural Network and Analysis
6.4.1. Model Construction
In the construction of the GRNN model, the main influencing variables of water vapor were chosen as the input for the network. This means that the independent variables in the multiple regression model were used as the inputs for the network, while water vapor was considered as the output. The neural network was trained using the cross-validation method, which helps in evaluating the performance of the model.
Furthermore, the grid search method is employed to determine the optimal speed of expansion of radial basis function (SPREAD) in order to build an effective GRNN neural network model for water vapor forecasting. This involves systematically searching through a range of SPREAD values to find the one that yields the best performance for the specific dataset and problem at hand.
During the cross-validation process, the training samples are randomly divided into four equal parts. At each iteration, one part is used as the test set, while the remaining three parts are used as the training set. The model is then trained on the training set, and the Mean Squared Error (MSE) is calculated on the test set as a measure of its performance. This process is repeated four times, with each part being used as the test set once. The SPREAD value that corresponds to the smallest MSE across all four iterations is selected as the best parameter for the GRNN model.
After determining the optimal SPREAD value using cross-validation, the model is retrained using all the training data, and the remaining data are used as the test set to obtain the final forecasting results. This allows for a comprehensive evaluation of the model’s performance on unseen data, providing a reliable assessment of its predictive capabilities.
6.4.2. Forecasting of AWV Based on GRNN
Using the cross-validation method, the optimal SPREAD value was determined to be 0.1, and a GRNN neural network model with a SPREAD of 0.1 was established. The forecasting analysis results are shown in Figure 18, with the training sample plotted in blue, the forecasting sample in purple, and the test sample in red.
6.5. Comparison of Four Models
6.5.1. Comparison of the Forecasting Results
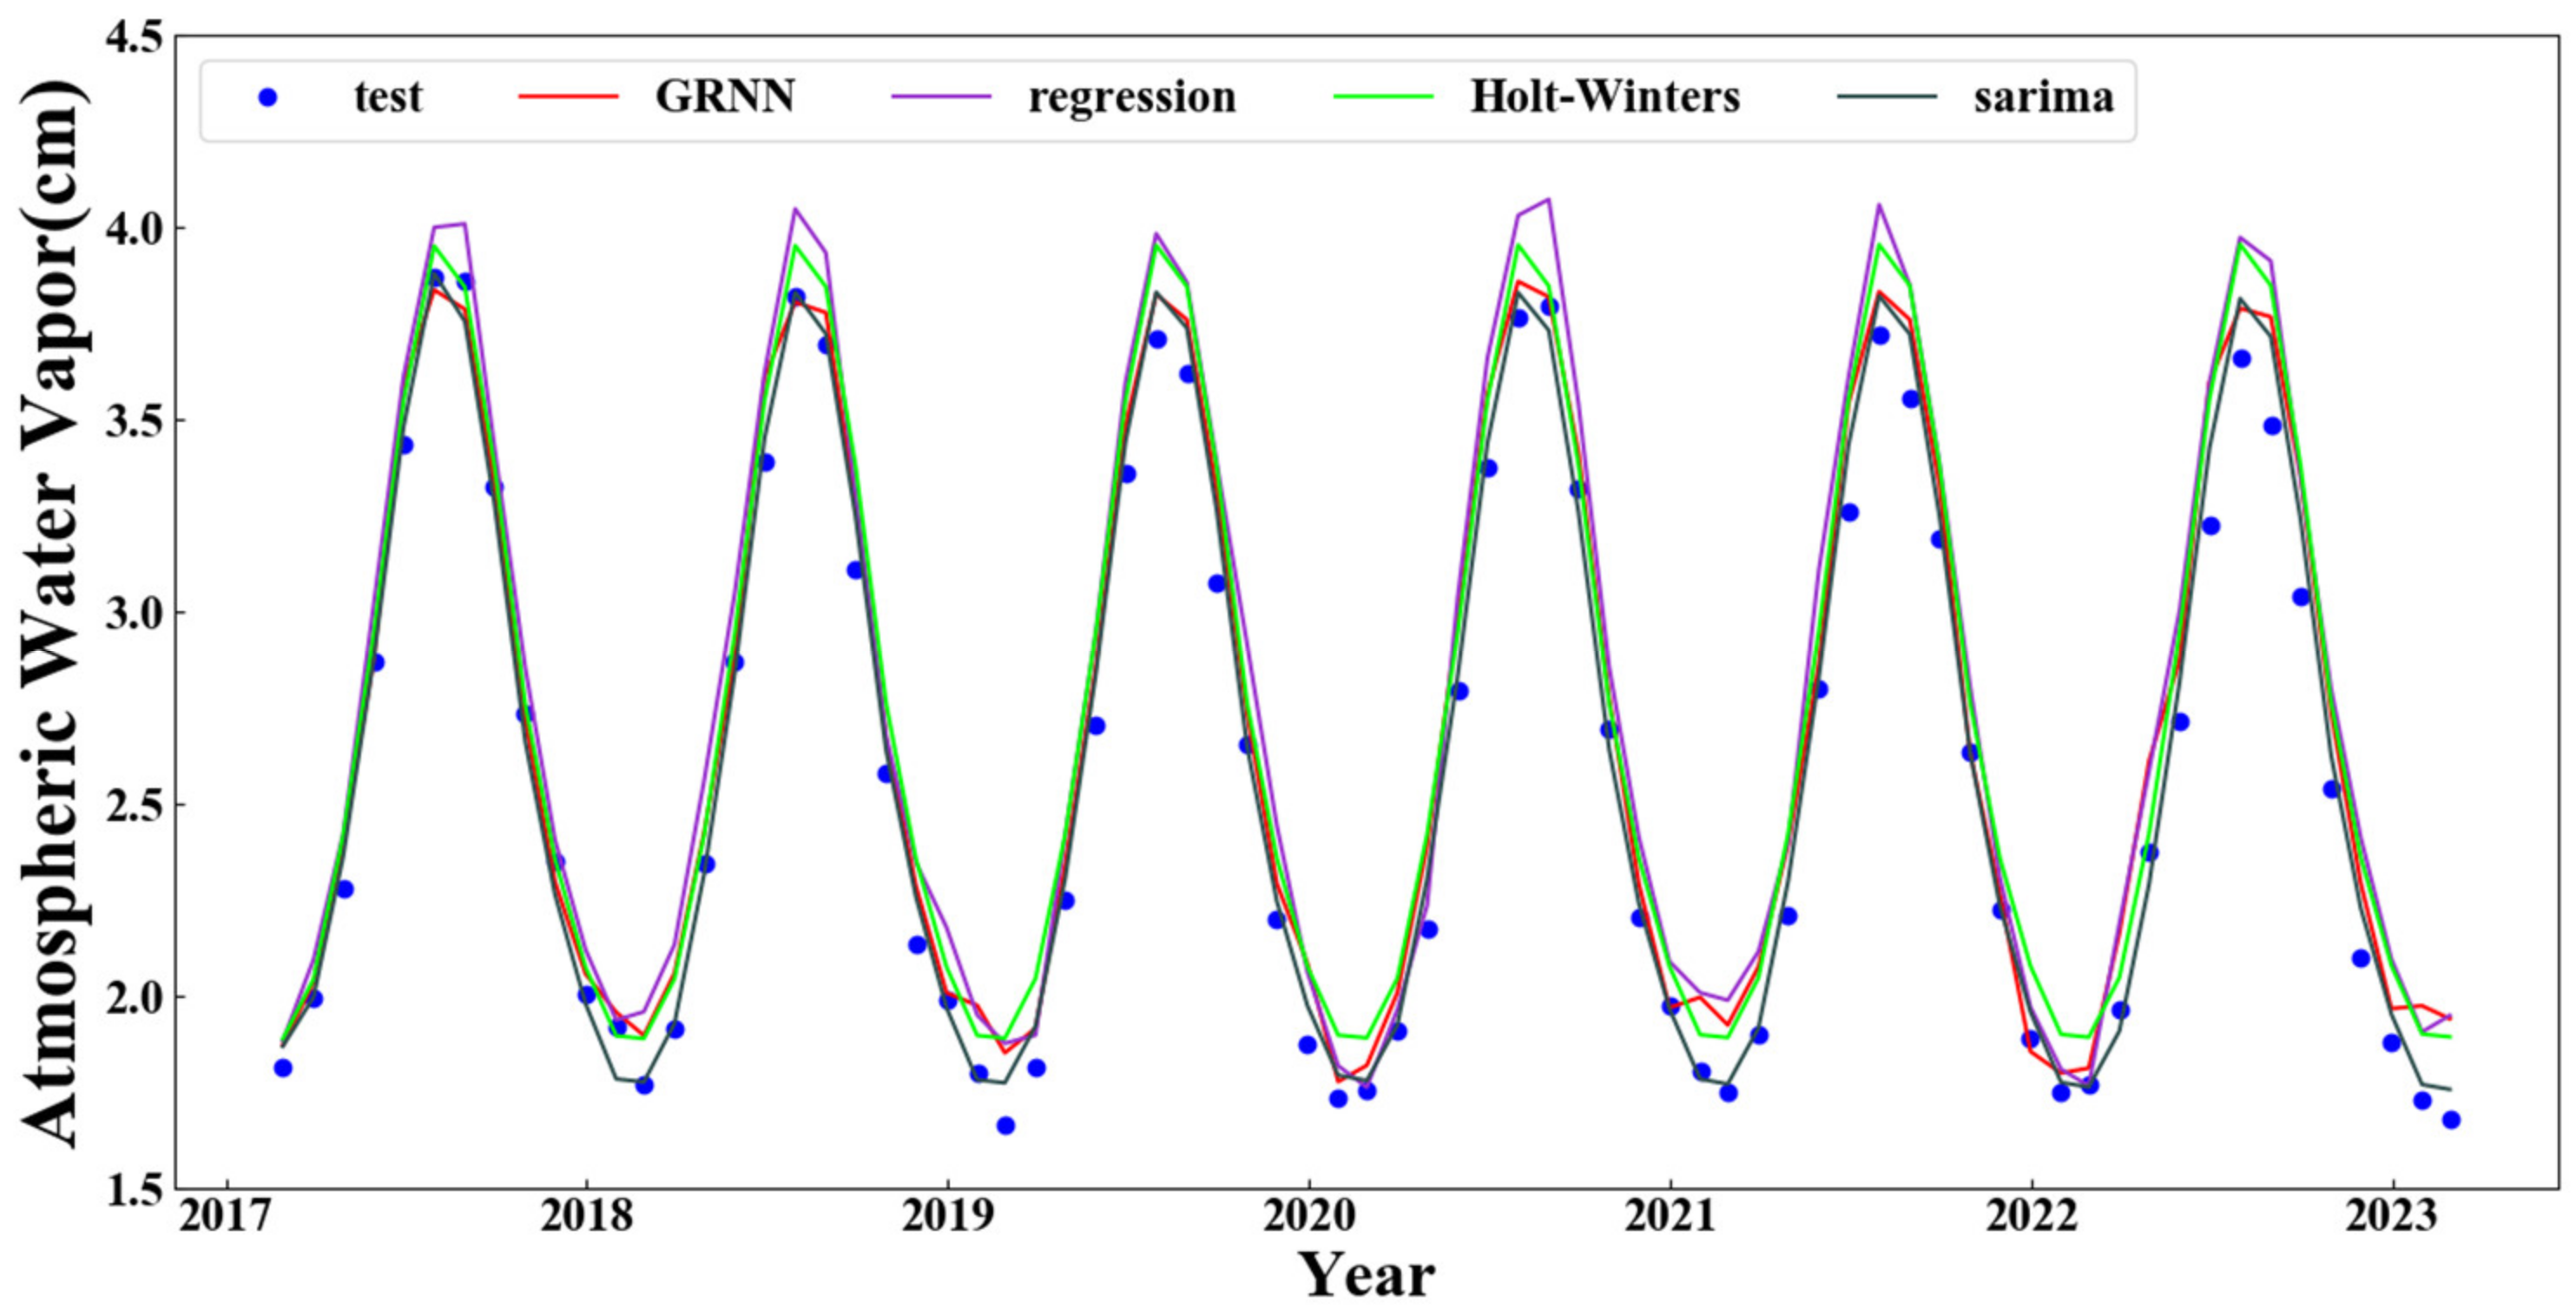
In this section, the test set data of the four forecasting models are compared and plotted in Figure 19. The blue scatter points represent the original data of water vapor content, while the red curve represents the results obtained by GRNN neural network forecasting, the purple curve represents the results obtained by multiple regression analysis forecasting, the green curve represents the results obtained by Holt–Winters model forecasting, and the black curve represents the results obtained by SARIMA model forecasting. From Figure 19, it can be observed that the results of multiple regression analysis have the worst coincidence with the blue scatter, while the remaining three forecasting models show better coincidence. Therefore, the advantages and disadvantages of the remaining three forecasting models will be further analyzed through evaluation indices.
6.5.2. Error Comparison
In this subsection, four evaluation indicators, namely MSE, MAE, RMSE, and R2, are used to evaluate the performance of the four forecasting models, as shown in Table 3. Smaller values of MSE, MAE, and RMSE indicate smaller errors, while a result of R2 closer to 1 indicates better fitting. It can be observed that the multiple regression model has much larger errors compared to the remaining three forecasting models, which is consistent with the results shown in Figure 19. The SARIMA forecasting model has much smaller errors compared to the other three models, while the difference between the errors of the remaining two models is not very large, with the Holt–Winters forecasting model slightly larger than the forecasting results of the GRNN neural network model. These results suggest that the SARIMA forecasting model is the most suitable for water vapor content forecasting.
7. Discussion and Conclusions
7.1. Discussion
In this study, we present a comprehensive analysis of AWV data in the East Asia region using MODIS data. Our analysis covers a 20-year period from January 2003 to February 2023, and examines the spatial and temporal characteristics, seasonal patterns, modality, and periodicity of AWV data. The primary objective of our study is to gain insights that can contribute to the prediction of extreme weather events and floods.
While previous studies have typically focused on spatial and temporal analyses of AWV data, our research goes beyond that by incorporating periodic and modal analyses. Exploring periodicity in filtered AWV data is a relatively unexplored area in the literature, considering the non-stationary nature of such time series data.
Additionally, this study conducts an extensive review of recent literature on AWV research. Some studies have investigated the dynamic processes of AWV in global circulation and climate change [39]. Others have examined the accuracy of datasets by reanalyzing multiple data sources to improve precision [40]. There are also studies that compare and evaluate water vapor datasets from different sources and propose suggestions for improvement [41]. Furthermore, researchers have explored water vapor transport and its impact on climate, such as the influence of water vapor transport on climate [42], and the effects of deforestation and drought conditions in the Amazon basin on water vapor transport [43,44].
In contrast to previous studies, our research not only analyzes the spatial and temporal variability of AWV but also explores the frequency domain using EEMD. This method allows us to examine the smoothness of the AWV time series data. Additionally, this study employs FFT on the filtered AWV signal to investigate its periodicity. These approaches are unique and novel compared to earlier research efforts.
In addition, this study conducted a forecasting study based on the time–frequency domain analysis of AWV. Unlike previous studies that utilized only one or two forecasting algorithms for meteorological data [45,46,47,48], this study employs four different forecasting algorithms and compares their results to identify the best forecasting model. This approach has significant implications for short-term rainfall forecasting. Given the complex nature of AWV changes, our future research will focus on narrowing down the study area and taking into consideration local geographic conditions, population density, and other influencing factors to further improve forecasting accuracy.
7.2. Conclusions
This study employs several methods, including the MK mutation test, EOF analysis, EEMD analysis, FFT analysis, and SARIMA modeling, to investigate the temporal and frequency domain characteristics of AWV in the East Asian region. Based on our analyses, the following conclusions are drawn in this study:
- (1)
- The analysis of the time series change trend of AWV reveals that the overall trend of water vapor content increases with the increase of longitude, but abrupt changes occur near 100° E, resulting in a tick-type trend in longitude. Additionally, the water vapor content gradually decreases with the increase of latitude. The annual average variation trend of AWV in the East Asia region shows a rising and then decreasing trend, with the maximum average value observed in 2010 and the minimum in 2022. The interannual variation trend graph of each season indicates that the variation is significant, with the highest water vapor content observed in summer and the lowest in winter. Specifically, the AWV content in summer and autumn peaked in 2010. The MK test mutation points of all four seasons fall within the confidence interval, and the UFK of all four seasons has been consistently below 0 since 2012, indicating a gradual decrease in water vapor content.
- (2)
- The analysis of spatial characteristics reveals that the AWV content gradually decreases with increasing latitude. In winter, the values of AWV content are low in the higher latitude regions of East Asia, with only the regions of southern coastal areas of China, Thailand, Myanmar, Spratly Islands, Indian Peninsula, and Philippines showing higher AWV content. However, in summer, when the AWV content is generally high in all regions, only the Qinghai-Tibet Plateau region exhibits lower AWV content.
- (3)
- Three spatial features and three temporal coefficients are obtained through EOF decomposition, with the cumulative variance contribution of the first three modes exceeding 80% and the variance contribution of the first mode exceeding 60%. From the first modal and temporal coefficients of the EOF decomposition, it can be observed that the water vapor content in the peninsula of India, Mongolia, and central and northeastern China has shown an increasing trend over the past 9 years. However, the Bay of Bengal, Spratly Islands, eastern coast, southern coastal areas of China, Qinghai-Tibet Plateau, Xinjiang, and some regions of Inner Mongolia have shown a decreasing trend in AWV content.
- (4)
- Through EEMD decomposition, we discover that AWV is a non-stationary time series, with IMF2–4 components exhibiting clear periodicity resembling sinusoidal functions. Furthermore, the trend of AWV shows a decreasing pattern from 2003 to 2022. The FFT transform of the filtered AWV series revealed periodicities of 2.6, 5, and 19 years.
- (5)
- This study employs multiple regression, SARIMA, Holt–Winters, and GRNN neural network models for predicting AWV time series. The forecasting results are compared and evaluated using graphs and evaluation metrics against test sets. Among these models, the SARIMA model exhibits the best fitting effect, while multiple regression analysis shows the weakest fitting effect. Therefore, the SARIMA forecasting model can be employed for AWV forecasting in East Asia, providing valuable references for future research on regional extreme rainfall and other weather phenomena.
Although we have analyzed the spatial and temporal distribution as well as the periodicity of AWV using various time–frequency domain methods, and predicted it using four different algorithms, it is important to note that the variability of AWV is influenced by multiple factors such as atmospheric temperature, top tropospheric pressure, wind speed, and more. Therefore, in order to conduct a more comprehensive analysis of AWV, we plan to narrow down the study area and investigate the impact of extreme weather events on AWV, taking these additional factors into consideration for a more robust analysis.
Author Contributions
C.T.: methodology, writing—review and editing. Z.T.: methodology, writing—original draft. Y.W.: software, investigation, and resources. X.W.: investigation and validation. X.T.: investigation and resources. J.Y.: investigation and validation. All authors have read and agreed to the published version of the manuscript.
Funding
This study is supported by the Graduate Innovation Foundation of Anhui University of Science and Technology (No. 2022CX2098), the Graduate Student Academic Innovation Project of Anhui Province of China (No. 2022xscx076), and the University Natural Science Research Project of Anhui Province of China (No. 2022AH050083K; J2019A0103).
Institutional Review Board Statement
Not applicable.
Informed Consent Statement
Not applicable.
Data Availability Statement
The version 6.0 level 3 dataset of AIRS was downloaded from https://disc.gsfc.nasa.gov/datasets (Recently accessed date: 1 February 2023). The MYD08_M3_ version of the dataset was downloaded from https://ladsweb.modaps.eosdis.nasa.gov/search/ (Recently accessed date: 1 February 2023).
Acknowledgments
We would like to thank the AQUA-AIRS team and the MODIS team for providing the necessary datasets used in this study. We are grateful to the Project Supported by the Specialized Research Fund for State Key Laboratories.
Conflicts of Interest
The authors declare that there are no conflict of interest regarding the publication of this paper.
References
- He, W.; Sun, B.; Wang, H. Dominant modes of interannual variability in atmospheric water vapor content over East Asia during winter and their associated mechanisms. Adv. Atmos. Sci. 2021, 38, 1706–1722. [Google Scholar] [CrossRef]
- Yao, J.; Chen, Y.; Zhao, Y. Climatic and associated atmospheric water cycle changes over the Xinjiang, China. J. Hydrol. 2020, 585, 124823. [Google Scholar] [CrossRef]
- Salomonson, V.V.; Barnes, W.; Masuoka, E.J. Introduction to MODIS and an overview of associated activities. In Earth Science Satellite Remote Sensing; Science and Instruments: New York, NY, USA, 2006; Volume 1, pp. 13–32. [Google Scholar]
- Galewsky, J.; Steen-Larsen, H.C.; Field, R.D.; Worden, J.; Risi, C.; Schneider, M. Stable isotopes in atmospheric water vapor and applications to the hydrologic cycle. Rev. Geophys. 2016, 54, 809–865. [Google Scholar] [CrossRef] [PubMed]
- Liu, C.; Wu, Y.; Wang, B.; Zhao, C.Y.; Bao, H. Effect of atmospheric water vapor on radiative cooling performance of different surfaces. Sol. Energy 2019, 183, 218–225. [Google Scholar] [CrossRef]
- Simmonds, I.; Bi, D.; Hope, P. Atmospheric water vapor flux and its association with rainfall overChina in summer. J. Clim. 1999, 12, 1353–1367. [Google Scholar] [CrossRef]
- Ross, R.J.; Elliott, W.P. Tropospheric water vapor climatology and trends over North America: 1973–1993. J. Clim. 1996, 9, 3561–3574. [Google Scholar] [CrossRef]
- Bengtsson, L.; Hagemann, S.; Hodges, K.I. Can climate trends be calculated from reanalysis data? J. Geophys. Res. Atmos. 2004, 109, D11111. [Google Scholar] [CrossRef]
- Nilsson, T.; Elgered, G. Long-term trends in the atmospheric water vapor content estimated from ground-based GPS data. J. Geophys. Res. Atmos. 2008, 113, D19101. [Google Scholar] [CrossRef]
- Gao, B.C.; Kaufman, Y.J. Water vapor retrievals using Moderate Resolution Imaging Spectroradiometer (MODIS) near-infrared channels. J. Geophys. Res. Atmos. 2003, 108, 4839. [Google Scholar] [CrossRef]
- Zhang, X.; Wie, T.; Song, C.; Hu, D.; Liang, T. Annual precipitation analysis and forecasting—Take the Zhengzhou as an example. Water Sci. Technol. Water Supply 2020, 20, 1604–1616. [Google Scholar] [CrossRef]
- Kibunja, H.W.; Kihoro, J.M.; Orwa, G.O.; Yodah, W.O. Forecasting Precipitation Using SARIMA Model: A Case Study of Mt. Kenya Region; Mathematical Theory & Modeling: New York, NY, USA, 2014; Volume 4. [Google Scholar]
- Valipour, M. Long-term runoff study using SARIMA and ARIMA models in the United States. Meteorol. Appl. 2015, 22, 592–598. [Google Scholar] [CrossRef]
- Khaniani, A.S.; Nikraftar, Z.; Zakeri, S. Evaluation of MODIS Near-IR water vapor product over Iran using ground-based GPS measurements. Atmos. Res. 2020, 231, 104657. [Google Scholar] [CrossRef]
- Zhang, B.; Yao, Y. Precipitable water vapor fusion based on a generalized regression neural network. J. Geodesy 2021, 95, 36. [Google Scholar] [CrossRef]
- Huang, L.; Mo, Z.; Xie, S.; Liu, L.; Chen, J.; Kang, C.; Wang, S. Spatiotemporal characteristics of GNSS-derived precipitable water vapor during heavy rainfall events in Guilin, China. Satell. Navig. 2021, 2, 13. [Google Scholar] [CrossRef]
- Zhang, L.; Ding, M.H.; Bian, L.G.; Jian, L. Validation of AIRS temperature and ozone profiles over Antarctica. Chin. J. Geophys. 2020, 63, 1318–1331. [Google Scholar] [CrossRef]
- Heng, Z.; Jiang, X. An Assessment of the Temperature and Humidity of Atmospheric Infrared Sounder (AIRS) v6 Profiles Using Radiosonde Data in the Lee of the Tibetan Plateau. Atmosphere 2019, 10, 394. [Google Scholar] [CrossRef]
- Liu, J.; Hagan, D.; Liu, Y. Global Land Surface Temperature Change (2003–2017) and Its Relationship with Climate Drivers: AIRS, MODIS, and ERA5-Land Based Analysis. Remote Sens. 2020, 13, 44. [Google Scholar] [CrossRef]
- Lu, N.; Qin, J.; Gao, Y.; Yang, K. Trends and variability in atmospheric precipitable water over the Tibetan Plateau for 2000–2010. Int. J. Climatol. 2015, 35, 1394–1404. [Google Scholar] [CrossRef]
- Ali, R.; Kuriqi, A.; Abubaker, S.; Kisi, O. Long-term trends and seasonality detection of the observed flow in Yangtze River using Mann-Kendall and Sen’s innovative trend method. Water 2019, 11, 1855. [Google Scholar] [CrossRef]
- Ma, X.; Yao, Y.; Zhang, B.; He, C. Retrieval of high spatial resolution precipitable water vapor maps using heterogeneous earth observation data. Remote Sens. Environ. 2022, 278, 113100. [Google Scholar] [CrossRef]
- Tian, X.; Tang, C.; Wu, X.; Yang, J.; Zhao, F.; Liu, D. The global spatial-temporal distribution and EOF analysis of AOD based on MODIS data during 2003–2021. Atmos. Environ. 2023, 302, 119722. [Google Scholar] [CrossRef]
- Ma, Q.; Zhang, Q.; Wang, Q.; Yuan, X.; Yuan, R.; Luo, C. A comparative study of EOF and NMF analysis on downward trend of AOD over China from 2011 to 2019. Environ. Pollut. 2021, 288, 117713. [Google Scholar] [CrossRef]
- Tu, M.; Zhang, W.; Bai, J.; Wu, D.; Liang, H.; Lou, Y. Spatio-Temporal Variations of Precipitable Water Vapor and Horizontal Tropospheric Gradients from GPS during Typhoon Lekima. Remote Sens. 2021, 13, 4082. [Google Scholar] [CrossRef]
- Yu, Y.; Zhang, H.; Singh, V.P. Forward prediction of runoff data in data-scarce basins with an improved ensemble empirical mode decomposition (EEMD) model. Water 2018, 10, 388. [Google Scholar] [CrossRef]
- Schwarz, K.P.; Sideris, M.G.; Forsberg, R. The use of FFT techniques in physical geodesy. Geophys. J. Int. 1990, 100, 485–514. [Google Scholar] [CrossRef]
- Donnelly, D.; Rust, B. The fast Fourier transform for experimentalists. Comput. Sci. Eng. 2005, 7, 71. [Google Scholar] [CrossRef]
- ArunKumar, K.E.; Kalaga, D.V.; Kumar, C.M.S.; Chilkoor, G.; Kawaji, M.; Brenza, T.M. Forecasting the dynamics of cumulative COVID-19 cases (confirmed, recovered and deaths) for top-16 countries using statistical machine learning models: Auto-Regressive Integrated Moving Average (ARIMA) and Seasonal Auto-Regressive Integrated Moving Average (SARIMA). Appl. Soft Comput. 2021, 103, 107161. [Google Scholar] [CrossRef]
- Dubey, A.K.; Kumar, A.; García-Díaz, V.; Sharma, A.K.; Kanhaiya, K. Study and analysis of SARIMA and LSTM in forecasting time series data. Sustain. Energy Technol. Assess. 2021, 47, 101474. [Google Scholar] [CrossRef]
- Tratar, L.F.; Strmčnik, E. The comparison of Holt–Winters method and Multiple regression method: A case study. Energy 2016, 109, 266–276. [Google Scholar] [CrossRef]
- Trull, O.; García-Díaz, J.C.; Troncoso, A. Initialization methods for multiple seasonal Holt–Winters forecasting models. Mathematics 2020, 8, 268. [Google Scholar] [CrossRef]
- Liu, K.; Lin, T.; Zhong, T.; Ge, X.; Jiang, F.; Zhang, X. New methods based on a genetic algorithm back propagation (GABP) neural network and general regression neural network (GRNN) for predicting the occurrence of trihalomethanes in tap water. Sci. Total Environ. 2023, 870, 161976. [Google Scholar] [CrossRef] [PubMed]
- Zhai, P.; Eskridge, R.E. Atmospheric water vapor over China. J. Clim. 1997, 10, 2643–2652. [Google Scholar] [CrossRef]
- Samuels-Crow, K.E.; Galewsky, J.; Hardy, D.R.; Sharp, Z.D.; Worden, J.; Braun, C. Upwind convective influences on the isotopic composition of atmospheric water vapor over the tropical Andes. J. Geophys. Res. Atmos. 2014, 119, 7051–7063. [Google Scholar] [CrossRef]
- Rangwala, I.; Miller, J.R.; Xu, M. Warming in the Tibetan Plateau: Possible influences of the changes in surface water vapor. Geophys. Res. Lett. 2009, 36, L06703. [Google Scholar] [CrossRef]
- Liu, X.; Chen, B. Climatic warming in the Tibetan Plateau during recent decades. Int. J. Climatol. J. R. Meteorol. Soc. 2000, 20, 1729–1742. [Google Scholar] [CrossRef]
- Lee, X. Water vapor density effect on measurements of trace gas mixing ratio and flux with a massflow controller. J. Geophys. Res. Atmos. 2000, 105, 17807–17810. [Google Scholar] [CrossRef]
- Schneider, T.; O’Gorman, P.A.; Levine, X.J. Water vapor and the dynamics of climate changes. Rev. Geophys. 2010, 48, RG3001. [Google Scholar] [CrossRef]
- Randel, D.L.; Haar, T.H.V.; Ringerud, M.A.; Stephens, G.L.; Greenwald, T.J.; Combs, C.L. A new global water vapor dataset. Bull. Am. Meteorol. Soc. 1996, 77, 1233–1246. [Google Scholar] [CrossRef]
- Schröder, M.; Lockhoff, M.; Shi, L.; August, T.; Bennartz, R.; Brogniez, H.; Calbet, X.; Fell, F.; Forsythe, J.; Gambacorta, A.; et al. The GEWEX water vapor assessment: Overview and introduction to results and recommendations. Remote Sens. 2019, 11, 251. [Google Scholar] [CrossRef]
- Ricciotti, J.A.; Cordeira, J.M. Summarizing relationships among landfalling atmospheric rivers, integrated water vapor transport, and California watershed precipitation 1982–2019. J. Hydrometeorol. 2022, 23, 1439–1454. [Google Scholar] [CrossRef]
- Ruiz-Vásquez, M.; Arias, P.A.; Martínez, J.A.; Espinoza, J.C. Effects of Amazon basin deforestation on regional atmospheric circulation and water vapor transport towards tropical South America. Clim. Dyn. 2020, 54, 4169–4189. [Google Scholar] [CrossRef]
- Agudelo, J.; Arias, P.A.; Vieira, S.C.; Martinez, J.A. Influence of longer dry seasons in the Southern Amazon on patterns of water vapor transport over northern South America and the Caribbean. Clim. Dyn. 2019, 52, 2647–2665. [Google Scholar] [CrossRef]
- Abbasimehr, H.; Shabani, M.; Yousefi, M. An optimized model using LSTM network for demand forecasting. Comput. Ind. Eng. 2020, 143, 106435. [Google Scholar] [CrossRef]
- Guo, W.; Liu, T.; Dai, F.; Xu, P. An improved whale optimization algorithm for forecasting water resources demand. Appl. Soft Comput. 2020, 86, 105925. [Google Scholar] [CrossRef]
- Ubah, J.I.; Orakwe, L.C.; Ogbu, K.N.; Awu, J.I.; Ahaneku, I.E.; Chukwuma, E.C. Forecasting water quality parameters using artificial neural network for irrigation purposes. Sci. Rep. 2021, 11, 24438. [Google Scholar] [CrossRef] [PubMed]
- Negash, B.M.; Yaw, A.D. Artificial neural network based production forecasting for a hydrocarbon reservoir under water injection. Pet. Explor. Dev. 2020, 47, 383–392. [Google Scholar] [CrossRef]
Figure 1.
Comparison and correlation analysis between MODIS and AIRS satellite data. (a) Time series diagram; (b) regression analysis chart.
Figure 1.
Comparison and correlation analysis between MODIS and AIRS satellite data. (a) Time series diagram; (b) regression analysis chart.
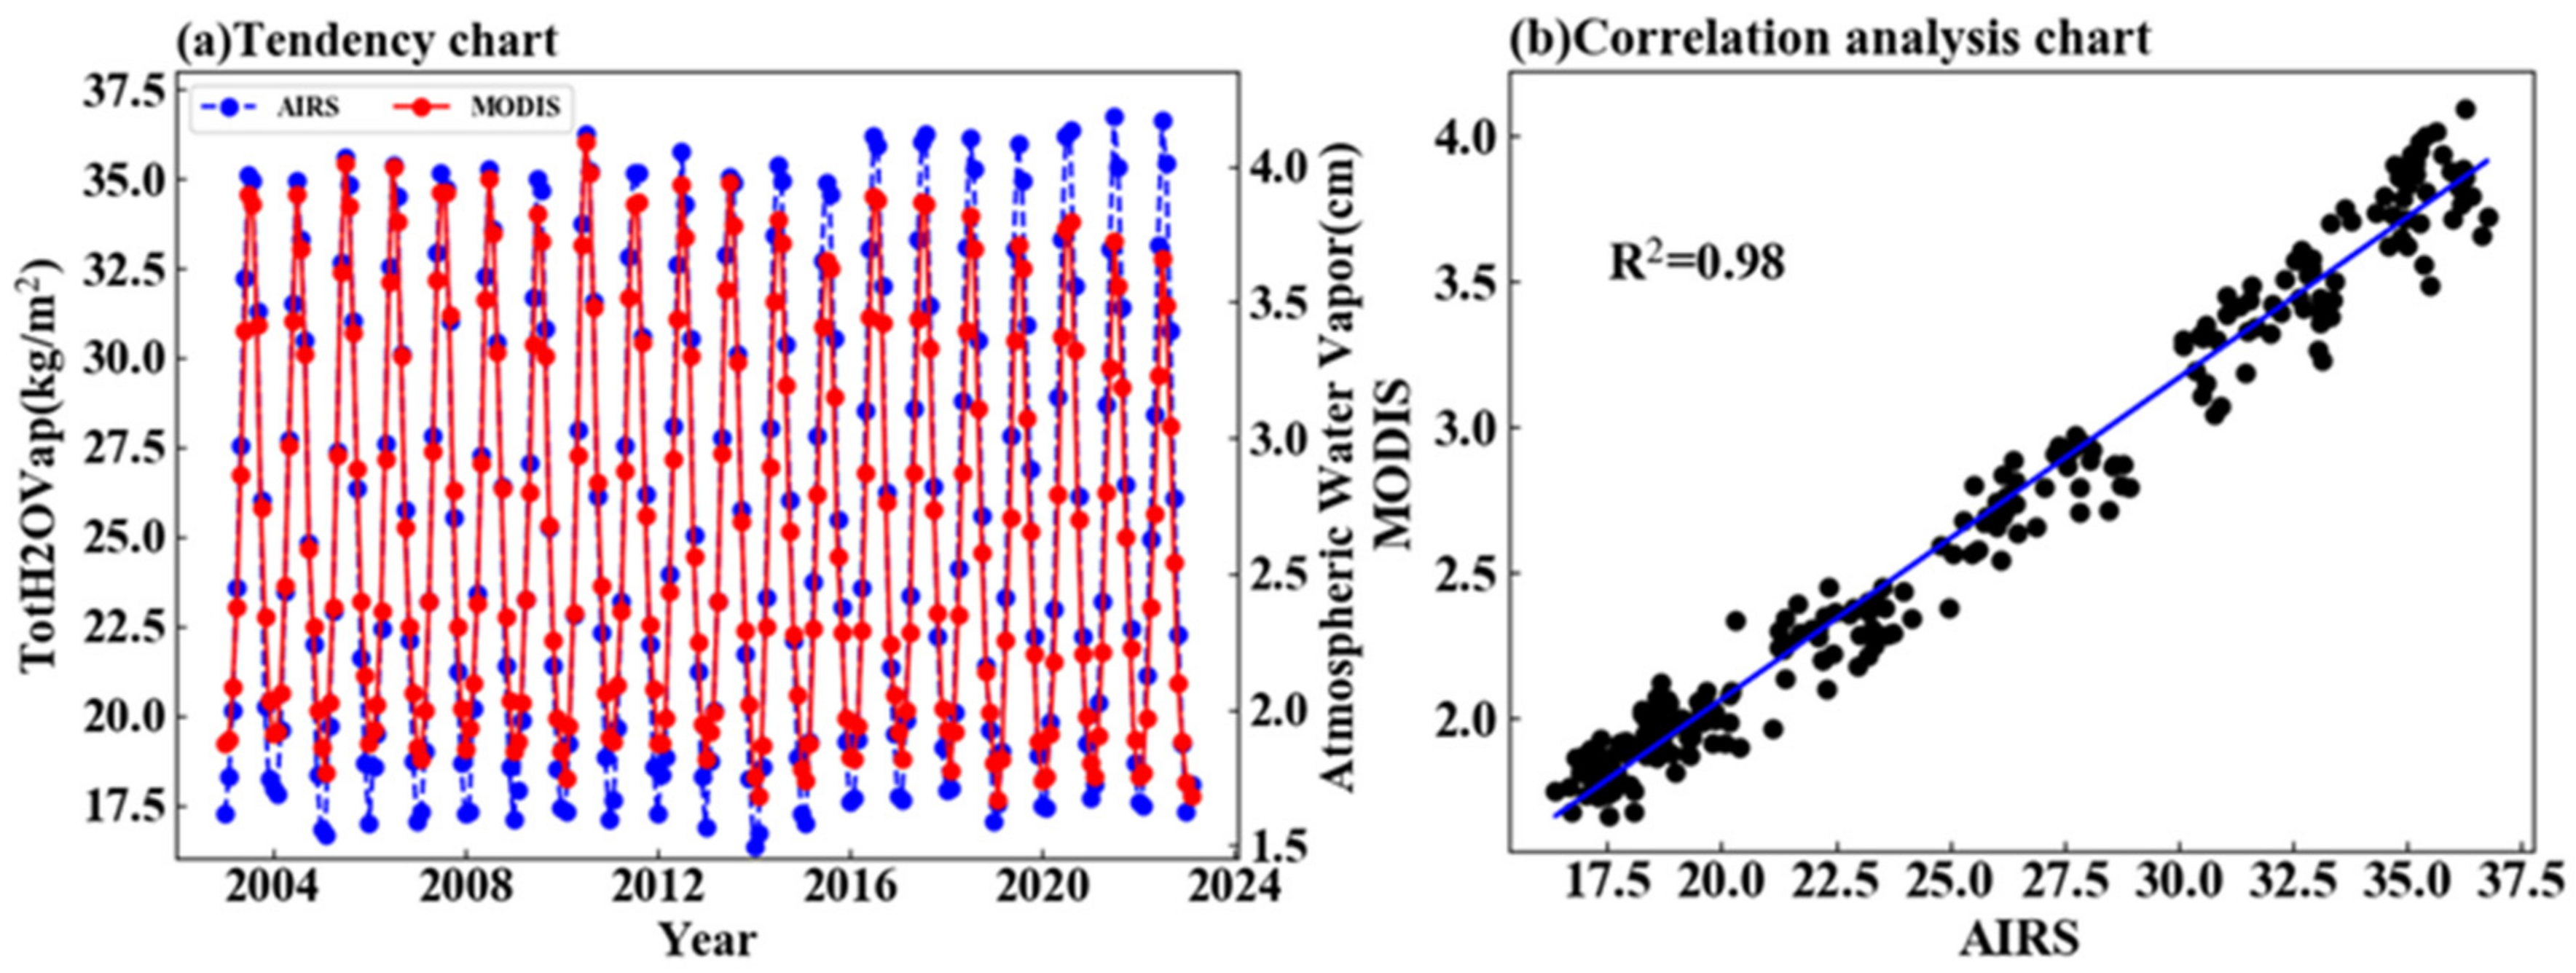
Figure 2.
Research methodology.
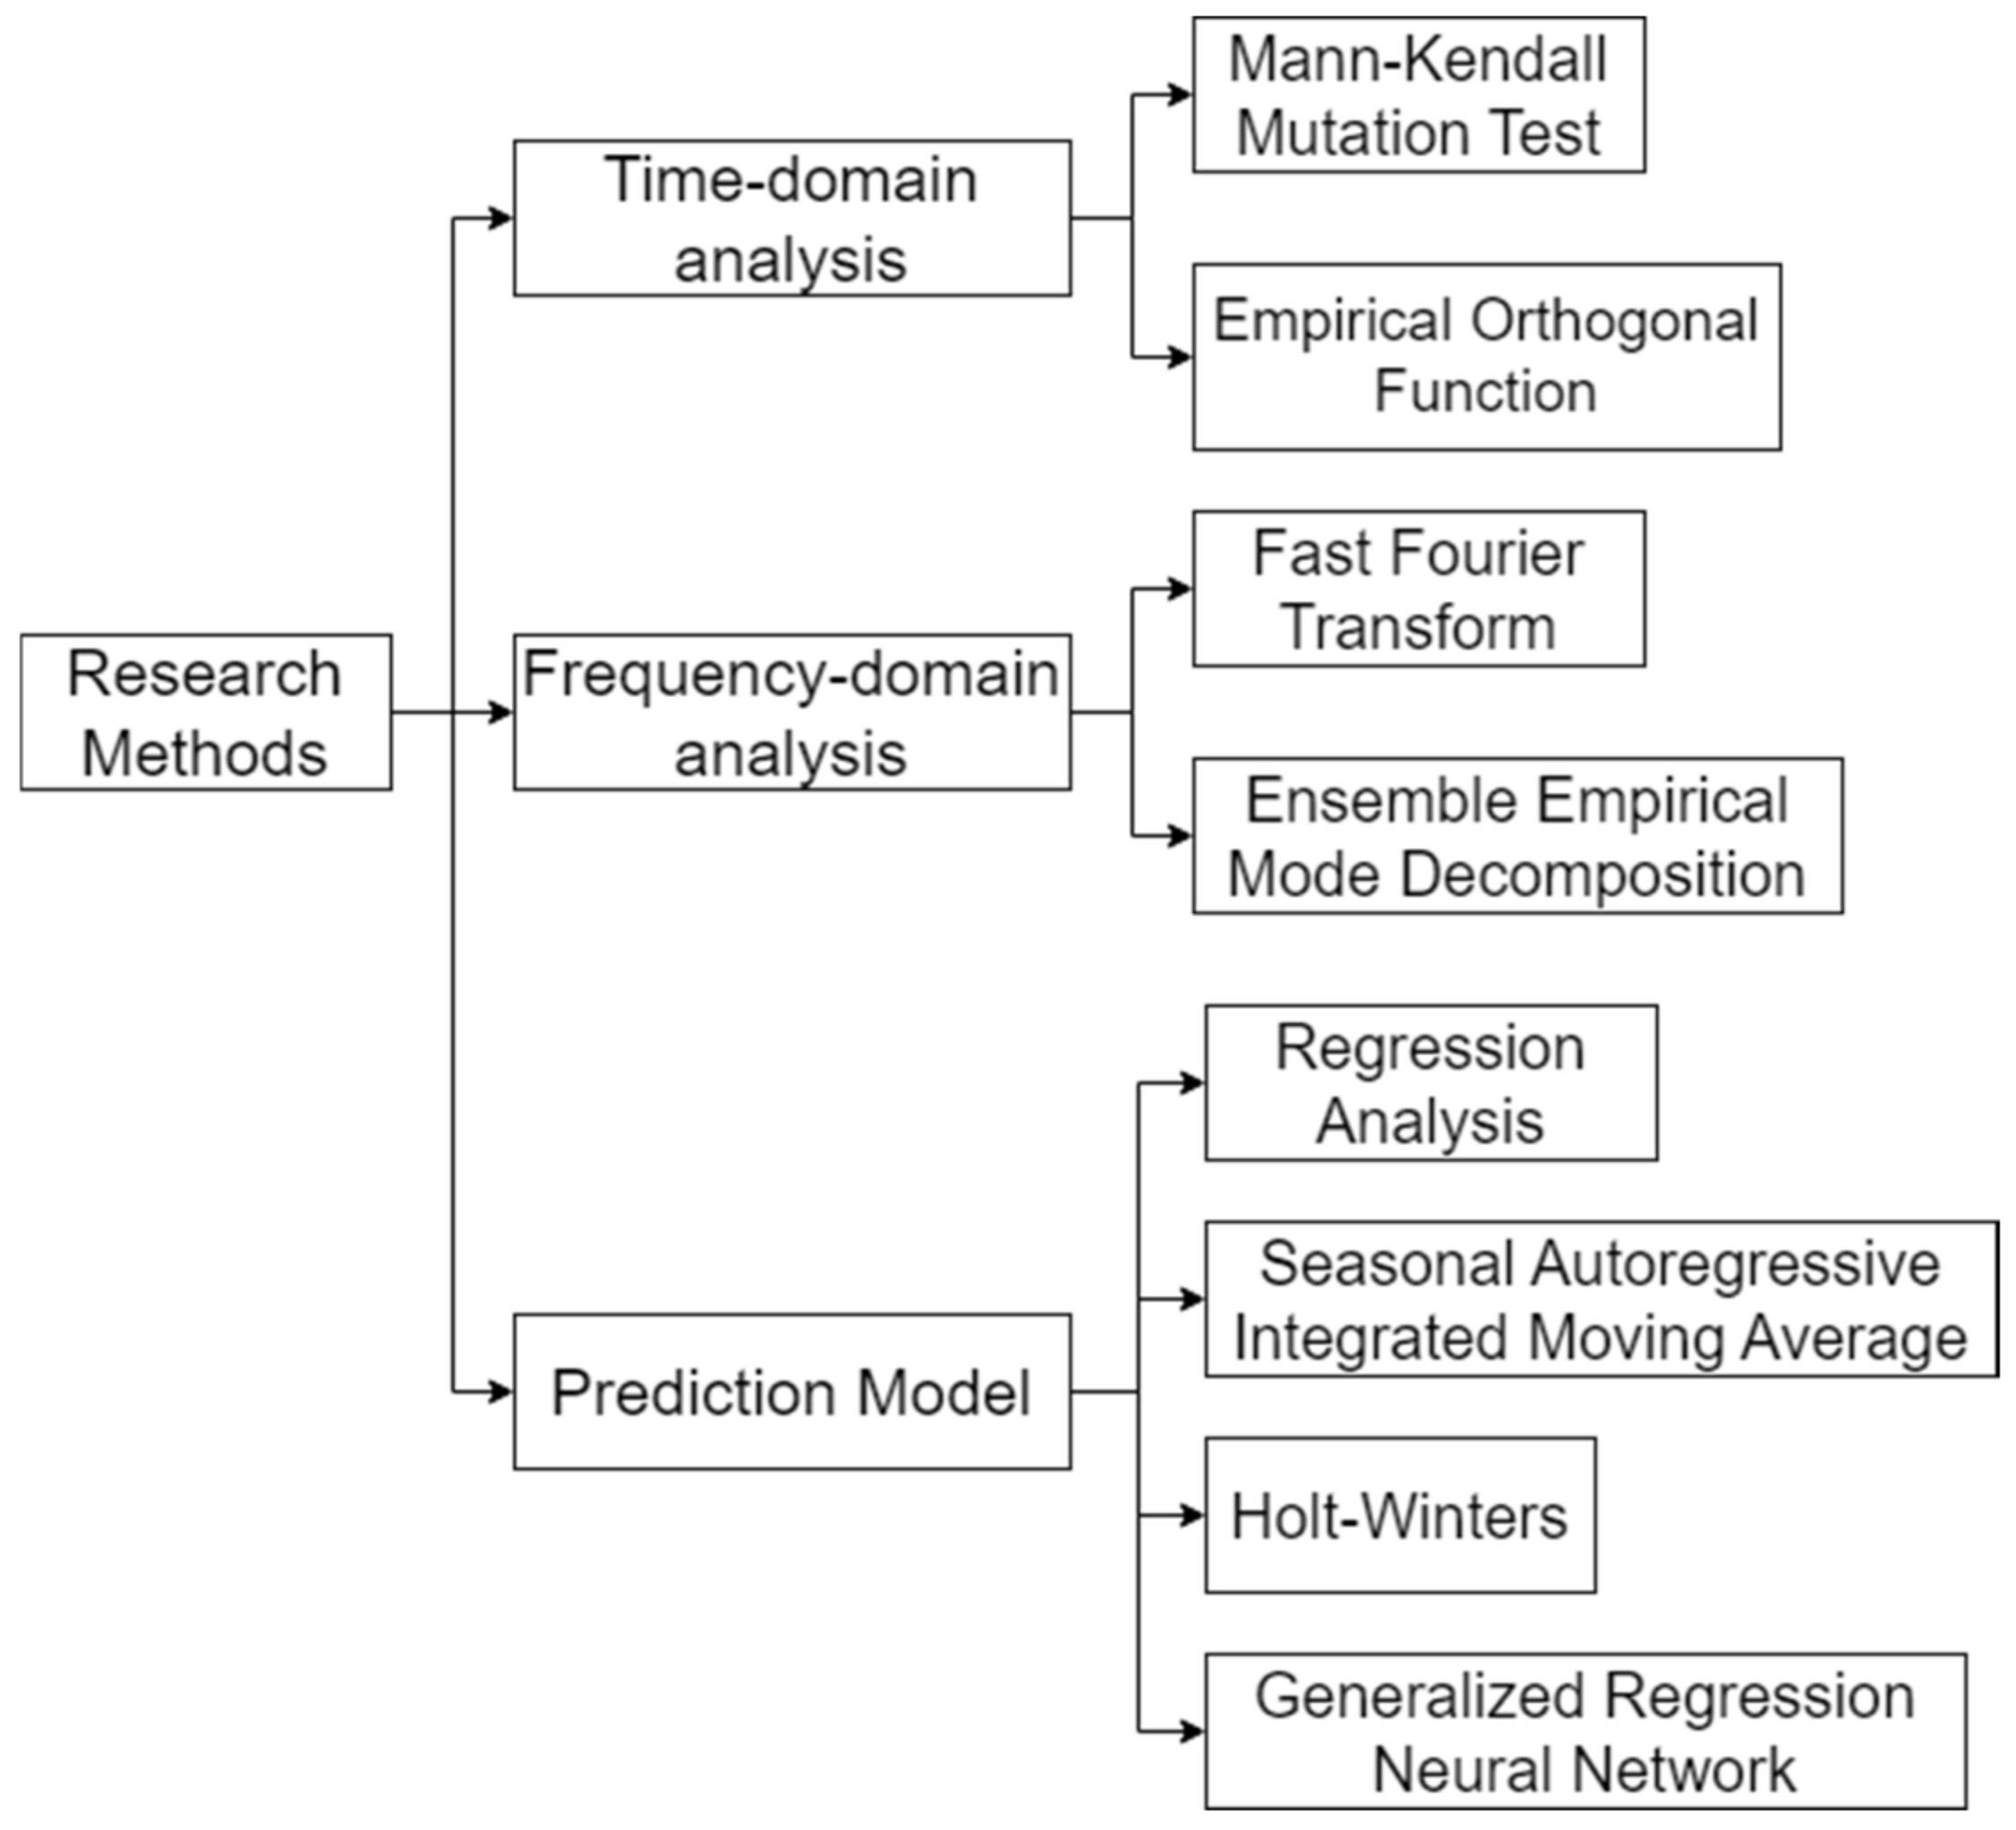
Figure 3.
Inter-annual variation trend of latitude and longitude of AWV, (a) longitudinal distribution; (b) latitudinal distribution.
Figure 3.
Inter-annual variation trend of latitude and longitude of AWV, (a) longitudinal distribution; (b) latitudinal distribution.

Figure 4.
AWV annual mean change and MK analysis, (a) annual mean change; (b) annual mean MK analysis.
Figure 4.
AWV annual mean change and MK analysis, (a) annual mean change; (b) annual mean MK analysis.

Figure 5.
Inter-annual variation trend of AWV in different seasons in East Asia, (a) spring; (b) summer; (c) autumn; (d) winter.
Figure 5.
Inter-annual variation trend of AWV in different seasons in East Asia, (a) spring; (b) summer; (c) autumn; (d) winter.
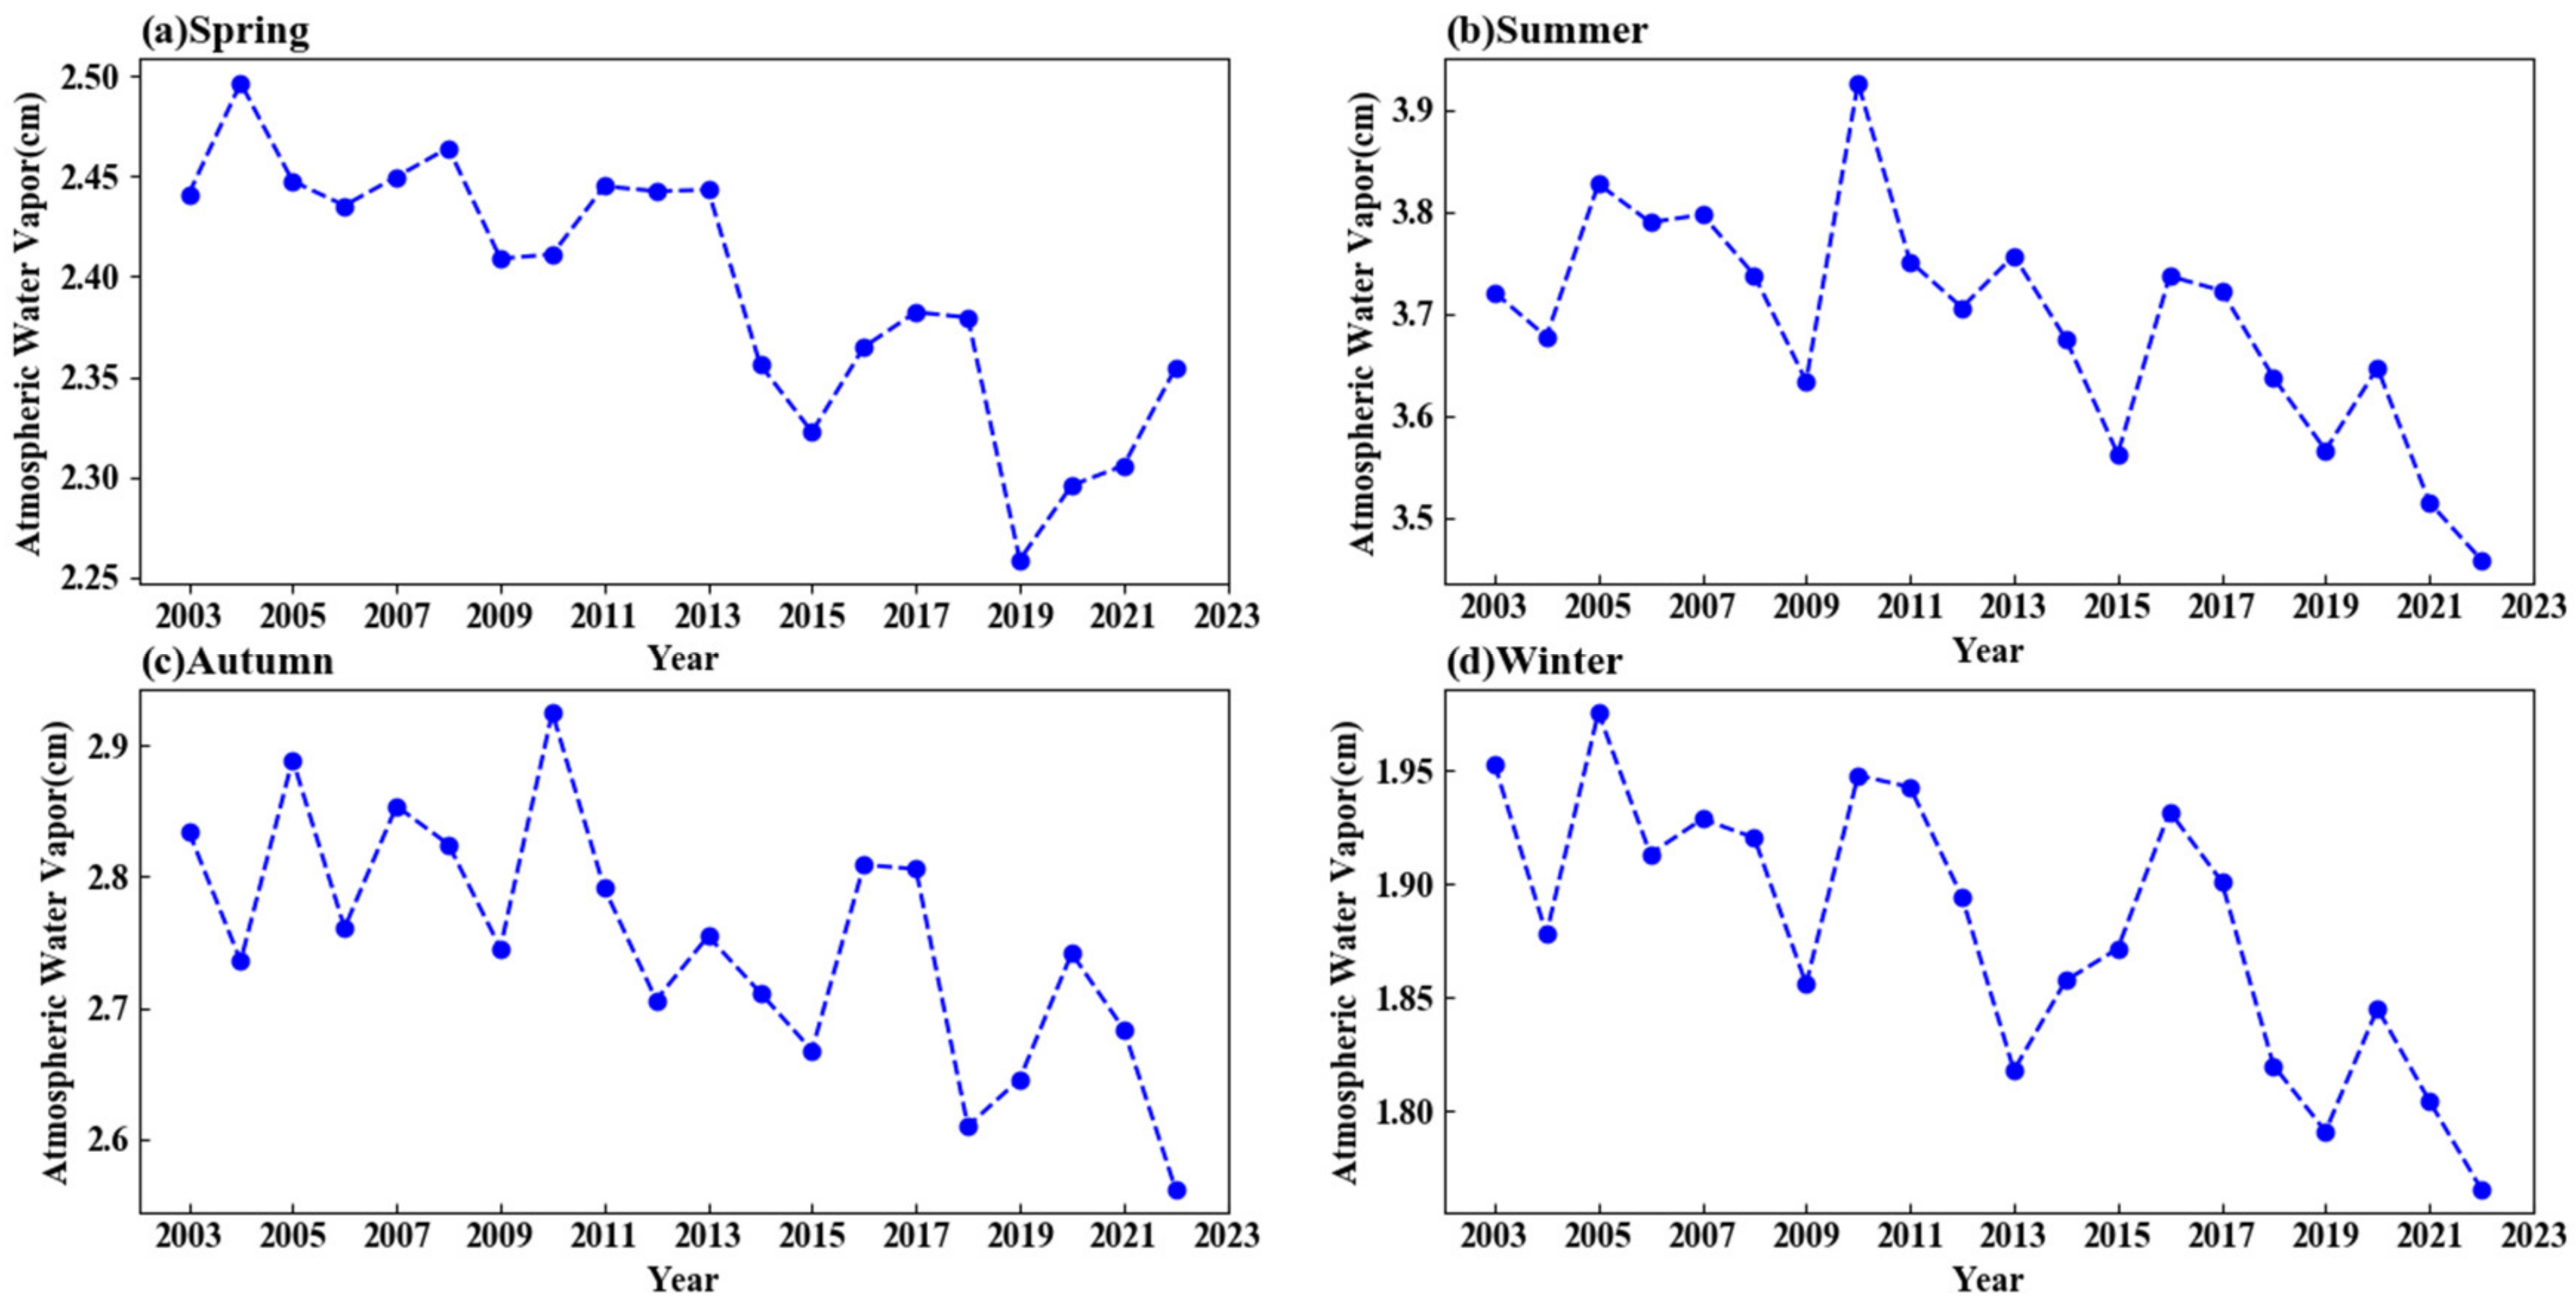
Figure 6.
Four seasons MK test analysis, (a) spring; (b) summer; (c) autumn; (d) winter.
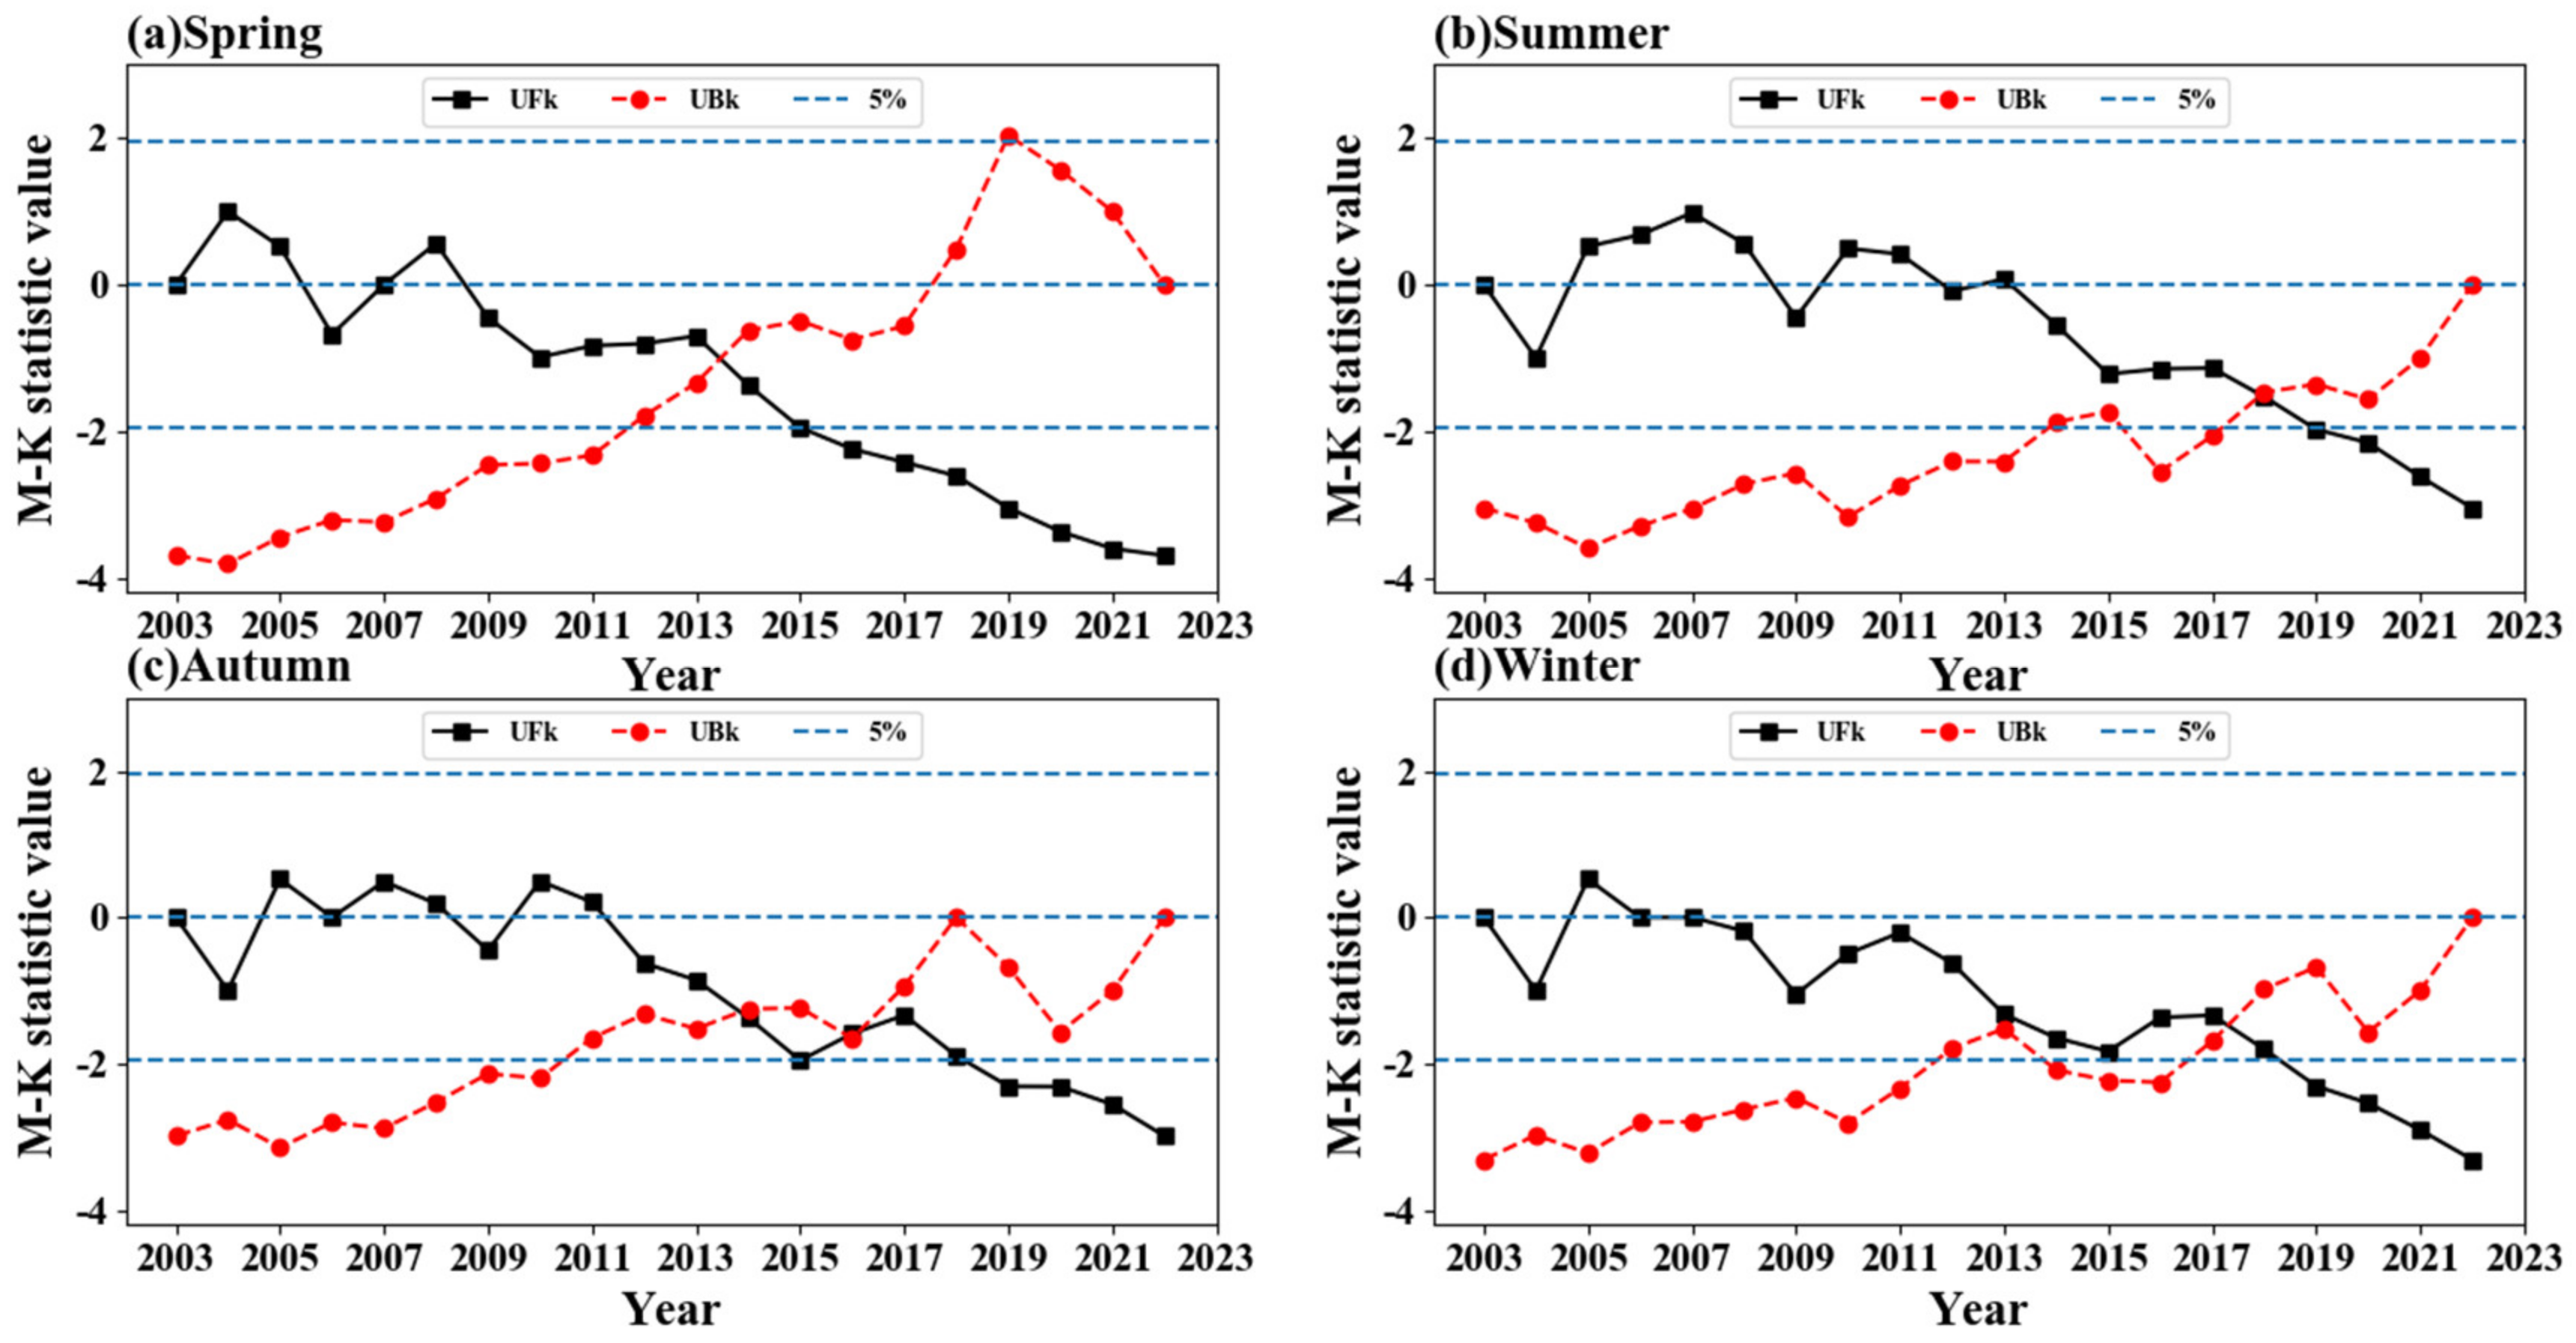
Figure 7.
Spatial distribution of AWV seasonal variations over East Asia from 2003 to 2022, (a) spring; (b) summer; (c) autumn; (d) winter.
Figure 7.
Spatial distribution of AWV seasonal variations over East Asia from 2003 to 2022, (a) spring; (b) summer; (c) autumn; (d) winter.
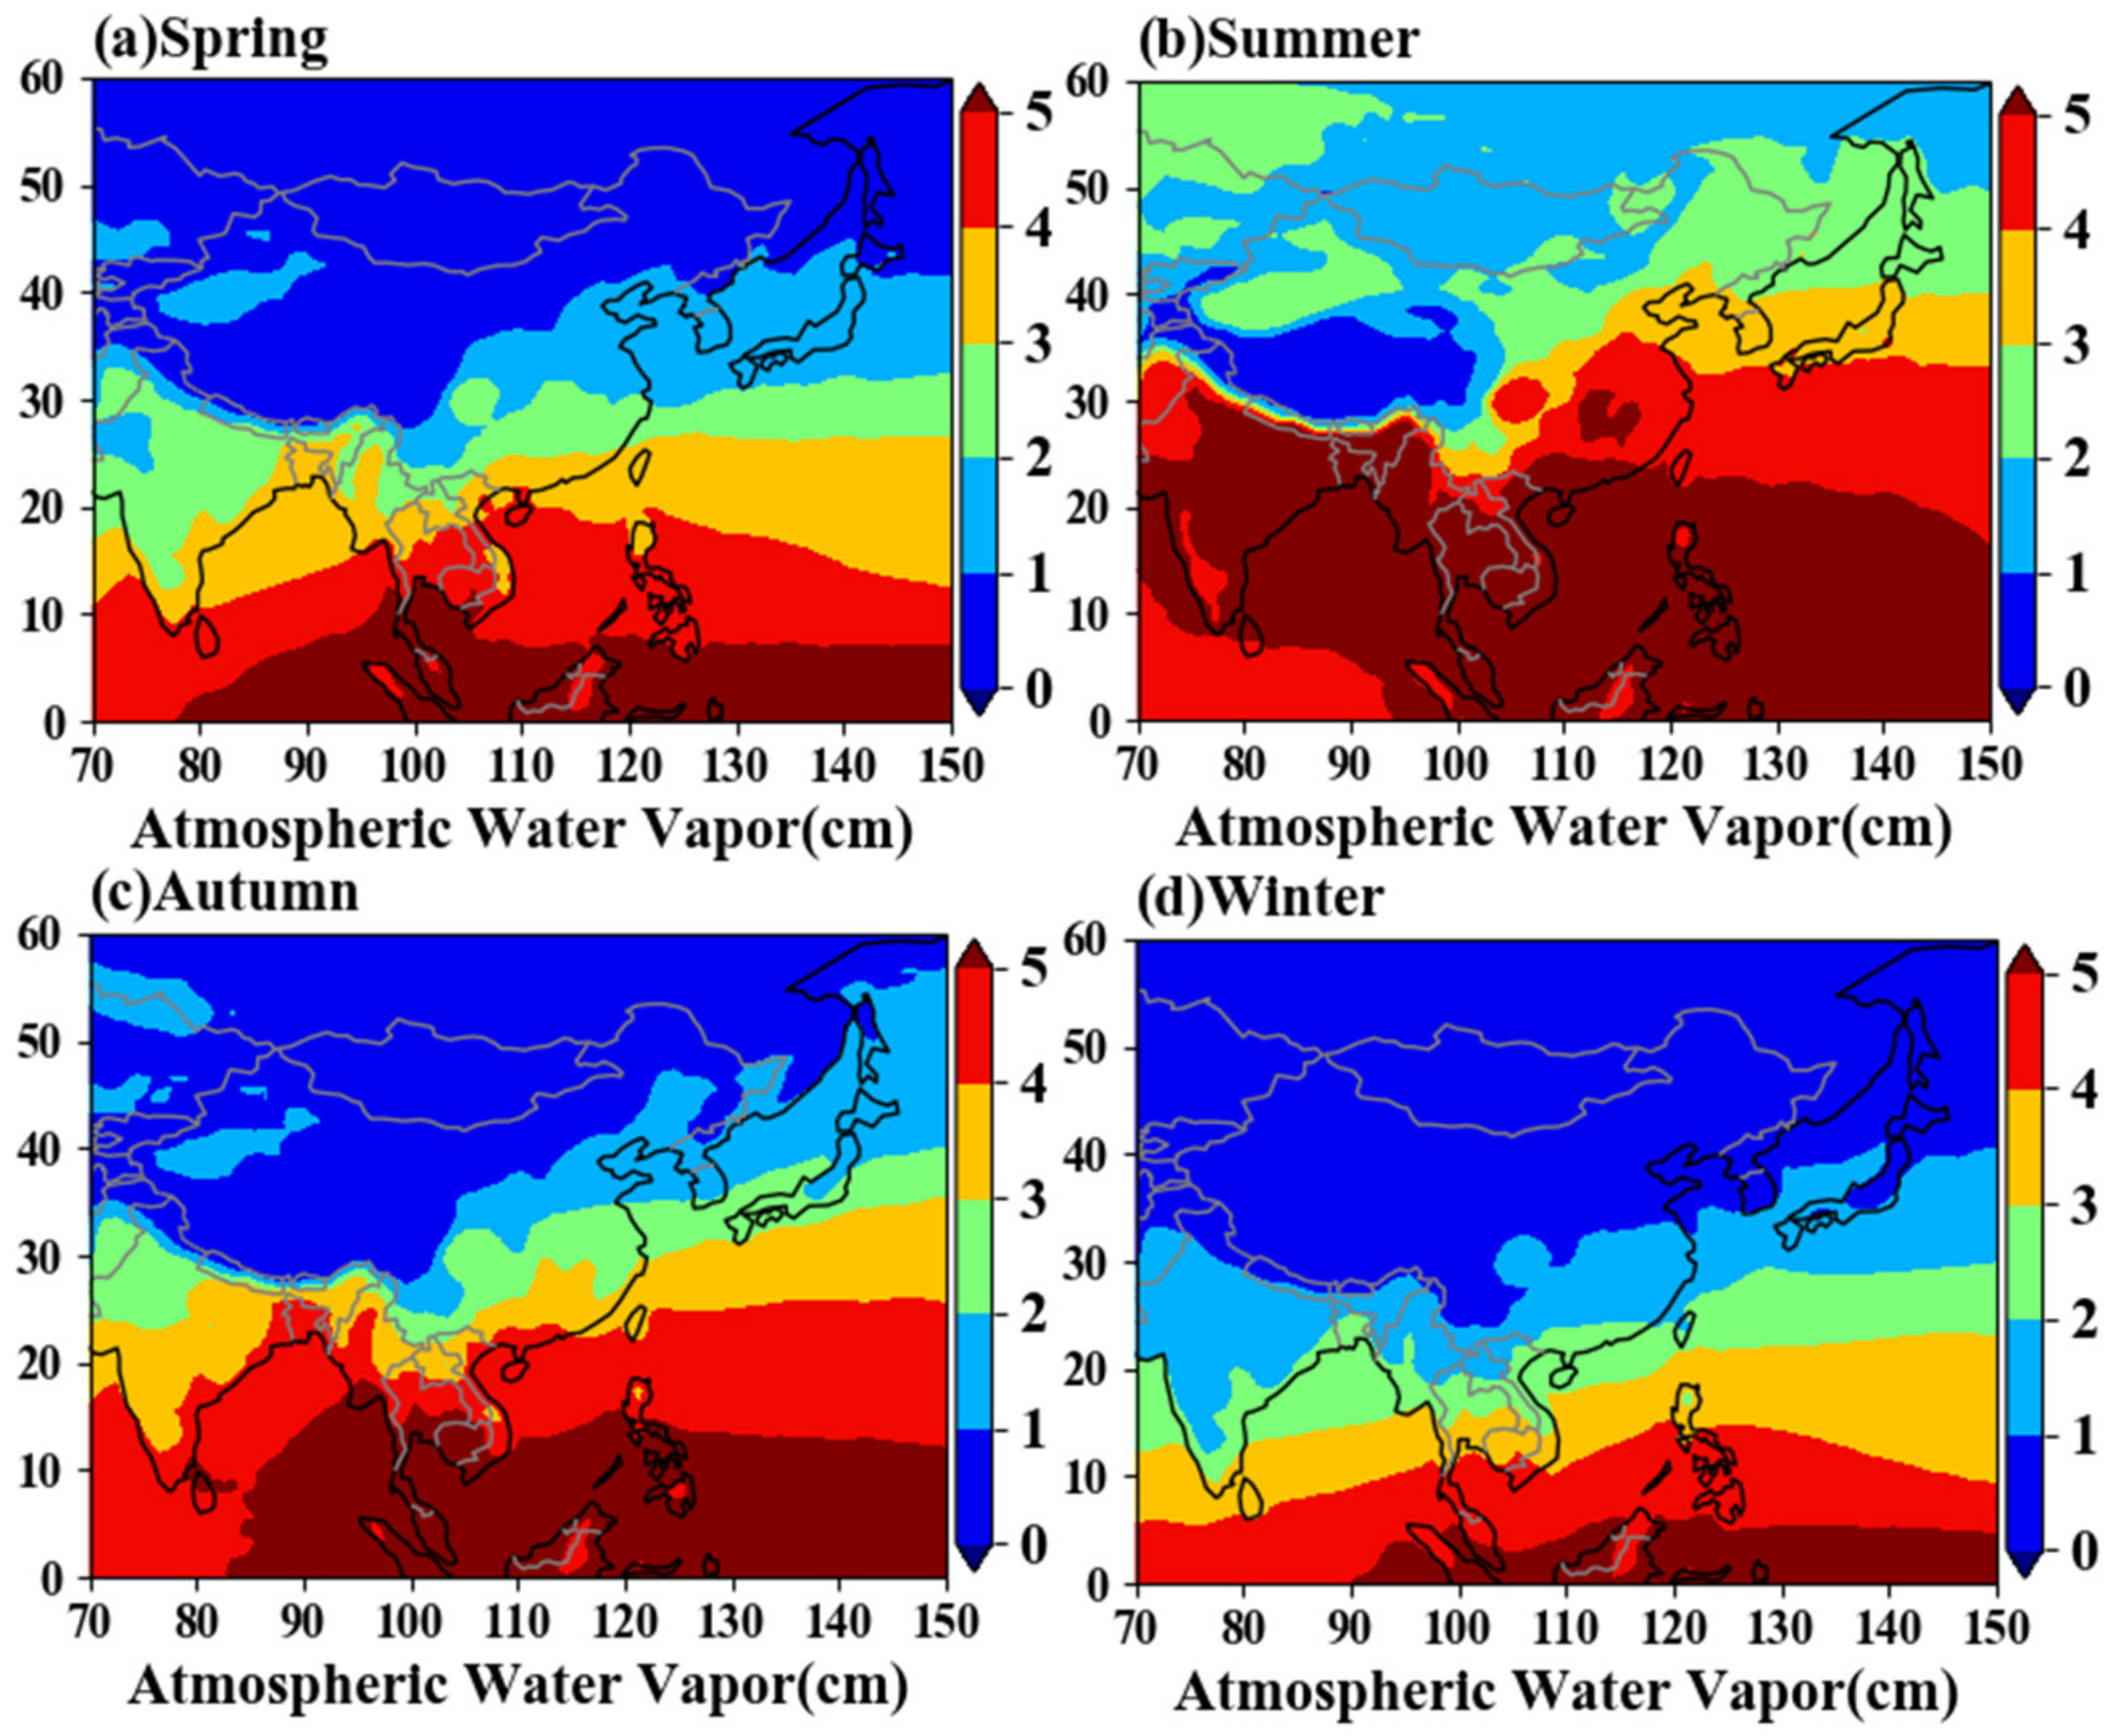
Figure 8.
Spatial distribution of AWV EOF over East Asia from 2003 to 2022, (a) EOF Model1; (b) EOF Model2; (c) EOF Model3.
Figure 8.
Spatial distribution of AWV EOF over East Asia from 2003 to 2022, (a) EOF Model1; (b) EOF Model2; (c) EOF Model3.
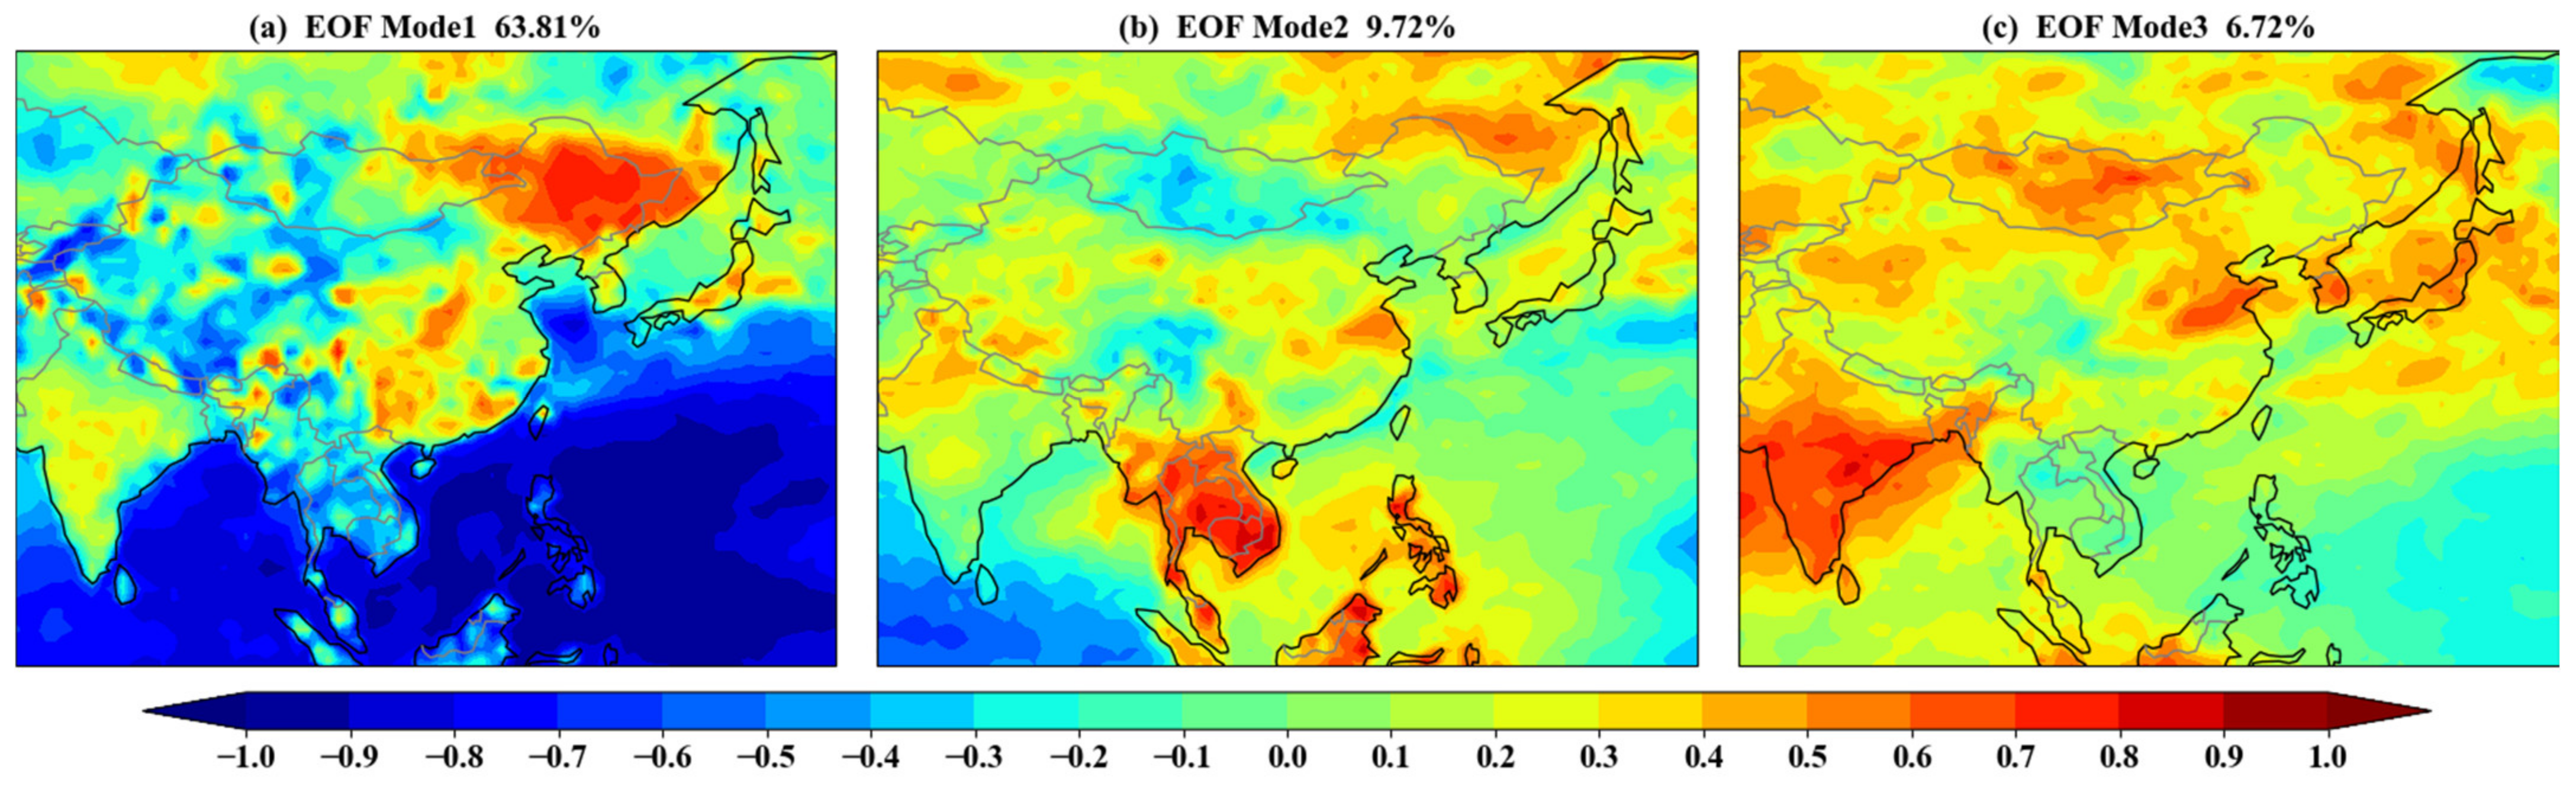
Figure 9.
Time coefficient diagram of AWV EOF in East Asia from 2003 to 2022, (a) EOF PC1; (b) EOF PC2; (c) EOF PC3.
Figure 9.
Time coefficient diagram of AWV EOF in East Asia from 2003 to 2022, (a) EOF PC1; (b) EOF PC2; (c) EOF PC3.
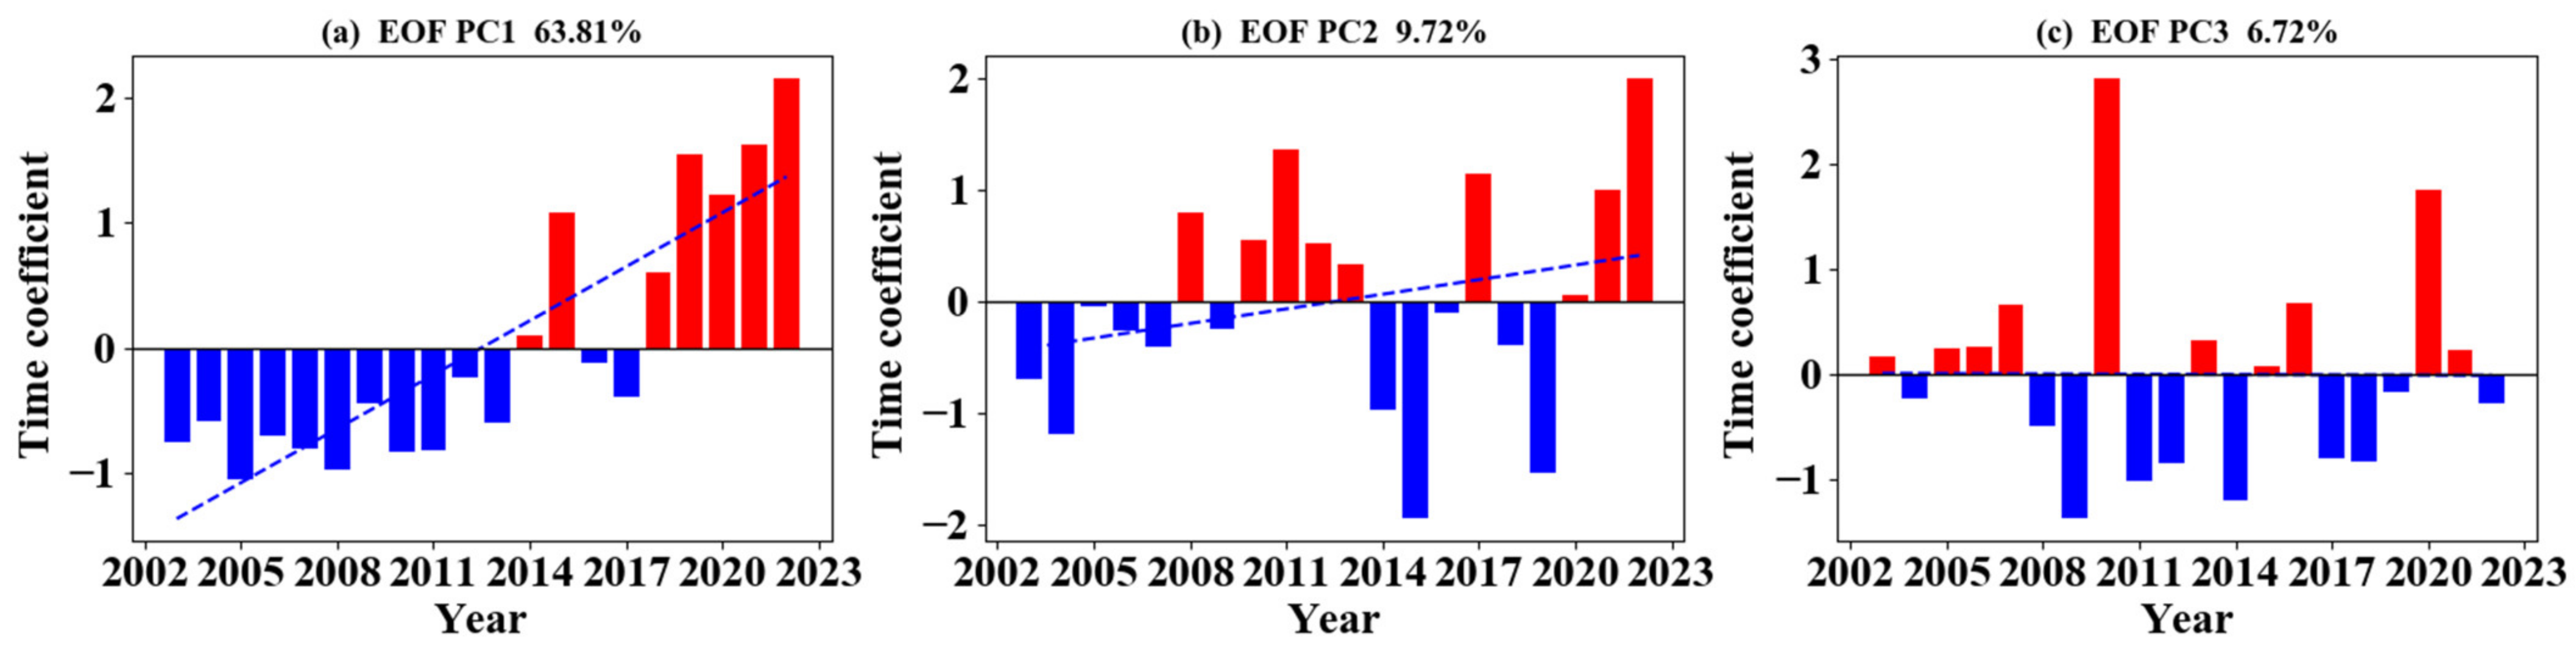
Figure 10.
EEMD decomposition of AWV time series in East Asia.

Figure 11.
FFT of AWV time series after filtering: (a,d) High-pass; (b,e) Low-pass; (c,f) Band-pass.
Figure 11.
FFT of AWV time series after filtering: (a,d) High-pass; (b,e) Low-pass; (c,f) Band-pass.
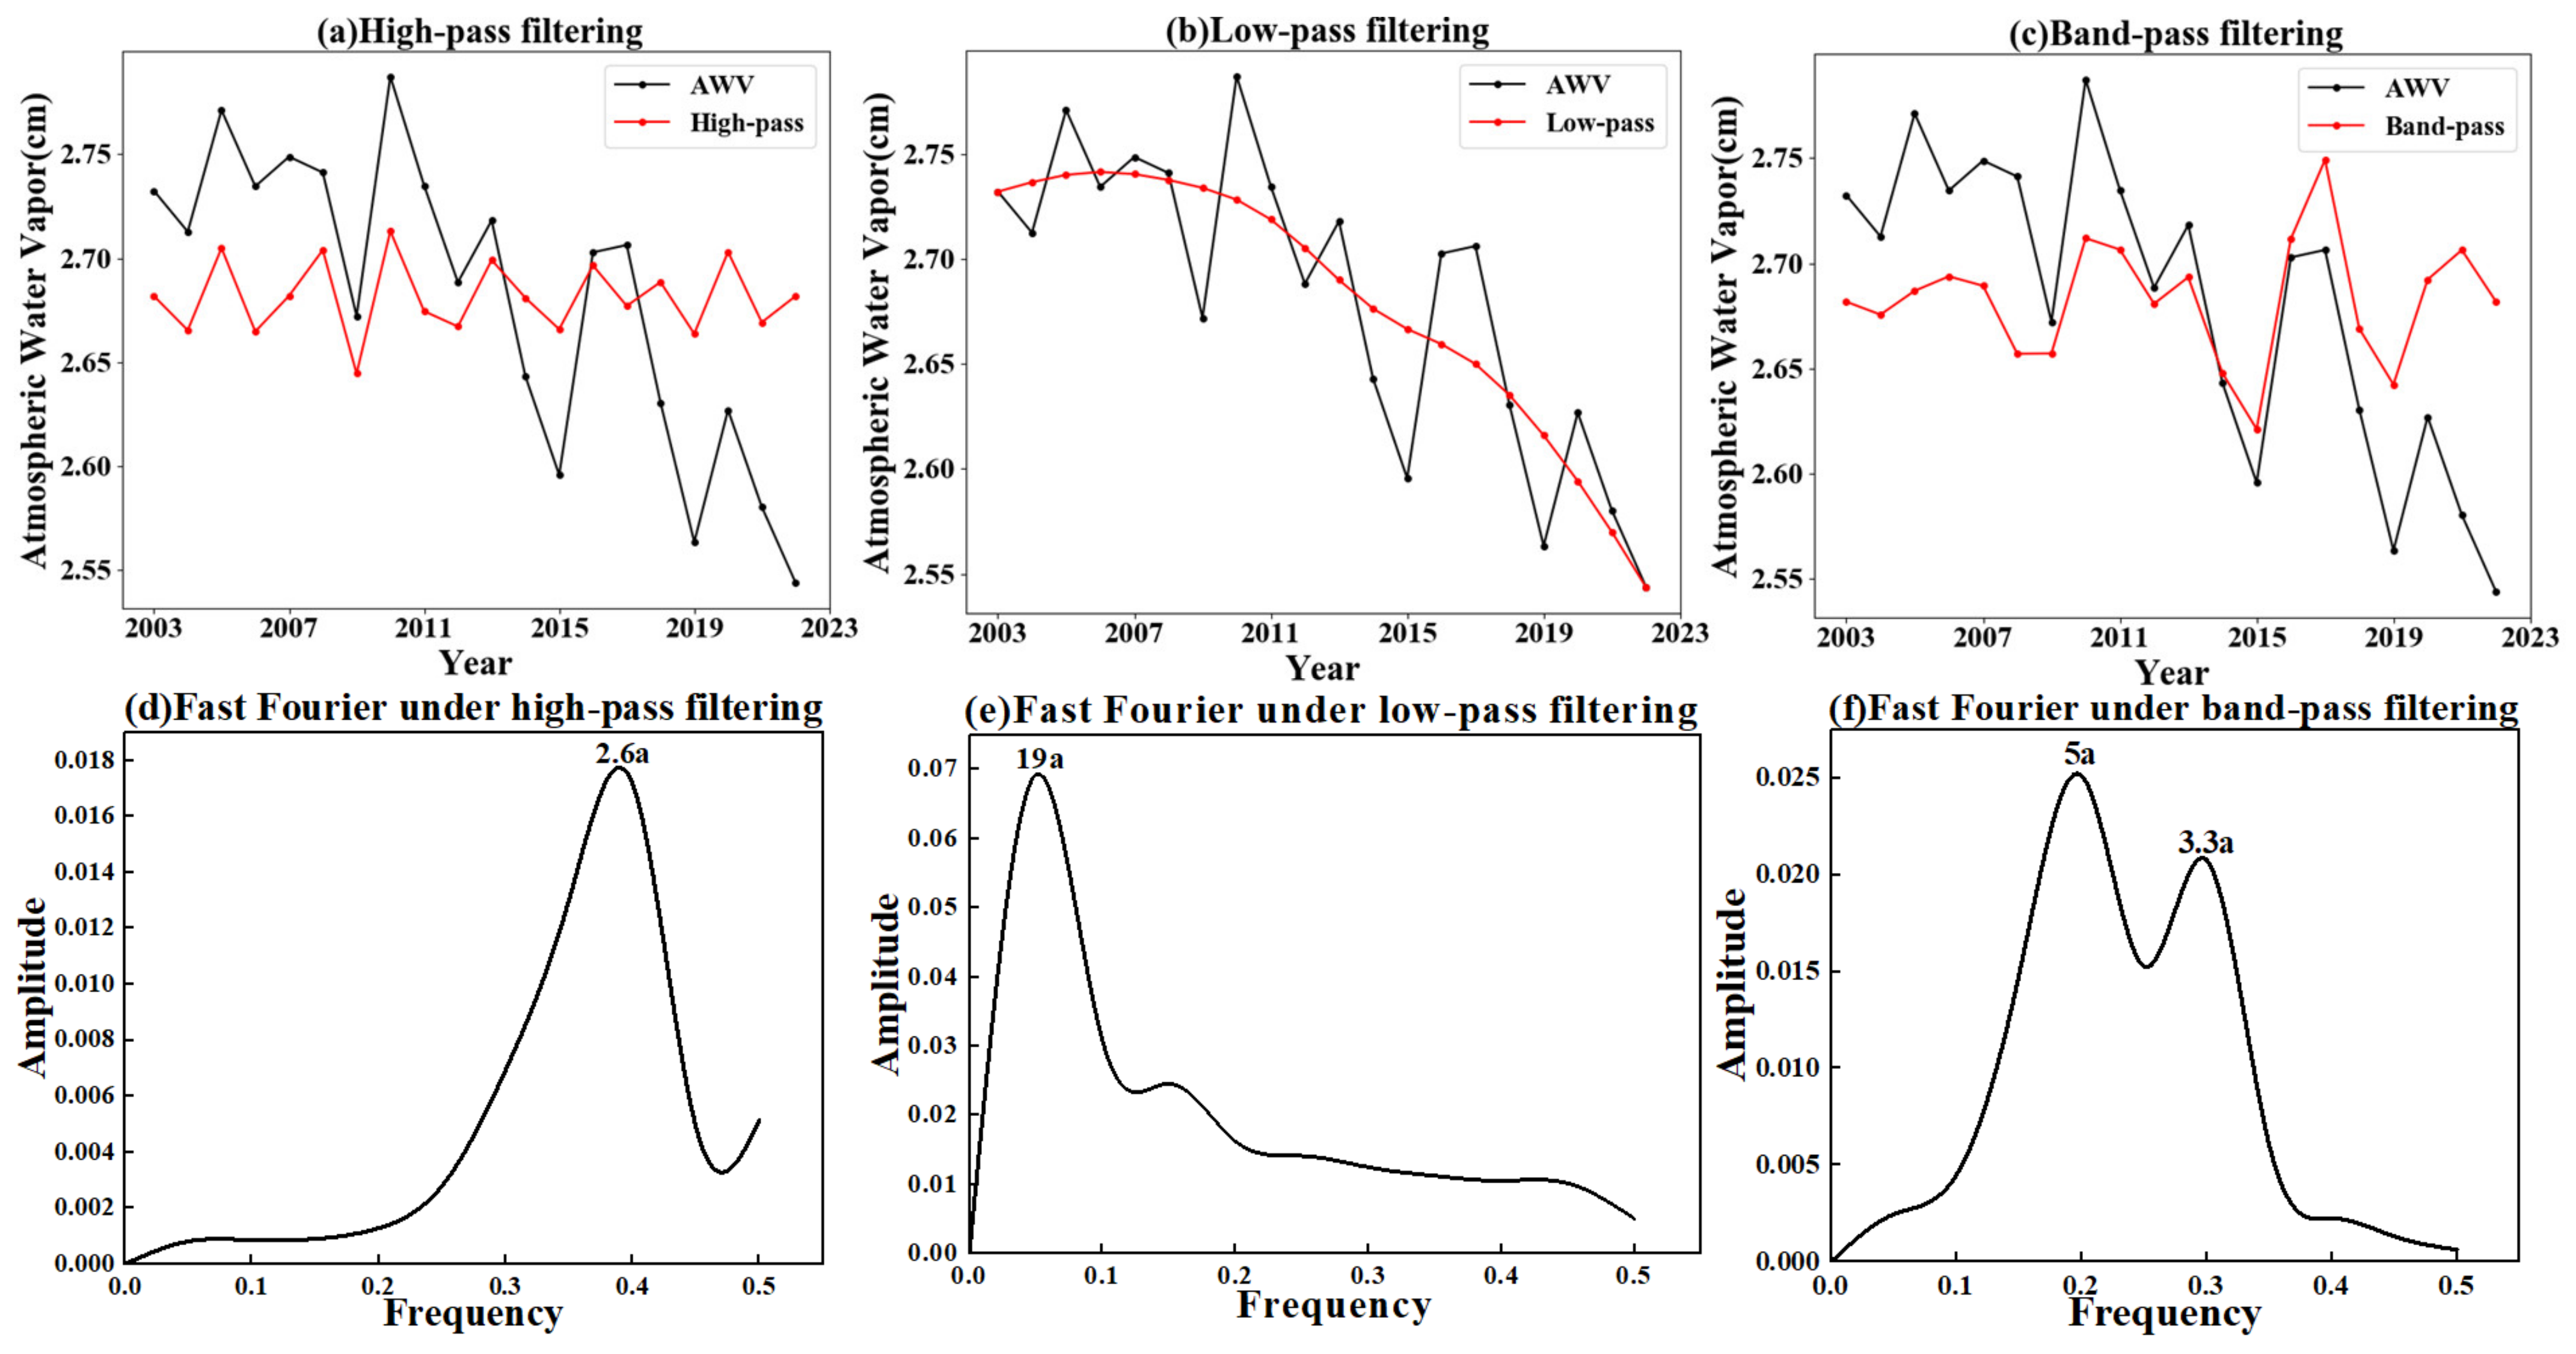
Figure 12.
Forecasting result of multiple regression.
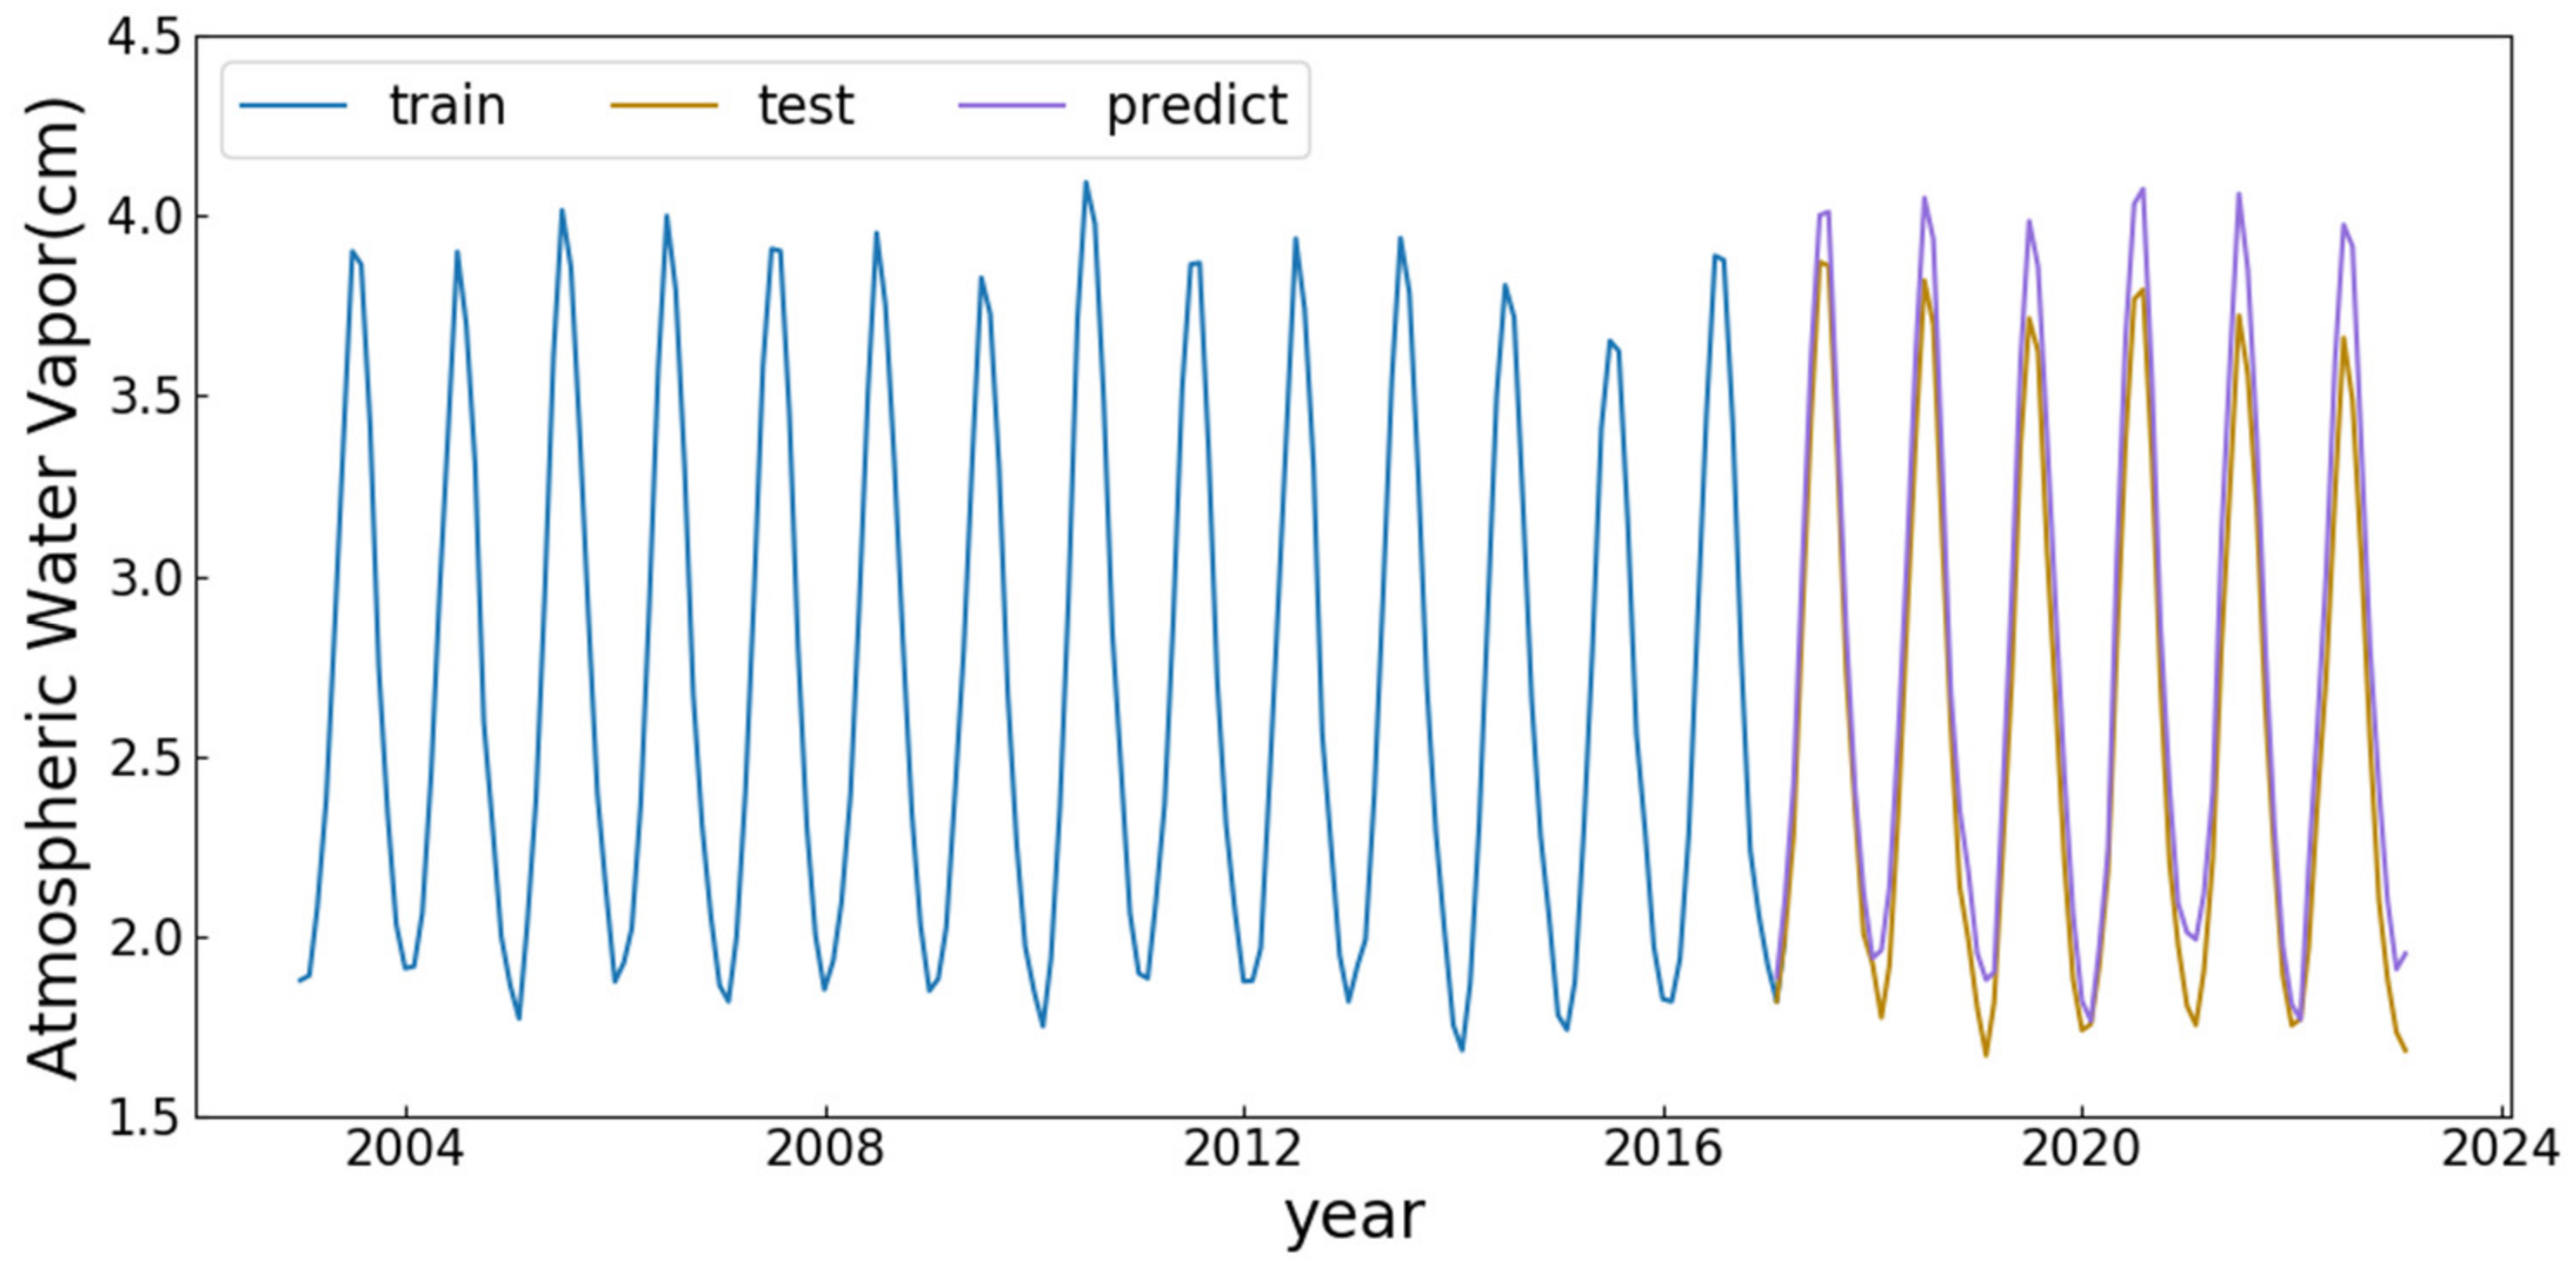
Figure 13.
Time series, autocorrelation, and partial autocorrelation of AWV.

Figure 14.
Time series, autocorrelation, and partial autocorrelation of AWV after seasonal difference.
Figure 14.
Time series, autocorrelation, and partial autocorrelation of AWV after seasonal difference.
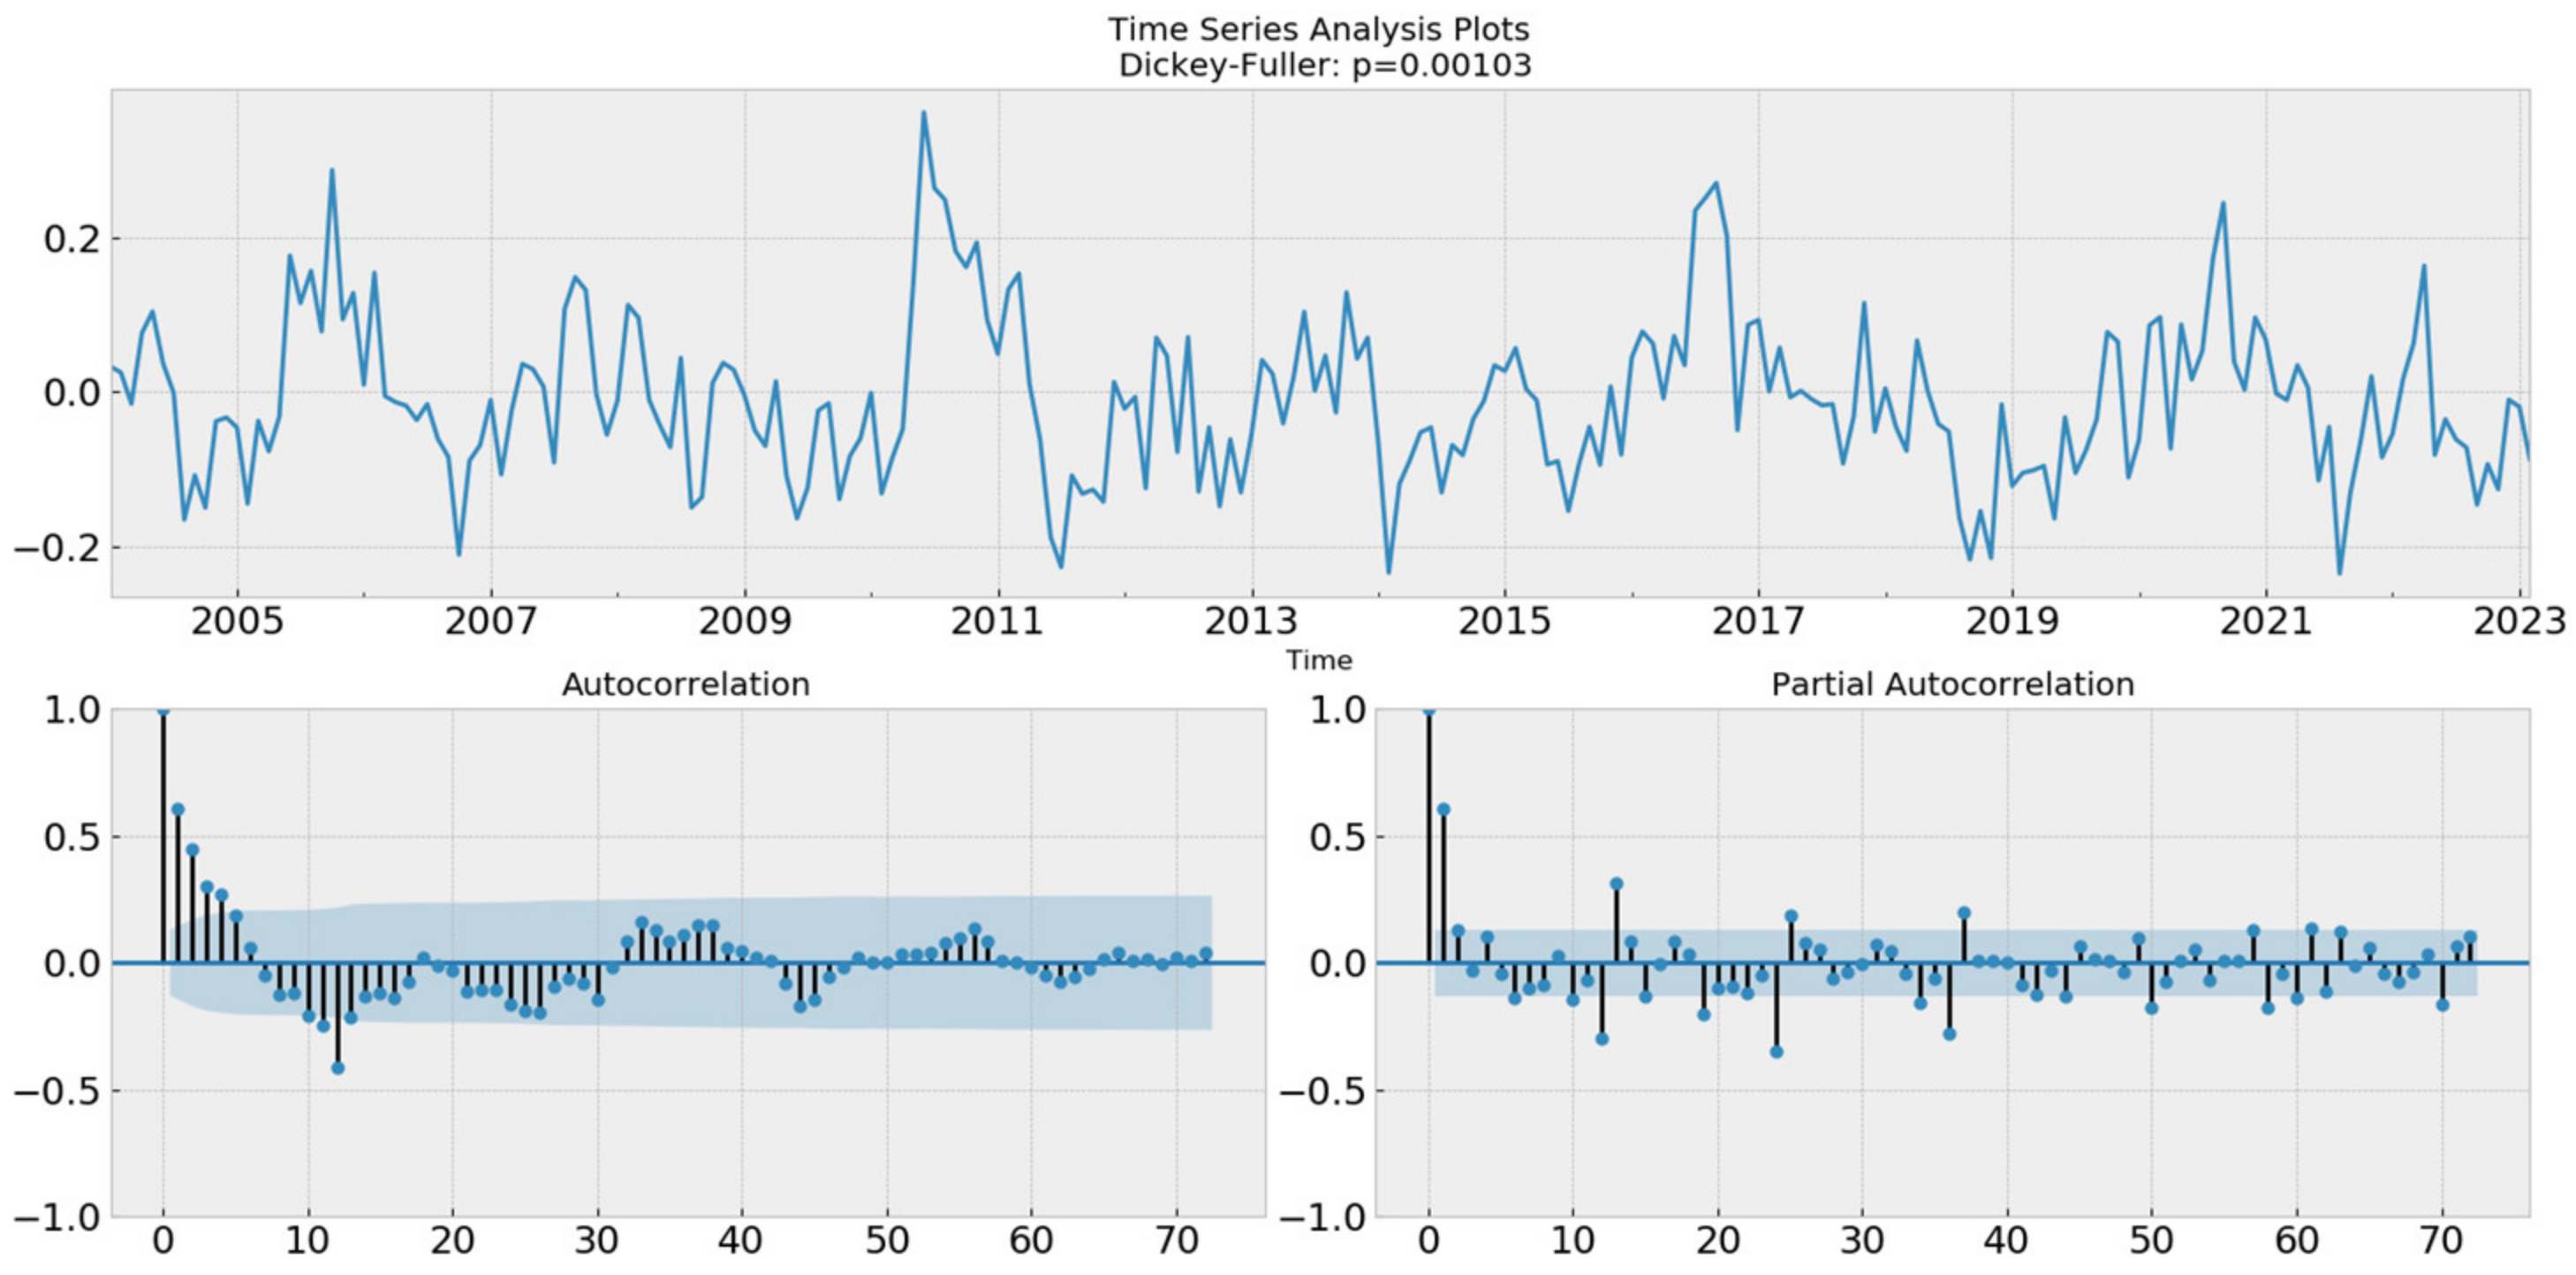
Figure 15.
Residual test.
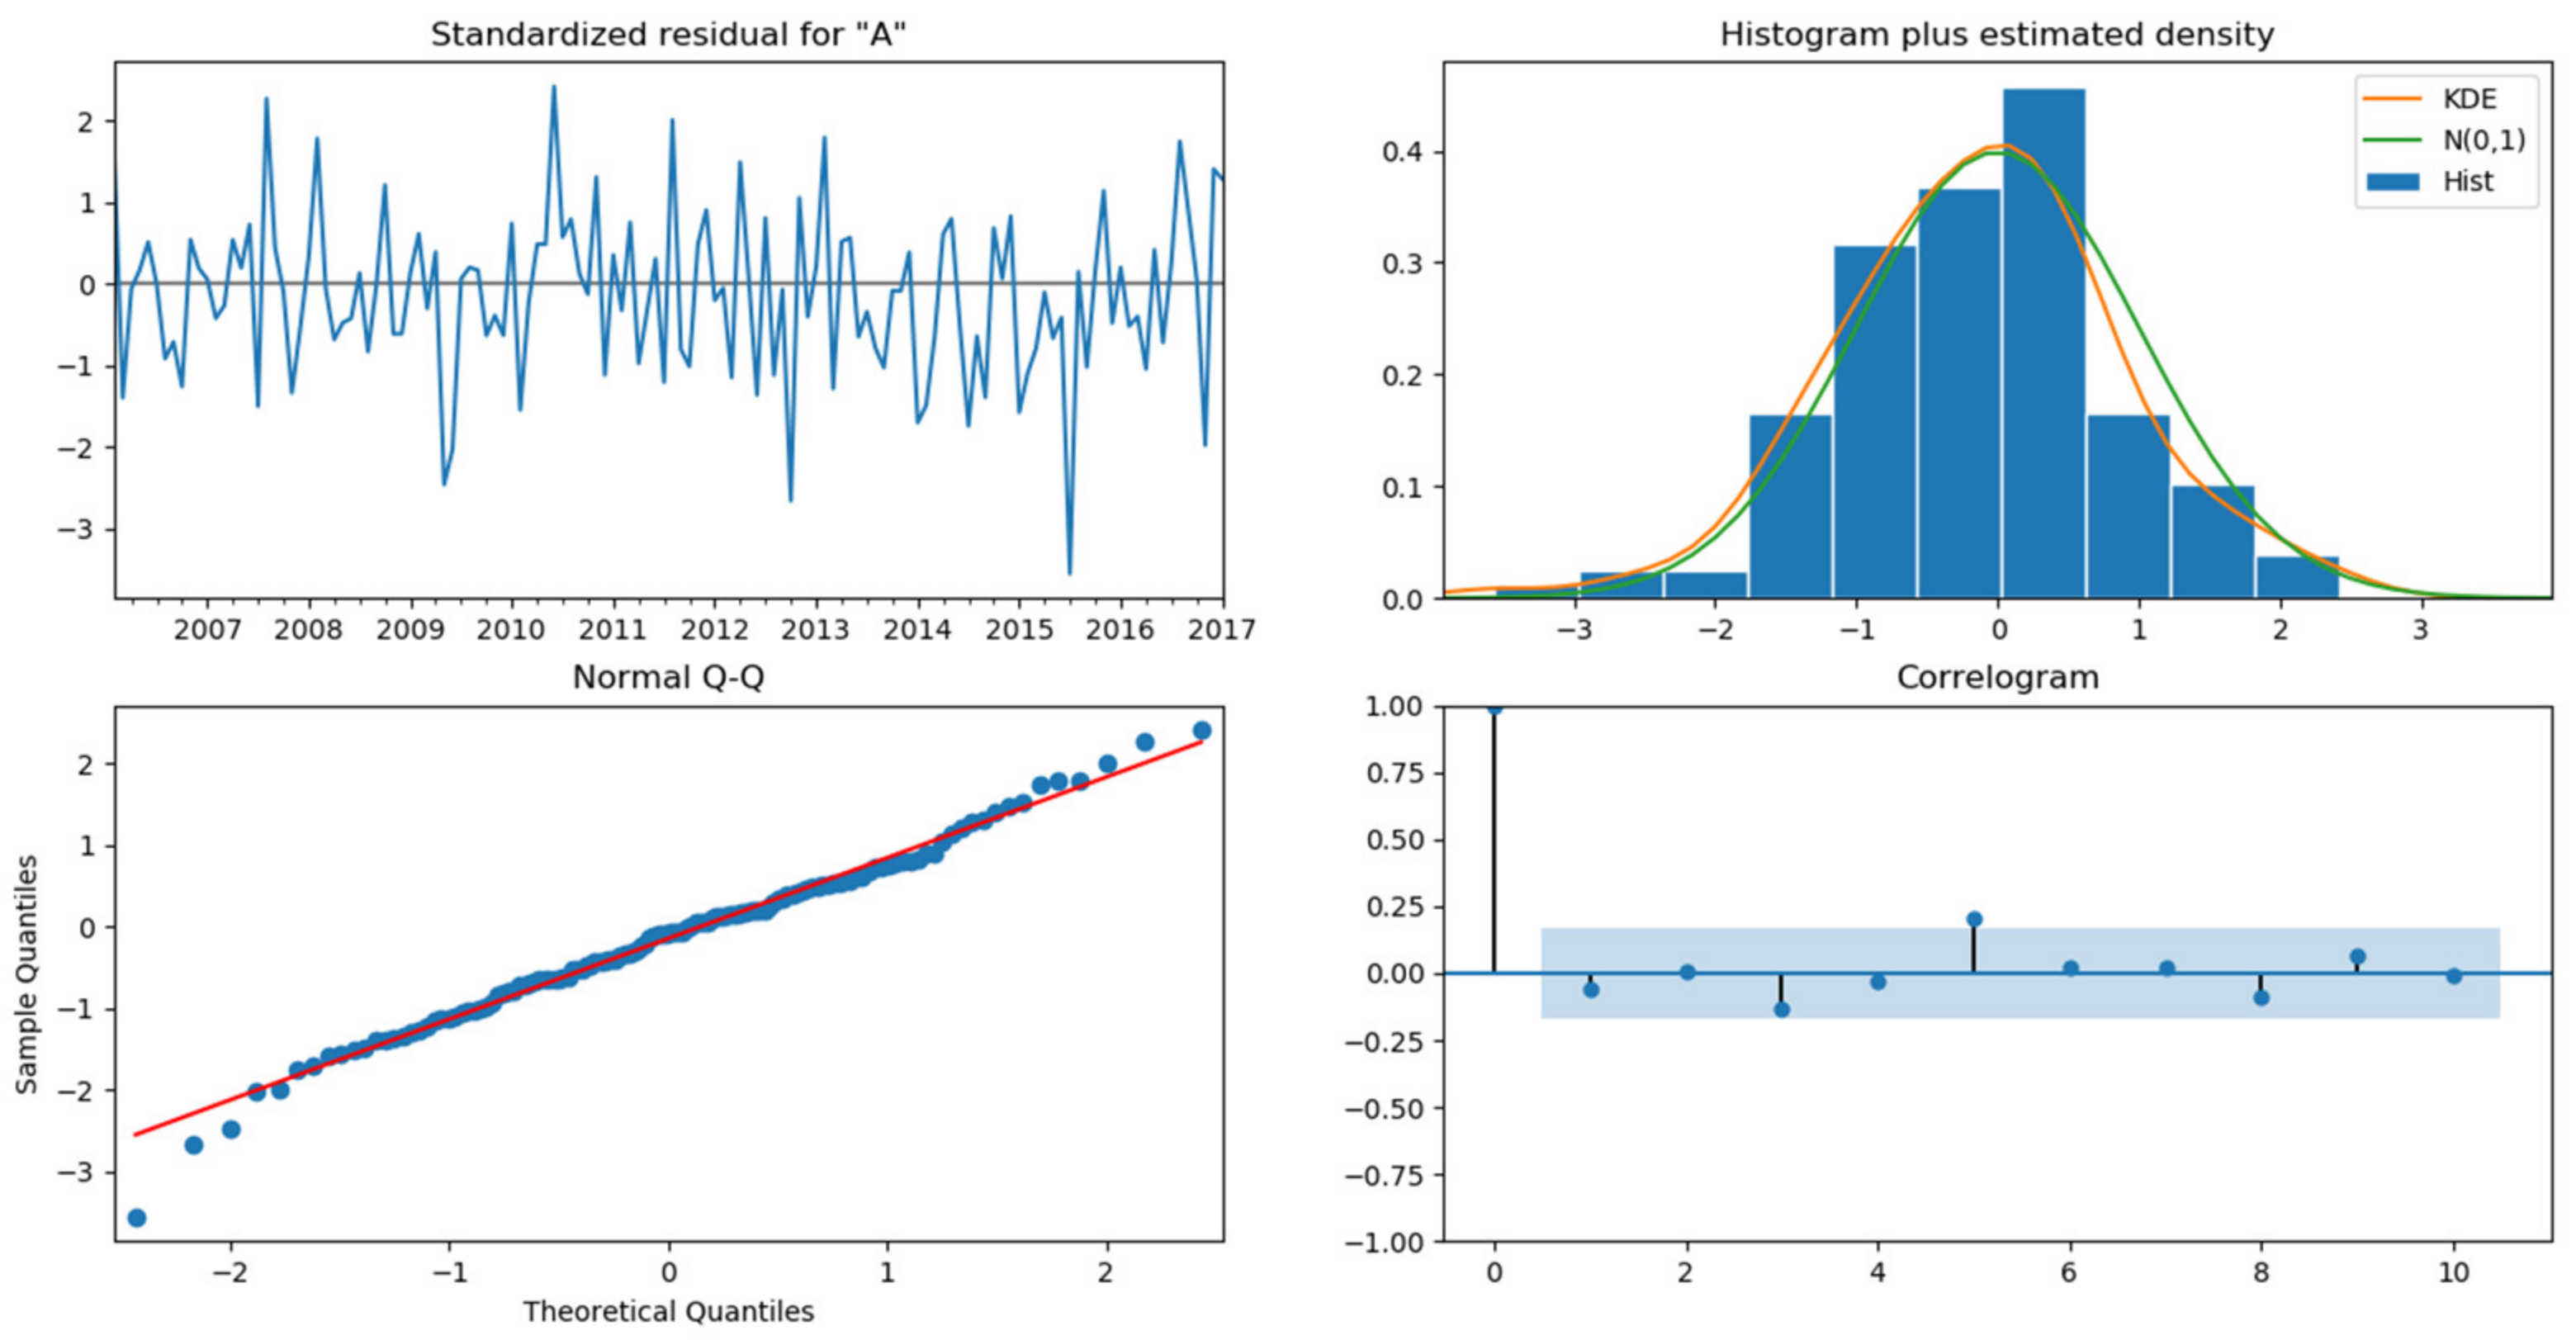
Figure 16.
Forecasting result of SARIMA model.

Figure 17.
Forecasting result of Holt–Winters model.

Figure 18.
Forecasting result of GRNN neural network model.

Figure 19.
Comparison of the results of the four forecasting models.

Table 1.
Contribution rate of variance of the first 3 modes in EOF analysis of AWV in East Asia.
| Mode | EOF1 | EOF2 | EOF3 |
|---|---|---|---|
| Rate of contribution | 63.81% | 9.72% | 6.72% |
| Cumulative variance | 63.81% | 73.53% | 80.25% |
Table 2.
Correlation coefficient of AWV impact factors.
| Impact Factors | Correlation Coefficient | Impact Factors | Correlation Coefficient | Impact Factors | Correlation Coefficient |
|---|---|---|---|---|---|
| TropTemp | 0.49092 | SurfSkinTemp | 0.91381 | OLR | 0.65000 |
| TropHeigh | 0.97560 | AirTemp | 0.93476 | ClrOLR | 0.88406 |
| TropPres | −0.96574 | CloudTopPres | −0.87108 | ||
| H2O_MMR_Surf | 0.97690 | CloudTopTemp | 0.38782 | ||
| RelHumSurf_liquid | −0.15818 | RelHumSurf | −0.41251 |
Table 3.
Evaluation indicators of the four models.
| Model | MSE | MAE | RMSE | |
|---|---|---|---|---|
| Multiple regression | 0.04591 | 0.19470 | 0.21428 | 0.90929 |
| SARIMA | 0.00782 | 0.06977 | 0.08843 | 0.98454 |
| Holt–Winter | 0.03184 | 0.15846 | 0.17844 | 0.93709 |
| GRNN | 0.02204 | 0.12333 | 0.14845 | 0.95646 |
Disclaimer/Publisher’s Note: The statements, opinions and data contained in all publications are solely those of the individual author(s) and contributor(s) and not of MDPI and/or the editor(s). MDPI and/or the editor(s) disclaim responsibility for any injury to people or property resulting from any ideas, methods, instructions or products referred to in the content. |
© 2023 by the authors. Licensee MDPI, Basel, Switzerland. This article is an open access article distributed under the terms and conditions of the Creative Commons Attribution (CC BY) license (https://creativecommons.org/licenses/by/4.0/).
Share and Cite
MDPI and ACS Style
Tang, C.; Tong, Z.; Wei, Y.; Wu, X.; Tian, X.; Yang, J. Time–Frequency Characteristics and SARIMA Forecasting of Atmospheric Water Vapor in East Asia. Atmosphere 2023, 14, 899. https://doi.org/10.3390/atmos14050899
AMA Style
Tang C, Tong Z, Wei Y, Wu X, Tian X, Yang J. Time–Frequency Characteristics and SARIMA Forecasting of Atmospheric Water Vapor in East Asia. Atmosphere. 2023; 14(5):899. https://doi.org/10.3390/atmos14050899
Chicago/Turabian StyleTang, Chaoli, Ziyue Tong, Yuanyuan Wei, Xin Wu, Xiaomin Tian, and Jie Yang. 2023. "Time–Frequency Characteristics and SARIMA Forecasting of Atmospheric Water Vapor in East Asia" Atmosphere 14, no. 5: 899. https://doi.org/10.3390/atmos14050899
Note that from the first issue of 2016, this journal uses article numbers instead of page numbers. See further details here.