Article

Impacts of Urban Development between 2002 and 2022 on the Effects of Sea Breezes in Sendai, Japan—Analyzing Heat Balance Mechanism in Urban Space

1
Department of Architecture and Building Science, Graduate School of Engineering, Tohoku University, Sendai 980-8579, Japan
2
Department of Architecture, Faculty of Engineering, Tohoku Institute of Technology, 35-1 Yagiyamakasumicho, Taihaku Word, Sendai 982-8577, Japan
*
Author to whom correspondence should be addressed.
Atmosphere 2023, 14(4), 677; https://doi.org/10.3390/atmos14040677
Submission received: 7 February 2023 / Revised: 3 March 2023 / Accepted: 10 March 2023 / Published: 3 April 2023
(This article belongs to the Special Issue Strategies for Mitigation and Adaptation to Urban Heat)

Abstract

:
Sea breezes are important in a coastal urban climate; however, the impact of urban development on the effects of sea breezes, which decrease air temperature and increase humidity, has not been understood quantitatively. To quantitatively evaluate this impact in Sendai, Japan over the past twenty years, this study analyzed the heat balance mechanisms in urban spaces based on the simulation results of the Weather Research and Forecasting (WRF) model coupled with Local Climate Zone (LCZ) maps. Compared to the observation data on air temperature, specific humidity, and wind in August 2002, results of the numerical simulation, using the 2002 LCZ map and the meteorological conditions of August 2002, confirmed that the WRF model could reproduce meteorological factors well. Thereafter, two numerical simulations using the LCZ maps from 2002 and 2022 were conducted based on the same meteorological condition, from 25 July to 1 September 2008, to extract the impact of urban development on the effects of sea breeze. Consequently, when land use changed from urban built-up land to natural land cover, both the effects of sea breeze—decreasing air temperature and increasing humidity—decreased. Additionally, increases in LCZ 3 (compact low rise), mainly from LCZ 6 (open low rise) and LCZ 9 (sparsely built), decreased the effects of sea breeze (decreasing air temperature and increasing humidity) by 5% and 10%, respectively, in areas around Sendai Station. This was because the consumption of the sea breeze’s potential to decrease air temperature and increase humidity increased and the wind speed of sea breezes decreased in the windward areas of Sendai Station. These results provide new insights into the impact of urban development on the effects of sea breeze and quantitatively reveal changes in the effects of sea breeze.

1. Introduction

In coastal cities, the urban climate is greatly influenced by sea breezes in the daytime. Extensive attention has been dedicated to studying the effects of sea breezes on the urban climate [1,2,3,4,5,6,7,8,9,10,11]. Using numerical simulations, Sasaki and Mochida et al. (2008) showed that advection caused by sea breezes significantly cooled the air temperature in coastal cities of Japan, such as Tokyo and Sendai [1]. Watanabe et al. [2] also found similar results in Sendai based on long-term observation data. Yang et al. (2022) indicated that sea breezes alleviated the urban heat island effects in Shenzhen, one of the coastal cities in China [3]. Further, many studies have been conducted on the effect of sea breeze—increasing humidity—in urban spaces [4,5]. Jin et al. (2022) found that sea breezes inhibited sea fog development in the daytime in Shangdong, China [6]. On the other hand, the climate is changing on a global scale [12], and urban warming problems have become more severe because of the coupled effects of Urban Heat Islands (UHI) and global warming [4,13,14]. For successful urban planning that adapts to the future climate in coastal cities, it is necessary to understand quantitatively the effects (advantages and disadvantages) of sea breezes. Meanwhile, measures against the urban warming problem should be proposed based on the understanding of the effects of sea breezes.
As sea breezes are caused by pressure differences due to thermal differences between land and sea [15], changes in the thermal properties of urban spaces (e.g., urban development) will affect the characteristics of sea breezes. In addition, changes in the aerodynamic effects of urban roughness due to urban development will affect the inland penetration of sea breezes. Chen et al. (2019) and Hai et al. (2018), who studied the impacts of urban development on sea breezes, found that urban development in the Pearl River Delta (PRD) region enhanced the duration, depth, and intensity of sea breezes but blocked their inland penetration [16,17]. Kusaka et al. (2000) found that land-use alteration in Tokyo, from 1900 to 1985, increased the time taken for sea breezes to penetrate the inland areas and changed the interaction between boundary layer heating and the sea breeze front [11].
Previous studies have recognized that urban development influences the characteristics of sea breezes, consequently affecting the thermal and humid environment in urban areas. However, no researchers have analyzed quantitatively how urban development influences the sea breeze advection effects of sensible/latent heat. Moreover, although introducing sea breezes has been confirmed as an effective countermeasure against the UHI problem [1,2,3], urban development may alter the advection effect of sea breezes. Considering the use of sea breezes to improve the thermal environment, it is necessary to understand qualitatively the changes in the extent and area of the sea-breeze advection effects due to urban development. For this purpose, heat balance analysis was used in this study.
To clarify the factors that contribute to changes in air temperature or specific humidity, Mochida et al. [1,18,19,20,21,22,23,24,25] proposed a new method to analyze a three-dimensional heat balance mechanism in urban spaces. This method analyzes the heat balance involving heat fluxes by advection and turbulent diffusion across all surfaces of an evaluated space (e.g., 2 km (X direction) × 2 km (Y direction) × 80 m (vertical direction)), named the control volume (C.V.), and the anthropogenic heat release within the C.V. Specifically, the contribution of three terms, i.e., advection, turbulent diffusion, and anthropogenic heat release, to the total sensible/latent heat balance, which determines the temperature/humidity changes in the evaluated C.V., can be analyzed quantitatively. Meanwhile, the influence degree of advection, turbulent diffusion, and anthropogenic heat release on changes in air temperature/humidity can also be analyzed. Details of the method of analyzing the heat balance mechanism in urban spaces are presented in Section 2.1. Using the heat balance analysis in urban spaces, Mochida et al. (2008) and Sato et al. (2008) [1,25] discovered that the outgoing sensible heat fluxes caused by the advection of sea breezes were larger than the incoming ones, preventing the daytime air temperature from rising. Further, the outgoing latent heat fluxes by the advection of sea breezes were lower than the incoming ones, which indicated that sea breezes increased the specific humidity in urban spaces [25]. In addition, Sasaki et al. (2005) quantitatively evaluated and compared the contribution of each factor to the changes in air temperature in three different coastal cities of Japan, based on the heat balance results in urban spaces [24]. Further, Sasaki et al. (2005) showed that both the structure and important factors of heat balance vary by city size [24]. On the other hand, even within a single city, the city area varies over time; however, few studies have focused on this point. Thus, this study aims to evaluate quantitatively the impact of urban morphological change in a single city on the effects of sea breezes—decreasing air temperature and increasing humidity—using heat balance analysis.
Sendai, one of the typical coastal cities in Japan [1,2], is included in the system of designated cities in Japan [26]. Since 1999, urban planning has been conducted in Sendai to build a compact city based on the subway and train network [27]. Under this policy measure, regional bases have been formed gradually in Sendai over the past twenty years (2002~2022). To evaluate the impact of urban development on the effects of sea breezes over the past twenty years, it is necessary to align weather conditions. Therefore, only land use conditions are changed, and the meteorological conditions are kept constant in the numerical experiments. Furthermore, by mapping the advection component of the heat balance mechanism in urban spaces, the relationship between urban development and the effects of sea breezes is spatially identified. This study’s novelty is that changes in the impact of sea breezes on air temperature and humidity in urban areas due to urbanization are first analyzed based on heat balance mechanisms in the urban space. The method and simulation are described more in Section 2, Section 3 presents the results and discussion, and Section 4 concludes the paper.

2. Methodology

2.1. Method of the Heat Balance Mechanism in Urban Space

Murakami et al. [18] first proposed the concept of heat balance analysis in urban spaces which considers the generation and transport of sensible and latent heat in urban spaces. As shown in Figure 1, the proposed method sets up a three-dimensional space (control volume, (C.V.)) to evaluate the heat balance in the atmospheric part of urban space. Further, it evaluates the balance between the amounts of sensible or latent heat that flow in and out from each surface of the C.V. by advection and turbulent diffusion and the sensible or latent heat of artificial waste released into the C.V.
In Figure 1, Q i n , a d v and Q i n , t u r are the incoming sensible or latent heat flux by advection and turbulent diffusion, respectively, and Q o u t , a d v and Q o u t , t u r indicate the outgoing sensible or latent heat flux by advection and turbulent diffusion, respectively. In addition, Q a n t h is the anthropogenic heat release.
The heat balance of the C.V. is determined by the total heat of these three components. The heat storage of the C.V. can be expressed as:
Q s = Q s , a d v + Q s , t u r + Q s , a n t h
Q l = Q l , a d v + Q l , t u r + Q l , a n t h
In Equations (1) and (2), Q s and Q l indicate the sensible and latent heat storage of the C.V., respectively. Q s , a d v , Q l , a d v are the net sensible and latent heat transferred by advection in urban spaces, respectively, and Q s , t u r and Q l , t u r are the net sensible and latent heat transferred by turbulent diffusion, respectively. Q s , a n t h and Q l , a n t h indicate the sensible and latent heat generation from anthropogenic heat release in the C.V.
Meanwhile, the net sensible and latent heat transferred by advection in urban spaces, Q s , a d v and Q l , t u r , are calculated as follows:
Q s , a d v = Q s , i n , a d v Q s , o u t , a d v
Q l , a d v = Q l , i n , a d v Q l , o u t , a d v
where Q s , i n , a d v and Q l , i n , a d v are the incoming sensible and latent heat fluxes by advection in the C.V., respectively, and Q s , o u t , a d v and Q l , o u t , a d v are the outgoing sensible and latent heat fluxes by advection in the C.V., respectively.
Similarly, the net sensible and latent heat fluxes by turbulent diffusion in the C.V., Q s , t u r and Q l , t u r , respectively, are calculated as:
Q s , t u r = Q s , i n , t u r Q s , o u t , t u r
Q l , t u r = Q l , i n , t u r Q l , o u t , t u r
where Q s , i n , t u r and Q l , i n , t u r are the incoming sensible and latent heat fluxes by turbulent diffusion in the C.V., respectively, and Q s , o u t , t u r and Q l , o u t , t u r are the outgoing sensible and latent heat fluxes by turbulent diffusion in the C.V., respectively. Notably, when the C.V. is in contact with the ground surface, the Q s , i n , t u r and Q l , i n , t u r are the convection heat transfer between the ground surface and the air near the ground surface, respectively.
The component of the anthropogenic heat release of heat balance ( Q s , a n t h or Q l , a n t h ) is decided by the net heat exchange between air conditioning systems and the heat flowing into the buildings from the atmosphere, which can be expressed as:
Q s , a n t h = Q s , a c Q s , b u i l d
Q l , a n t h = Q l , a c Q l , b u i l d
where Q s , a c and Q l , a c are the sensible and latent heat released from the air conditioning systems to the atmosphere, respectively, and Q s , b u i l d and Q l , b u i l d are the sensible and latent heat flowing, respectively, from the atmosphere to the urban buildings within the C.V. The heat exchange between air conditioning systems and the atmosphere was calculated based on a previous study by Yumino et al. [14].
Owing to the sensible heat balance of the C.V., the air temperature of the C.V. will increase (decrease) when the net sensible heat ( Q s ) is positive (negative). Similarly, the change in the specific humidity of the C.V. depends on the latent heat balance ( Q l ). In this study, the advection effect of sea breezes is analyzed by calculating the advection term of the heat balance mechanism in urban spaces. In this study, the C.V. is set as 1 km × 1 km × 60 m, and the heat balance is computed over the whole study area. Spatial distribution maps of the sea breeze effect are created based on values of the advection component of the heat balance by using all cells in the analysis domain.

2.2. Calculation Conditions

As mentioned in the introduction section, Sendai has experienced urban development toward a compact city since 1999 [27]. In accordance with the compact city policy, built-up urban land in some suburban areas is being replaced by the natural land cover; in central urban areas, the building density and height have increased. To understand the changes in land cover and urban morphology over the past twenty years in Sendai, the Local Climate Zone (LCZ) scheme, including ten categories of urban built-up land and seven categories of natural land cover, was applied in this study. This is because the built classification of the LCZ scheme considers urban factors, including the sky view factor, impervious surface fraction, and building height and width of streets, among others [28,29]. Thereafter, the produced LCZ map data, as land surface boundary conditions, were introduced into the Weather Research and Forecasting (WRF) model [30], a regional urban climate model. It has been reported that the simulation accuracy of the WRF model can be improved by coupling with the LCZ scheme [31,32], which is another reason for using the LCZ scheme in this study.
In this study, three simulation cases were computed, as summarized in Table 1. First, a numerical simulation using land use data in 2002 based on the LCZ scheme and meteorological conditions from 25 July to 1 September 2002 (noted as Case 0) was conducted to validate the accuracy of the WRF model. Further, to extract the impact of urban development on the effects of sea breeze, two numerical simulations using the LCZ maps from 2002 (noted as Case lu_2002) and 2022 (noted as Case lu_2022) were conducted, based on the same meteorological condition. The Case lu_2002 and Case lu_2022, simulations were performed under the same condition as in August 2008, which was selected as the standard climate in August for the period from 1990 to 2009 by the Working Group for Climate Change Modeling of Architectural Institute of Japan [33]. Finally, the advection components of the sensible and latent heat balance in urban spaces (C.V. size: 1 km (X direction) × 1 km (Y direction) × 60 m (vertical direction)) were calculated based on the simulation results of Case lu_2002 and Case lu_2022 over the whole study areas.

2.2.1. WRF Model Configuration

The Advanced Research WRF-ARW version 3.6.1 model [30] coupled with a multi-layer Urban Canopy Model [34], a Building Effect Parameterization (BEP), and a Building Energy Model (BEM) [35] were applied in this study to simulate the interaction with the urban environment. Three layers of nested domains with spatial resolutions of 25 km (72 × 72), 5 km (100 × 100), and 1 km (120 × 120) for Domain 1, Domain 2, and the innermost Domain 3, respectively, were used. The coordinate of all domains’ centers is the location of Sendai Station (39.288° N and 139.336° E), as shown in Figure 2. The model configurations are summarized in Table 2. Furthermore, 34 vertical levels, with the topmost being 50 hPa, were set in this study. The initial and boundary conditions were derived from the Final Operational Global Analysis data (NCEP/FNL) [36] available for free from the National Centers for Atmospheric Research (NCAR) (Research Data Archive). The entire simulation duration was from 21:00 25 July to 09:00 1 September (JST). The first week of the simulation period was set as a spin-up time in this study.
Table 3 summarizes the physical schemes for the WRF model. For the surface process in this study, the NOAH land-surface model [37] was used for non-urban surfaces and the BEP scheme was adopted for urban surfaces [34]. By treating the urban geometry as a three-dimensional street canopy with roofs, walls, and roads, the BEM estimates the temperature and heat flux from the three kinds of surfaces and considers the shadowing from buildings and the reflection of radiation [35]. Further, the cloud microphysics used for the WRF model in this study was a single-moment 6-class (WSM6) microphysics scheme [38]. The rapid radiative transfer model (RRTMG) [39] and the Dudhia shortwave scheme [40] were used for the longwave and shortwave radiation schemes, respectively. For the planet boundary layer scheme, the Mellor–Yamada–Janjic TKE scheme [41] was applied. The new Kain–Fritsch scheme [42] was used for the cumulus process in Domains 1 and 2.

2.2.2. LCZ Scheme and Land Use and Land Cover (LULC) Data

The Word Urban Database and Access Portal Tools (WUDAPT), as a global initiative, aims to collect urban morphology and land use data for climate studies and model applications [28]. Three levels of the LCZ are designed for WUDAPT products [29]. In this study, the WUDAPT level 0 (WUDAPT L0) method was used to create LCZ maps: First, different seasons’ satellite imagines are selected from Landsat; then, training samples for each LCZ category are created based on the definition of each LCZ using the three-dimensional images in Google Earth. Finally, selected satellite images and training samples are loaded in SAGA GIS for LCZ classification in the region of interest, based on machine learning with a random forest method. The detailed method of the data process for creating LCZ maps followed the procedure described by Zhou et al. and Chiba et al. [43,44].
As shown in Table 4, to obtain high-quality LCZ products, satellite images with less cloud cover were selected near 2002 or 2022. Based on the WUDUPT 0 method, LCZ maps in 2002 and 2022 were created with an overall accuracy of 0.92 and 0.95, respectively. The detail of LCZ maps (Figure A1) and accuracy evaluation for LCZ maps (Table A1 and Table A2) can be seen in the appendix materials.
In this study, the LCZ maps with 100 m resolution (Figure A1) were used as the land use data for urban built-up land. In addition, the 100 m resolution LULC data from Japanese National Land Numerical Information [45] were used as LULC resources for the areas outside the urban built-up land of the LCZ maps. The land use data in Domains 1 and 2 in the WRF calculation were set to be the USGS geographic resources, and Domain 3 data were replaced by the up-to-date land-use datasets in the LCZ maps and LULC of Japanese National Land Numerical Information.
The land use data in Domain 3 for Case lu_2002 and Case lu_2022 are shown in Figure 3a and Figure 3b, respectively. The urban built-up land of LCZ 2 (compact middle rise) was distributed in urban center areas, both in 2002 and 2022, and there were no changes in the urban built-up land of LCZ 2. The urban built-up land of LCZ 3 (compact low-rise) had been extended mainly in the south-north directions. This is because two regional bases had been formed in the south and north of Sendai Station with the plan for a compact city in Sendai.
Figure 4 shows the land use change in Sendai between 2002 and 2022. Land use changes from urban built-up land to natural land cover were scattered in the surrounding areas of Sendai, with decreases in LCZ 9 (sparsely built) and increases in the forests and paddy, showing that the land use of urban built-up land disappeared in rural areas because of the compact city policy. However, partial losses in urban built-up land (LCZ 9) near the coastal line of Sendai were caused by the influence of earthquake and tsunami disasters in 2011 [46].
In Figure 4, the land use changes in urban built-up land were mainly in the eastern coastal areas of Sendai Station. The increases in LCZ 3 were mainly from LCZ 6 (open low-rise) and LCZ 9 and the increases in LCZ 6 were mainly from LCZ 9. These two kinds of land use changes showed the characteristics of building a compact city: both the height and the density of buildings increased.

2.3. Definition of a Sea Breeze Day

In this study, the analyzed targets were sea breeze days selected from August 2008, using the following procedures. First, clear summer days were extracted based on the definition of sunny days by the Japan Meteorological Agency [47]: the daily precipitation is less than 1 mm and the daily sunlight hours are more than 7 h. In addition, the sunlight hours are defined as time under a shortwave radiation flux of 120 W/m2 or more by the Japan Meteorological Agency [47]. Thereafter, if 70% of the wind direction during the day (local time from 06:00 to 18:00) were sea directions (from the east to south in Sendai as shown in the plot of Sendai urban areas in Figure 2), then the selected clear summer days was defined as sea breeze days [5]. Note that the data on precipitation, shortwave radiation flux, and wind direction used to extract the sea breeze days were from the calculated grid closest to the Sendai District Meteorological Observatory (Figure 2).
After deciding on the sea breeze days, the hourly combined average of meteorological factors and advection components of heat balance from the selected sea breeze days were calculated. Finally, the daytime average of meteorological factors and advection components of heat balance (local time from 10:00 to 15:00), during which the sea breezes were prevalent, were used for analysis.

3. Results and Discussion
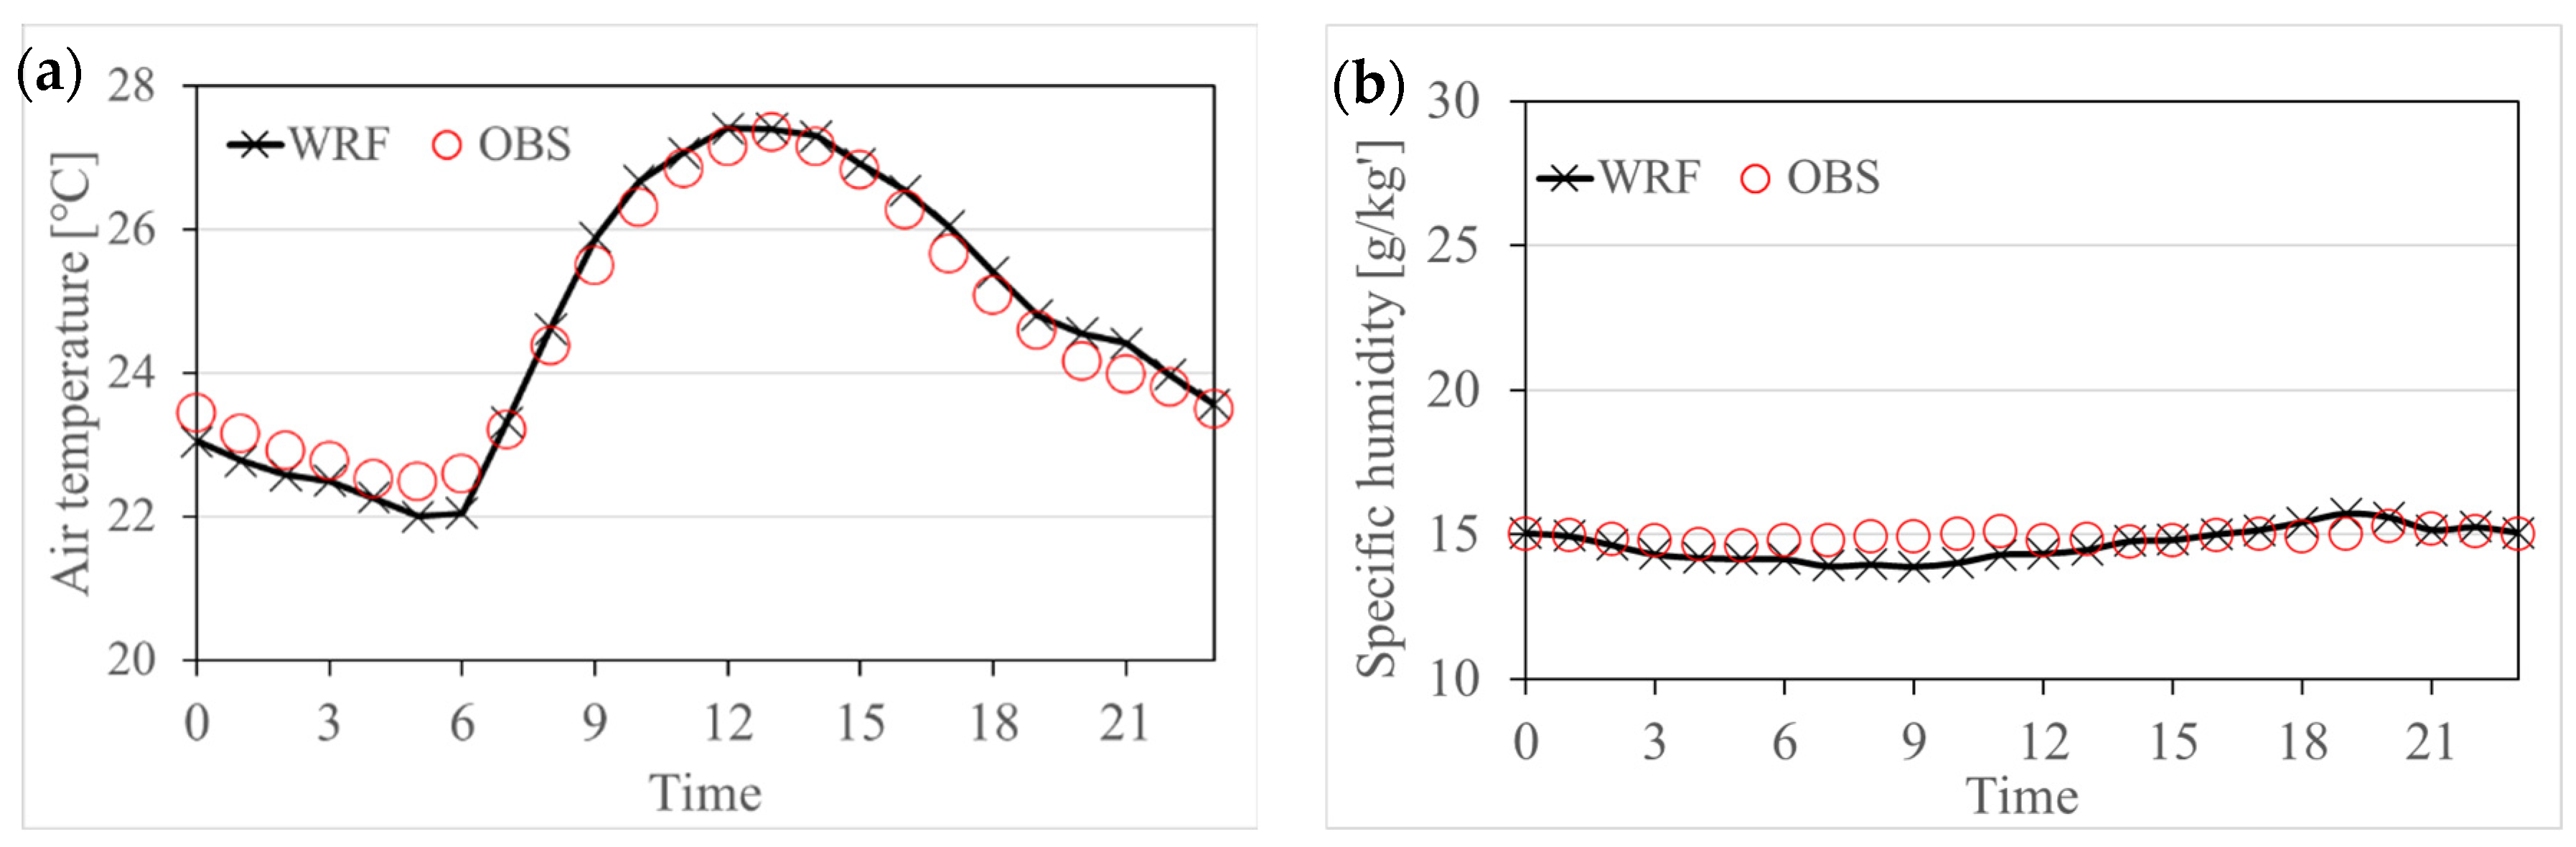
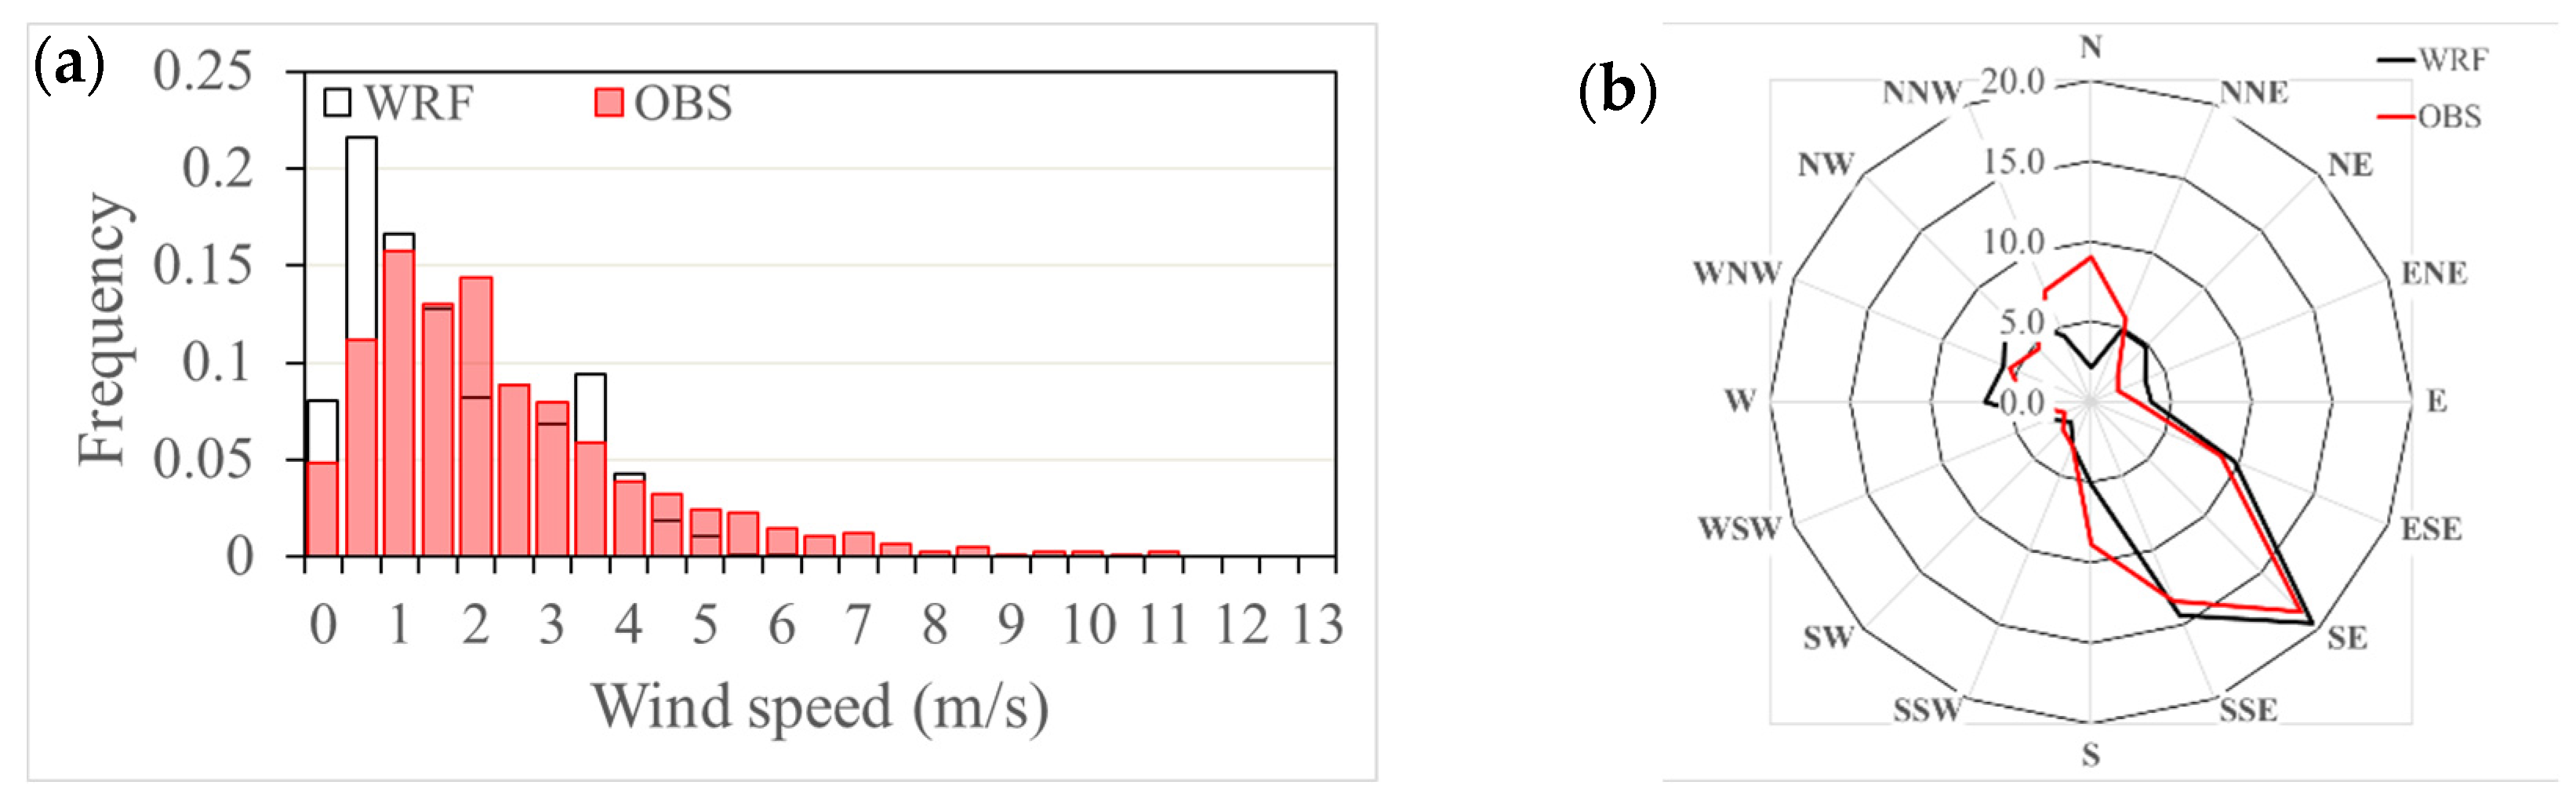
3.1. Validation

To validate the prediction accuracy of the WRF model, observation data on the air temperature, specific humidity, wind direction, and wind speed in August 2002 from Sendai Meteorological Observation Station [47] were used to compare the simulation results of the WRF model. Air temperature and specific humidity on sunny days with no precipitation were extracted from the results of the WRF simulation and observation data. The average hourly value of air temperature and specific humidity are shown in Figure 5a and Figure 5b, respectively. The diurnal variations of air temperature and specific humidity from the WRF simulation were consistent with the observation (OBS) data, as shown in Figure 5. Figure 6a shows the frequency distributions of horizontal wind speed between the WRF results and OBS data in August 2002. Although there were some differences in the frequency distribution of wind speed below 1 m/s, the trend of the observed wind speed was generally reproduced by the WRF model. The dominant southeast sea breezes in August were reproduced by the WRF model, as presented in Figure 6b. It was confirmed that the meteorological factors of air temperature, specific humidity, and wind could be reproduced by the WRF simulation well.

3.2. Impacts of Urban Development between 2002 and 2022 on Meteorological Factors

To make the focus regions from Figure 4 easier to follow, the plot of land use changes between 2022 and 2002 is reposted in Figure 7, Figure 8, Figure 9, Figure 10 and Figure 11. The land use changes were divided into four groups and distinguished using four series of colors in Figure 4: (1) from natural land cover to urban built-up indicated by a red series of colors; (2) from urban built-up to natural land cover indicated by a green series of colors; (3) land use changes with increases in building height or building density indicated by a purple series of colors; and (4) land use changes with decreases in building height or building density indicated by a blue series of colors. In addition, the inland, central, and coastal locations for Sendai can be referred to in the plot of terrain height over Sendai as seen in Figure 2.

3.2.1. Wind Speed

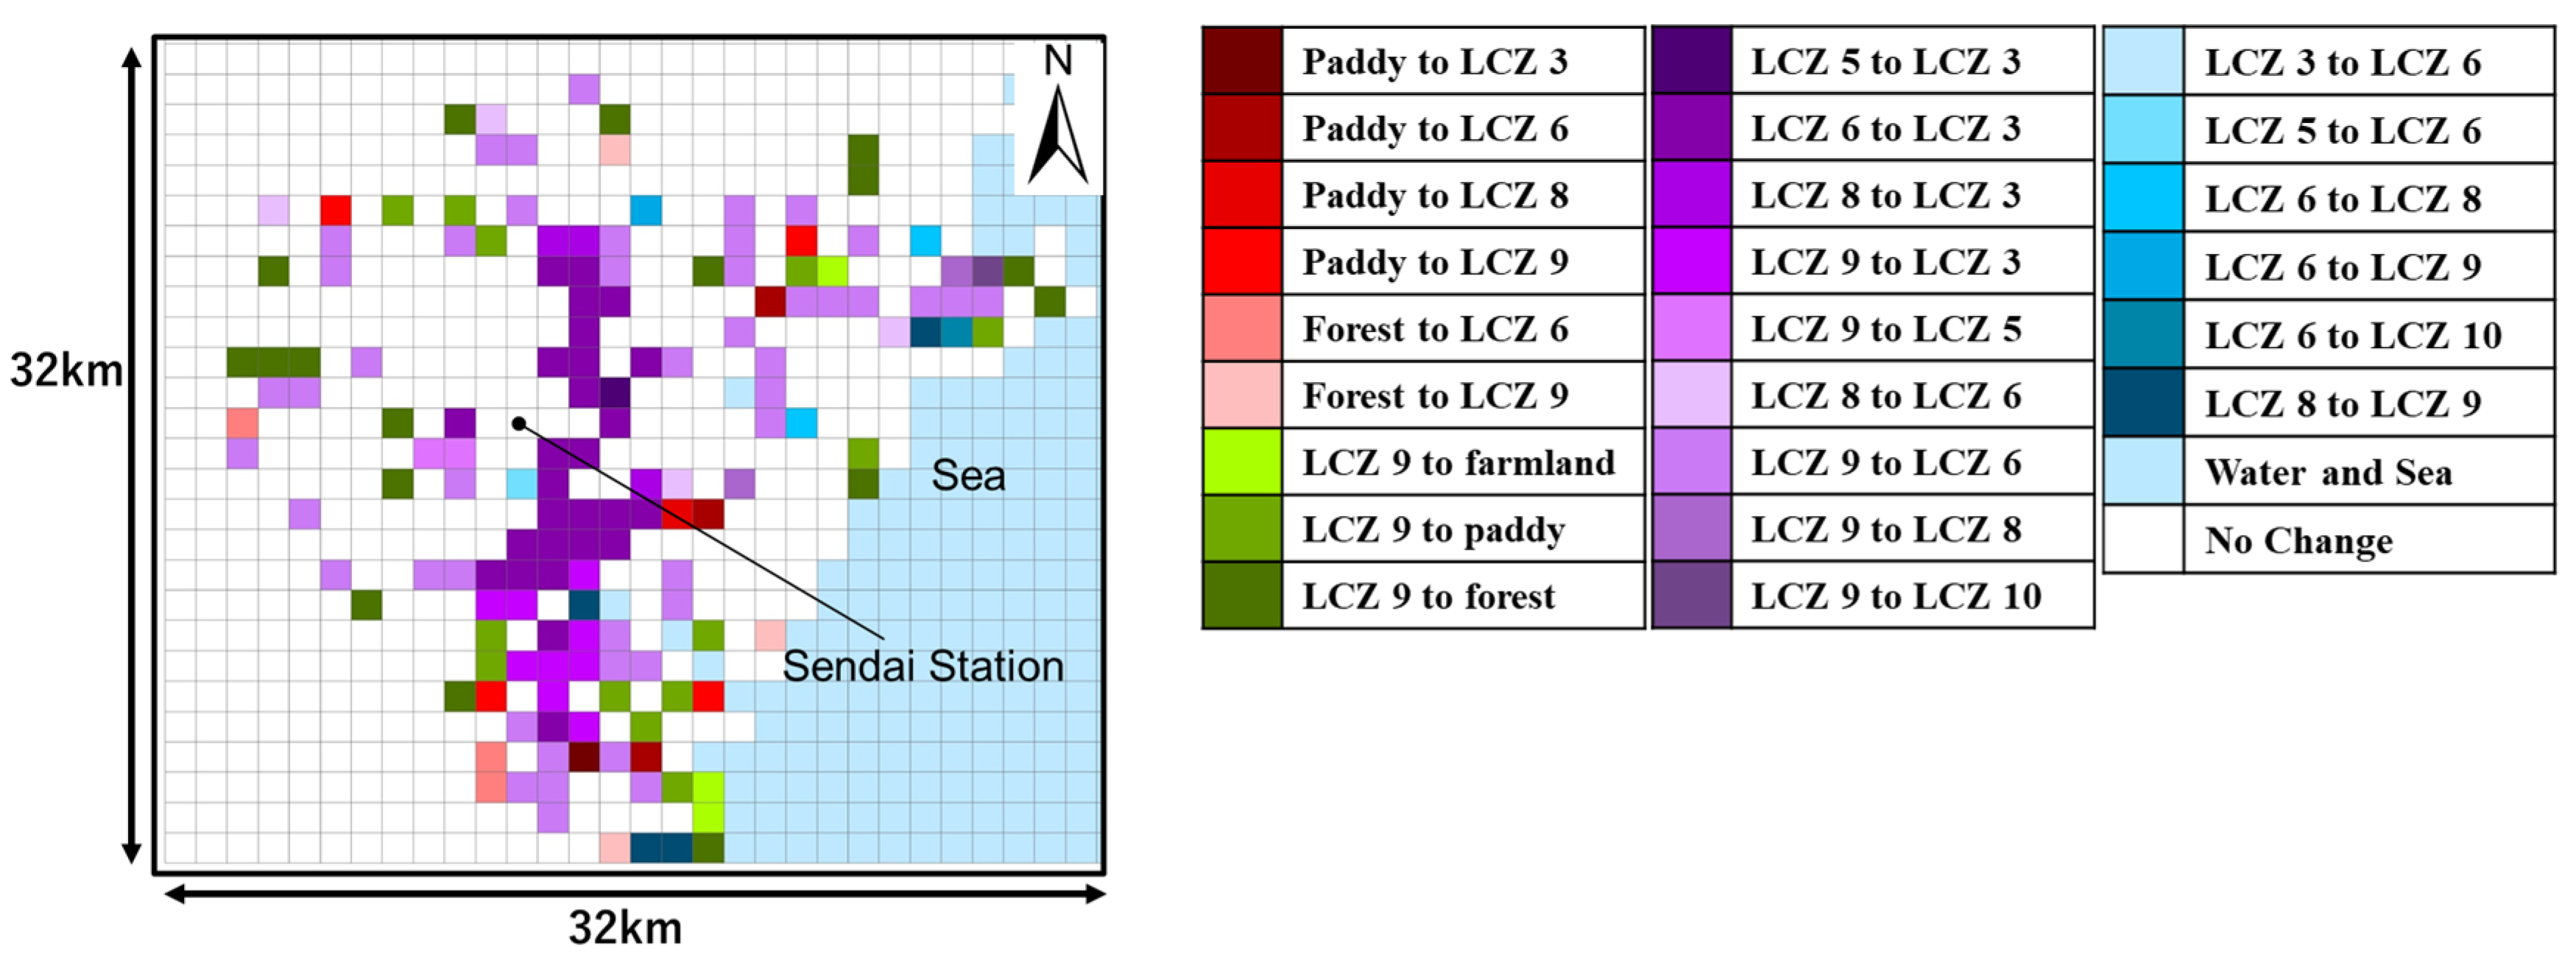
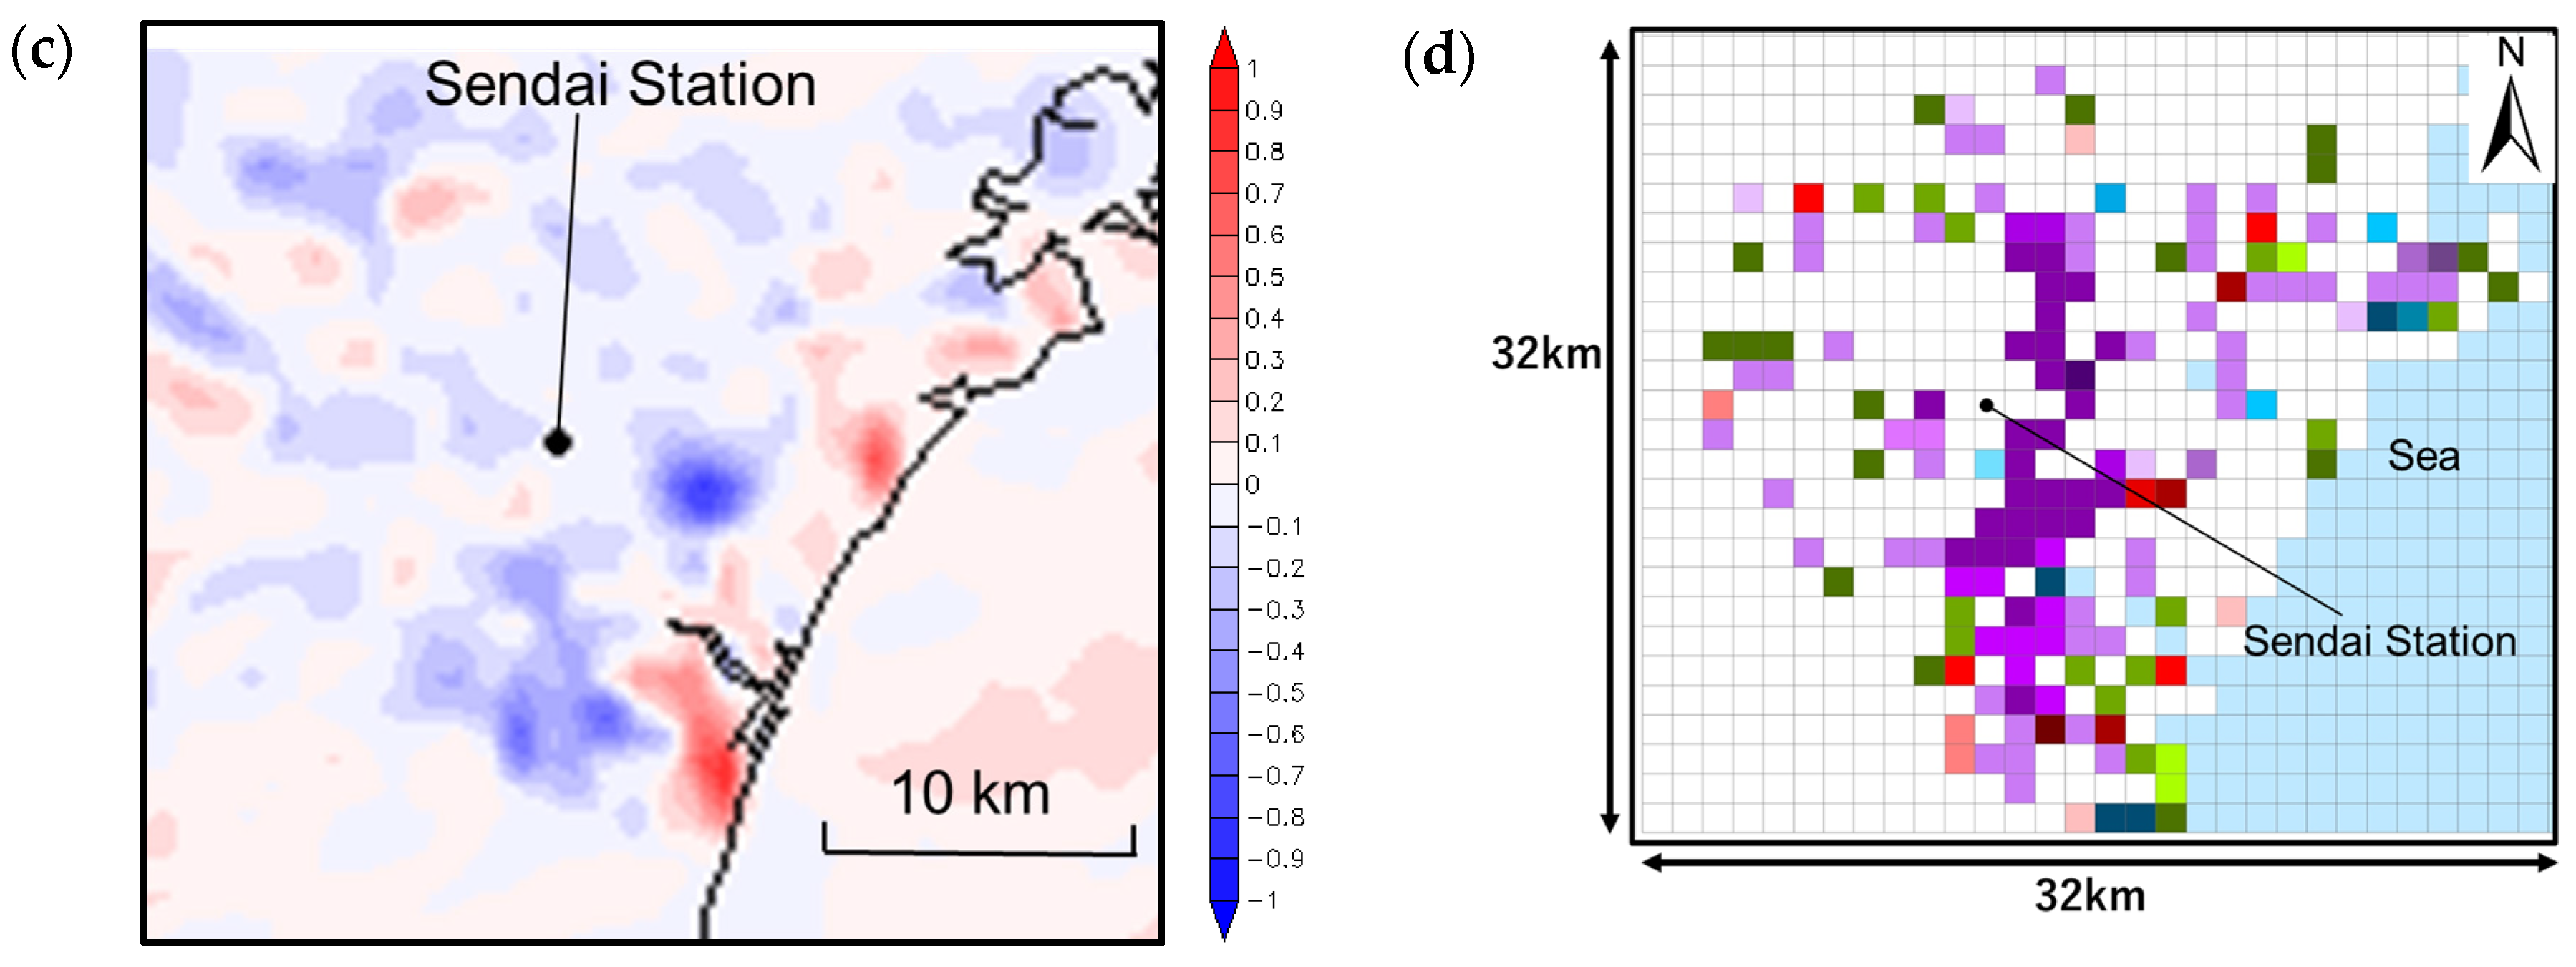
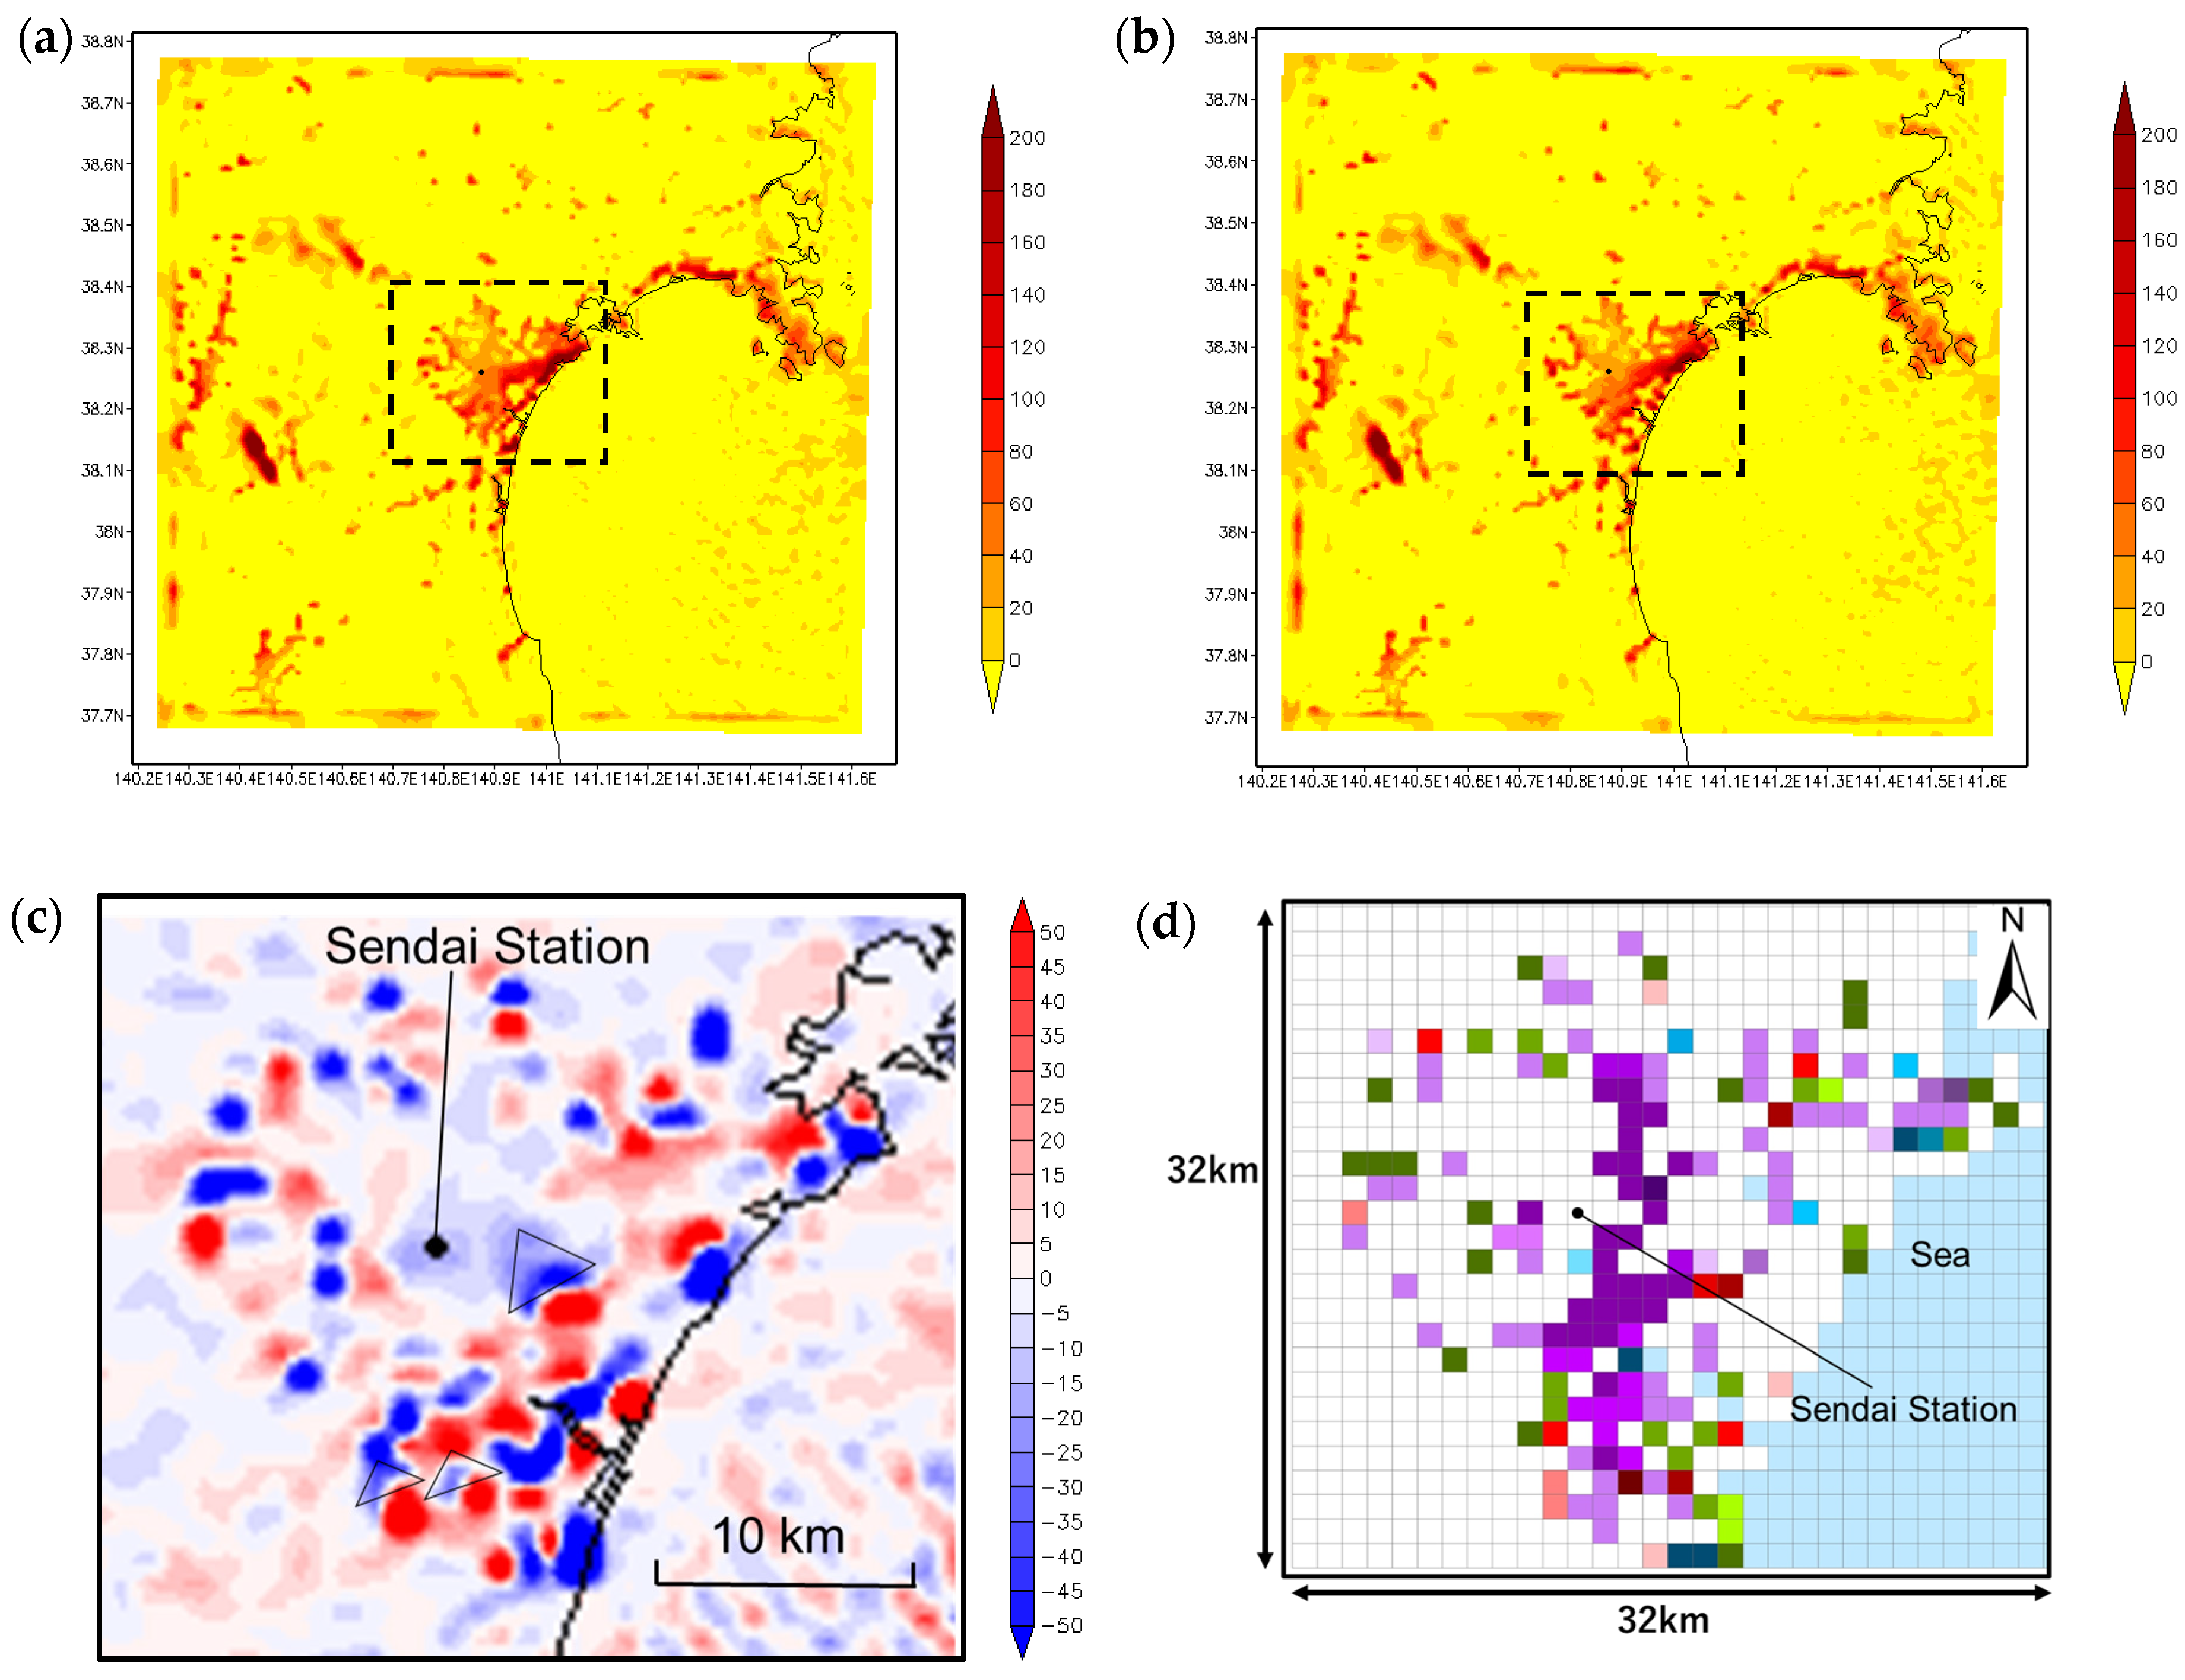
  • Land use change from urban built-up land to natural land cover (forest, paddy, and farmland) close to the coastline (regions identified by green series of colors in coastal areas in Figure 7d): The wind speed increased by 0.2~0.8 m/s (Figure 7c) due to the decrease in the surface roughness of the natural land cover. Further, on the inland side of Sendai Station (regions identified by the green series of colors close to the inland areas in Figure 7d), the land-use change from urban built-up land to natural land cover increased wind speeds but the increases were smaller compared with those in coastal areas.
  • Land use change from natural land cover to urban built-up land (LCZ 9, LCZ 6, and LCZ 3) (regions identified by the red series of colors in Figure 7d): Owing to the increased aerodynamic drag caused by the buildings, significant decreases in wind speed by 0.5~0.8 m/s occurred in coastal areas with increases in LCZ 3 and LCZ 6 in Figure 7c. The impact of decreasing wind speeds also extended to the leeward areas, as shown in Figure 7c.
  • Land use changes with increases in building height or building density indicated by the purple series of colors, mainly including from LCZ 6 to LCZ 3, LCZ 9 to LCZ 3, and LCZ 9 to LCZ 6, in Figure 7d: Wind speeds decreased due to increases in building density and building coverage ratio. Changes in wind speed in these areas were smaller compared with those in the case of urban built-up land to natural land cover or from natural land cover to urban built-up land.

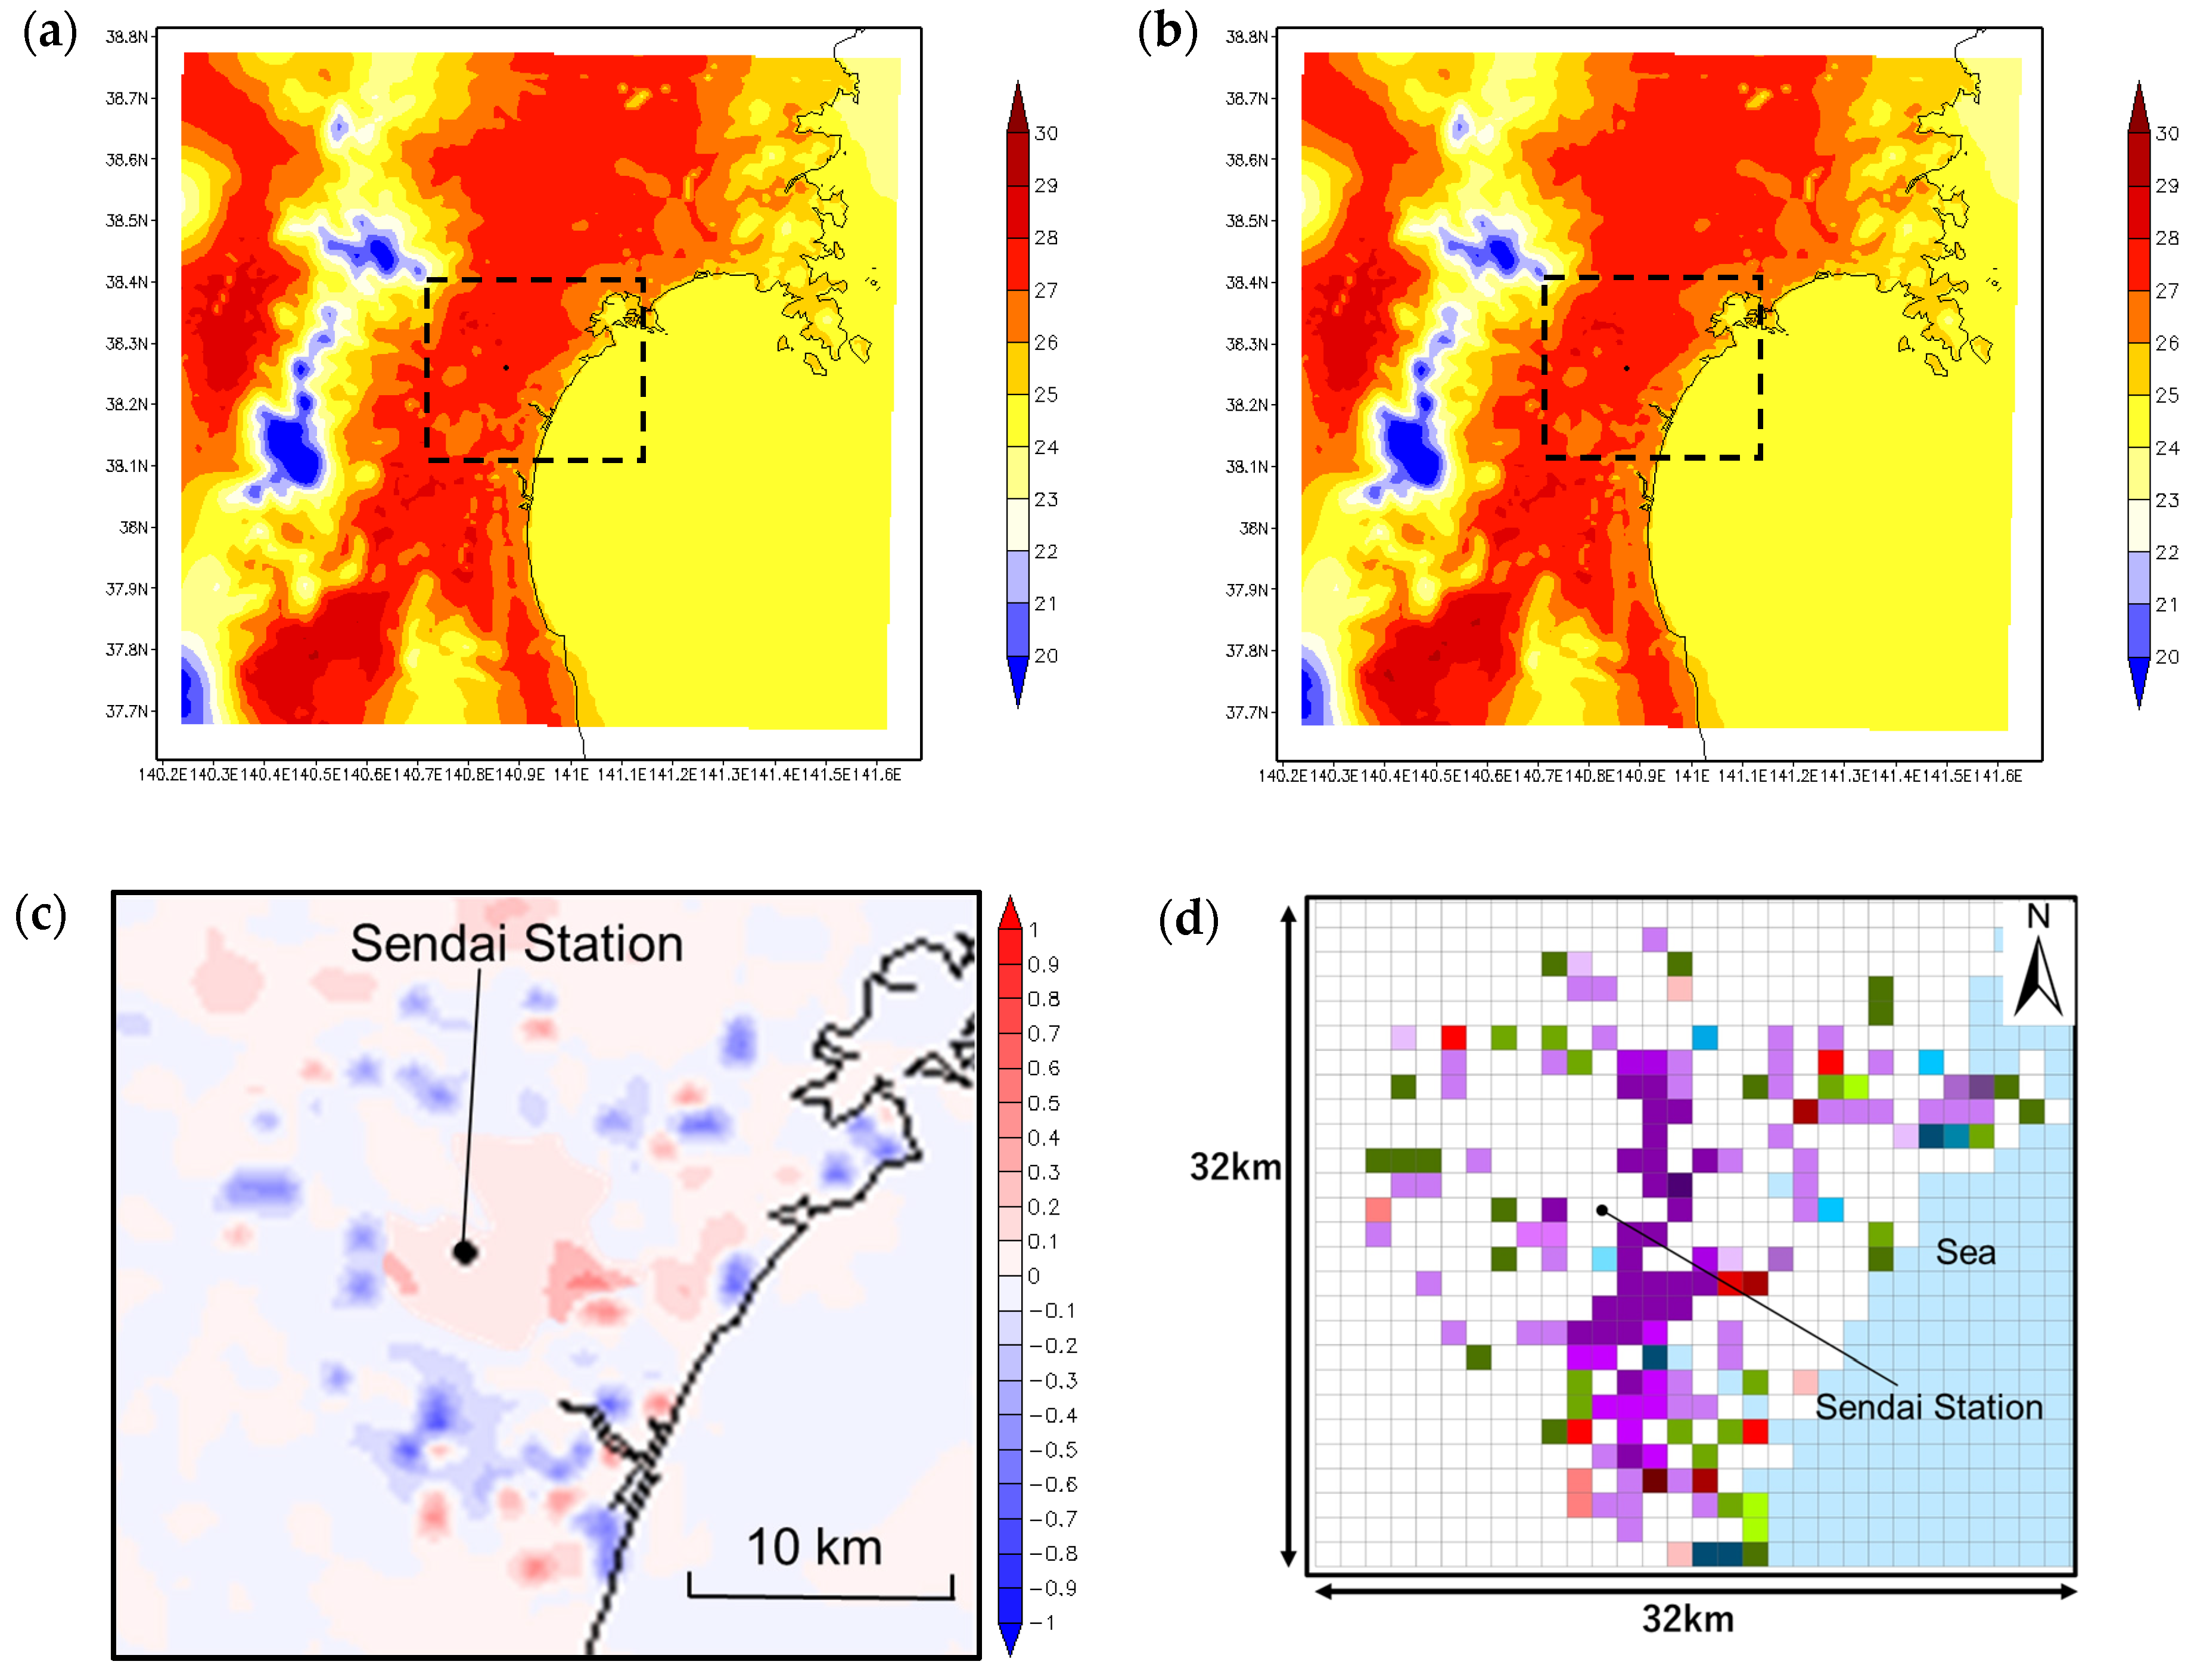
3.2.2. Air Temperature

  • Land use change from urban built-up land to natural land cover (forest, paddy, and farmland) (regions identified by the green series of colors in coastal areas in Figure 8d): The air temperature decreased by 0.3~0.6 °C (Figure 8c).
  • Land use change from natural to urban built-up land (LCZ 9, LCZ 6, and LCZ 3) (regions identified by the red series of colors in Figure 8d): The air temperature increased by less than 0.3 °C (Figure 8c), which was smaller than the change in the case of urban built-up land to natural land cover.
  • Land use changes with increases in building height or building density (indicated by the purple series of colors in Figure 8d) (mainly including from LCZ 6 to LCZ 3, LCZ 9 to LCZ 3, and LCZ 9 to LCZ 6): The air temperature increased by approximately 0.3 °C in urban central areas with a land use change from LCZ 6 to LCZ 3. The air temperature had almost no changes (less than 0.2 °C) in suburban areas with a land use change from LCZ 9 to LCZ 3 or LCZ 9 to LCZ 6.
The land use changes in Figure 4 not only affected the air temperature in areas with land use changes but also affected those in the leeward areas following the wind direction as observed in Figure 8c.

3.2.3. Specific Humidity

  • Land use change from urban built-up land to natural land cover (forest, paddy, and farmland) (regions identified by the green series of colors in coastal areas in Figure 9d): The specific humidity increased by 1.0 g/kg’ (Figure 9c) because of increases in evapotranspiration from the surface.
  • Land use change from natural land cover to urban built-up land (LCZ 9 and LCZ 6) (regions identified by the red series of colors in Figure 9d): The specific humidity decreased by 1.0 g/kg’ (Figure 9c). Different from the changes in air temperature, the increased values in specific humidity were almost the same as the decreased values in specific humidity in the case of urban built-up land to natural land cover.
  • Land use changes with increases in building height or building density (indicated by the purple series of colors in Figure 9d) (mainly including from LCZ 6 to LCZ 3, LCZ 9 to LCZ 3, and LCZ 9 to LCZ 6): The specific humidity almost had no changes as seen in Figure 9c.
In Figure 9c, the impact of land use changes on specific humidity was not only in the areas with land use changes but also expanded in the corresponding leeward areas because of the influence of sea breezes.

3.3. Impacts of Urban Development between 2002 and 2022 on Advection Effects of Sea Breezes

3.3.1. Changes in the Advection Component of Sensible Heat Balance

In Figure 10a,b, the advection components of the sensible heat balance ( Q s , a d v ) had negative values, with large absolute values in the coastal areas, showing that the effect of sea breezes decreasing the air temperature was more significant in coastal areas than in the other areas. In addition, the effect of sea breezes decreasing the air temperature reached the inland areas, about 10 km from the Sendai Station. This means that, during the daytime on sea-breeze days, sea breezes had the potential to decrease air temperature throughout the urban areas of Sendai. The values of the advection component of the sensible heat balance in urban central areas were approximately one-third of that in the coastal areas in Figure 10a,b. These distributions were attributed to the increased temperature (Figure 8a,b) and decreased wind speed of sea breezes (Figure 7a,b) as they flowed from the coast to the inland. Further, the gradual decreases in the absolute values of the advection component of the sensible heat balance from the coast to the inland indicated that the potential of sea breezes to decrease air temperature was consumed gradually as the sea breezes flew into inland areas.
Figure 10c shows the changes in the advection component of sensible heat balance ( Q s , a d v ) due to land use changes between 2002 and 2022 (Figure 4). The advection components of the sensible heat balance have negative values; thus, the positive values of changes in the advection component of the sensible heat balance mean that the absolute values in Case lu_2022 are smaller than those in Case lu_2002. In short, the effect of sea breezes decreasing air temperature decreases in areas with positive changes in the advection component of the sensible heat balance. On the contrary, if the values of change in the advection component of the sensible heat balance are negative, then the absolute values in Case lu_2022 are larger than those in Case lu_2002, and the effect of sea breezes decreasing the air temperature increases.
  • Land use change from urban built-up land to natural land cover (regions identified by the green series of colors in Figure 10d): The absolute values of the advection component (negative value) of the sensible heat balance decreased as seen in Figure 10c. This was due to decreases in the sensible heat supplied into the C.V. by turbulent diffusion and decreases in air temperature (in Figure 8c). For the sea breezes flowing into the C.V., the decreases in urban built-up land reduced the amount of sensible heat in the C.V., and the sensible heat absorbed by sea breezes decreased; therefore, the sensible heat removed from the C.V. by sea breezes was reduced, which decreased the absolute value of the advection component of the sensible heat balance ( Q s , a d v , negative value). In other words, the decreased sensible heat in the C.V. reduced the consumption of the sea breeze’s potential to decrease the air temperature.
  • Land use change from natural land cover to urban built-up land (regions identified by the red series of colors in Figure 10d): Owing to the opposite reasons in the case of urban built-up land to natural land cover, the absolute values of the advection component of sensible heat balance ( Q s , a d v , negative value) increased. This means that the consumption of the sea breeze’s potential to decrease air temperature increased.
  • The three locations indicated by triangles in the coastal areas in Figure 10c: Even though the land use did not change from urban built-up land to natural land cover, the absolute values of the advection component of sensible heat balance ( Q s , a d v , negative value) decreased. In their windward areas, the air temperature increased by 0.2~0.3 °C, as seen in Figure 8c, and the wind speed decreased (in Figure 7c) significantly due to land use changes from natural land cover to urban built-up land. The sea breeze’s effect of decreasing air temperature, which can be evaluated using the advection component of the sensible heat balance (magnitude of negative values), was weakened after the sea breezes were heated and slowed in the windward areas. This may be the reason why the absolute values of the advection component (negative value) of the sensible heat balance decreased in these three areas. The value of the advection component of the sensible heat balance mechanism in Case lu_2022 decreased by 5% compared to that in Case lu_2002, for the same reason as the decreases in the three locations indicated by triangles in Figure 10c, in urban central areas (regions with LCZ 2 land use as shown in Figure 3), even though the land use experienced no change.
Although the study is limited to Sendai and cannot be generalized quantitatively, qualitative trends in points one and two above can be used as a reference for other coastal cities.

3.3.2. Changes in the Advection Component of Latent Heat Balance

In Figure 11a,b, the advection component of the latent heat balance ( Q l , a d v ) in urban areas had positive values, indicating that the inflow of latent heat by advection was larger than the outflow, which increased the specific humidity of the C.V. Similar to the distributions of the advection component of sensible heat balance (Figure 10a,b), the positive values of the advection component of the latent heat balance were not only distributed in the coastal areas but also in the inland areas, which showed the increasing humidity effects of sea breezes extended from the coast to the inland. In other words, sea breezes had the potential to increase humidity throughout the urban areas of Sendai in the daytime on sea-breeze days. On the other hand, the gradual decreases in the absolute values of the advection component of the latent heat balance from the coast to the inland in Figure 11a,b showed that as the sea breezes blew inland, the potential of sea breezes to increase humidity was gradually consumed.
Figure 11c shows the changes in the advection component of the latent heat balance ( Q l , a d v ) caused by land use changes between 2002 and 2022 (Figure 4). In Figure 11c, where the advection component of the latent heat balance shows positive values, these positive values of change mean that the absolute values in Case lu_2022 are larger than those in Case lu_2002. Similarly, the effect of sea breezes to increase humidity increases in areas with positive changes in the advection component of the sensible heat balance. In contrast, if the changes in the advection component of the latent heat balance ( Q l , a d v ) are negative between Case lu_2022 and Case lu_2002, then it indicates decreases in the effect of sea breezes to increase humidity.
  • Land use change from urban built-up land to natural land cover (regions identified by the green series of colors in coastal areas in Figure 11d): The absolute values of the advection component of the latent heat balance ( Q l , a d v , positive value) decreased as the latent heat supplied into the C.V. by turbulent diffusion increased, which would increase the specific humidity (Figure 9c). For sea breezes flowing into the C.V., the latent heat used to increase the humidity of the C.V. decreased because of the land use change from urban built-up land to natural land cover, and the outflow of latent heat from the C.V. increased. Thus, the absolute value of the advection component of the latent heat balance ( Q l , a d v ), a positive value, decreased. In other words, the increased specific humidity due to land use change from urban built-up land to natural land cover reduced the humidity difference between the air in the C.V. and sea breezes flowing into the C.V. Therefore, the potential of sea breezes to increase humidity was less used.
  • Land change from natural land cover to urban built-up land (regions identified by the red series of colors in Figure 11d): In contrast to the reasons in the case of urban built-up land to natural land cover, the latent heat from sea breezes used to increase the specific humidity of the C.V. increased, and the outflow of the latent heat decreased for sea breezes flowing into the C.V. Alternatively, the increased humidity difference between local air in the C.V. and sea breezes flowing into the C.V., due to land use change from natural land to urban built-up land, resulted in increases in the transfer of humidity from sea breezes to the local air in the C.V. Therefore, the consumption of the sea breeze potential to increase humidity increased (Figure 11c), and the absolute value of the advection component of latent heat balance ( Q l , a d v , positive value) increased.
  • The three locations indicated by triangles in the coastal areas in Figure 11c: The decrease in the advection component of the latent heat balance ( Q l , a d v , positive value) had no relation to the land use change from urban built-up land to natural land cover. In their windward areas, the specific humidity decreased by 1.0 g/kg, as seen in Figure 9c, and the wind speed decreased (Figure 7c) significantly because of the increases in land use of LCZ 6 from LCZ 9, forest and paddy, and increases in land use of LCZ 3 from paddy. The effect of sea breezes to increase specific humidity, which can be evaluated by the advection component of latent heat balance (magnitude of positive values), was reduced. This is because both the humidity and wind speed of sea breezes were reduced after flowing through the windward areas. Consequently, the humidity-increasing effects of sea breezes may decrease in these three areas. The value of the advection component of the latent heat balance mechanism was found to decrease by 10% in Case lu_2022, compared to that in Case lu_2002, in areas with the same land use of LCZ 2 in 2002 and 2022 (Figure 3) for the same reason as the decreases in the three locations indicated by triangles in Figure 11c.
The quantitative changes discovered in the effects of sea breezes due to urban development are limited to Sendai; however, the qualitative trends presented in points one and two also apply to other coastal cities.

4. Conclusions

Based on the changes in the advection components of the heat balance mechanisms in urban spaces, this study quantitatively analyzed the impact of urban development on the effects of sea breezes to decrease air temperature and increase specific humidity for the first time. The qualitative conclusions about the impact of urban development on the effect of sea breezes are shown in points one and two below, and the quantitative results on the effect of sea breezes in Sendai’s urban central areas are summarized as the point three below:
  • Land use change from urban built-up land to natural land cover: The effect of sea breezes decreasing air temperature decreased because of the reduced inflow of sensible heat by turbulent diffusion and the decreases in air temperature differences between the local air and sea breezes. This reduced the amount of sensible heat absorbed by sea breezes and the consumption of sea breeze potential to decrease temperature. Meanwhile, the effect of increasing the specific humidity of sea breezes decreased as the inflow of latent heat by turbulent diffusion increased and the difference in specific humidity between local air and sea breezes decreased, which reduced the consumption of the sea breeze’s potential to increase humidity. Consequently, the effects of sea breezes to decrease temperature and increase humidity are maintained and can be effective in more inland areas because of land use changing from urban built-up land to natural land cover.
  • Land use change from natural land cover to urban built-up land: The effect of sea breezes decreasing air temperature increased because the inflow of the sensible heat by turbulent diffusion increased and the air temperature differences between the local air and sea breezes increased, increasing the consumption of the potential of sea breezes to decrease temperature. The effect of increasing the specific humidity of sea breezes also increased as the inflow of latent heat by turbulent diffusion decreased and the differences in specific humidity between the local air and sea breezes increased, which increases the consumption of the sea breeze’s potential to increase humidity.
  • In the eastern coastal areas with increases in building density or urban cover ratio, the sea breeze wind speeds decreased because of the increased surface roughness. Further, the sea breezes became warm and had less humidity after flowing through the increased urban areas, which decreased the advection effects of sea breezes in areas around Sendai Station or further inland areas. Consequently, for sea breezes flowing into areas around Sendai Station in Case lu_2022, the effect of decreasing air temperature decreased by 5% and the effect of increasing humidity decreased by 10%, compared to those in Case lu_2002.
These results indicate that if there is a continuous natural land cover from the seacoast, cool sea breezes can be provided and delivered to further inland areas while maintaining the potential of sea breezes to decrease air temperature and increase humidity. On the other hand, urban planning should consider the building density and building cover ratio in the coastal areas so that sea breezes with high cooling and humidity potential can reach further areas. The findings from this study have implications for local policymakers and planners with a quantitative understanding of the impact of urban development on the effects of sea breezes. However, one of the limitations of our study is that the generality of the quantitative results of the changes in the effect of sea breezes due to urban development in Sendai’s urban central area cannot be determined solely from this study. More case studies about sea breeze events over Sendai or using a combined average with more statistics of sea breeze events are necessary for future study.

Author Contributions

Conceptualization, Y.X. and H.W.; methodology, Y.I. and A.M.; software, Y.X.; validation, Y.X., H.W., Y.I. and A.M.; formal analysis, Y.X. and Y.I.; investigation, Y.X.; resources, Y.X., Y.I. and A.M.; data curation, Y.X.; writing—original draft preparation, Y.X.; writing—review and editing, Y.X. and Y.I.; visualization, Y.X.; supervision, Y.I. and A.M.; project administration, A.M.; funding acquisition, A.M. All authors have read and agreed to the published version of the manuscript.

Funding

This work was supported by the JSPS Grant-in-Aid for Scientific Research (B) No. JP21H01486, the China Scholarship Council No. 202008050203, and JST SPRING No. JPMJSP2114.

Institutional Review Board Statement

Not applicable.

Informed Consent Statement

Not applicable.

Data Availability Statement

Data and the findings of this study are available from the corresponding author upon reasonable request.

Conflicts of Interest

The authors declare no conflict of interest.

Appendix A

Figure A1. LCZ maps of Sendai with 100 m resolution. (a) In 2002; (b) in 2022.
Atmosphere 14 00677 g0a1
Table A1. Confusion matrix for the LCZ classification of Sendai, Japan in 2002.
ClassLCZ 2LCZ 3LCZ 5LCZ 6LCZ 8LCZ 9LCZ 10LCZ ALCZ CLCZ DLCZ GSum RowUser Accuracy
LCZ 2580000000000581.00
LCZ 3036020000000380.95
LCZ 5002300000000231.00
LCZ 6031572400000670.85
LCZ 800039001000001030.87
LCZ 90003097337001130.86
LCZ 10000001360000370.97
LCZ A00000003330003331.00
LCZ C00000000117001171.00
LCZ D000003000520550.95
LCZ G00000000003163161.00
Sum Column58392465921054933612452316
Output Accurate1.000.920.960.880.980.920.730.990.941.001.00
Overall Accuracy 0.92
Kappa Coefficient0.90
Table A2. Confusion matrix for the LCZ classification of Sendai, Japan in 2022.
ClassLCZ 2LCZ 3LCZ 5LCZ 6LCZ 8LCZ 9LCZ 10LCZ ALCZ CLCZ DLCZ GSum RowUser Accuracy
LCZ 2780100000000790.99
LCZ 3247020000000510.92
LCZ 5003220100000350.91
LCZ 6055760200000880.86
LCZ 8000090040000940.96
LCZ 9000007100000711.00
LCZ 10000050810000860.94
LCZ A00000003630003631.00
LCZ C00000000151001511.00
LCZ D000004000720760.95
LCZ G00000000003163161.00
Sum Column8052388095788536315172316
Output Accurate0.980.900.840.950.950.910.951.001.001.001.00
Overall Accuracy 0.95
Kappa Coefficient0.94

References

  1. Sasaki, K.; Mochida, A.; Yoshino, H.; Watanabe, H.; Yoshida, T. A New Method to Select Appropriate Countermeasures Against Heat-Island Effects According to The Regional Characteristics of Heat Balance Mechanism. J. Wind Eng. Ind. Aerodyn. 2008, 96, 1629–1639. [Google Scholar] [CrossRef]
  2. Junimura, J.; Watanabe, H. Study on The Effects of Sea Breeze for Decreasing Urban Air Temperature in Summer: Analyses Based on Long-Term Multi-Point Measurements and Observed Wind Conditions. J. Environ. Eng. 2008, 73, 93–99. [Google Scholar] [CrossRef]
  3. Yang, J.; Xin, J.; Zhang, Y.; Xiao, X.; Xia, J.C. Contributions of Sea–Land Breeze and Local Climate Zones to Daytime and Nighttime Heat Island Intensity. npj Urban Sustain. 2022, 2, 12. [Google Scholar] [CrossRef]
  4. Yamamoto, M.; Kasai, M.; Okaze, T.; Hanaoka, K.; Mochida, A. Analysis of Climatic Factors Leading to Future Summer Heatstroke Risk Changes in Tokyo and Sendai Based on Dynamical Downscaling of Pseudo Global Warming Data Using WRF. J. Wind Eng. Ind. Aerodyn. 2018, 183, 187–197. [Google Scholar] [CrossRef]
  5. Ishida, Y.; Onoda, M.; Watanabe, H.; Ueda, H.; Mochida, A. Observation of the Vertical Profiles of Wind Velocity by Two Doppler Lidars Above City Center in Coastal City Sendai, Japan (Part 1): Influence of Characteristics of Inland Wind and Sea Breeze Above the City on Air Temperature and Humidity Near the Ground. J. Environ. Eng. 2021, 86, 185–195. [Google Scholar] [CrossRef]
  6. Jin, G.; Gao, S.; Shi, H.; Lu, X.; Yang, Y.; Zheng, Q. Impacts of Sea–Land Breeze Circulation on the Formation and Development of Coastal Sea Fog along the Shandong Peninsula: A Case Study. Atmosphere 2022, 13, 165. [Google Scholar] [CrossRef]
  7. Yoshida, A.; Yasuda, R.; Kinoshita, S. Mobile Observation of Air Temperature and Humidity Distributions under Summer Sea Breezes in the Central Area of Osaka City. Atmosphere 2020, 11, 1234. [Google Scholar] [CrossRef]
  8. Viner, B.; Noble, S.; Qian, J.-H.; Werth, D.; Gayes, P.; Pietrafesa, L.; Bao, S. Frequency and Characteristics of Inland Advecting Sea Breezes in the Southeast United States. Atmosphere 2021, 12, 950. [Google Scholar] [CrossRef]
  9. Kunin, P.; Alpert, P.; Rostkier-Edelstein, D. Study of Sea-breeze/Foehn in the Dead Sea Valley employing High Resolution WRF and Observations. Atmos. Res. 2019, 229, 240–254. [Google Scholar] [CrossRef]
  10. Wermter, J.; Noble, S.; Viner, B. Impacts of the Thermal Gradient on Inland Advecting Sea Breezes in the Southeastern United States. Atmosphere 2022, 13, 1004. [Google Scholar] [CrossRef]
  11. Kusaka, H.; Kimura, F.; Hirokuchi, H.; Mizutori, M. The Effects of Land-Use Alteration on the Sea Breeze and Daytime Heat Island in the Tokyo Metropolitan Area. J. Meteorol. Soc. Jpn. 2000, 78, 405–420. [Google Scholar] [CrossRef] [Green Version]
  12. IPCC. 2022: Climate Change 2022: Impacts, Adaptation, and Vulnerability. Contribution of Working Group II to the Sixth Assessment Report of the Intergovernmental Panel on Climate Change; Pörtner, H.-O., Roberts, D., Tignor, M., Poloczanska, E., Mintenbeck, K., Alegría, A., Craig, M., Langsdorf, S., Löschke, S., Möller, V., et al., Eds.; Cambridge University Press: Cambridge, UK; New York, NY, USA, 2022; 3056p. [Google Scholar]
  13. National Institute for Environmental Studies. Bulletin Report on Heatstroke Patients. Available online: http://www.nies.go.jp/gaiyo/archiv/risk8/ (accessed on 23 October 2022).
  14. Yumino, S.; Uchida, T.; Sasaki, K.; Kobayashi, H.; Mochida, A. Total Assessment for Various Environmentally Conscious Techniques from Three Perspectives: Mitigation of Global Warming, Mitigation of UHIs, and Adaptation to Urban Warming. Sustain. Cities Soc. 2015, 19, 236–249. [Google Scholar] [CrossRef]
  15. Miller, S.T.K.; Keim, B.D.; Talbot, R.W.; Mao, H. Sea breeze: Structure, Forecasting, and Impacts. Rev. Geophys. 2003, 41, 1011. [Google Scholar] [CrossRef] [Green Version]
  16. You, C.; Fung, J.C.H.; Tse, W.P. Response of the Sea Breeze to Urbanization in the Pearl River Delta Region. J. Appl. Meteorol. Climatol. 2019, 58, 1449–1463. [Google Scholar] [CrossRef]
  17. Hai, S.; Miao, Y.; Sheng, L.; Wei, L.; Chen, Q. Numerical Study on the Effect of Urbanization and Coastal Change on Sea Breeze over Qingdao, China. Atmosphere 2018, 9, 345. [Google Scholar] [CrossRef] [Green Version]
  18. Murakami, S.; Mochida, A.; Ooka, R.; Yoshida, T.; Yoshino, H.; Sasaki, K.; Harayama, K. Evaluation of the Impacts of Urban Tree Planting in Tokyo Based on Urban Heat Balance Model. In Proceedings of the 11th International Conference on Wind Engineering, Lubbock, TX, USA, 2–5 June 2003. [Google Scholar]
  19. Sasaki, K.; Mochida, A.; Ooka, R.; Murakami, S.; Yoshida, S.; Yoshino, H.; Harayama, K. Evaluation of the Impacts of Urban Tree Planting in Tokyo Based on Thermal Metabolism Model. In Proceedings of the 5th International Conference on Urban Climate, Lodz, Poland, 1–5 September 2003. [Google Scholar]
  20. Mochida, A.; Sasaki, K.; Yoshida, T.; Yoshino, H. Numerical Study on the Regional Characteristics of Heat Balance Inside a City Located at Coastal Areas. In Proceedings of the Fourth European & African Conference on Wind Engineering, Prague, Czech Republic, 11–15 July 2005. [Google Scholar]
  21. Sasaki, K.; Mochida, A.; Yoshida, T.; Watanabe, H.; Yoshino, H. Comparison of Heat Balance Mechanisms Between Three Cities Facing the Pacific Ocean Based on Numerical Analyses of Mesoscale Climate–Selection of Appropriate Countermeasures Against Heat Island Effects in Each City. In Proceedings of the 6th International Conference on Urban Climate, Göteborg, Sweden, 12–16 June 2006. [Google Scholar]
  22. Mouri, K.; Mochida, A.; Watanabe, H.; Sasaki, K. Zoning for Selecting Appropriate Countermeasures Against Urban Warming Based on Heat Balance Analysis—Clarification of the Distributions of Total Heat Budget and Air Change Rate in Urban Space. In Proceedings of the 7th International Conference on Urban Climate, Yokohama, Japan, 29 June–3 July 2009. [Google Scholar]
  23. Mochida, A.; Mouri, K. Urban climatic map studies in Japan: Sendai. In The Urban Climatic Map: A Methodology for Sustainable Urban Planning, 1st ed.; Ng, E., Ren, C., Eds.; Routledge: London, UK, 2015; Chapter 21. [Google Scholar] [CrossRef]
  24. Sasaki, K.; Mochida, A.; Yoshino, H.; Watanabe, H.; Yoshida, T. Comparison of Heat Balance Mechanisms in Typical Summer Days at Central Parts of Three Pacific Cities, Tokyo, Sendai and Haramachi (Part1). J. Environ. Eng. 2005, 595, 121–128. [Google Scholar] [CrossRef] [Green Version]
  25. Sato, K.; Murakami, S.; Ooka, R.; Yoshida, S. Analysis of Regional Characteristics of the Atmospheric Heat Balance in The Tokyo Metropolitan Area in Summer. J. Wind Eng. Ind. Aerodyn. 2008, 96, 1640–1654. [Google Scholar] [CrossRef] [Green Version]
  26. Ohsugi, S. The Large City System of Japan. Papers on the Local GOVERNANCE system and ITS implementation in Selected Fields in JAPAN. 2011, No. 20. Available online: http://www3.grips.ac.jp/∼coslog/activity/01/04/file/Bunyabetsu-20_en.pdf (accessed on 25 August 2022).
  27. Urban Development Bureau of Sendai. Sendai City Planning. 2021. Available online: https://www.city.sendai.jp/toshi-kekakuchose/kurashi/machi/kaihatsu/toshikekaku/aramashi/master2021.html (accessed on 25 March 2021).
  28. Bechtel, B.; Alexander, P.J.; Böhner, J.; Ching, J.; Conrad, O.; Feddema, J.; Mills, G.; See, L.; Stewart, I. Mapping Local Climate Zones for a Worldwide Database of the Form and Function of Cities. ISPRS Int. J. Geo Inf. 2015, 4, 199–219. [Google Scholar] [CrossRef] [Green Version]
  29. Stewart, I.; Oke, T. Local Climate Zones for Urban Temperature Studies. Bull. Am. Meteorol. Soc. 2012, 93, 1879–1900. [Google Scholar] [CrossRef]
  30. Skamarock, W.C.; Klemp, J.B.; Dudhia, J.; Gill, D.O.; Barker, D.M. A Description of the Advanced Research WRF Version 3.NCAR Tech. Note NCAR/TN-475+STR. 2008. Available online: https://opensky.ucar.edu/islandora/object/technotes:500 (accessed on 25 July 2021).
  31. Brousse, O.; Martilli, A.; Foley, M.; Mills, G.; Bechtel, B. WUDAPT, An Efficient Land Use Producing Data Tool for Mesoscale Models? Integration of Urban LCZ in WRF Over Madrid. Urban Clim. 2016, 17, 116–134. [Google Scholar] [CrossRef]
  32. Molnár, G.; Gyöngyösi, A.Z.; Gál, T. Integration of an LCZ-Based Classification into WRF to Assess the Intra-Urban Temperature Pattern Under A Heatwave Period in Szeged, Hungary. Theor. Appl. Climatol. 2019, 138, 1139–1158. [Google Scholar] [CrossRef] [Green Version]
  33. Kikumoto, H.; Iizuka, S.; Hara, M.; Kawamoto, Y.; Mochida, A.; Ooka, R.; Okaze, T.; Xuan, Y. Urban Climate Projections in the 2030s/50s for Major Cities of Japan Using Downscaling Techniques. In Proceedings of the 10th International Conference on Urban Climate/14th Symposium on the Urban Environment, New York, NY, USA, 6–10 August 2018. [Google Scholar]
  34. Salamanca, F.; Martilli, A.; Tewari, M.; Chen, F. A Study of the Urban Boundary Layer Using Different Urban Parameterizations and High-Resolution Urban Canopy Parameters with WRF. J. Appl. Meteorol. Climatol. 2011, 50, 1107–1128. [Google Scholar] [CrossRef]
  35. Salamanca, F.; Krpo, A.; Martilli, A.; Clappier, A. A New Building Energy Model Coupled with An Urban Canopy Parameterization for Urban Climate Simulations—Part, I. Formulation, Verification, and Sensitivity Analysis of the Model. Theor. Appl. Climatol. 2010, 99, 331. [Google Scholar] [CrossRef]
  36. Research Data Archive. Available online: https://rda.ucar.edu/ (accessed on 25 August 2021).
  37. Chen, F.; Duhia, J. Coupling an advanced land surface-hydrology model with the Penn State-NCAR MM% modeling system. Part Ⅰ: Model implementation and sensitivity. Mon. Weather Rev. 2001, 129, 569–585. [Google Scholar] [CrossRef]
  38. Hong, S.Y.; Lim, J.O.J. The WRF Single-Moment 6-Class Microphysics scheme (WSM6). J. Korean Meteorol. Soc. 2006, 42, 129–151. [Google Scholar]
  39. Mlawer, E.J.; Taubman, S.J.; Brown, P.D.; Iacono, M.J.; Clough, S.A. Radiative Transfer for Homogeneous Atmospheres: RRTM, A Validated Correlated-K Model for the Longwave. J. Geophys. Res. Atmos. 1997, 102, 16663–16682. [Google Scholar] [CrossRef] [Green Version]
  40. Duhia, J. Numerical Study of Convection Observed During the Winter Monsoon Experiment Using a Mesoscale Two-Dimensional Model. J. Atmos. Sci. 1989, 46, 3077–3107. [Google Scholar] [CrossRef]
  41. Janic, Z.I. Nonsingular Implementation of the Mellor-Yamada Level 2.5 Scheme in the NCEP Meso Model; US Department of Commerce, National Oceanic and Atmospheric Administration, National Weather Service, National Centers for Environmental Prediction: Silver Spring, MD, USA, 2001. Available online: https://repository.library.noaa.gov/view/noaa/11409 (accessed on 20 August 2021).
  42. Kain, J.S. The Kain-Fritsch Convective Parameterization: An update. J. Apppl. Meteorol. 2004, 43, 170–181. [Google Scholar] [CrossRef]
  43. Zhou, X.; Okaze, T.; Ren, C.; Cai, M.; Ishida, Y.; Watanabe, H.; Mochida, A. Evaluation of Urban Heat Islands Using Local Climate Zones and the Influence of Sea-Land Breeze. Sustain. Cities Soc. 2020, 55, 102060. [Google Scholar] [CrossRef]
  44. Chiba, E.; Ishida, Y.; Wang, Z.; Mochida, A. Proposal of LCZ Categories and Standards Considering Super High-rise Buildings Suited for Asian Cities Based on the Analysis of Urban Morphological Properties of Tokyo. Jpn. Archit. Rev. 2022, 5, 247–268. [Google Scholar] [CrossRef]
  45. Ministry of Land, Infrastructure, Transport and Tourism. National Land Numerical Information Download Service. Available online: http://nlftp.mlit.go.jp/ksj/ (accessed on 16 October 2021).
  46. Hiraishi, T.; Yoneyama, N.; Baba, Y.; Azuma, R. Field survey of the damage caused by the 2011 off the Pacific coast of Tohoku Earthquake Tsunami. In Studies on the 2011 off the Pacific Coast of Tohoku Earthquake, 1st ed.; Kawase, H., Ed.; Springer: Tokyo, Japan, 2014; pp. 37–48. [Google Scholar] [CrossRef]
  47. Japan Meteorological Agency. Available online: http://www.data.jma.go.jp/obd/stats/etrn/index.php (accessed on 23 October 2022).
Figure 1. Concept of the heat balance mechanism in an urban space [1,18].
Atmosphere 14 00677 g001
Figure 2. Calculation domains for the WRF, terrain height (m), and region of interest (ROI) over Sendai.
Atmosphere 14 00677 g002
Figure 3. Land use data in Sendai. (a) LCZ map in 2002; (b) LCZ map in 2022.
Atmosphere 14 00677 g003
Figure 4. Land use changes between 2002 and 2022 in Sendai.
Atmosphere 14 00677 g004
Figure 5. Validations for air temperature and specific humidity. (a) Diurnal variations of air temperature averaged for sunny days in August 2002; (b) diurnal variations of specific humidity averaged for sunny days in August 2002.
Atmosphere 14 00677 g005
Figure 6. Validation for wind conditions. (a) Frequency distribution of wind speed in August 2002; (b) frequency distribution of wind direction in August 2002.
Atmosphere 14 00677 g006
Figure 7. Daytime wind {m/s} fields. (a) In Case lu_2002; (b) in Case lu_2022; (c) scalar difference of wind speed (between Case lu_2022 and Case lu_2002); and (d) land use changes between 2002 and 2022 in Sendai (reposted Figure 4).
Atmosphere 14 00677 g007aAtmosphere 14 00677 g007b
Figure 8. Daytime air temperature {°C} distributions. (a) In Case lu_2002; (b) in Case lu_2022; (c) air temperature differences (between Case lu_2022 and Case lu_2002); and (d) land use changes between 2002 and 2022 in Sendai (reposted Figure 4).
Atmosphere 14 00677 g008
Figure 9. Daytime specific humidity {g/kg’} distributions. (a) In Case lu_2002; (b) in Case lu_2022; (c) specific humidity differences (between Case lu_2022 and Case lu_2002); and (d) land use changes between 2002 and 2022 in Sendai (reposted Figure 4).
Atmosphere 14 00677 g009
Figure 10. Distributions of the advection component of sensible heat balance {MW} in the daytime. (a) In Case lu_2002; (b) in Case lu_2022; (c) changes in the advection component of sensible heat balance (between Case lu_2022 and Case lu_2002); and (d) land use changes between 2002 and 2022 in Sendai (reposted Figure 4).
Atmosphere 14 00677 g010aAtmosphere 14 00677 g010b
Figure 11. Distributions of the advection component of latent heat balance {MW} in the daytime. (a) In Case lu_2002; (b) in Case lu_2022; (c) changes in the advection component of latent heat balance (between Case lu_2022 and Case lu_2002); and (d) land use changes between 2002 and 2022 in Sendai (reposted Figure 4).
Atmosphere 14 00677 g011
Table 1. Simulation cases.
Case NameLand Use DataMeteorological Data
Case 0LCZ map of 2002August 2002
Case lu_2002LCZ map of 2002August 2008
Case lu_2022LCZ map of 2022August 2008
Table 2. Calculation conditions for the WRF simulations.
ItemsContent
Date21:00 (JST) 25 July to 09:00 1 September
Number of Vertical Grids34 (from the surface to the 50-hPa level)
Time StepDomain 1: 100 s; Domain 2: 20 s; and Domain 3: 4 s
Topographic DataDomains 1 and 2: U.S. Geological Survey
Domain 3: Japanese National Land Numerical Information
Horizontal ResolutionsDomain 1: 25 km; Domain 2: 5 km; and Domain 3: 1 km
NestingOne-way nesting
Table 3. Physical schemes for the WRF simulation.
ItemsContent
MicrophysicsWRF single-moment six-class scheme [38]
Shortwave RadiationDudhia scheme [40]
Longwave RadiationRapid radiative transfer model scheme [39]
Land SurfaceNoah land surface model [37] + Multi-layer urban canopy model [34] + Building energy model [35]
Planetary Boundary LayerMellor–Yamada–Janjic scheme [41]
Cumulus ParameterizationDomains 1 and 2: Kain–Fritsch (new Eta) scheme [42]
Domain 3: None
Table 4. Satellite images for creating LCZ maps.
Satellite ImageEntity IDDateSeason
Landsat 7
(2002 LCZ map)
LE07_L1TP_10703309/24/2001Autumn
04/24/2002Spring
06/07/2002Summer
02/18/2002Winter
Landsat 8
(2022 LCZ map)
LC08_L1TP_10703308/19/2020Summer
01/19/2022Winter
04/03/2022Spring
09/10/2022Autumn
Disclaimer/Publisher’s Note: The statements, opinions and data contained in all publications are solely those of the individual author(s) and contributor(s) and not of MDPI and/or the editor(s). MDPI and/or the editor(s) disclaim responsibility for any injury to people or property resulting from any ideas, methods, instructions or products referred to in the content.

