Article

Spatiotemporal Characteristics of Ozone Pollution and Resultant Increased Human Health Risks in Central China

1
Zhongjin Environmental Technology Co., Ltd., Taiyuan 030000, China
2
Key Laboratory for Digital Land and Resources of Jiangxi Province, East China University of Technology, Nanchang 330013, China
3
Research Center for Atmospheric Environment, Chongqing Institute of Green and Intelligent Technology, Chinese Academy of Sciences, Chongqing 400714, China
4
College of Materials and Chemical Engineering, Zhengzhou University of Light Industry, Zhengzhou 450001, China
5
Shanghai Carbon Data Research Center, CAS Key Laboratory of Low-Carbon Conversion Science and Engineering, Shanghai Advanced Research Institute, Chinese Academy of Sciences, Shanghai 201210, China
*
Authors to whom correspondence should be addressed.
Atmosphere 2023, 14(10), 1591; https://doi.org/10.3390/atmos14101591
Submission received: 14 September 2023 / Revised: 16 October 2023 / Accepted: 20 October 2023 / Published: 22 October 2023

Abstract

:
The spatiotemporal characteristics of ozone pollution and increased human health risks in Central China were investigated using a long time series of ozone concentrations from 2014 to 2020. We found a gradual increase in ozone pollution, with the highest concentrations observed in the northeastern region. The spatial distribution of population density showed distinct patterns, with the northeastern and east-central regions coinciding with areas of high ozone concentrations. The study found an overall increasing trend in MDA8 ozone concentrations, with a regional average increase of 3.5 (μg m−3) per year, corresponding to a 4.4% annual increase. We observed a significant clustering of areas at a higher risk of premature mortality associated with long-term ozone exposure, particularly in the northeastern region. Estimated premature mortality due to ozone pollution in Central China between 2014 and 2020 shows an increasing trend from 2014 to 2019 and a decreasing trend in 2020 due to the occurrence of extreme ozone pollution and the subsequent recovery of ozone concentrations after the closures due to COVID-19. Premature mortality due to ozone exposure is affected by both ozone levels and the exposed population, with high correlation coefficients exceeding 0.95. The high total population (more than 220 million per year) and increasing ozone levels exacerbate the problem of premature mortality due to ozone pollution. This study improves our understanding of the impact of ozone pollution on human health and emphasizes the dynamic nature of ozone pollution and its impacts on human health over time. It underscores the need for further study and comprehensive action to mitigate these health risks.

1. Introduction

Ozone, a secondary pollutant and oxidant, is formed by complicated chemical reactions involving precursor pollutants, specifically nitrogen oxides (NOx) and volatile organic compounds (VOCs), under sunlight. Anthropogenic activities, including industrial emissions, transportation, and agricultural practices, release these precursor pollutants into the atmosphere [1]. This process has led to a critical environmental problem in China, where ozone pollution is attracting much attention due to its negative impacts on air quality and human health [2,3]. Rapid industrialization and urbanization have increased the emission of precursor pollutants, resulting in tropospheric ozone pollution [4]. In certain regions, the problem of ozone pollution is affected by weather factors, PM2.5 pollutants (particle matter less than 2.5 μm in diameter), topography, and extensive coal burning [5,6,7]. PM2.5 particles affect ozone formation in a variety of indirect ways, like scattering and absorbing sunlight, potentially reducing the intensity of UV rays reaching the ground; combining with ozone formation precursors (VOCs and NOx); serving as a surface for heterogeneous reactions related to ozone formation. Weather factors such as temperature, sunlight, wind patterns, atmospheric stability, precipitation, topography, air masses, and seasonal variations all play important roles in shaping the ground-level ozone distribution.
Contrary to large decreases in fine particulate matter (PM2.5) during the Clean Air Action Plan initiated in 2013, most Chinese provinces experienced a slight and steady increase in annual ozone concentrations, with an average annual growth rate of 1 to 3 ppb between 2013 and 2018 [3]. This unexpected trend can be attributed to a potential imbalance in reducing emissions of nitrogen oxides (NOx) and volatile organic compounds [2]. Elevated surface ozone levels pose respiratory health risks and harm crop yields, ecosystems, and overall environmental sustainability [8,9].
According to the World Health Organization (WHO), ambient air pollution was estimated to have been responsible for nearly 7 million deaths in 2012 [10]. Numerous studies have shown that increased mortality is linked to both short- and long-term exposure to ambient air pollution. With every 10 (μg m−3) increase in PM2.5, all-cause mortality would rise by 7.3% in the United States [11]. Similarly, research conducted in China revealed that a 10 (μg m−3) rise in PM2.5 led to a 0.38% increase in overall mortality, a 0.51% increase in respiratory mortality, and a 0.44% increase in cardiovascular mortality [12]. Additionally, sustained high levels of ambient O3, NO2, CO, and SO2 consistently correlated with increased hospital admissions for asthma and pneumonia [13,14].
Ozone concentration is widely recognized as a crucial indicator for assessing the impact of air pollution on human health [15]. Previous studies have made significant progress in quantitatively assessing the health risks associated with persistent ozone pollution in China by using accurate ozone concentration data [16,17,18]. These studies established quantitative assessment methods for health risks associated with ozone concentration data and continuous exposure to ozone pollution. However, challenges remain, such as spatial matching of inconsistent spatial resolution between ozone data and population data, which may lead to discrepancies in health risk assessment [19,20]. In addition, most previous studies have focused predominantly on well-known urban agglomerations [21], with limited research on health risks in other regions, including Central China. To gain a comprehensive understanding of the health risks of ozone pollution in China, further studies in different regions are needed [18,22]. Although ozone pollution is recognized as a major contributor to global health risks, there is a lack of research that explicitly focuses on the direct relationship between ozone pollution and premature deaths in China. Given the steady increase in ozone concentrations, it is important to address the health risks posed by ozone pollution and to formulate appropriate strategies to mitigate the negative impacts on human health [23].
This study aims to investigate the spatiotemporal characteristics of ozone pollution and resultant health risks in Central China from 2014 to 2020, using high-resolution ozone and population data. We analyze the distribution and trends of ozone concentration during this period. We assess the health effects of prolonged ozone exposure through population exposure risk analysis and exposure–response relationship assessment. This study offers valuable insights for formulating recommendations on ozone-related health risks and improves our understanding of the impact of ozone pollution on human health in urban agglomerations and specific regions of Central China.

2. Materials and Methods

2.1. The Study Area of Central China

This study focuses on the Central China region, which is located in the central part of the country and includes three central provinces: Henan, Hubei, and Hunan (Figure 1). Central China has experienced rapid economic growth and urbanization in recent decades, resulting in increased energy consumption and significant air pollution problems. The region is characterized by mountains in the west and south, while the eastern and northern parts consist of plains extending in a south–north direction. Three megacities in particular—Zhengzhou, Wuhan, and Changsha—are located in the plains and thus in China’s primary air pollution transmission belt, commonly known as the “2 + 26” cities. Given these factors, Central China is a good research domain, offering valuable insights into the dynamics of ozone pollution and its associated health effects.

2.2. Ozone Concentrations and Population

To address the need for comprehensive and spatially detailed information on ground-level ozone, we used the daily maximum 8 h average ozone (MDA8) ground-level ozone dataset, which is known as long-term, high-resolution, and high quality of ground-level ozone for China (ChinaHighO3) and is accessible through the website: http://tapdata.org.cn (accessed on 21 May 2023). The ChinaHighO3 dataset was carefully constructed using an extended ensemble learning approach that combines the space–time model with an extremely randomized tree with multiple data sources, including ground-based observations, remote sensing products, atmospheric reanalysis, and an emission inventory [24]. This dataset provides complete coverage (100%), high resolution (10 km), and excellent quality (with an out-of-sample coefficient of 0.87 and an out-of-station coefficient of 0.80) of MDA8 ozone levels. The availability of this ChinaHighO3 dataset provides a new perspective for assessing the risks associated with ground-level ozone pollution and provides valuable insights for research and decision making in this area.
To assess population exposure to ozone pollution, we used high-resolution national gridded demographic population data with a high spatial resolution of 1 km × 1 km. This dataset, which is freely available through the University of Southampton’s WorldPop platform: https://www.worldpop.org/ (accessed on 21 May 2023), is highly relevant. However, it should be noted that ground-level ozone measurements alone are not sufficient to accurately represent the actual population exposure to ozone pollution because of the inherent heterogeneity in the spatial distribution of the population and ozone concentrations [25]. The dataset used fully (100%) covers the age structure of the population and the total population and provides a suitable basis for studying ozone exposure and associated health risks for specific subgroups.
In the present study, we used the ChinaHighO3 and population dataset over Central China from 2014 to 2020 (Table S1).

2.3. Trend Analysis

Time series analysis is continually evolving, with new methods emerging constantly. Numerous time series analysis methods are available, including ARIMA (auto-regressive integrated moving average), STL (seasonal and trend decomposition using Loess), and deep learning approaches like the Prophet model and LSTM (long short-term memory). As classic trend analysis methods, the Theil–Sen and Mann–Kendall methods widely deal with data exhibiting irregularities or uncertainties, offering robust approaches for trend detection and quantification [26]. These methods have found extensive utility in the realm of environmental sciences [27,28,29]. In the present study, we used the Theil–Sen and Mann–Kendall methods to investigate the trends in annual MDA8 ozone concentrations.
The Theil–Sen estimator calculates the median slope by considering all possible pairs of data points, rendering it a resilient and robust estimator that is less susceptible to the influence of extreme values [30,31,32,33]. It is widely adopted for trend analysis, particularly when dealing with data exhibiting irregularities or uncertainties. On the other hand, the Mann–Kendall test exhibits sensitivity to both abrupt and gradual trends, accommodating data with various distributions. Furthermore, it adeptly handles tied observations, where multiple data points share identical values, ensuring precise trend detection [28].
In our investigation, we have employed the Theil–Sen and Mann–Kendall statistical methods to identify and analyze nonparametric linear trends of the time series MDA8 ozone data in Central China. In the context of ozone analysis, these trend tests are employed to assess the patterns observed in MDA8 data, serving as a widely accepted index in air quality guidelines.

2.4. Health Risks

Elevated ozone levels have been linked to health risks in short-term and prolonged exposure cases [34,35]. In this study, we estimated the relative risk associated with long-term ozone exposure, using a log-linear human health impact function (HIF) [36]. The HIF here specifically considers respiratory diseases as the health outcome of human exposure to ozone [37,38].
R R = e β x x 0 ,         x > x 0 1 ,                               x x 0
Δ M = y 0 × P o p × R R 1 R R
where RR is the relative risk associated with long-term ozone exposure; β is the concentration–response factor in HIF; x represents the annual average of daily MDA8 ozone concentration (μg m−3); x0 denotes the threshold value for respiratory diseases health endpoint [23,39]; ΔM represents the premature mortality for respiratory diseases regarding ozone exposure; Pop is the total population exposed to ozone in the assessed region; and y0 is the baseline mortality rate of the specific health endpoint. β (=0.00196) and x0 (=70) were adjusted based on Wang et al. [23]. y0 (=134.8 × 10⁻⁵) was adjusted based on Maji et al. [40]. It is important to note that the HIF relies primarily on cohort studies conducted in North America and Western Europe, such as those involving active smoking and household air pollution cohorts. Adopting parameters directly from their studies may introduce uncertainties.

3. Results

3.1. Spatiotemporal Characteristics of Ozone Pollution and Population

To assess the impact of ozone exposure patterns and spatial patterns in ozone exposure, we employed the multi-year average of the MDA8 ozone concentrations from 2014 to 2020 for our analysis (Figure 2). Our findings reveal a gradual increase in ozone pollution levels across Central China, with the highest concentrations observed in the northeast and the lowest in the southwest (Figure 2a). Consistent with previous studies [2,41], the 7-year average MDA8 values in the northeast and east-central regions exceed the grade I national standard 100 (μg m−3). These areas face significant challenges and substantial pressures regarding ozone exposure, with heavy ozone pollution prevailing. Most of northeastern Central China suffers heavy ozone pollution, suffering severe challenges and significant pressures regarding ozone exposure. In contrast, as we move towards the southwest, where mountainous regions are located, the 7-year average MDA8 values in southern and western Central China remain below 80 (μg m−3).
The spatial distribution of the population in the region under investigation demonstrates distinct patterns (Figure 2b). The northeastern part of Central China stands out as an area characterized by a substantial concentration of population, exhibiting a consistently high average population density surpassing 1000 (people km−2) over a considerable geographical extent. Furthermore, the eastern central and southeastern regions also exhibit significant population concentrations, with numerous areas hosting an average population density of more than 400 (people km−2). In contrast, the western region shows relatively sparse population settlement, with fewer than 100 (people km−2).
We analyzed the probability distribution function (PDF) of ozone levels across the entire research domain from 2014 to 2020 (Table 1). Generally, the ozone levels are primarily concentrated within the intervals of 50 to 70 (μg m−3), 70 to 90 (μg m−3), and 90 to 110 (μg m−3), with probabilities ranging from 20% to 35%. In contrast, ozone levels in other intervals are predominantly below 15%. Notably, the occurrence of extremely high ozone levels (>130 (μg m−3)) in 2019 and 2020 exceeded 15%, which is significantly higher compared with the period of 2014 to 2015 (<7%). This suggests a notable increase in ozone pollution extremes, particularly in 2019, with 22% of the highest extreme ozone levels surpassing 130 (μg m−3). The observed decrease in extremely high ozone levels (>130 (μg m−3)) can be attributed to the rapid recovery of ozone concentrations during the COVID-19 lockdown, as reflected in the MDA8 ground-level ozone dataset [24].
We check the cumulative probability distribution function (PDF) (Figure 3a) of ozone levels across the entire research domain from 2014 to 2020. Generally, the cumulative PDF curves reveal a rightward shift year by year, except in 2020. The rightward shifts of cumulative PDF indicate a deterioration in the MDA8 ozone values across regions from 2014 to 2019. Moreover, the likelihood of exceeding the annual MDA8 ozone concentration threshold of 70 (μg m−3), which is recognized as a critical value for respiratory diseases [23,39], exhibited an increasing trend from 64% to 79% between 2014 and 2017. Subsequently, it remained relatively stable at approximately 80% (Figure 3b). These observations suggest a significant annual health risk associated with ozone exposure, with even greater severity observed from 2017 to 2020.

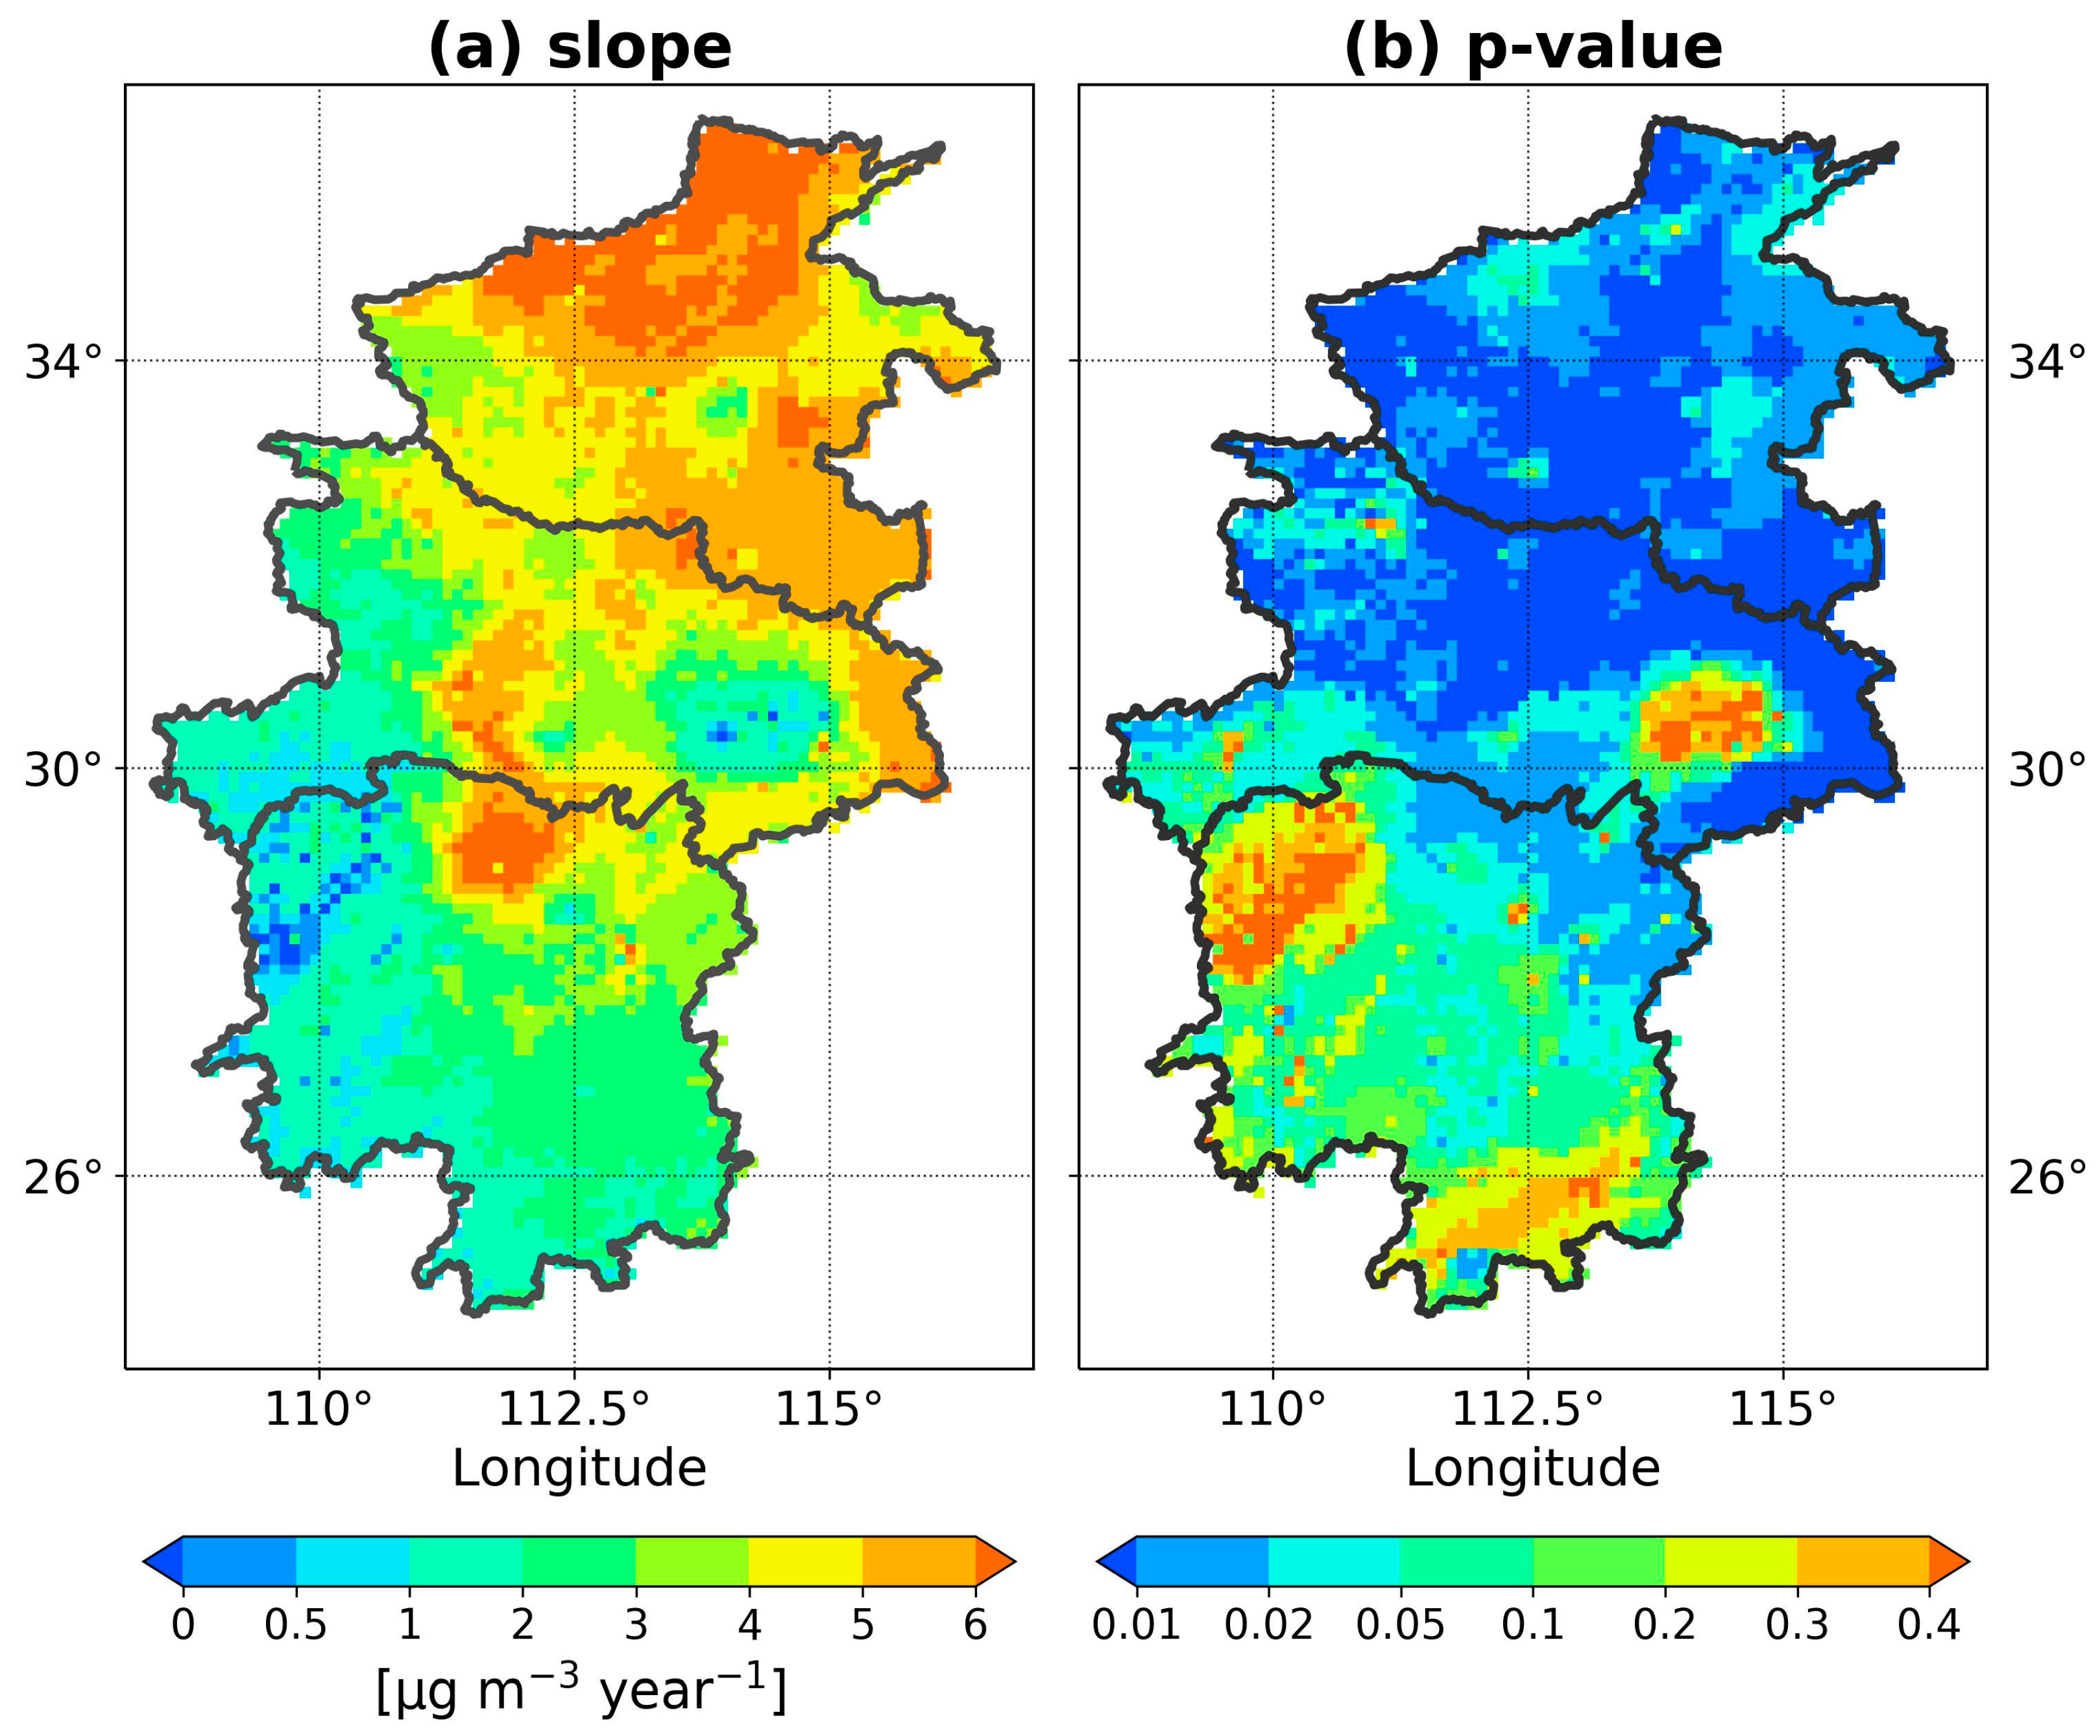
3.2. The Trend of Ozone Levels in Central China

Figure 4 illustrates the trend analysis of MDA8 ozone levels employing the Theil–Sen and Mann–Kendall statistical methods. From 2014 to 2020, the annual ozone concentrations exhibited distinctive spatiotemporal patterns and substantial variations across Central China. In Central China, the average annual MDA8 ozone concentrations exhibited an increasing trend, rising from 80.1 ± 7.5 (μg m−3) in 2014 to 101.2 ± 12.1 (μg m−3) in 2019 (Table S2). It is worth highlighting that the spatial distribution of interannual trends in MDA8 ozone concentrations from 2014 to 2020 revealed a significant upward pattern, with positive slope values, in approximately 99.6% of the regions, while only 0.4% of the regions displayed a decreasing trend, with negative slope values, in annual ozone concentration (Figure 4a).
The MDA8 ozone levels exhibit a generally increasing trend in Central China, with positive Theil–Sen slopes exceeding 1.0, except for a small southwestern area with negative Theil–Sen slopes (Figure 4a). The most pronounced increase in MDA8 ozone levels is observed in northern Central China and a central region, with Theil–Sen slopes exceeding 6.0 between 2014 and 2020. This indicates a clear northward shift of MDA8 ozone pollution. Moreover, the increasing trend of ozone levels is statistically significant in most cases, with 68.7% of the Mann–Kendall test p-value below 0.05. However, the decreasing trends observed in southwestern Central China and east-central regions are not statistically significant, as their p-values exceed 0.3 (Figure 4b). Similarly, in southern Central China, the increasing trend of ozone levels is also not statistically significant, with a p-value greater than 0.05 (Figure 4b). By considering pixels with significant trends, the average increase in MDA8 ozone concentration ranges from 0 to 8 (μg m−3 year−1), accompanied by an average annual increase of 0 to 10%. These trends exhibit spatial patterns similar to those observed in Central China (Figure S1). The regional average increase in MDA8 ozone concentration is found to be 3.5 (μg m−3 year−1), representing a 4.4% annual increase in ozone, which aligns with previous studies reporting annual increases in ozone concentration ranging from 1 to 3 ppb [3] and 4.5% across China [20].

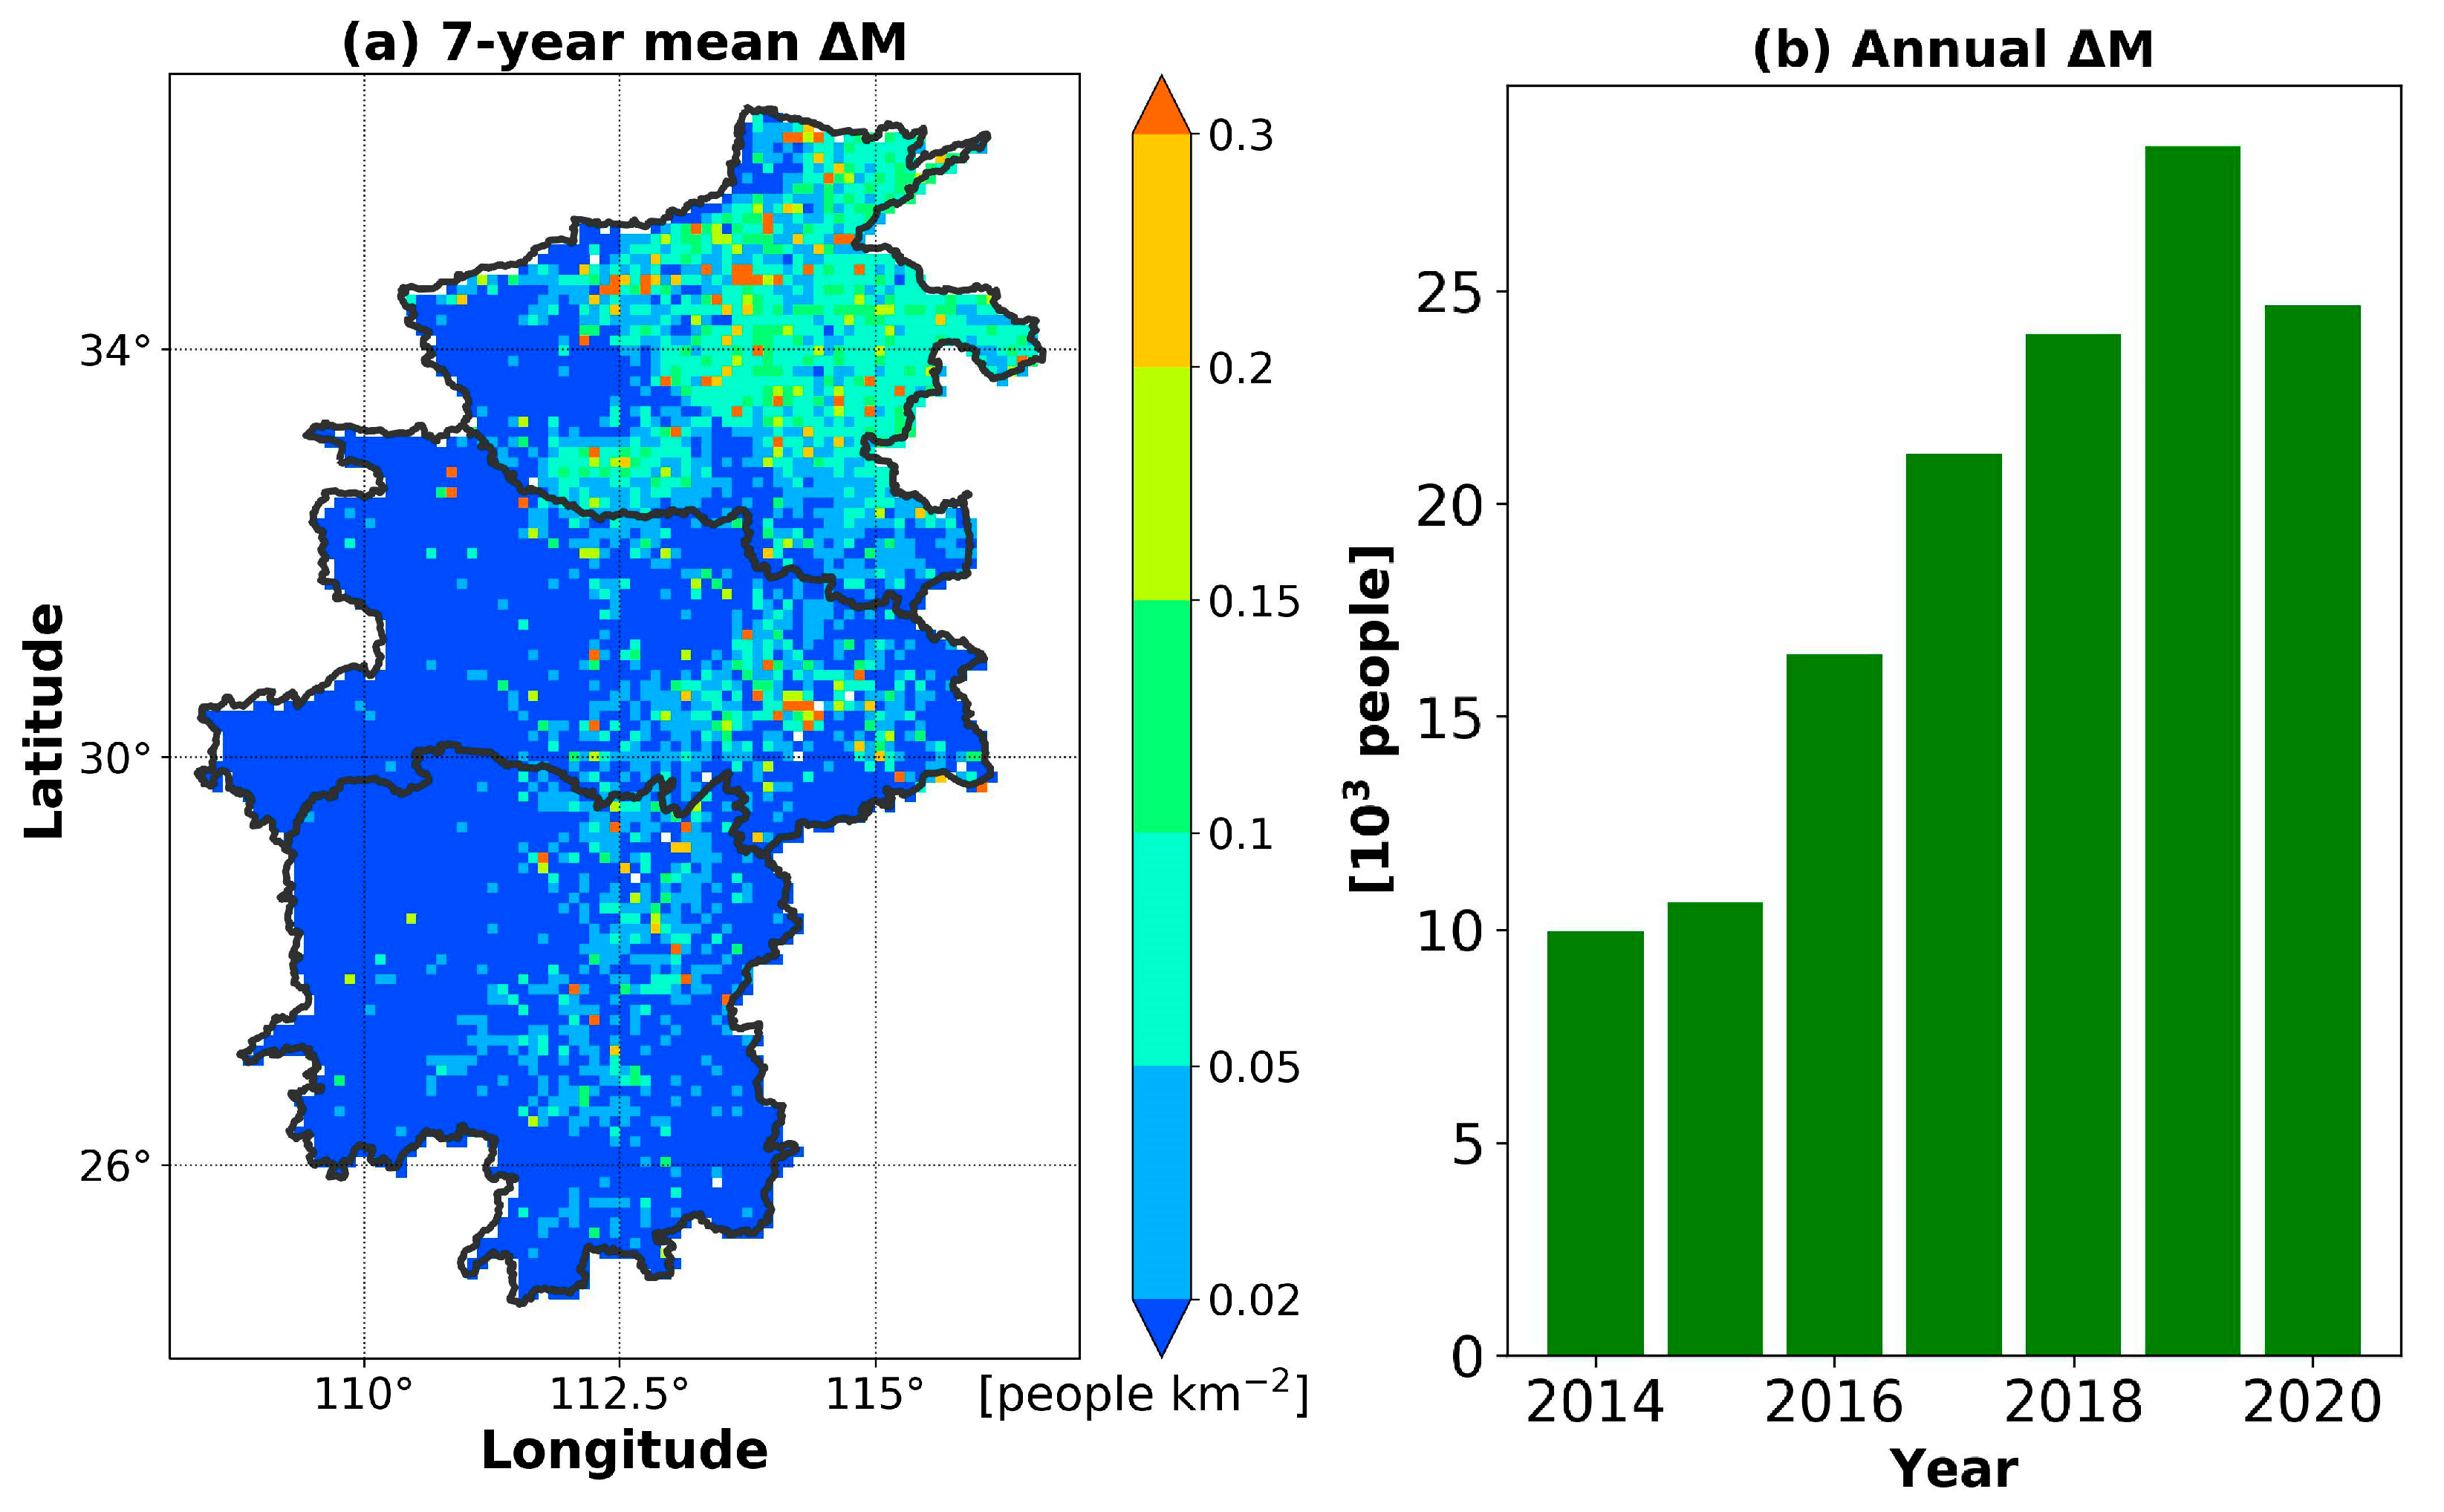
3.3. Health Risks Due to Prolonged Ozone Exposure

Premature mortality due to ozone pollution is almost linearly proportional to ozone levels and the size of the exposed population based on previous studies (Equations (1) and (2)). As ozone concentrations rise and the exposed population increases, the number of premature deaths also increases (Figure S2). To discuss the health impacts of ambient ozone exposure on respiratory diseases in Central China, we conducted a study focusing on premature mortality associated with long-term ozone exposure. Figure 5 displays the average annual premature mortality due to ozone exposure (Figure S3) from 2014 to 2020. The spatial pattern reveals a distinct clustering of higher-risk areas within regions characterized by high ozone pollution levels and dense populations, particularly in the northeastern part of Central China. These areas’ 7-year average mortality rate exceeds 0.1 (people km−2). The higher mortality rates observed in Central China’s northern and eastern regions can be attributed to the larger population and, consequently, a higher population exposed to hazardous ozone concentrations. Conversely, in areas with lower ozone pollution and lower population density, the 7-year average mortality rate is generally below 0.02 (people km−2) (Figure 5a). These spatial patterns of health risks effectively illustrate the regional distribution of premature mortality associated with respiratory diseases resulting from long-term ozone exposure.
The estimated annual premature mortality (ΔM) due to ozone exposure in Central China reveals a stable upward trend, rising from 10.0 thousand to 28.4 thousand (Figure 5b). However, this trend shifted in 2020, with a decline in annual premature mortalities to 24.7 thousand compared with the previous year.

4. Discussions

During the study period, areas with high ozone concentrations and dense populations around the megacities were concentrated. This spatial pattern aligns with previous in situ investigations of ozone and population [21]. As a result of long-term industrial development and urbanization, these areas have become characterized by high background ozone concentrations and severe pollution in Central China and exhibit a high population density [42,43]. The spatial clustering of dense populations can primarily be attributed to the economic and industrial growth of the cities [44]. Consequently, the northeastern region faces an amplified risk of ozone exposure due to the consistent spatial distribution patterns of ozone pollution and population density, which exhibit significant variability in both high and low values.
The ozone levels in northeastern Central China demonstrate a notable upward trend, particularly in terms of high MDA8 ozone concentration, and correspond to densely populated areas (Figure 2). Our results are consistent with previous studies that have reported a significant increase in ozone levels throughout China in recent years [3,41]. The trend analysis reveals that the regions of Henan, Hubei, and northern Hunan provinces consistently exhibit hotspots with substantial increases in ozone concentrations. These results align with the findings of earlier studies conducted by Yang et al. [20] and Lyu et al. [21], which also observed an evident rise in MDA8 values in Henan and Hubei provinces.
The increasing trend in annual total mortality aligns with the rise in ozone pollution during the same period. Conversely, the decline in annual mortality in 2020 corresponds to the occurrence of extreme ozone pollution levels (>130 (μg m−3)) in 2020 (Figure 4a). This decline can be attributed to the rapid recovery of ozone concentrations from the COVID-19 lockdown, as observed in the MDA8 ground-level ozone dataset [24]. Other studies have reported similar findings regarding the annual variation of ΔM from ozone influenced by the COVID-19 pandemic [21].
The assessed ozone-related ΔM obtained in our study is compared to previous investigations on mortality resulting from ozone exposure in China (Table 2). Previous studies have reported annual ΔM estimates for Central China ranging from 3.1 to 22.5 thousand, reflecting substantial uncertainties. The magnitude of ozone-related ΔM is influenced by various factors, including the methodologies employed to simulate or obtain ozone concentration data, variations in baseline mortality rates, differences in population densities, and the use of different relative risk functions (Equation (1)) for the assessment.
Annual premature mortality shows weak correlations with specific indicators of annual population and ozone levels (Figure S4). The ground-level ozone measurements or population density alone are insufficient to accurately determine the annual premature mortality due to ozone exposure. Ozone exhibited a weaker linear correlation than population (Figure S4 and Table S3) due to a baseline mortality threshold value for respiratory disease health endpoint ((70 μg m−3)). The pixel-based correlations between annual premature mortality and the annual population or ozone levels (Figure S4) are lower than those estimated for regional averages (Figure S5). This disparity can be attributed to the pronounced inherent heterogeneity in the spatial distribution of population and ozone concentrations.
The spatial distribution characteristics of the ΔM due to ozone pollution in Central China from 2014 to 2020 were similar to those of ozone pollution, which also showed a spatial pattern of high in the north, low in the south, high in the east, and low in the west. These results indicate that the health effects of ozone pollution in Central China are mainly controlled by the spatial distribution of ozone pollution, which may also be related to the higher population density in northern and eastern Central China and the more serious ozone pollution in these areas. The annual changes of ΔM are highly consistent with the trend of ozone levels, with the correlation coefficient R as high as 0.997 [21] (Figure S5a). There is also a high correlation between annual ΔM and the total population, with a correlation coefficient of 0.971 (Figure S5b). The annual ΔM perform with an increasing trend from 2014 to 2019 and a decline in 2020, as well as with ozone levels and annual population. We found that both the ozone levels and population affect the ΔM from ozone exposure. With the obvious trend of population aging in China [49,50], the population is likely to increase the weight of influence on premature mortality due to ozone pollution in the future.
When considering the same baseline mortality rates ( x 0 = 70 (μg m−3)), our estimated annual ΔM (19.3 thousand) due to ozone exposure aligns with the magnitude between the findings of Yang et al. [20] and Lyu et al., [21], who reported ΔM values of 21.8 and 6.9 thousand premature mortalities, respectively (Table 2). Our estimated ΔM exhibits greater consistency with those of Yang et al. [20] than with those of Lyu et al. [21]. This alignment may stem from the shared use of the ozone dataset (ChinaHighO3). Our study focuses exclusively on ΔM associated with respiratory diseases resulting from long-term ozone exposure as a baseline for all-cause mortality in China was unavailable. Consequently, there is a possibility that the relative health risk has been underestimated.

5. Conclusions

This study analyzes the spatiotemporal characteristics of ozone pollution in Central China and identifies resultant higher-risk areas and trends for premature mortality. The ozone pollution performs with an obvious increase trend from 2014 to 2019 and changed to decline in 2020. The resultant premature mortalities show the same trend with ozone levels and regional populations. The research emphasizes the premature mortality due to ozone exposure affected by both ozone levels and the exposed population with high correlation coefficients exceeding 0.95. The coexistence of high population density and high ozone levels resulted in higher premature mortality in the northeastern, eastern, and southeastern parts of Central China.
This research emphasizes the dynamic nature of ozone pollution and its impacts on human health over time, highlighting the potential increase of ozone impact on the aging trend of the population in China and the importance of mitigation measures to alleviate ozone-related health risks. Overall, this research enhances our understanding of the impact of ozone pollution on human health in Central China and underscores the need for further investigation and comprehensive measures to mitigate these health risks.

Supplementary Materials

The following supporting information can be downloaded at: https://www.mdpi.com/article/10.3390/atmos14101591/s1, Figure S1: The spatial patterns of annual changes in MDA8 ozone concentration from 2014 to 2020, including formats of (a) mass concentration and (b) percentage.; Figure S2: The correlations between premature mortality and ozone levels as well as exposed population.; Figure S3: The spatial patterns of annual premature mortality attributed to ozone exposure for respiratory diseases from 2014 to 2020.; Figure S4: The overall regional correlation between the annual premature mortality and (a) ozone levels and (b) the annual population, as assessed across all grid points in Central China from 2014 to 2020.; Figure S5: Annual variations of premature mortality, regional average ozone levels, and total population in Central China from 2014 to 2020. Table S1: The study area, ozone and population dataset used in this study. Table S2: Average annual MDA8 O3 concentration (μg m−3) of entire Central China from 2014 to 2020.; Table S3: The R-squared values between the annual premature mortality and the annual population and ozone levels, as assessed across all grid points in Central China from 2014 to 2020.

Author Contributions

Conceptualization, Y.T., X.L. and C.W.; methodology, Y.T.; validation, Y.H., H.C., X.Q., Y.X. and Y.C.; writing—original draft preparation, Y.T. and X.L.; writing—review and editing, X.L.; funding acquisition, Y.W. and C.W. All authors have read and agreed to the published version of the manuscript.

Funding

This research was funded the Open Fund of the State Key Laboratory of Loess and Quaternary Geology (SKLLOG2219), the Key Laboratory for Digital Land and Resources of Jiangxi Province, East China University of Technology (DLLJ202205), the Key R&D Plan of Jiangxi Provincial Department of Science and Technology (20203BBG72W011), the DNL Cooperation Fund, Chinese Academy of Sciences (DNL202025), the Shanghai Science and Technology Committee, China (22dz1208702, 22dz1207503), and the Pudong New Area Science and Technology Development Fund (PKJ2021-C11, PKJ2022-C03).

Institutional Review Board Statement

Not applicable.

Informed Consent Statement

Not applicable.

Data Availability Statement

The research data used for all the results in the study are available at SCIENCE DATA BANK via https://www.scidb.cn/s/AFFVnq.

Acknowledgments

We thank the National Tibetan Plateau Data Center for providing the ChinaHighO3 dataset (https://doi.org/10.5281/zenodo.4400042).

Conflicts of Interest

The authors declare no conflict of interest.

References

  1. Li, A.; Zhou, Q.; Xu, Q. Prospects for ozone pollution control in China: An epidemiological perspective. Environ. Pollut. 2021, 285, 117670. [Google Scholar] [CrossRef] [PubMed]
  2. Lu, X.; Hong, J.; Zhang, L.; Cooper, O.R.; Schultz, M.G.; Xu, X.; Wang, T.; Gao, M.; Zhao, Y.; Zhang, Y. Severe surface ozone pollution in China: A global perspective. Environ. Sci. Technol. Lett. 2018, 5, 487–494. [Google Scholar] [CrossRef]
  3. Li, K.; Jacob, D.J.; Shen, L.; Lu, X.; De Smedt, I.; Liao, H. Increases in surface ozone pollution in China from 2013 to 2019: Anthropogenic and meteorological influences. Atmos. Chem. Phys. 2020, 20, 11423–11433. [Google Scholar] [CrossRef]
  4. An, Z.; Huang, R.-J.; Zhang, R.; Tie, X.; Li, G.; Cao, J.; Zhou, W.; Shi, Z.; Han, Y.; Gu, Z. Severe haze in northern China: A synergy of anthropogenic emissions and atmospheric processes. Proc. Natl. Acad. Sci. USA 2019, 116, 8657–8666. [Google Scholar] [CrossRef] [PubMed]
  5. Li, G.; Bei, N.; Cao, J.; Wu, J.; Long, X.; Feng, T.; Dai, W.; Liu, S.; Zhang, Q.; Tie, X. Widespread and persistent ozone pollution in eastern China during the non-winter season of 2015: Observations and source attributions. Atmos. Chem. Phys. 2017, 17, 2759–2774. [Google Scholar] [CrossRef]
  6. Wang, T.; Xue, L.; Brimblecombe, P.; Lam, Y.F.; Li, L.; Zhang, L. Ozone pollution in China: A review of concentrations, meteorological influences, chemical precursors, and effects. Sci. Total Environ. 2017, 575, 1582–1596. [Google Scholar] [CrossRef]
  7. Yu, R.; Lin, Y.; Zou, J.; Dan, Y.; Cheng, C. Review on atmospheric Ozone pollution in China: Formation, spatiotemporal distribution, precursors and affecting factors. Atmosphere 2021, 12, 1675. [Google Scholar] [CrossRef]
  8. Feng, Z.; De Marco, A.; Anav, A.; Gualtieri, M.; Sicard, P.; Tian, H.; Fornasier, F.; Tao, F.; Guo, A.; Paoletti, E. Economic losses due to ozone impacts on human health, forest productivity and crop yield across China. Environ. Int. 2019, 131, 104966. [Google Scholar] [CrossRef]
  9. Manisalidis, I.; Stavropoulou, E.; Stavropoulos, A.; Bezirtzoglou, E. Environmental and health impacts of air pollution: A review. Front. Public Health 2020, 8, 14. [Google Scholar] [CrossRef]
  10. WHO Organization. Million Deaths Annually Linked to Air Pollution. Available online: https://www.who.int/news/item/25-03-2014-7-million-premature-deaths-annually-linked-to-air-pollution (accessed on 21 May 2023).
  11. Di, Q.; Wang, Y.; Zanobetti, A.; Wang, Y.; Koutrakis, P.; Choirat, C.; Dominici, F.; Schwartz, J.D. Air pollution and mortality in the Medicare population. N. Engl. J. Med. 2017, 376, 2513–2522. [Google Scholar] [CrossRef]
  12. Shang, Y.; Sun, Z.; Cao, J.; Wang, X.; Zhong, L.; Bi, X.; Li, H.; Liu, W.; Zhu, T.; Huang, W. Systematic review of Chinese studies of short-term exposure to air pollution and daily mortality. Environ. Int. 2013, 54, 100–111. [Google Scholar] [CrossRef] [PubMed]
  13. Park, M.; Luo, S.; Kwon, J.; Stock, T.H.; Delclos, G.; Kim, H.; Yun-Chul, H. Effects of air pollution on asthma hospitalization rates in different age groups in metropolitan cities of Korea. Air Qual. Atmos. Health 2013, 6, 543–551. [Google Scholar] [CrossRef] [PubMed]
  14. Ko, F.W.; Tam, W.; Wong, T.W.; Lai, C.; Wong, G.; Leung, T.F.; Ng, S.; Hui, D. Effects of air pollution on asthma hospitalization rates in different age groups in Hong Kong. Clin. Exp. Allergy 2007, 37, 1312–1319. [Google Scholar] [CrossRef]
  15. Nuvolone, D.; Petri, D.; Voller, F. The effects of ozone on human health. Environ. Sci. Pollut. Res. 2018, 25, 8074–8088. [Google Scholar] [CrossRef] [PubMed]
  16. Zhan, C.; Xie, M.; Liu, J.; Wang, T.; Xu, M.; Chen, B.; Li, S.; Zhuang, B.; Li, M. Surface ozone in the Yangtze River Delta, China: A synthesis of basic features, meteorological driving factors, and health impacts. J. Geophys. Res. Atmos. 2021, 126, e2020JD033600. [Google Scholar] [CrossRef]
  17. Yin, C.; Deng, X.; Zou, Y.; Solmon, F.; Li, F.; Deng, T. Trend analysis of surface ozone at suburban Guangzhou, China. Sci. Total Environ. 2019, 695, 133880. [Google Scholar] [CrossRef]
  18. Wang, Y.; Wild, O.; Chen, X.; Wu, Q.; Gao, M.; Chen, H.; Qi, Y.; Wang, Z. Health impacts of long-term ozone exposure in China over 2013–2017. Environ. Int. 2020, 144, 106030. [Google Scholar] [CrossRef]
  19. Meng, X.; Wang, W.; Shi, S.; Zhu, S.; Wang, P.; Chen, R.; Xiao, Q.; Xue, T.; Geng, G.; Zhang, Q. Evaluating the spatiotemporal ozone characteristics with high-resolution predictions in mainland China, 2013–2019. Environ. Pollut. 2022, 299, 118865. [Google Scholar] [CrossRef]
  20. Yang, L.; Hong, S.; Mu, H.; Zhou, J.; He, C.; Wu, Q.; Gong, X. Ozone exposure and health risks of different age structures in major urban agglomerations in People’s Republic of China from 2013 to 2018. Environ. Sci. Pollut. Res. 2023, 30, 42152–42164. [Google Scholar] [CrossRef]
  21. Lyu, Y.; Wu, Z.; Wu, H.; Pang, X.; Qin, K.; Wang, B.; Ding, S.; Chen, D.; Chen, J. Tracking long-term population exposure risks to PM2.5 and ozone in urban agglomerations of China 2015–2021. Sci. Total Environ. 2023, 854, 158599. [Google Scholar] [CrossRef]
  22. Sahu, S.K.; Liu, S.; Liu, S.; Ding, D.; Xing, J. Ozone pollution in China: Background and transboundary contributions to ozone concentration & related health effects across the country. Sci. Total Environ. 2021, 761, 144131. [Google Scholar] [PubMed]
  23. Wang, F.; Qiu, X.; Cao, J.; Peng, L.; Zhang, N.; Yan, Y.; Li, R. Policy-driven changes in the health risk of PM2.5 and O3 exposure in China during 2013–2018. Sci. Total Environ. 2021, 757, 143775. [Google Scholar] [CrossRef] [PubMed]
  24. Wei, J.; Li, Z.; Li, K.; Dickerson, R.R.; Pinker, R.T.; Wang, J.; Liu, X.; Sun, L.; Xue, W.; Cribb, M. Full-coverage mapping and spatiotemporal variations of ground-level ozone (O3) pollution from 2013 to 2020 across China. Remote Sens. Environ. 2022, 270, 112775. [Google Scholar] [CrossRef]
  25. Shi, Y.; Matsunaga, T.; Yamaguchi, Y.; Li, Z.; Gu, X.; Chen, X. Long-term trends and spatial patterns of satellite-retrieved PM2. 5 concentrations in South and Southeast Asia from 1999 to 2014. Sci. Total Environ. 2018, 615, 177–186. [Google Scholar] [CrossRef]
  26. Fleming, Z.L.; Doherty, R.M.; Von Schneidemesser, E.; Malley, C.S.; Cooper, O.R.; Pinto, J.P.; Colette, A.; Xu, X.; Simpson, D.; Schultz, M.G. Tropospheric Ozone Assessment Report: Present-day ozone distribution and trends relevant to human health. Elem. Sci. Anthr. 2018, 6, 12. [Google Scholar] [CrossRef]
  27. Chervenkov, H.; Slavov, K. Theil-Sen estimator vs. ordinary least squares–trend analysis for selected ETCCDI climate indices. Comptes Rendus Acad. Bulg. Sci. 2019, 72, 47–54. [Google Scholar]
  28. Alhaji, U.; Yusuf, A.; Edet, C.; Oche, C.O.; Agbo, E. Trend analysis of temperature in Gombe state using Mann Kendall trend test. J. Sci. Res. Rep. 2018, 20, 1–9. [Google Scholar] [CrossRef]
  29. Mondal, A.; Kundu, S.; Mukhopadhyay, A. Rainfall trend analysis by Mann-Kendall test: A case study of north-eastern part of Cuttack district, Orissa. Int. J. Geol. Earth Environ. Sci. 2012, 2, 70–78. [Google Scholar]
  30. Wang, X.; Yu, Q. Unbiasedness of the Theil–Sen estimator. Nonparametric Stat. 2005, 17, 685–695. [Google Scholar] [CrossRef]
  31. Peng, H.; Wang, S.; Wang, X. Consistency and asymptotic distribution of the Theil–Sen estimator. J. Stat. Plan. Inference 2008, 138, 1836–1850. [Google Scholar] [CrossRef]
  32. Hussain, M.; Mahmud, I. pyMannKendall: A python package for non parametric Mann Kendall family of trend tests. J. Open Source Softw. 2019, 4, 1556. [Google Scholar] [CrossRef]
  33. Amirataee, B.; Zeinalzadeh, K. Trends analysis of quantitative and qualitative changes in groundwater with considering the autocorrelation coefficients in west of Lake Urmia, Iran. Environ. Earth Sci. 2016, 75, 371. [Google Scholar] [CrossRef]
  34. Carey, I.M.; Atkinson, R.W.; Kent, A.J.; Van Staa, T.; Cook, D.G.; Anderson, H.R. Mortality associations with long-term exposure to outdoor air pollution in a national English cohort. Am. J. Respir. Crit. Care Med. 2013, 187, 1226–1233. [Google Scholar] [CrossRef] [PubMed]
  35. Zhao, N.; Pinault, L.; Toyib, O.; Vanos, J.; Tjepkema, M.; Cakmak, S. Long-term ozone exposure and mortality from neurological diseases in Canada. Environ. Int. 2021, 157, 106817. [Google Scholar] [CrossRef] [PubMed]
  36. Beckerman, B.S.; Jerrett, M.; Serre, M.; Martin, R.V.; Lee, S.-J.; Van Donkelaar, A.; Ross, Z.; Su, J.; Burnett, R.T. A hybrid approach to estimating national scale spatiotemporal variability of PM2.5 in the contiguous United States. Environ. Sci. Technol. 2013, 47, 7233–7241. [Google Scholar] [CrossRef] [PubMed]
  37. Anenberg, S.C.; Horowitz, L.W.; Tong, D.Q.; West, J.J. An estimate of the global burden of anthropogenic ozone and fine particulate matter on premature human mortality using atmospheric modeling. Environ. Health Perspect. 2010, 118, 1189–1195. [Google Scholar] [CrossRef]
  38. Zhang, Z.; Yao, M.; Wu, W.; Zhao, X.; Zhang, J. Spatiotemporal Assessment of Health Burden and Economic Losses attributable to short-term exposure to Ozone during 2015–2018 in China. BMC Public Health 2021, 21, 1069. [Google Scholar] [CrossRef]
  39. Guan, Y.; Xiao, Y.; Wang, Y.; Zhang, N.; Chu, C. Assessing the health impacts attributable to PM2.5 and ozone pollution in 338 Chinese cities from 2015 to 2020. Environ. Pollut. 2021, 287, 117623. [Google Scholar] [CrossRef]
  40. Maji, K.J.; Ye, W.-F.; Arora, M.; Nagendra, S.S. PM2.5-related health and economic loss assessment for 338 Chinese cities. Environ. Int. 2018, 121, 392–403. [Google Scholar] [CrossRef]
  41. Li, K.; Jacob, D.J.; Liao, H.; Shen, L.; Zhang, Q.; Bates, K.H. Anthropogenic drivers of 2013–2017 trends in summer surface ozone in China. Proc. Natl. Acad. Sci. USA 2019, 116, 422–427. [Google Scholar] [CrossRef]
  42. Madaniyazi, L.; Nagashima, T.; Guo, Y.; Pan, X.; Tong, S. Projecting ozone-related mortality in East China. Environ. Int. 2016, 92, 165–172. [Google Scholar] [CrossRef] [PubMed]
  43. Sun, Z.; Yang, L.; Bai, X.; Du, W.; Shen, G.; Fei, J.; Wang, Y.; Chen, A.; Chen, Y.; Zhao, M. Maternal ambient air pollution exposure with spatial-temporal variations and preterm birth risk assessment during 2013–2017 in Zhejiang Province, China. Environ. Int. 2019, 133, 105242. [Google Scholar] [CrossRef]
  44. Weng, Q.; Yang, S. Managing the adverse thermal effects of urban development in a densely populated Chinese city. J. Environ. Manag. 2004, 70, 145–156. [Google Scholar] [CrossRef] [PubMed]
  45. Liu, H.; Liu, S.; Xue, B.; Lv, Z.; Meng, Z.; Yang, X.; Xue, T.; Yu, Q.; He, K. Ground-level ozone pollution and its health impacts in China. Atmos. Environ. 2018, 173, 223–230. [Google Scholar] [CrossRef]
  46. Seltzer, K.M.; Shindell, D.T.; Malley, C.S. Measurement-based assessment of health burdens from long-term ozone exposure in the United States, Europe, and China. Environ. Res. Lett. 2018, 13, 104018. [Google Scholar] [CrossRef]
  47. Shindell, D.; Faluvegi, G.; Seltzer, K.; Shindell, C. Quantified, localized health benefits of accelerated carbon dioxide emissions reductions. Nat. Clim. Chang. 2018, 8, 291–295. [Google Scholar] [CrossRef]
  48. Maji, K.J.; Namdeo, A. Continuous increases of surface ozone and associated premature mortality growth in China during 2015–2019. Environ. Pollut. 2021, 269, 116183. [Google Scholar] [CrossRef]
  49. Tu, W.-J.; Zeng, X.; Liu, Q. Aging tsunami coming: The main finding from China’s seventh national population census. Aging Clin. Exp. Res. 2022, 34, 1159–1163. [Google Scholar] [CrossRef]
  50. Liu, X.; Zhu, J.; Zou, K. The development trend of China’s aging population: A forecast perspective. Complex Intell. Syst. 2022, 8, 3463–3478. [Google Scholar] [CrossRef]
Figure 1. The study area covers Central China and illustrates the topographic and related factors. The green dots indicate the locations of megacities in Central China. The base map of Chinese provincial boundaries was obtained from the Resource and Environment Science and Data Center: https://www.resdc.cn/DOI/DOI.aspx?DOIID=122 (accessed on 21 May 2023). The satellite image was obtained from Esri, Maxar, Earthstar Geographics, and the GIS User Community.
Atmosphere 14 01591 g001
Figure 2. The spatial distribution of (a) average ozone concentration and (b) population density over seven years (2014–2020) in Central China. The base map of Chinese provincial boundaries was obtained from the Resource and Environment Science and Data Center: https://www.resdc.cn/DOI/DOI.aspx?DOIID=122 (accessed on 21 May 2023).
Atmosphere 14 01591 g002
Figure 3. The probability distribution of ozone levels of (a) equal intervals of 20 (μg m−3) and (b) a range with lower and higher boundaries set at 70 (μg m−3) over the entire domain from 2014 to 2020.
Atmosphere 14 01591 g003
Figure 4. The spatial pattern of (a) the Theil–Sen slope and (b) the p-value obtained from the Mann–Kendall test for the annual MDA8 ozone concentration from 2014 to 2020. The base map of Chinese provincial boundaries was obtained from the Resource and Environment Science and Data Center: https://www.resdc.cn/DOI/DOI.aspx?DOIID=122 (accessed on 21 May 2023).
Atmosphere 14 01591 g004
Figure 5. The premature mortality attributed to ozone exposure for respiratory diseases of (a) 7-year average spatial patterns and (b) annual total from 2014 to 2020. The base map of Chinese provincial boundaries was obtained from the Resource and Environment Science and Data Center: https://www.resdc.cn/DOI/DOI.aspx?DOIID=122 (accessed on 21 May 2023).
Atmosphere 14 01591 g005
Table 1. The probability distribution function (PDF) of ozone levels across the entire research domain from 2014 to 2020.
Year2014201520162017201820192020
Ozone Levels
<507%13%6%1%7%3%1%
50–7029%23%24%21%14%19%20%
70–9034%27%27%30%21%17%28%
90–11020%25%20%25%26%24%24%
110–1308%10%16%13%23%15%13%
130–1502%1%6%6%6%13%10%
>1500%0%1%4%3%9%5%
Table 2. Various studies on premature mortality (ΔM) attributed to long-term ozone exposure related to Central China.
Annual ΔM 1 (×103)Temporal CoverageOzone Dataset x 0
(μg m−3)
References
8.12015Ground-level monitoring75.2–112Liu et al. [45]
22.52015Observation derived52.3Seltzer et al. [46]
20.32015Bias-corrected GISS-E252.3Shindell et al. [47]
22.62013–2017Bias-corrected NAQPMS52.3Wang et al. [18]
4.82015WRF-CMAQ simulation100Sahu et al. [22]
5.42016Ground-level monitoring75.2Maji et al. [40]
3.12015–2019Ground-level monitoring52.3Maji and Namdeo [48]
21.82013–2018ChinaHighO370Yang et al. [20]
6.92015–2021Ground-level monitoring70Lyu et al. [21]
19.32014–2020ChinaHighO370This study
x 0 : The theoretical minimum-risk concentration of ozone concentration. 1 The conversion ratio of annual ΔM for Central China and all of China was based on Sahu et al. [17], who calculated ΔM for Central China stood at 4793, constituting 11.2% of the nationwide aggregate (42,673).
Disclaimer/Publisher’s Note: The statements, opinions and data contained in all publications are solely those of the individual author(s) and contributor(s) and not of MDPI and/or the editor(s). MDPI and/or the editor(s) disclaim responsibility for any injury to people or property resulting from any ideas, methods, instructions or products referred to in the content.

