
Estimation of Daily Mean Land Surface Temperature over the Qinghai–Tibet Plateau Based on an RTM-DTC Model


1
Key Laboratory of the Northern Qinghai–Tibet Plateau Geological Processes and Mineral Resources, Xining 810300, China
2
College of Earth Science, Chengdu University of Technology, No. 1, East 3rd Road, Erxianqiao, Chengdu 610059, China;[email protected] (X.Z.)
3
Surveying, Mapping and Geographic Information Center of Sichuan Geological Survey Research Institute, Chengdu 610072, China
*
Author to whom correspondence should be addressed.
Atmosphere 2023, 14(10), 1559; https://doi.org/10.3390/atmos14101559
Submission received: 5 September 2023
/
Revised: 28 September 2023
/
Accepted: 3 October 2023
/
Published: 13 October 2023
(This article belongs to the Section Biosphere/Hydrosphere/Land–Atmosphere Interactions)
Abstract
:Accurately estimating daily mean land surface temperature (LST) is crucial for studying the urban heat island effect, land–atmosphere energy exchange, and global climate change. However, limited research has been conducted on average surface temperature estimation, particularly in high-altitude regions like the Qinghai–Tibet Plateau with extensive cloud cover. In this study, we propose the Reanalysis Data and Thermal Infrared Remote Sensing Data Merging-Diurnal Temperature Cycle (RTM-DTC) model specifically for the Qinghai–Tibet Plateau, successfully estimating mean LST using the model. We apply the RTM method to reconstruct LST under cloud cover from the MODIS LST product and calculate the average temperature using the DTC model. Validation with in situ measurements from seven meteorological stations on the Tibetan Plateau yielded daily scale RMSEs ranging from 1.81 K to 2.021 K and monthly scale RMSEs ranging from 1.77 K to 2.0 K, with an average RMSE of 1.91 K. These results demonstrate the adaptability of the RTM-DTC model and its ability to depict the annual variation curve of the mean surface temperature, and provide further research on RTM-DTC as a valuable approach.
1. Introduction
Land surface temperature (LST) is a very important characteristic physical quantity to characterize the changes in surface processes, and it is a direct driving factor of the land surface–atmosphere energy exchange and a key parameter to regulate the land–atmosphere interaction. LST is widely used in fields of surface energy balance, monitoring regional climate change and resource environment; for example, the estimation of surface soil moisture and evapotranspiration [1,2,3], urban heat islands and climate change [4,5], the carbon–hydrological cycle [6], near-surface air temperature inversion [7,8], drought monitoring [9,10], vegetation cover and land-use cover [11,12,13], and environmental research [14,15]. However, there are still some problems that need to be solved.
The thermal infrared (TIR) LST estimation method is now a relatively mature and highly accurate algorithm. The use of thermal infrared remote sensing data to estimate LST has undergone considerable development for decades. There are some common methods included: single-channel algorithm, multi-channel algorithm, multi-angle algorithm, multi-phase algorithm, hyperspectral inversion algorithm, etc. However, these methods have some deficiencies in the estimation of LST at large regional scale and long-term series, and there are also certain differences in applicability in different regions. Using thermal infrared remote sensing data to estimate surface temperature can result in obtention of high-resolution surface temperature data, but its inversion accuracy is greatly affected by cloud cover. Although the influence of cloud cover can be avoided by using the characteristics of strong microwave penetration under any weather conditions, the surface temperature estimated by microwave data has a low resolution and cannot meet the needs of most studies. Under ideal conditions, if thermal infrared and passive microwave data are combined, high-precision and high-resolution surface temperature data can be estimated [16]. However, there are few studies and still no mature model on this aspect. Compared with the thermal infrared remote sensing observations, the reanalysis data that combine the advantages of observation, remote sensing and simulation have the same advantages as passive microwave remote sensing. Therefore, using reanalysis data instead of passive microwave data combined with thermal infrared data can accurately estimate surface temperature. At the same time, the all-weather LST estimation method integrating reanalysis data and thermal infrared remote sensing data (RTM) has shown good applicability in the Qinghai–Tibet Plateau [17].
In addition, there are still problems that need to be solved urgently in the application of LST. The LST obtained by satellite is the instantaneous value under the condition of clear day, and it cannot represent the “average state” of the LST of the day. Therefore, the “annual mean LST” derived from an annual temperature cycle (ATC) model with an instantaneous LST is not the actual annual mean LST and is difficult to be applied to current climate change and simulation studies. In the study of LST, the surface temperature parameters with clear physical meaning can be obtained if the instantaneous LST estimated by satellite observation data is converted into the daily average surface temperature (Tdm). Compared with the instantaneous observations, the daily average LST can reflect the dynamic changes of the LST more accurately, and is more helpful for the application in the analysis of climate change (warming and cooling trends). Therefore, in the study of climate change, hydrology and so on, the daily, monthly or annual average LST are more valuable than the instantaneous one, because they are the key indicators for monitoring the long-term global LST. Therefore, it is necessary to study the conversion of limited transient LST obtained from satellites to daily average LSTs [18]. In addition, the average LST is also widely used in the field of permafrost change modeling [19,20], surface air temperature estimation and other fields. Therefore, it is very important to convert the instantaneous LST into the average one.
The traditional LST estimation model is used to estimate the average LST by arithmetically averaging the daily maximum and minimum LST obtained by day and night LSTs; alternatively, the daytime (10:30 a.m.) and nighttime (10:30 p.m.) LST from MODIS TERRA is used to calculate mean LST. However, this simple arithmetic averaging method struggles to provide highly accurate daily mean surface temperature estimates. In this study, we also validate the results of this traditional method against weather station data in Section 3.1, which reveals its limitations, with a Root Mean Square Error (RMSE) of 4.394 K. In the past, some scholars used fragment functions to describe the diurnal variation curve of LST, and proposed sine function and cosine function fitting methods to estimate the average LST by simplifying the diurnal variation of temperature [21]. A multiple linear regression model has been proposed to estimate the average surface temperature, but this method is limited by the number of valid daily temperature observations. However, its applicability is restricted to areas with complete datasets featuring all four instantaneous observations. In practical terms, particularly in regions like the Tibetan Plateau with unique climatic and environmental conditions influenced by factors such as sensor availability, cloud cover, and aerosol concentration, the scarcity of MODIS data poses a significant challenge. In many cases, transient observations are limited to only three, two, one, or even zero instances, rendering the method impractical in data-deficient regions. The daily variation of LST is simulated using four valid LST observations for the daily temperature circulation model (DTC) [19,22], and the simulated LST daily variation curve is continuous in time, so the surface mean temperature can be estimated using the DTC simulation results.
Based on the above information, this paper investigates the estimation and application of the mean LST for the Tibetan Plateau, proposing a model based on the surface temperature time decomposition model and the INA08-ts model (proposed by Inamdar et al., where the model replaces the exponential function developed by Göttsche and Olesen with a hyperbolic function) of the thermal infrared and reanalysis data integration of the all-weather surface temperature estimation method (RTM, Reanalysis and thermal infrared remote sensing combined) of the RTM-DTC model. The model enables the estimation and application study of the mean LST of the Tibetan Plateau. The Reanalysis Data and Thermal Infrared Remote Sensing Data Merging-Diurnal Temperature Cycle (RTM-DTC) estimation model proposed in this paper are effective tools for estimating the average LST. In addition to being applicable in the Qinghai–Tibet Plateau, the model is also useful in other regions.
2. Materials and Methods
2.1. Data Source
2.1.1. In Situ Data
The Qinghai–Tibet Plateau is the highest, largest, and has endured the longest among all the plateaus on Earth [23], with an average elevation of more than 4000 m and an area of about 2.5 million square kilometers [24]. It is considered to be the third pole in the world, as well as one of the most sensitive regions to climate change [25]. The Qinghai–Tibet Plateau acts as a heat source in summer and a cold source in winter, directly acting on the middle part of troposphere and affecting the energy exchange between the plateau’s land–atmosphere system [26,27]. The Qinghai–Tibet Plateau is regarded as “the driver and amplifier of global climate change” [28,29,30], “the most natural laboratory for the unified research of global change and earth system science” [31]. It has an important impact on the climate of China, and even around the world, and the study on the plateau climate change has always attracted the attention of scientists [32,33]. A large number of research results show that with the global warming and the frequent occurrence of climate extreme events, the climate of the Qinghai–Tibet Plateau has changed significantly in recent decades, so it is of vital importance to monitor the climate change in the Qinghai–Tibet Plateau.
Surface temperatures on the Tibetan Plateau vary dramatically, with extremely cold winters, which can drop below −40 degrees Celsius at high altitudes, and hot summers, which can exceed 30 degrees Celsius at low altitudes. This huge seasonal temperature difference has a profound impact on the spatial and temporal distribution of surface temperature. At the same time, due to the special geographic location of the Tibetan Plateau, the region is often affected by extreme meteorological events, such as heavy rains, droughts and snowstorms [34]. Studies have shown that the surface temperature of the Tibetan Plateau has been increasing year by year since 2000, a trend that may lead to a high frequency of extreme weather events at the regional scale, with a series of adverse impacts, including global sea level rise, increased risk of coastal flooding, and droughts and floods triggered by precipitation anomalies in East Asia, which can adversely affect, among other things, crop yields [35,36]. However, satellite thermal infrared surface temperature products in areas prone to cloud cover, such as the Tibetan Plateau, have a large amount of missing data in the spatial and temporal dimensions, which limits the application of surface temperature in related fields. Therefore, medium- to high-resolution remotely sensed all-weather surface temperature data are needed to meet the research needs.
To validate the surface temperature, we used long-wave radiation data and MODIS broadband emissivity data from 7 meteorological stations to calculate the measured temperature at the weather station. Formulas (1) and (2) are as follows [37,38,39]:
where and are the upward and downward long-wave radiation, respectively; is the Stefan–Boltzmann constant ; is the broadband emissivity of the site; and are the 31st and 32nd bands of MODIS, respectively.
The meteorological station data used in this paper mainly come from the Qinghai–Tibet Plateau Data Center (http://data.tpdc.ac.cn/zh-hans/) (accessed on 2 September 2023), the China Alpine Surface Process and Research Network (http://www.horn.ac.cn/) (accessed on 2 September 2023); the datasets contain measured four-component radiation data [40,41]. According to the topographical features of the Qinghai–Tibet Plateau, a total of 7 sites which include the main land cover types in the Qinghai–Tibet Plateau were selected as verification data. The average altitude was above 4100 m. The land cover types in the Qinghai–Tibet Plateau are mainly alpine meadows, alpine grasslands and alpine deserts (Figure 1). Due to the fact that the number of surface temperature observation stations in the Tibetan Plateau region is not only small, but also shows the spatial distribution characteristics of dense in the east and sparse in the west, dense in the south and sparse in the north, only seven meteorological stations were selected in this study, and some stations with inaccurate radiation values and surface emissivities were eliminated in the process of selecting meteorological stations, so there are some errors in the radiation values and emissivities of the stations, which affects the accuracy of the model estimation. Due to the difference of monitoring time, the time interval of the Ali Station, the Muztag Station, the Nagqu Station and the Qilianshan Station is one day. The long-wave radiation of these four stations is the average value in one day. The time interval of monitoring the Dasharon Station, the Arou Station and the Yakou Station is 10 min, and the data with the station monitoring time interval of one day refer to the average value of long-wave radiation in one day, and the two have the same effect. Finally, 365 days of data in 2018 are used to verify Tdm (Table 1).
2.1.2. Remote Sensing Data
Integrating satellite thermal infrared remote sensing and passive microwave (MW) has been shown to be a practical and feasible method for estimating all-weather surface temperature. Compared with TIR remote sensing surface temperature data, passive microwave surface temperature can avoid the influence of cloud cover due to the stronger penetration of microwave, but the estimation results have lower resolution [42,43]. And currently, all the methods are focused with the reconstruction of historical archived data, which cannot meet the requirements of real-time or near-real-time (NRT) monitoring of the surface. At the same time, the problem of missing data in the orbit gap region due to the satellite polar orbit operation mode of passive microwave data (e.g., AMSR2) has not been solved well; in other words, the fusion of passive microwave and thermal infrared remote sensing cannot realize the real sense of all weather. Instead of passive microwave data, the reanalysis data, which combine the advantages of observation, remote sensing and simulation, can be used to estimate the surface temperature accurately with thermal infrared data, so some scholars integrated the two and proposed a new surface temperature estimation method, the all-weather surface temperature estimation method (RTM), which integrates the reanalysis data and thermal infrared remote sensing data.
The remote sensing data used in this paper include thermal infrared remote sensing and auxiliary remote sensing data. The thermal infrared remote sensing data are the 6th version of Aqua MODIS 1 km/day land surface temperature/emissivity product (MYD11A1) and Terra MODIS 1 km/day land surface temperature/emissivity product (MOD11A1). These data come from Level-1 and the Atmosphere Archive and Distribution System Distributed Active Archive Center (https://ladsweb.modaps.eosdis.nasa.gov/) (accessed on 2 September 2023).
Auxiliary remote sensing data: (1) 1 km resolution NDVI data (MYD13A2), which come from EARTHDATA (https://earthdata.nasa.gov/) (accessed on 2 September 2023); (2) Daily 1 km resolution surface albedo data (MCD43A3), which are from EARTHDATA (https://earthdata.nasa.gov/) (accessed on 2 September 2023); (3) DEM data at a 250 m resolution, from the Digital Elevation Data website of the American Spatial Information Society (http://srtm.csi.cgiar.org/) (accessed on 2 September 2023).
2.1.3. Reanalysis Data
The reanalysis data used in this study are the Global Land Data Assimilation System (GLDAS) and the China Land Data Assimilation System (CLDAS) land surface temperature and atmospheric water vapor data. The GLDAS data, with a 3 h spatial resolution of 0.25°, come from the Goddard Space Flight Center (GSFC) (http://disc.sci.gsfc.nasa.gov) (accessed on 2 September 2023). The CLDAS, with an hourly resolution of 0.0625°, is from the China Meteorological Service Data Center (http://data.cma.cn/) (accessed on 2 September 2023). Details of the data types and their corresponding data sources can be found in Appendix A, Table A1.
2.2. RTM-DTC Model
MODIS LST is the clear sky land surface temperature, that is, the land surface temperature retrieved from thermal infrared data. It is well known that the land surface thermal radiation is absorbed by the cloud layer under cloudy conditions. On the thermal infrared land surface temperature image, the cloudy part has no effective temperature value and is filled with the background value. Therefore, in the process of estimating mean land surface temperature, the MODIS LST needs to be reconstructed first. The specific steps are as follows (Figure 2):
- (1)
- Data preprocessing is carried out on MOD11A1, reanalysis data (GLDAS), ground measured station data and other auxiliary data; after that, the preprocessed data re used to reconstruct the ground surface temperature under the cloud by the RTM method, and finally, it generates daily 1 km land surface temperature data twice a day, the accuracy of which is verified by the meteorological station data.
- (2)
- In this study, we used the land surface temperature data estimated by the RTM method and the surface temperature data of the day-by-day all-weather surface temperature dataset (TRIMS LST) published by Zhang et al., to generate 1-km surface temperature data four times a day [17].
- (3)
- The DTC modeling is carried out by using the 1 km land surface temperature data generated four times a day, and then the daily variation curve of the land surface temperature is simulated by the DTC model to estimate the average land surface temperature, and the accuracy of the estimation results is verified by the meteorological station data.
2.2.1. Reanalysis and Thermal Infrared Remote Sensing Merging (RTM) Model
The all-weather land surface temperature estimation method is based on the integration of thermal infrared and reanalysis data of the land surface temperature time decomposition model (RTM, Reanalysis and Thermal Infrared Remote Sensing Merging). Its time series of land surface temperature under non-clear sky conditions can be expressed by Formula (3) [17]:
where is the land surface temperature under non-clear sky conditions; is the annual accumulated days in a year; is the recorded observation time of the satellite sensor transit; is the annual average observation time calculated according to , and its unit is set as hours (h); is the sum of the LFC and HFC components for a day under non-clear sky conditions. LFC, HFC and HFCcld are decomposed from thermal infrared and reanalysis data in order to obtain all-weather remote sensing land surface temperature. The RTM method was validated over the Tibetan Plateau and is applied to estimate the mean land surface temperature over the plateau [17].
2.2.2. Four-Parameter Diurnal Temperature Cycle (DTC) Model
Since MODIS polar-orbiting satellites can provide observation information four times a day, the MODIS data can be used to build a 4-parameter DTC model. In order to reduce the parameters to four, of the INA08-ts model, which is suitable for the Tibetan Plateau, is set to one hour before sunset [44]. The formula is as follows:
where and are day and night LST, is the residual temperature before and after sunrise, and is temperature amplitude. is the duration of the day (DD) equal to the width of the half-cycle of the cosine term; it can be expressed as a function of latitude (ϕ) and solar declination (δ). is the time of temperature peak; is free decay start time; is the temperature residuals between and (t→∞); is the decay constant. The model has five free parameters . In order to apply the MODIS LST model, the free parameters must be reduced to 4. On the basis of previous studies, it was proposed to set to one hour before sunset (, where is the sunset time calculated from website https://www.esrl.noaa/gmd/grad/solcalc (accessed on 2 September 2023)) and to call it [44].
2.3. Validation Strategy
The research selects the 2018 estimation result to carry on the precision verification. MOD11A1 emissivity is first extracted and converted into site wide band emissivity by Formula (2), and then combined with the upper long-wave radiation and the lower long-wave radiation provided by the site to converted into site-observed land surface temperature by Formula (1). Finally, the accuracy of the TDM results is evaluated by the parameters of the mean square error (RMSE) and MAE between the estimated TDM results and the observed TDM.
Before the validation, the outliers of the site surface temperature and the inversion surface temperature are eliminated. In order to remove the outliers or the sub-pixel cloud coverage, the samples are filtered through the amplification of the triple standard deviation.
where “bias” is used to invert the difference between the ground surface temperature and the site temperature, and the “” is the median of the difference. When the difference of the sample pair is larger than the difference of or smaller than the difference of , the sample pair is considered as an outlier and not included in the result statistics [45].
3. Results
By comparing the number of clear sky and cloudy days in 2018 at seven sites on the Qinghai–Tibet Plateau (Figure 3), the clear sky condition implies that the four satellite transit times of the MODIS data are clear sky, and if one satellite transit time is not clear sky, it is cloudy. Therefore, when using the RTM model to reconstruct the surface temperature under the cloud in this study, reconstruction is not required only when the four satellite transit times are all clear skies, and the surface temperature needs to be reconstructed for other weather conditions.
3.1. Comparative Analysis of RTM-DTC Model and Traditional Methods
The scatter density plots (Figure 4) are the scatter density plots obtained from the estimation results of the RTM-DTC model and the traditional arithmetic mean estimation method used in this study. The traditional estimation method is estimated by Equation (5), in which only the arithmetic mean is obtained by using the Terra daytime (10:30 a.m.) and night (10:30 p.m.) LST. The predicted values are the estimated results of the RTM-DTC model with the arithmetic averaging method for extracting seven meteorological stations, and the true values are the calculated results of the actual measured surface average temperature at seven meteorological stations. The RMSE of the arithmetic averaging method approach is 4.394 K (Figure 4), while the RMSE of using the RTM-DTC model is 1.909 K. The error of using the RTM-DTC model is much lower than that of the traditional estimation method, so the results prove that the surface average temperature cannot be estimated accurately using the traditional arithmetic averaging method.
3.2. Daily Scale Verification
The error scatterplot for each site (Figure 5) is the result of filtering the estimation results of each station using Equation (5). The scatter plots of the seven stations are represented by (a–g), and the total error scatter plot is represented by Figure 5h, with RMSE of 1.81–2.021 K and total error RMSE of 1.909 K. In Figure 5, the land cover types of the Ali Station and the Mushtag Station are alpine desert, and the RMSEs of the two stations are 2.008 K and 2.021 K, which are over 2.0 K. The RMSEs of the alpine meadow and alpine grassland land cover type stations are between 1.8 K and 1.95 K. The error of the alpine desert land cover type is larger than that of the alpine meadow and alpine grassland land cover types, so the RMSEs of the seven sites show that the estimation error may be related to the land cover type with the Tibetan Plateau region. Meanwhile, the daily scale accuracy verification results in Figure 5a–g show that the accuracy of the surface mean temperature estimated by the RTM method for the reconstruction of the surface temperature under clouds in this study is similar to that of the clear-sky surface mean temperature, and even higher at some stations.
Therefore, the final daily scale validation results show that the RTM model has more satisfactory results for the reconstruction of sub-cloud surface temperature, and the RTM-DTC model has more satisfactory results for the estimation of daily surface mean temperature in the Tibetan Plateau region.
3.3. Monthly Scale Verification
The results of the monthly scale error validation are shown in Figure 6, quantified using the three parameters R2, RMSE and MAE. Figure 6a–g shows the seven meteorological stations with scale error validation, respectively, and the average monthly scale RMSE is between 1.77 K and 2.0 K, which is lower than the daily scale. The average MAE is between 1.45 K and 1.76 K. Figure 6h shows the total error for the seven stations with the RMSE of 1.89 K and the MAE of 1.59 K. The error results in the figure show that the RTM-DTC model is sensitive to the seasons, and in general, the errors are lower in summer and winter, and higher in spring and autumn.
The information of the spatial distribution of the average surface temperature at days 90, 180, 270 and 360 for the Tibetan Plateau estimated by the RTM-DTC model (Figure 7) shows the overall annual trend of the average surface temperature in the Tibetan Plateau region. The average surface temperature at Day 180 is higher than at the other three time points, the average surface temperature at Day 270 is higher than that at Day 90 and the lowest surface temperature at Day 360 in the tie bureau. Figure 8 shows the annual variation curves of the average surface temperature at the seven site locations. The gray curves in the figure are the real values measured at the stations, and the red curves are the estimated values from the RTM-DTC model. The prediction results can basically describe the annual trend of daily surface mean temperature. As can be seen in the figure, the average surface temperature is highest around Day 200, reaching a maximum of over 290 K. The average surface temperature is lowest between Days 0 and 50 and 350 and 365, between 250 K and 260 K. Some stations may be lower, such as the Pass station, reaching even below 240 K.
4. Discussion
In this paper, the RTM-DTC method for the Tibetan Plateau region is proposed on the basis of the ADTC model. Compared with the ATC model, the RTM model uses a greater amount of and more complex auxiliary data for the reconstruction of the under-cloud surface temperature, and it is more advantageous in terms of the image quality and accuracy, and in the selection of the DTC model, the INA08-ts model is more suitable for the study of the estimation of the average surface temperature in the plateau region than the GOT09-dT-τ model. In the estimation study of mean surface temperature in the plateau region, both RTM and DTC models show good applicability and robustness in the Tibetan Plateau region.
Our modeling framework can be integrated with the existing meteorological monitoring system to provide more frequent and accurate estimation of mean daily surface temperature, e.g., local meteorological bureaus can adopt the RTM-DTC method to improve the temperature monitoring in the alpine region, which can help to improve the meteorological forecasts, especially in mountainous areas with frequent meteorological anomaly variations, providing more accurate weather forecasts, which is useful for decision making, transportation management and agricultural activities, which are of practical value. In addition, our methods can be used to monitor surface temperature changes in highland areas, which is important for agricultural resource management. For example, they can adjust crop planting schedules based on surface temperature estimation data to better adapt to climate change. Finally, water resource management could also benefit, as surface temperature is closely linked to processes such as snowmelt and glacial melt, which are critical for water resource management.
However, the Qinghai–Tibet Plateau region suffers from a scarcity of meteorological observation stations, displaying a spatial distribution that is denser in the east and sparser in the west, as well as denser in the south and sparser in the north [46]. This non-uniform station distribution can hinder the verification of estimation results in remote areas, thus challenging the model’s applicability. Furthermore, uncertainties in site radiance values and site surface emissivity estimation may impact LST observation accuracy. Such errors can directly affect result accuracy validation, especially when dealing with various vegetation cover types and different altitude elevations. Consequently, stations with inaccurate radiation values and site surface emissivity are excluded during the meteorological station selection process. Additionally, we select two stations in the sparsely covered western part of China. This selection of seven meteorological stations essentially covers the Tibetan Plateau region, providing a dependable foundation for model accuracy validation.
Nevertheless, there are still some shortcomings that need to be strengthened in future research. The selection of the DTC model is also the key to the estimation of the mean surface temperature. The four-parameter DTC model requires only the daily 4-hourly surface temperature observations. First, if there is a DTC model with higher accuracy, the estimation accuracy can be further improved, and second, if there are more LST observations within the day, then the accuracy of the parameter calculation of the DTC model can be improved, which can improve the estimation accuracy of the model.
5. Conclusions
The Tibetan Plateau is one of the most sensitive regions to global climate change, and its topography and thermal effects have a huge impact on global climate. However, due to the inhomogeneity of the surface and the uneven distribution of meteorological observatories, existing commercial products cannot meet the demand for surface temperature in this region. Therefore, we propose an RTM-DTC mean surface temperature estimation model which utilizes a greater amount of and more efficient ancillary data to reconstruct the sub-cloud surface temperature. The model shows large advantages in terms of spatial and temporal resolution, image quality and accuracy.
In the selection of DTC models, we find that the INA08-ts model is more suitable for studying the average surface temperature in the plateau region compared with other models. Through the validation, the RMSE of the RTM-DTC model is reduced from 4.394 K to 1.909 K, which shows its practicality and accuracy in practical applications.
In the daily scale validation results, the RMSEs of the seven meteorological stations ranges from 1.81 K to 2.021 K, with a total error RMSE of 1.909 K. And it shows a certain sensitivity of the model error to the land cover type.
In the monthly scale validation results, the average RMSE ranges from 1.77 K to 2.0 K. The average MAE ranges from 1.45 K to 1.76 K, while the error results show some sensitivity of the RTM-DTC model to season.
Finally, the average surface temperature estimation results are used to depict the annual change curves of surface temperature at each station, which provides high-precision information for monitoring climate change in the Tibetan Plateau region.
The final results show that the RTM-DTC model provides an effective way to estimate the mean surface temperature in high-altitude areas such as the Tibetan Plateau.
Author Contributions
Writing—original draft preparation and methodology, L.Z.; writing—review and editing, X.Z. and Y.F.; visualization, L.Z.; methodology and resources, L.Z. and D.X. All authors have read and agreed to the published version of the manuscript.
Funding
This research was supported by Key Laboratory of the Northern Qinghai–Tibet Plateau Geological Processes and Mineral Resources (2019-KZ-02).
Institutional Review Board Statement
Not applicable.
Informed Consent Statement
Not applicable.
Data Availability Statement
Data sources can be found in the data presentation Section 2.1.
Conflicts of Interest
The authors declare that they have no known competing financial interests or personal relationships that could have appeared to influence the work reported in this paper.
Appendix A

Table A1.
Data List.
| Data Type | Product Name | Spatial Resolution | Data Source |
|---|---|---|---|
| Thermal Infrared Remote Sensing Data | MOD11A1 MYD11A1 | 1 KM | Level-1 and Atmosphere Archive and Distribution System Distributed Active Archive Center (https://ladsweb.modaps.eosdis.nasa.gov/) (accessed on 2 September 2023) |
| NDVI Data | MYD13A2 | 1 KM | EARTHDATA (https://earthdata.nasa.gov/) (accessed on 2 September 2023) |
| Surface Albedo Data | MCD43A3 | 1 KM | EARTHDATA (https://earthdata.nasa.gov/) (accessed on 2 September 2023) |
| DEM Data | SRTM | 250 m | Digital Elevation Data website of the American Spatial Information Society (http://srtm.csi.cgiar.org/) (accessed on 2 September 2023) |
| Reanalysis Data | GLDAS CLDAS | 0.25° 0.0625° | Goddard Space Flight Center (http://disc.sci.gsfc.nasa.gov) (accessed on 2 September 2023) China Meteorological Service Data Center (http://data.cma.cn/) (accessed on 2 September 2023) |
| Long-wave radiation data | / | High-cold region Observation and Research Network for Land surface processes and Environment of China (http://www.horn.ac.cn/index.jsp) (accessed on 2 September 2023) National Qinghai–Tibet Plateau Scientific Data Center (http://data.tpdc.ac.cn/zh-hans/) (accessed on 2 September 2023) | |
| The meteorological station data | / | the Qinghai–Tibet Plateau Data Center (http://data.tpdc.ac.cn/zh-hans/) (accessed on 2 September 2023) the China Alpine Surface Process and Research Network (http://www.horn.ac.cn/) (accessed on 2 September 2023) | |
All datasets use data from 2018.
References
- Jiang, L.; Islam, S. A methodology for estimation of surface evapotranspiration over large areas using remote sensing observations. Geophys. Res. Lett. 1999, 26, 2773–2776. [Google Scholar] [CrossRef]
- Leng, P.; Li, Z.-L.; Duan, S.-B.; Gao, M.-F.; Huo, H.-Y. A practical approach for deriving all-weather soil moisture content using combined satellite and meteorological data. ISPRS J. Photogramm. Remote Sens. 2017, 131, 40–51. [Google Scholar] [CrossRef]
- Wang, T.; Shi, J.; Ma, Y.; Letu, H.; Li, X. All-sky longwave downward radiation from satellite measurements: General parameterizations based on LST, column water vapor and cloud top temperature. ISPRS J. Photogramm. Remote Sens. 2020, 161, 52–60. [Google Scholar] [CrossRef]
- Weng, Q. Thermal infrared remote sensing for urban climate and environmental studies: Methods, applications, and trends. ISPRS J. Photogramm. Remote Sens. 2009, 64, 335–344. [Google Scholar] [CrossRef]
- Li, Y.; Zhao, M.; Motesharrei, S.; Mu, Q.; Kalnay, E.; Li, S. Local cooling and warming effects of forests based on satellite observations. Nat. Commun. 2015, 6, 6603. [Google Scholar] [CrossRef]
- Kleidon, A.; Renner, M. A simple explanation for the sensitivity of the hydrologic cycle to surface temperature and solar radiation and its implications for global climate change. Earth Syst. Dyn. 2013, 4, 455–465. [Google Scholar] [CrossRef]
- Rao, Y.; Liang, S.; Wang, D.; Yu, Y.; Song, Z.; Zhou, Y.; Shen, M.; Xu, B. Estimating daily average surface air temperature using satellite land surface temperature and top-of-atmosphere radiation products over the Tibetan Plateau. Remote Sens. Environ. 2019, 234, 111462. [Google Scholar] [CrossRef]
- Singh, S.; Bhardwaj, A.; Singh, A.; Sam, L.; Shekhar, M.; Martín-Torres, F.J.; Zorzano, M.-P. Quantifying the Congruence between Air and Land Surface Temperatures for Various Climatic and Elevation Zones of Western Himalaya. Remote Sens. 2019, 11, 2889. [Google Scholar] [CrossRef]
- Hu, T.; Renzullo, L.J.; van Dijk, A.I.J.M.; He, J.; Tian, S.; Xu, Z.; Zhou, J.; Liu, T.; Liu, Q. Monitoring agricultural drought in Australia using MTSAT-2 land surface temperature retrievals. Remote Sens. Environ. 2020, 236, 111419. [Google Scholar] [CrossRef]
- Ma, Z.; Sun, P.; Zhang, Q.; Yao, R. Research on Remote Sensing Drought Monitoring in North China Based on MODIS Data. Geogr. Sci. 2022, 42, 152–162. [Google Scholar] [CrossRef]
- Amiri, R.; Weng, Q.; Alimohammadi, A.; Alavipanah, S.K. Spatial–temporal dynamics of land surface temperature in relation to fractional vegetation cover and land use/cover in the Tabriz urban area, Iran. Remote Sens. Environ. 2009, 113, 2606–2617. [Google Scholar] [CrossRef]
- Han, H.; Yin, Y.; Zhao, Y.; Qin, F. Spatiotemporal Variations in Fractional Vegetation Cover and Their Responses to Climatic Changes on the Qinghai–Tibet Plateau. Remote Sens. 2023, 15, 2662. [Google Scholar] [CrossRef]
- Cong, N.; Shen, M.; Piao, S. Spatial variations in responses of vegetation autumn phenology to climate change on the Tibetan Plateau. J. Plant Ecol. 2016, 10, 744–752. [Google Scholar] [CrossRef]
- Weng, Q.; Firozjaei, M.K.; Kiavarz, M.; Alavipanah, S.K.; Hamzeh, S. Normalizing land surface temperature for environmental parameters in mountainous and urban areas of a cold semi-arid climate. Sci. Total Environ. 2019, 650, 515–529. [Google Scholar] [CrossRef]
- Xie, A.; Zhu, J.; Qin, X.; Wang, S. The Antarctic Amplification Based on MODIS Land Surface Temperature and ERA5. Remote Sens. 2023, 15, 3540. [Google Scholar] [CrossRef]
- Li, Z.; Duan, S.; Tang, B.; Wu, H.; Ren, H.; Yan, G.; Tang, R.; Leng, P. Review of methods for land surface temperature derived from thermal infrared remotely sensed data. Natl. Remote Sens. Bull. 2016, 20, 899–920. [Google Scholar] [CrossRef]
- Zhang, X.; Zhou, J.; Liang, S.; Wang, D. A practical reanalysis data and thermal infrared remote sensing data merging (RTM) method for reconstruction of a 1-km all-weather land surface temperature. Remote Sens. Environ. 2021, 260, 112437. [Google Scholar] [CrossRef]
- Xing, Z.; Li, Z.-L.; Duan, S.-B.; Liu, X.; Zheng, X.; Leng, P.; Gao, M.; Zhang, X.; Shang, G. Estimation of daily mean land surface temperature at global scale using pairs of daytime and nighttime MODIS instantaneous observations. ISPRS J. Photogramm. Remote Sens. 2021, 178, 51–67. [Google Scholar] [CrossRef]
- Zheng, G.; Yang, Y.; Yang, D.; Dafflon, B.; Yi, Y.; Zhang, S.; Chen, D.; Gao, B.; Wang, T.; Shi, R.; et al. Remote sensing spatiotemporal patterns of frozen soil and the environmental controls over the Tibetan Plateau during 2002–2016. Remote Sens. Environ. 2020, 247, 111927. [Google Scholar] [CrossRef]
- Shan, W.; Wang, Y.; Guo, Y.; Zhang, C.; Liu, S.; Qiu, L. Impacts of Climate Change on Permafrost and Hydrological Processes in Northeast China. Sustainability 2023, 15, 4974. [Google Scholar] [CrossRef]
- Ou, Y.; Che, T.; Dai, l.; Wang, Z. Estimating Mean Daily Surface Temperature over the Tibetan Plateau Based on MODIS LST Products. J. Glaciol. Geocryol. 2012, 34, 296–303. [Google Scholar] [CrossRef]
- Zhou, C.; Wang, K. Land surface temperature over global deserts: Means, variability, and trends. J. Geophys. Res. Atmos. 2016, 121, 14344–314357. [Google Scholar] [CrossRef]
- Xie, G.; Lu, C.; Leng, Y.; Zheng, D.; Li, S. Value assessment of ecological assets on the Qinghai-Tibet Plateau. J. Nat. Resour. 2003, 18, 189–196. [Google Scholar] [CrossRef]
- Yao, T.; Thompson, L.G.; Mosbrugger, V.; Zhang, F.; Ma, Y.; Luo, T.; Xu, B.; Yang, X.; Joswiak, D.R.; Wang, W.; et al. Third Pole Environment (TPE). Environ. Dev. 2012, 3, 52–64. [Google Scholar] [CrossRef]
- Lin, X.; Zhang, Z.; Wang, S.; Hu, Y.; Xu, G.; Luo, C.; Chang, X.; Duan, J.; Lin, Q.; Xu, B.; et al. Response of ecosystem respiration to warming and grazing during the growing seasons in the alpine meadow on the Tibetan plateau. Agric. For. Meteorol. 2011, 151, 792–802. [Google Scholar] [CrossRef]
- Zhu, Y.; Fan, G.; Hua, W.; Wang, Q. Analysis of temporal and spatial variation characteristics of surface temperature on the Qinghai-Tibet Plateau from 1981 to 2015. J. Southwest Univ. Nat. Sci. Ed. 2018, 40, 127–140. [Google Scholar] [CrossRef]
- Long, Z.; Ding, L.; Zhou, J.; Zhou, T. Toward the Estimation of All-Weather Daytime Downward Longwave Radiation over the Tibetan Plateau. Atmosphere 2021, 12, 1692. [Google Scholar] [CrossRef]
- Wu, K.; Chen, J.; Yang, H.; Yang, Y.; Hu, Z. Spatiotemporal Variations in the Sensitivity of Vegetation Growth to Typical Climate Factors on the Qinghai–Tibet Plateau. Remote Sens. 2023, 15, 2355. [Google Scholar] [CrossRef]
- Li, X.; Yao, Z.; Yuan, Q.; Xing, R.; Guo, Y.; Zhang, D.; Ahmad, I.; Liu, W.; Liu, H. Prediction of Potential Distribution Area of Two Parapatric Species in Triosteum under Climate Change. Sustainability 2023, 15, 5604. [Google Scholar] [CrossRef]
- Pan, B.; Li, J. The Qinghai-Tibet Plateau: The Driver and Amplifier of Global Climate Change—Ⅰ The Basic Characteristics of Cenozoic Climate Change. J. Lanzhou Univ. 1996, 32, 108–115. [Google Scholar]
- Bi, S. Best laboratory of the universal research for the earth’s global change and earth system science—The Qinghai-Tibet plateau. Syst. Eng. Theory Pract. 1997, 17, 72–77. [Google Scholar]
- Ding, L.; Zhou, J.; Zhang, X.; Liu, S.; Cao, R. Downscaling of surface air temperature over the Tibetan Plateau based on DEM. Int. J. Appl. Earth Obs. Geoinf. 2018, 73, 136–147. [Google Scholar] [CrossRef]
- Wei, Z.; Huang, R.; Dong, W. Interannual and interdecadal variations of air temperature and precipitation on the Qinghai-Tibet Plateau. Atmos. Sci. 2003, 27, 157–170. [Google Scholar]
- Qin, J.; Yang, K.; Liang, S.; Guo, X. The altitudinal dependence of recent rapid warming over the Tibetan Plateau. Clim. Change 2009, 97, 321–327. [Google Scholar] [CrossRef]
- Elmes, A.; Rogan, J.; Williams, C.; Ratick, S.; Nowak, D.; Martin, D. Effects of urban tree canopy loss on land surface temperature magnitude and timing. ISPRS J. Photogramm. Remote Sens. 2017, 128, 338–353. [Google Scholar] [CrossRef]
- Zhong, L.; Ma, Y.; Salama, M.S.; Su, Z. Assessment of vegetation dynamics and their response to variations in precipitation and temperature in the Tibetan Plateau. Clim. Change 2010, 103, 519–535. [Google Scholar] [CrossRef]
- Zhou, J.; Dai, F.; Zhang, X.; Zhao, S.; Li, M. Developing a temporally land cover-based look-up table (TL-LUT) method for estimating land surface temperature based on AMSR-E data over the Chinese landmass. Int. J. Appl. Earth Obs. Geoinf. 2015, 34, 35–50. [Google Scholar] [CrossRef]
- Xu, S.; Cheng, J. A new land surface temperature fusion strategy based on cumulative distribution function matching and multiresolution Kalman filtering. Remote Sens. Environ. 2021, 254, 112256. [Google Scholar] [CrossRef]
- Yang, J.; Zhou, J.; Göttsche, F.-M.; Long, Z.; Ma, J.; Luo, R. Investigation and validation of algorithms for estimating land surface temperature from Sentinel-3 SLSTR data. Int. J. Appl. Earth Obs. Geoinf. 2020, 91, 102136. [Google Scholar] [CrossRef]
- Liu, S.M.; Xu, Z.W.; Wang, W.Z.; Jia, Z.Z.; Zhu, M.J.; Bai, J.; Wang, J.M. A comparison of eddy-covariance and large aperture scintillometer measurements with respect to the energy balance closure problem. Hydrol. Earth Syst. Sci. 2011, 15, 1291–1306. [Google Scholar] [CrossRef]
- Liu, S.; Li, X.; Xu, Z.; Che, T.; Xiao, Q.; Ma, M.; Liu, Q.; Jin, R.; Guo, J.; Wang, L.; et al. The Heihe Integrated Observatory Network: A Basin-Scale Land Surface Processes Observatory in China. Vadose Zone J. 2018, 17, 1–21. [Google Scholar] [CrossRef]
- Lin, J.; Qiu, S.; Tan, X.; Zhuang, Y. Measuring the relationship between morphological spatial pattern of green space and urban heat island using machine learning methods. Build. Environ. 2023, 228, 109910. [Google Scholar] [CrossRef]
- Zhang, Q.; Cheng, J. An Empirical Algorithm for Retrieving Land Surface Temperature From AMSR-E Data Considering the Comprehensive Effects of Environmental Variables. Earth Space Sci. 2020, 7, e2019EA001006. [Google Scholar] [CrossRef]
- Duan, S.-B.; Li, Z.-L.; Wang, N.; Wu, H.; Tang, B.-H. Evaluation of six land-surface diurnal temperature cycle models using clear-sky in situ and satellite data. Remote Sens. Environ. 2012, 124, 15–25. [Google Scholar] [CrossRef]
- Göttsche, F.-M.; Olesen, F.-S.; Trigo, I.; Bork-Unkelbach, A.; Martin, M. Long Term Validation of Land Surface Temperature Retrieved from MSG/SEVIRI with Continuous in-Situ Measurements in Africa. Remote Sens. 2016, 8, 410. [Google Scholar] [CrossRef]
- Zhu, Z.; Shi, C.; Gu, J.; Liang, X. Analysis of the temporal and spatial variation characteristics of surface temperature on the Qinghai-Tibet Plateau in the past 10 years. Sci. Technol. Eng. 2020, 20, 3828–3837. [Google Scholar]
Figure 1.
Location distribution and land cover of meteorological stations on the Qinghai–Tibet Plateau.
Figure 1.
Location distribution and land cover of meteorological stations on the Qinghai–Tibet Plateau.
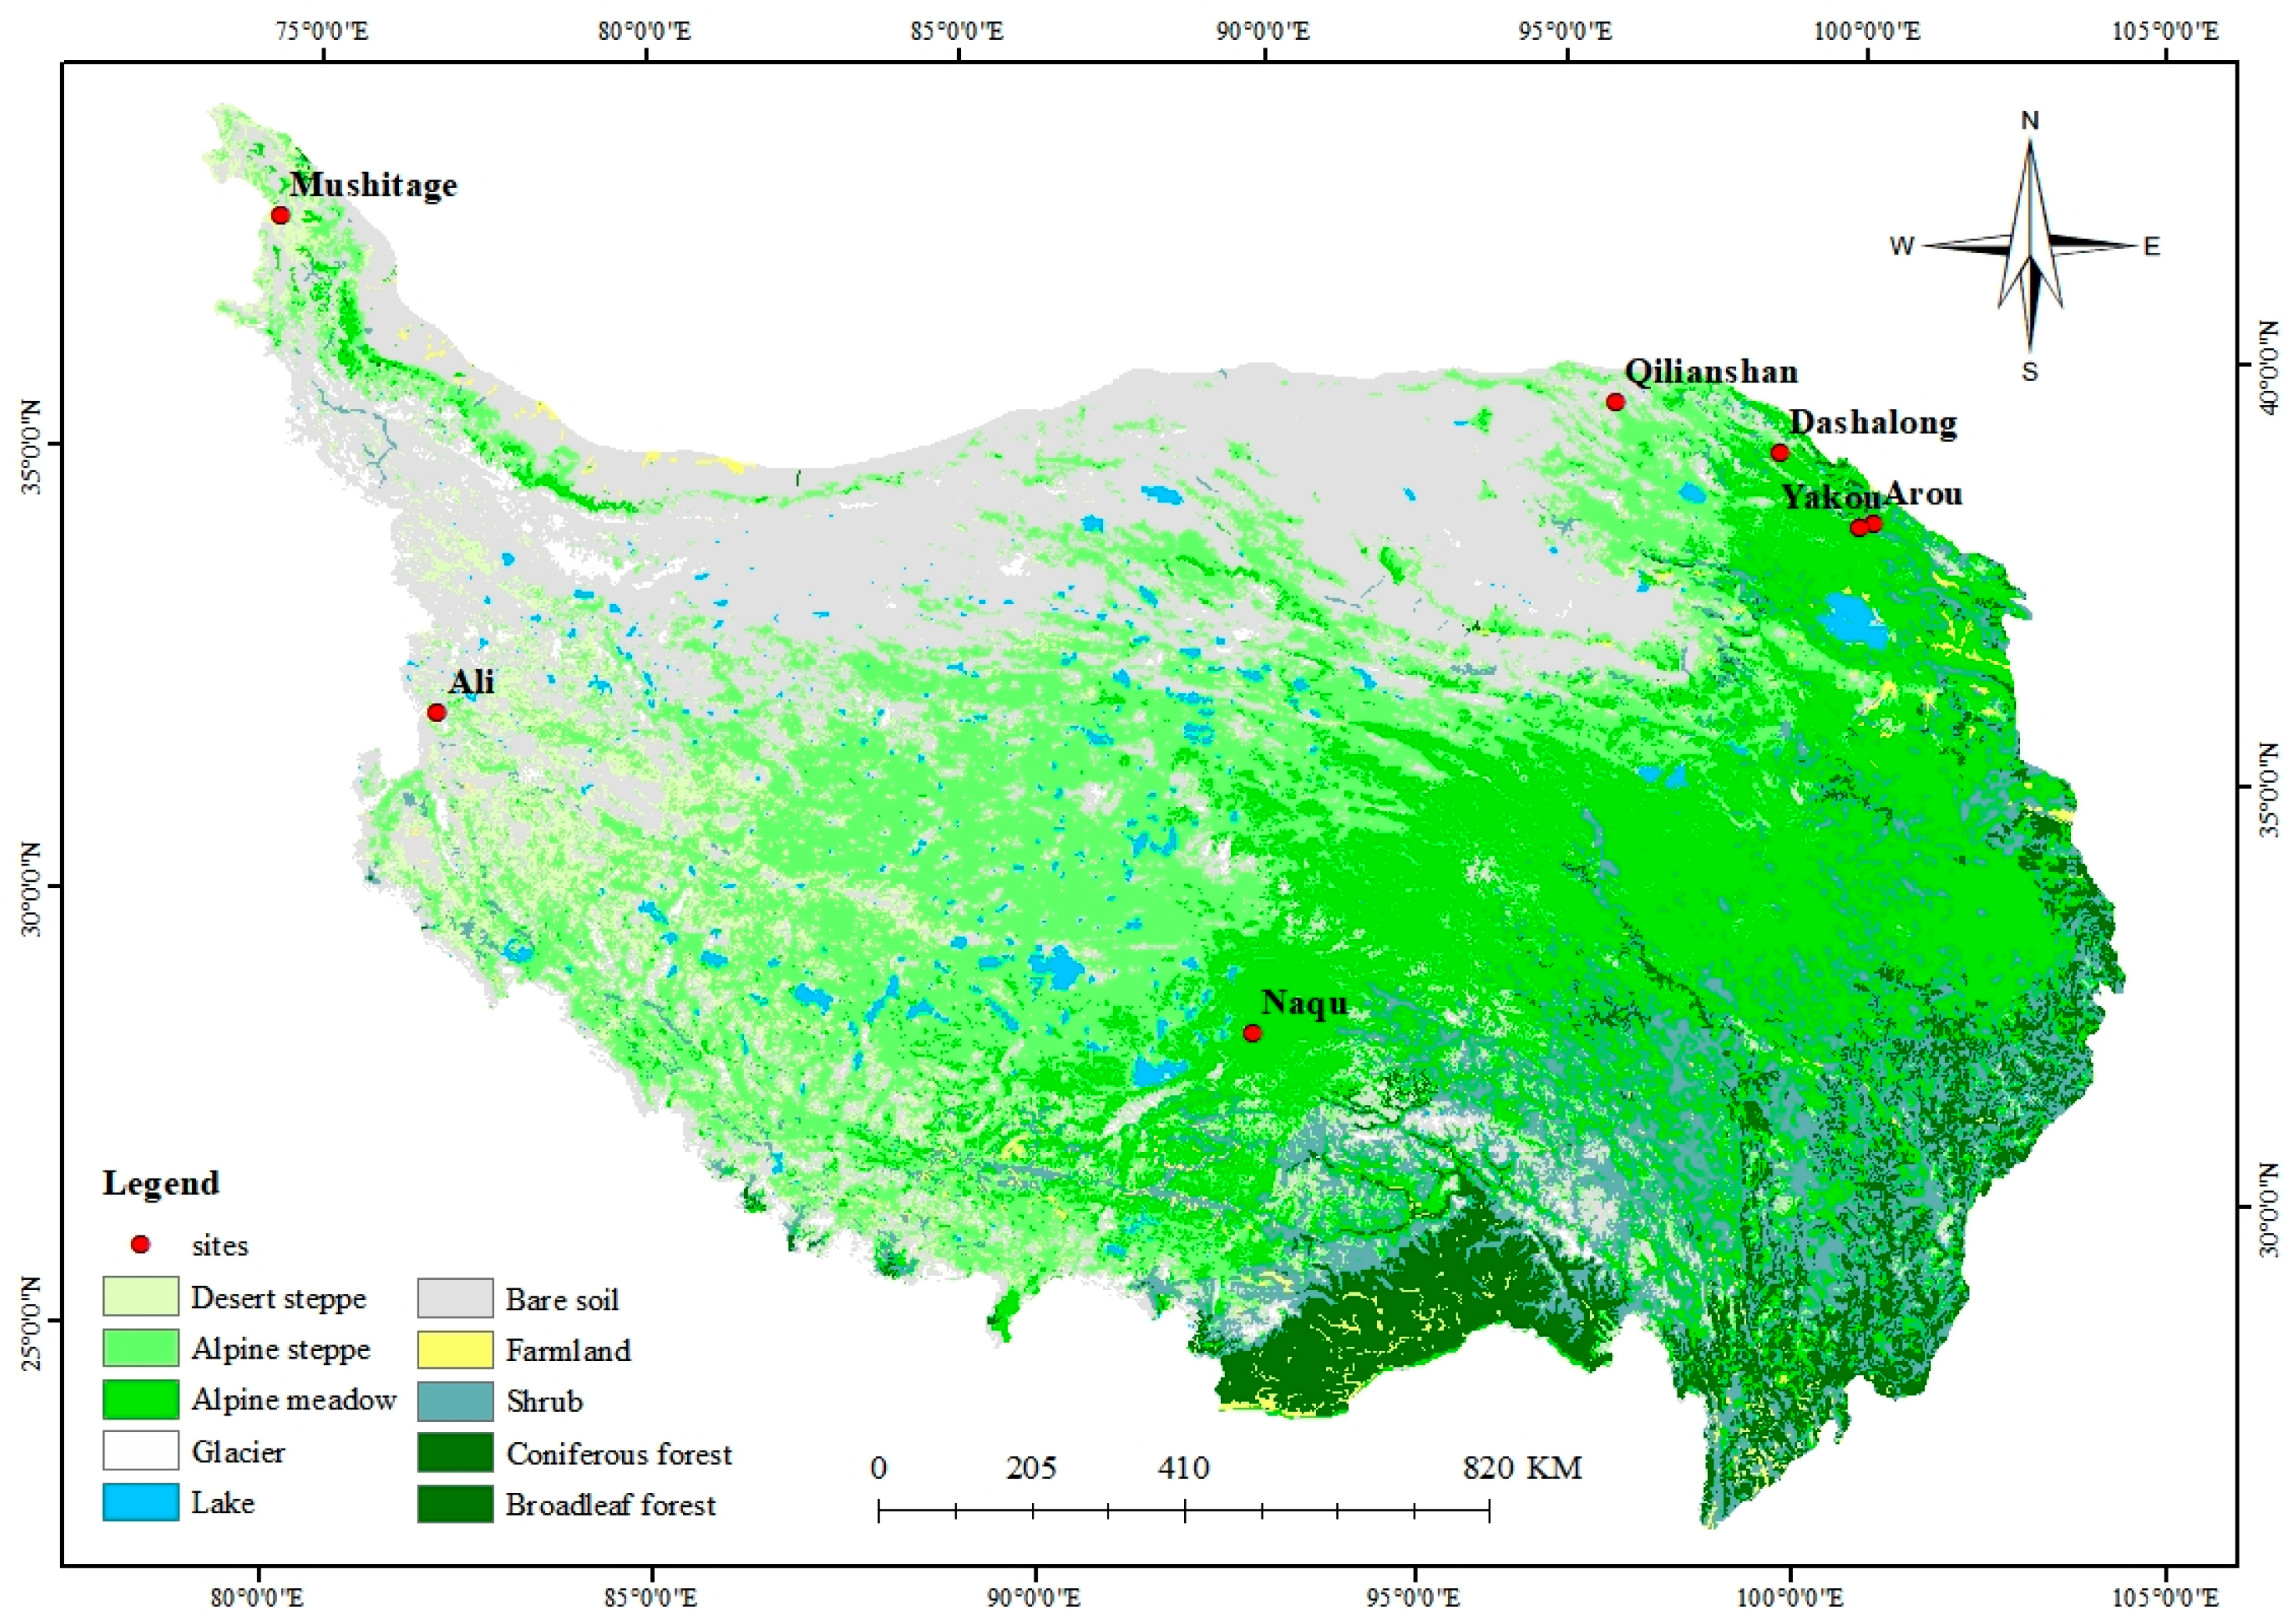
Figure 2.
Flowchart for estimating mean land surface temperature.
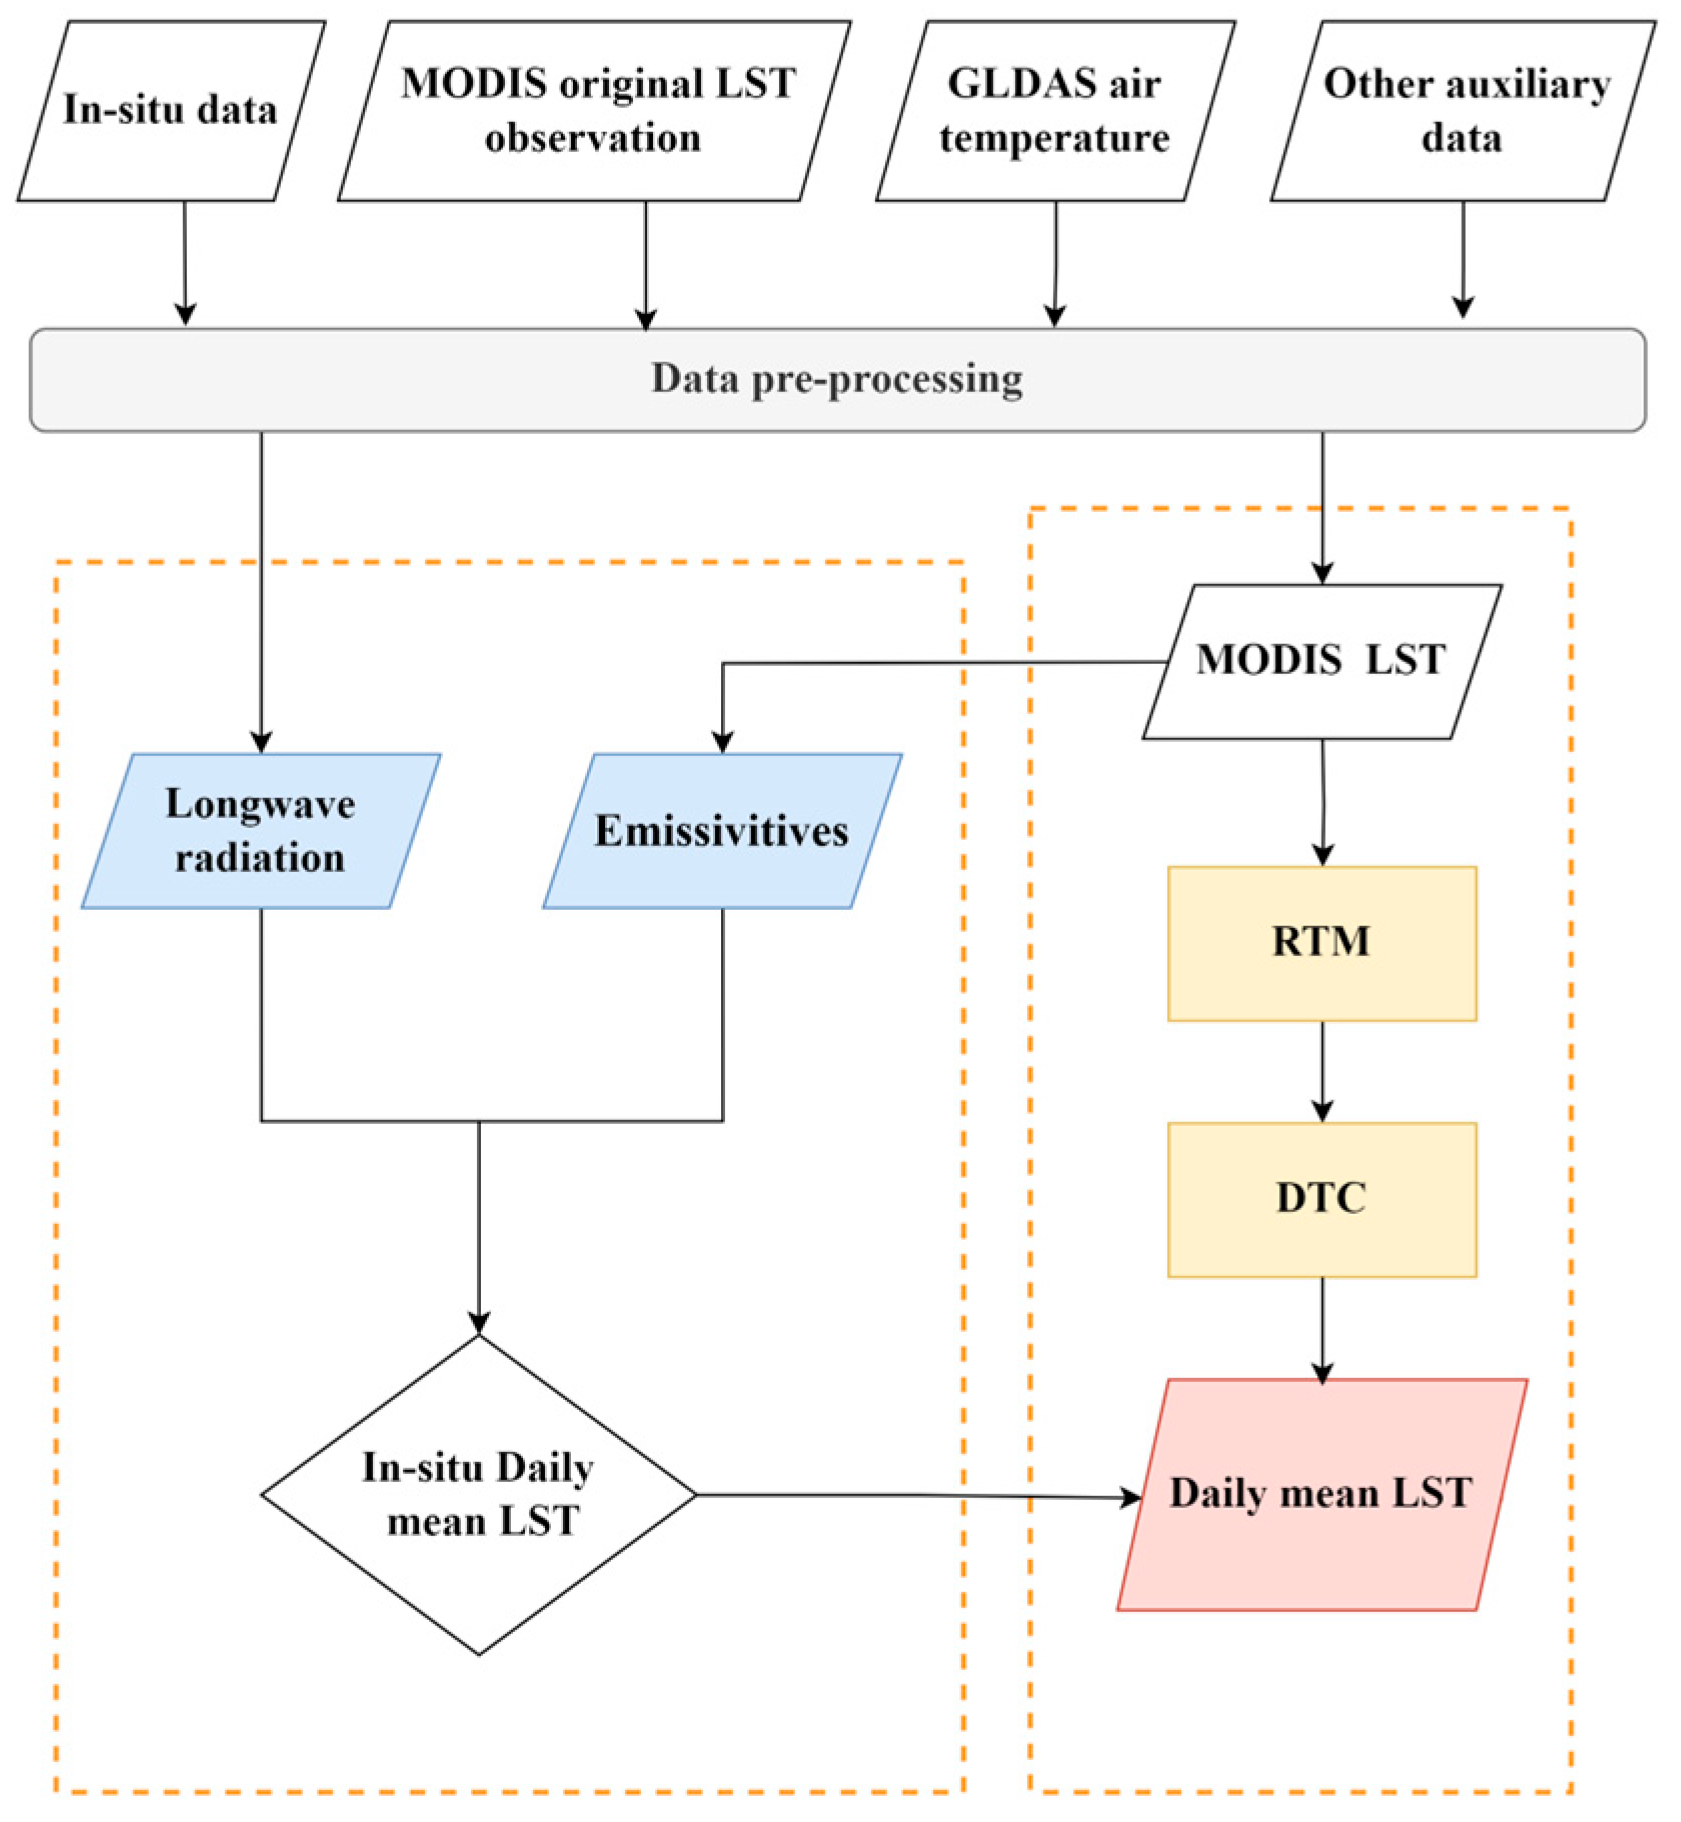
Figure 3.
Histogram of the number of clear and cloudy days at each site.
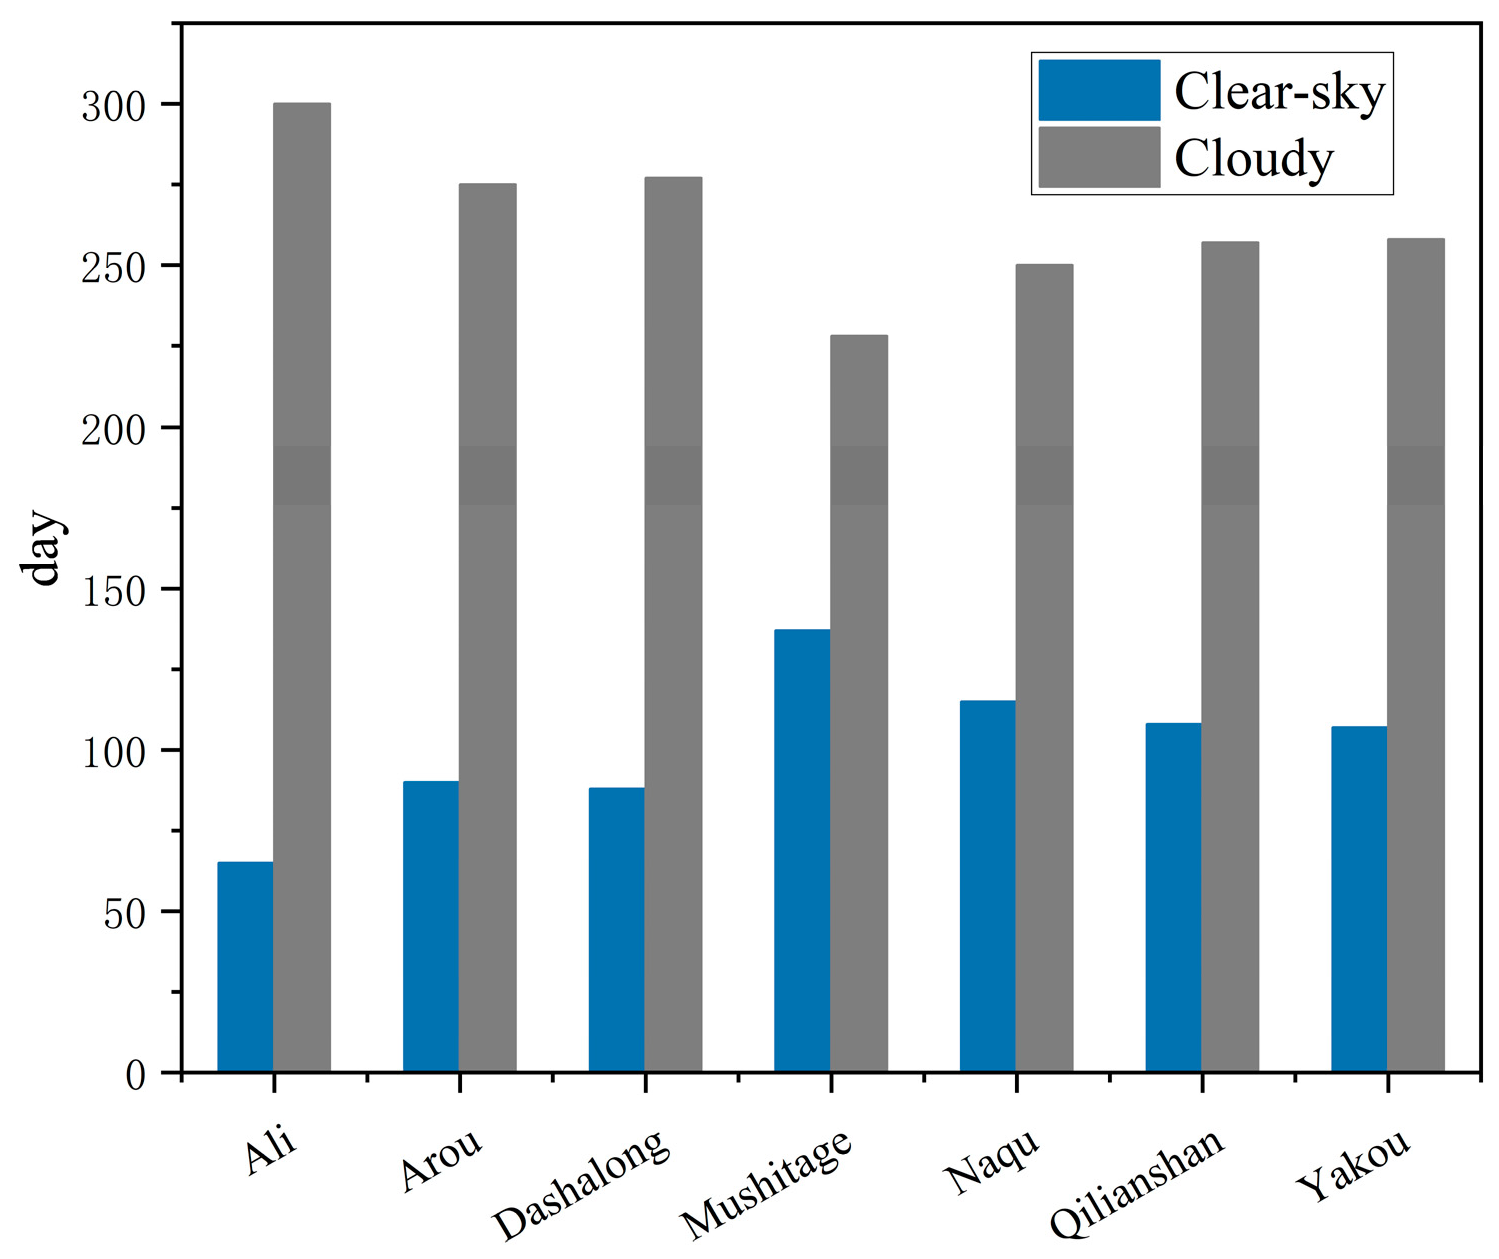
Figure 4.
Density scatter plot of daily mean surface temperature estimated by the RTM-DTC method (a) and the arithmetic mean method (b). The dashed line is a 1:1 straight line.
Figure 4.
Density scatter plot of daily mean surface temperature estimated by the RTM-DTC method (a) and the arithmetic mean method (b). The dashed line is a 1:1 straight line.
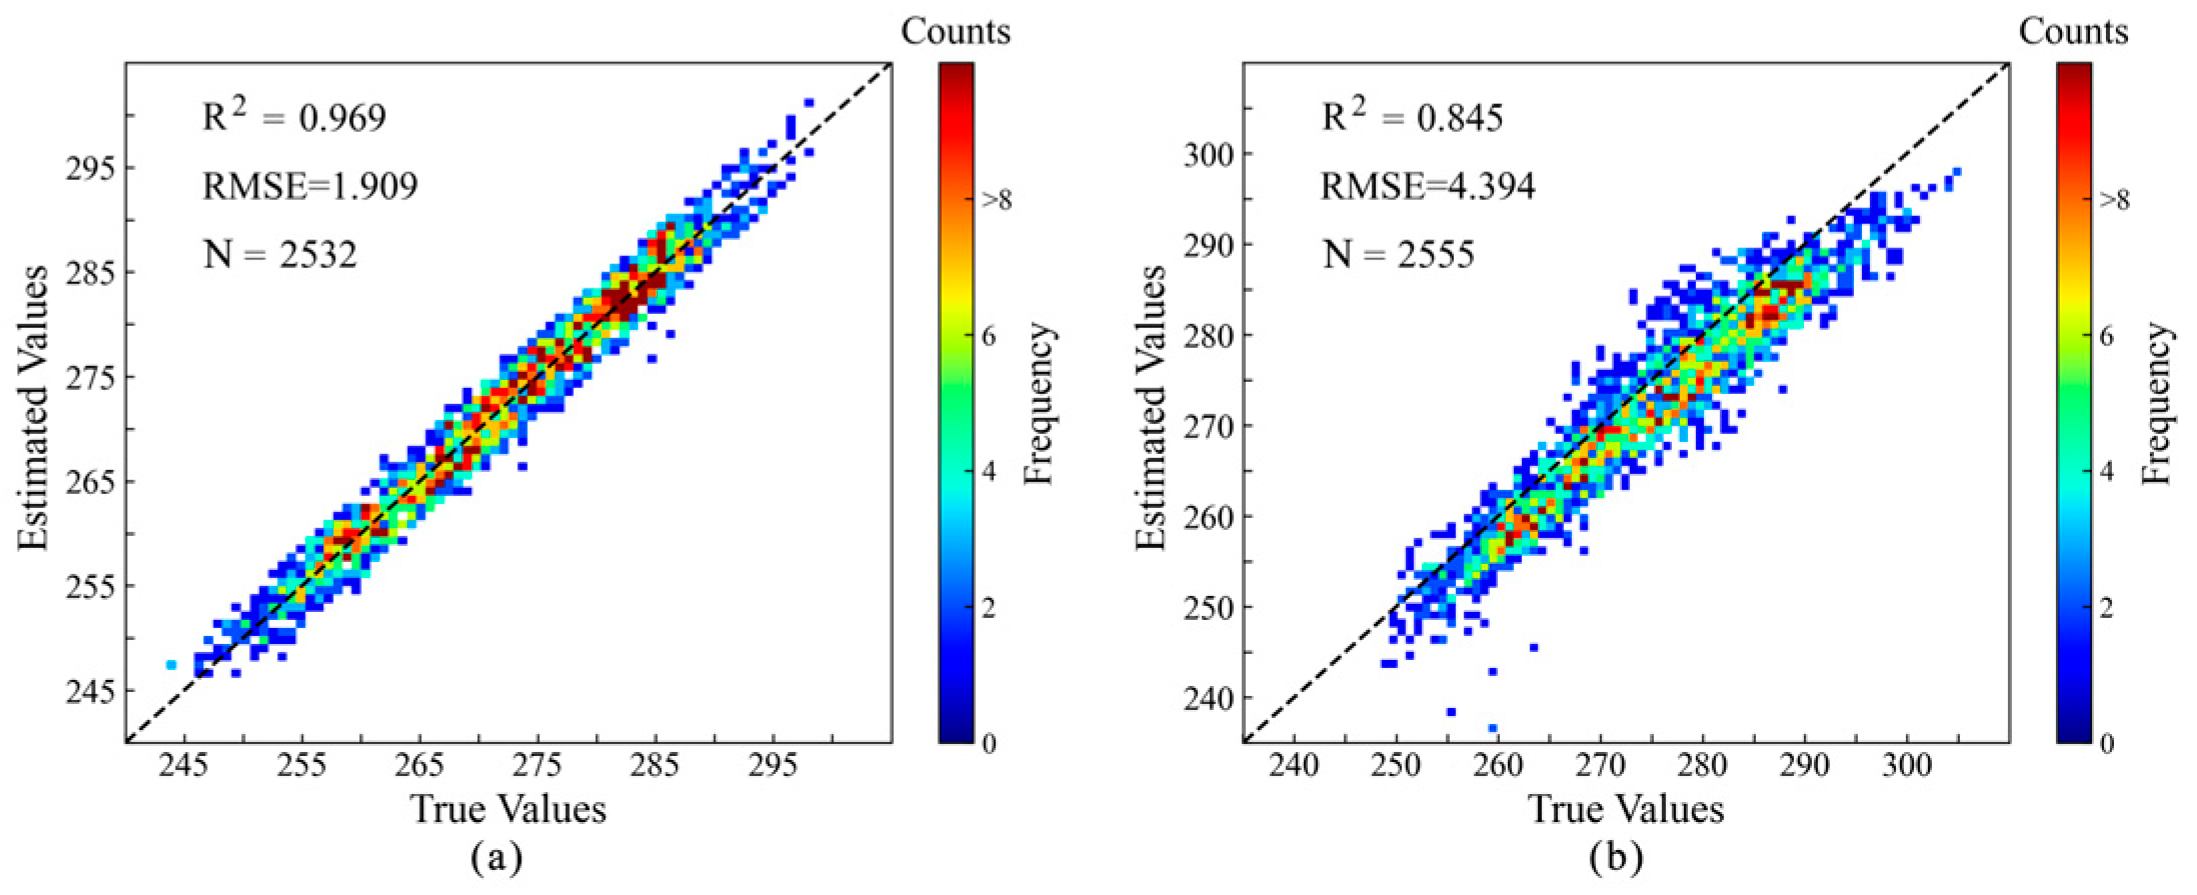
Figure 5.
Scatter plots of daily scale errors of daily average surface temperature estimated by the RTM-DTC model. The seven site scatter plots are represented by (a–g), and the total error scatter plot is represented by (h). The dashed line in the figure indicates a 1:1 straight line.
Figure 5.
Scatter plots of daily scale errors of daily average surface temperature estimated by the RTM-DTC model. The seven site scatter plots are represented by (a–g), and the total error scatter plot is represented by (h). The dashed line in the figure indicates a 1:1 straight line.
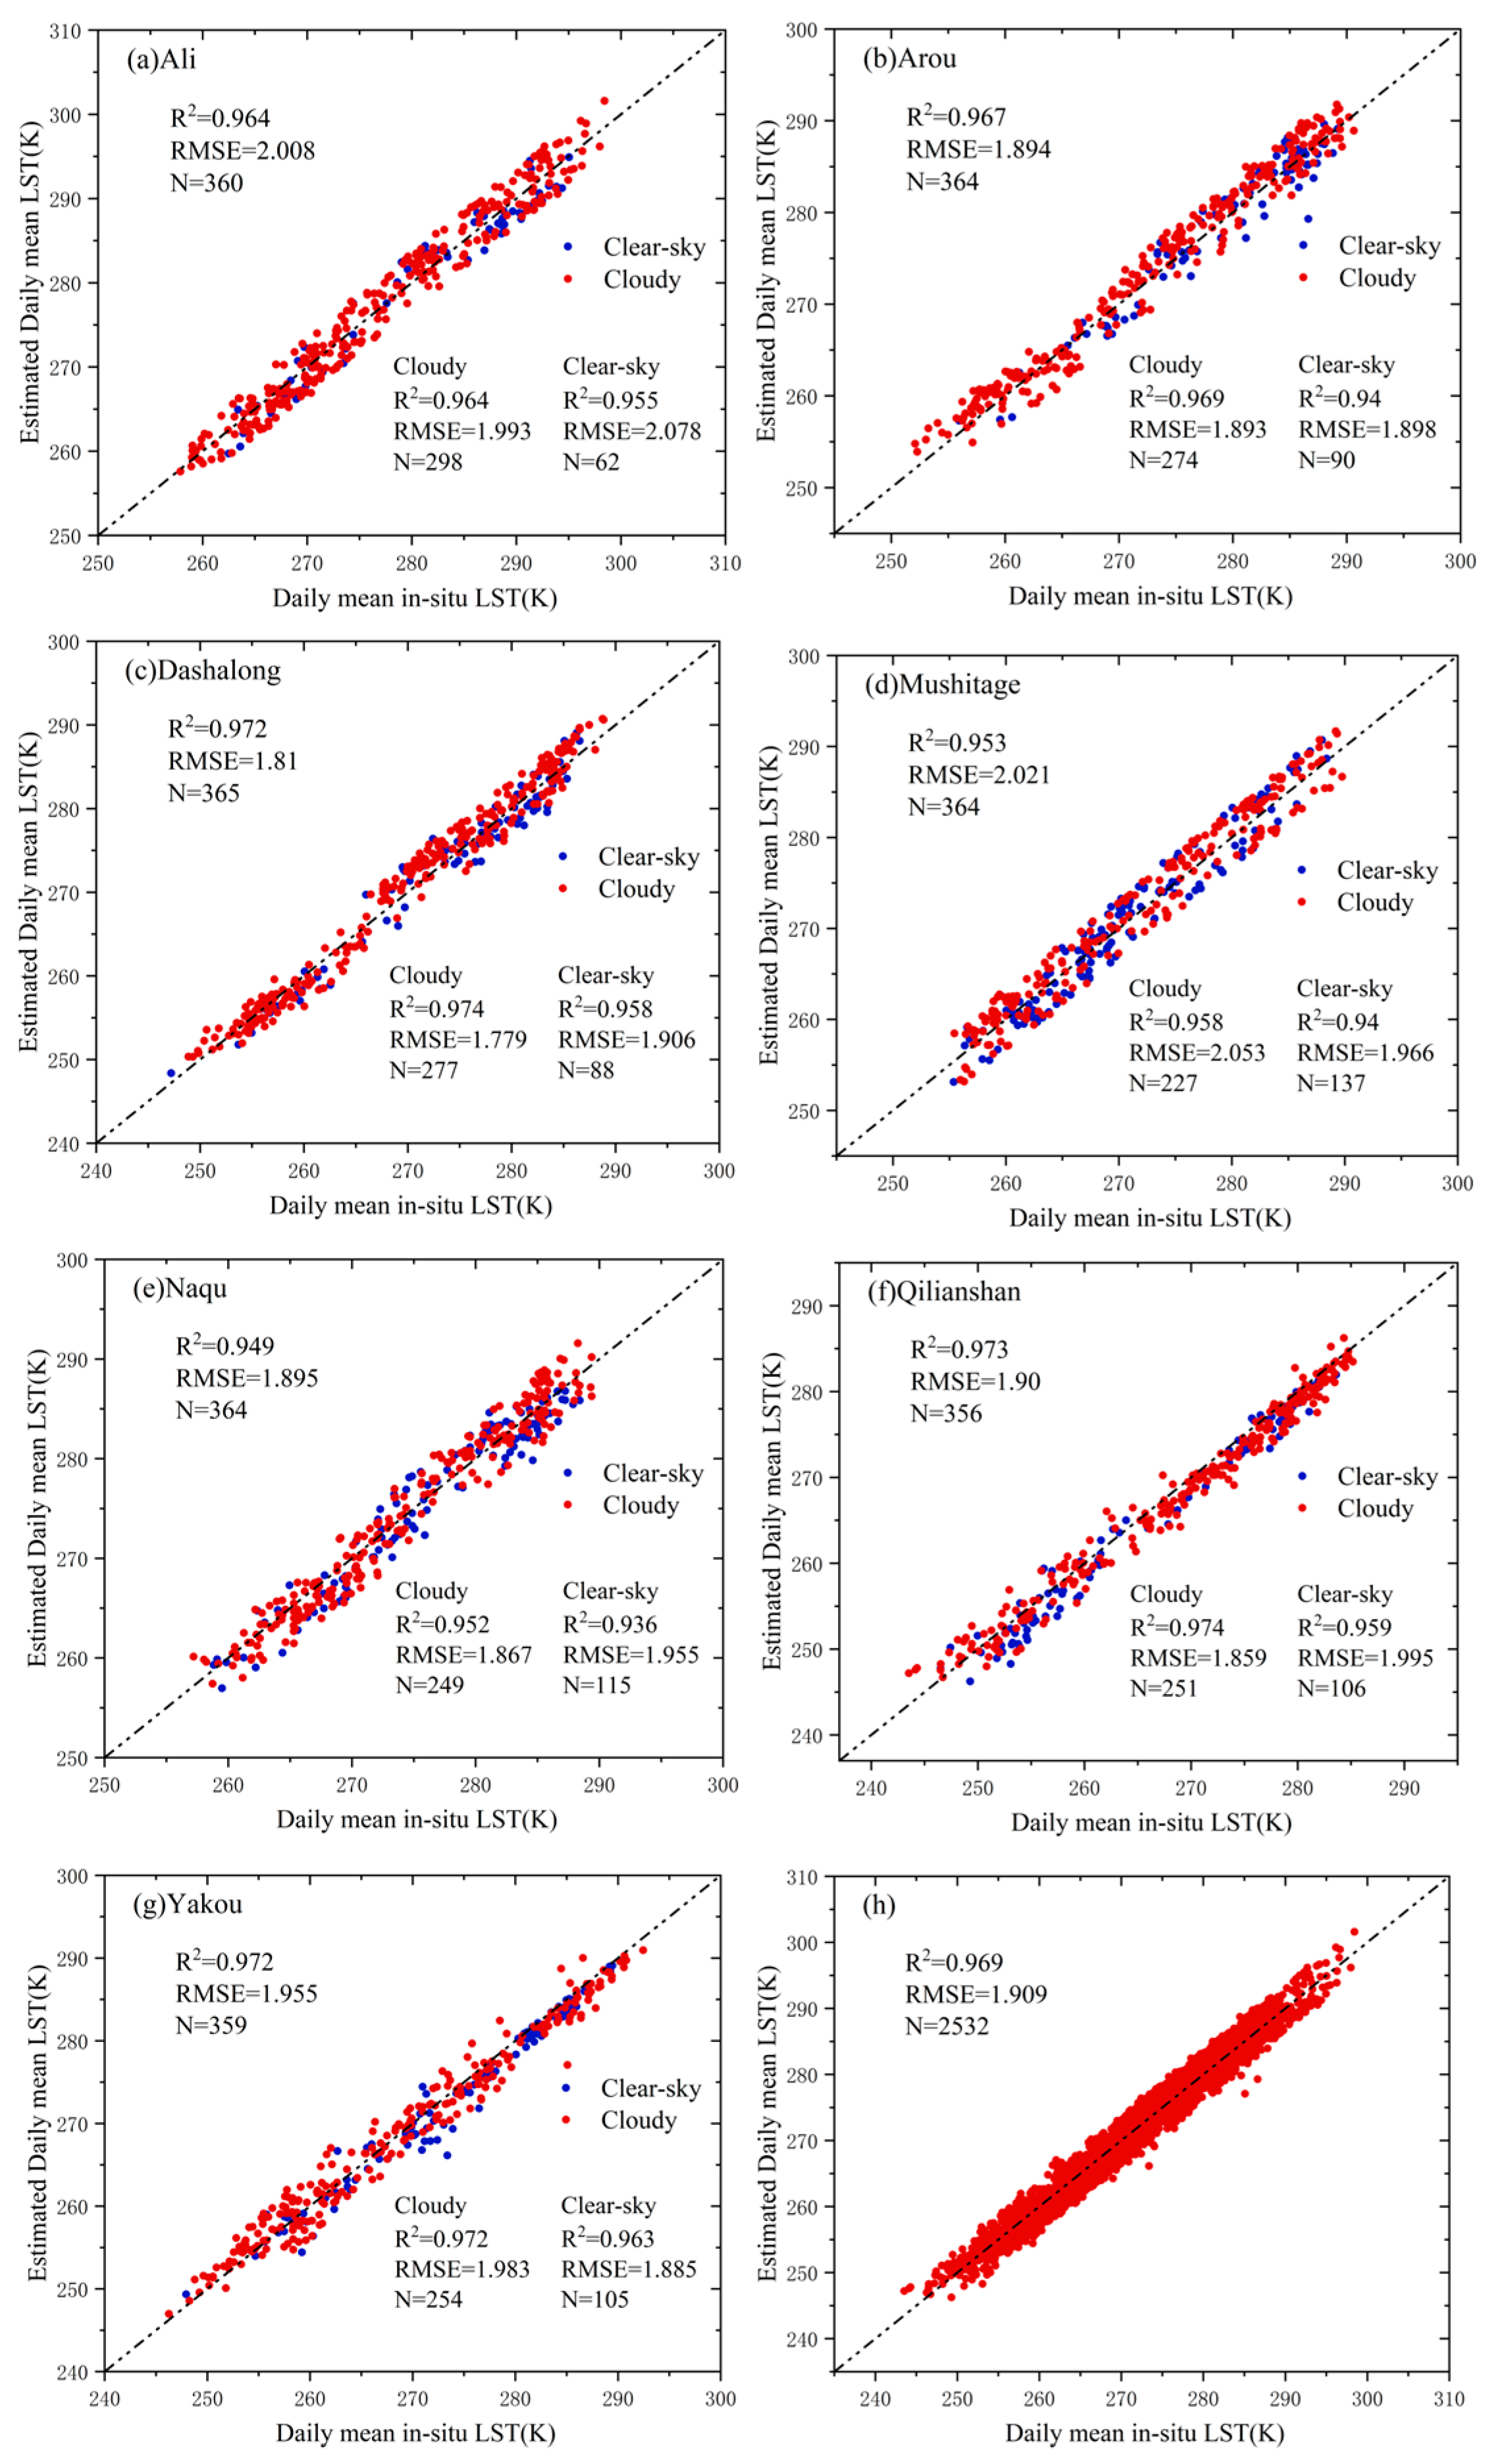
Figure 6.
Monthly scale validation of the daily surface mean temperature estimated by the RTM-DTC model (represented by R2, RMSE and MAE). Scatter plots for each of the seven sites (Ali, Arou, Dashalong, Mushitage, Naqu, Qilianshan, and Yakou) are represented in (a–g). The total error scatter plot is represented in (h). The dashed line in the figure indicates a 1:1 straight line.
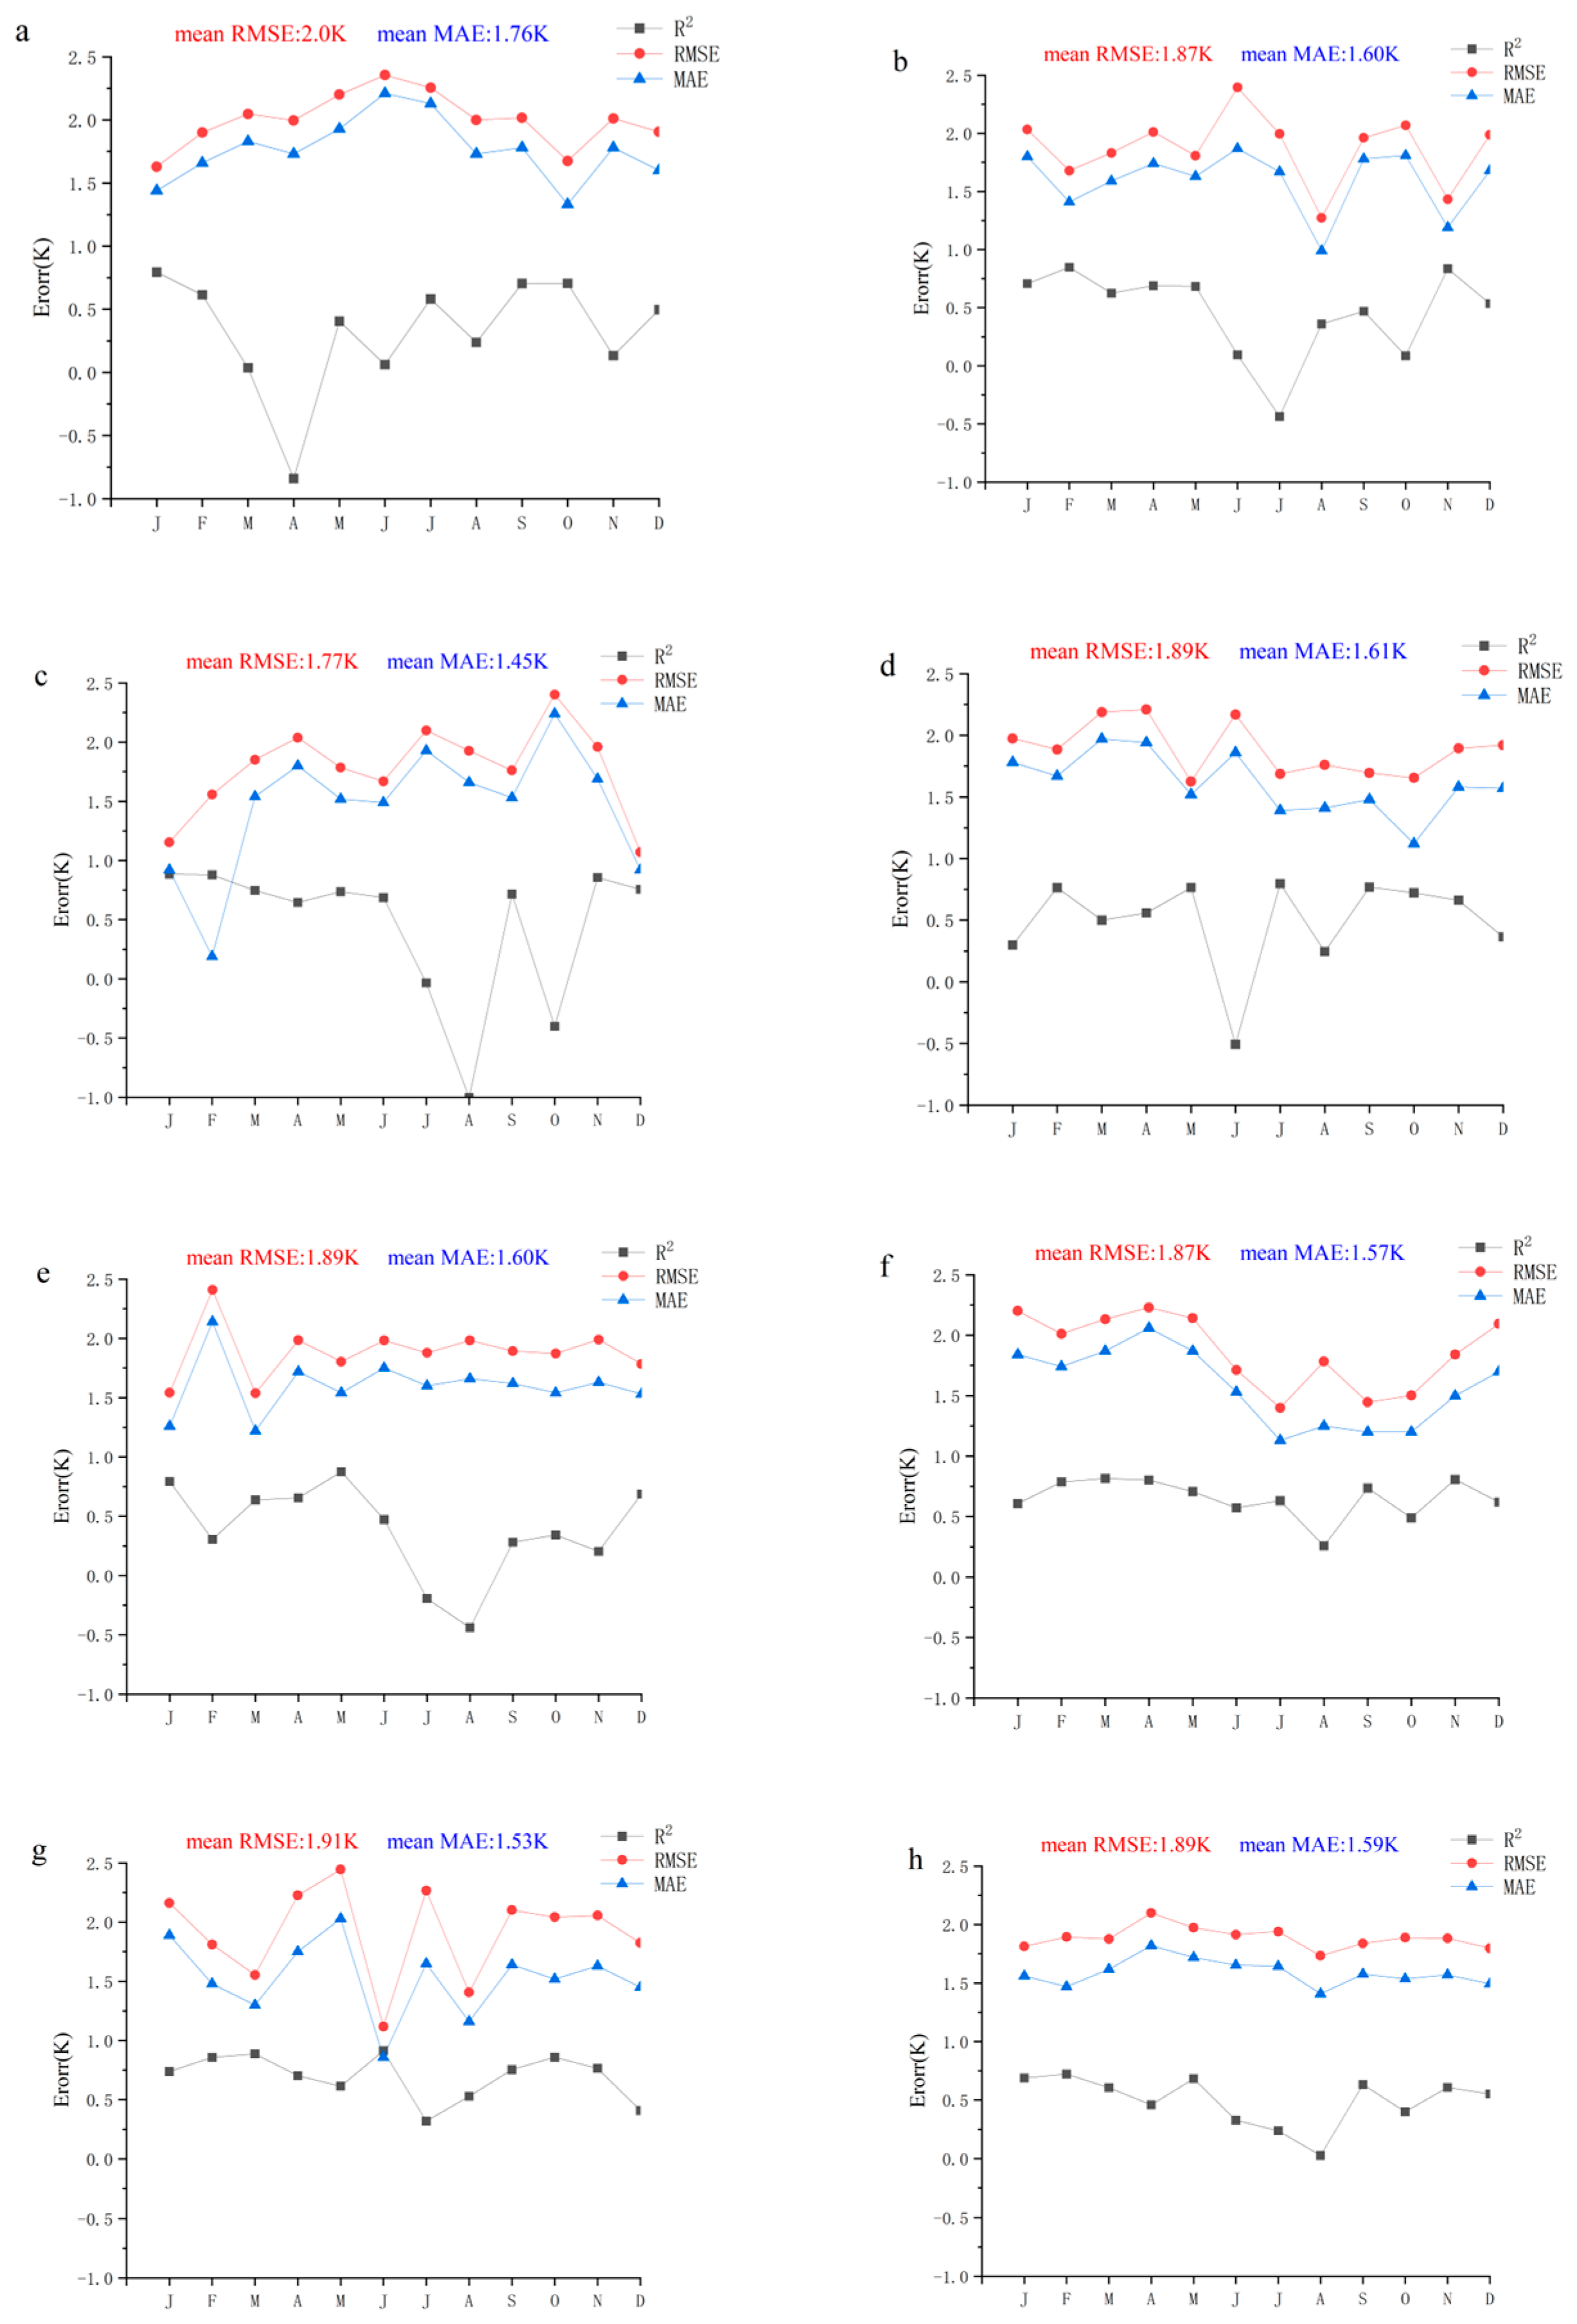
Figure 7.
Spatial distribution of the average surface temperature on the Tibetan Plateau estimated by the RTM-DTC model ((a–d) represent Days 90, 180, 270 and 360 of 2018, respectively).
Figure 7.
Spatial distribution of the average surface temperature on the Tibetan Plateau estimated by the RTM-DTC model ((a–d) represent Days 90, 180, 270 and 360 of 2018, respectively).
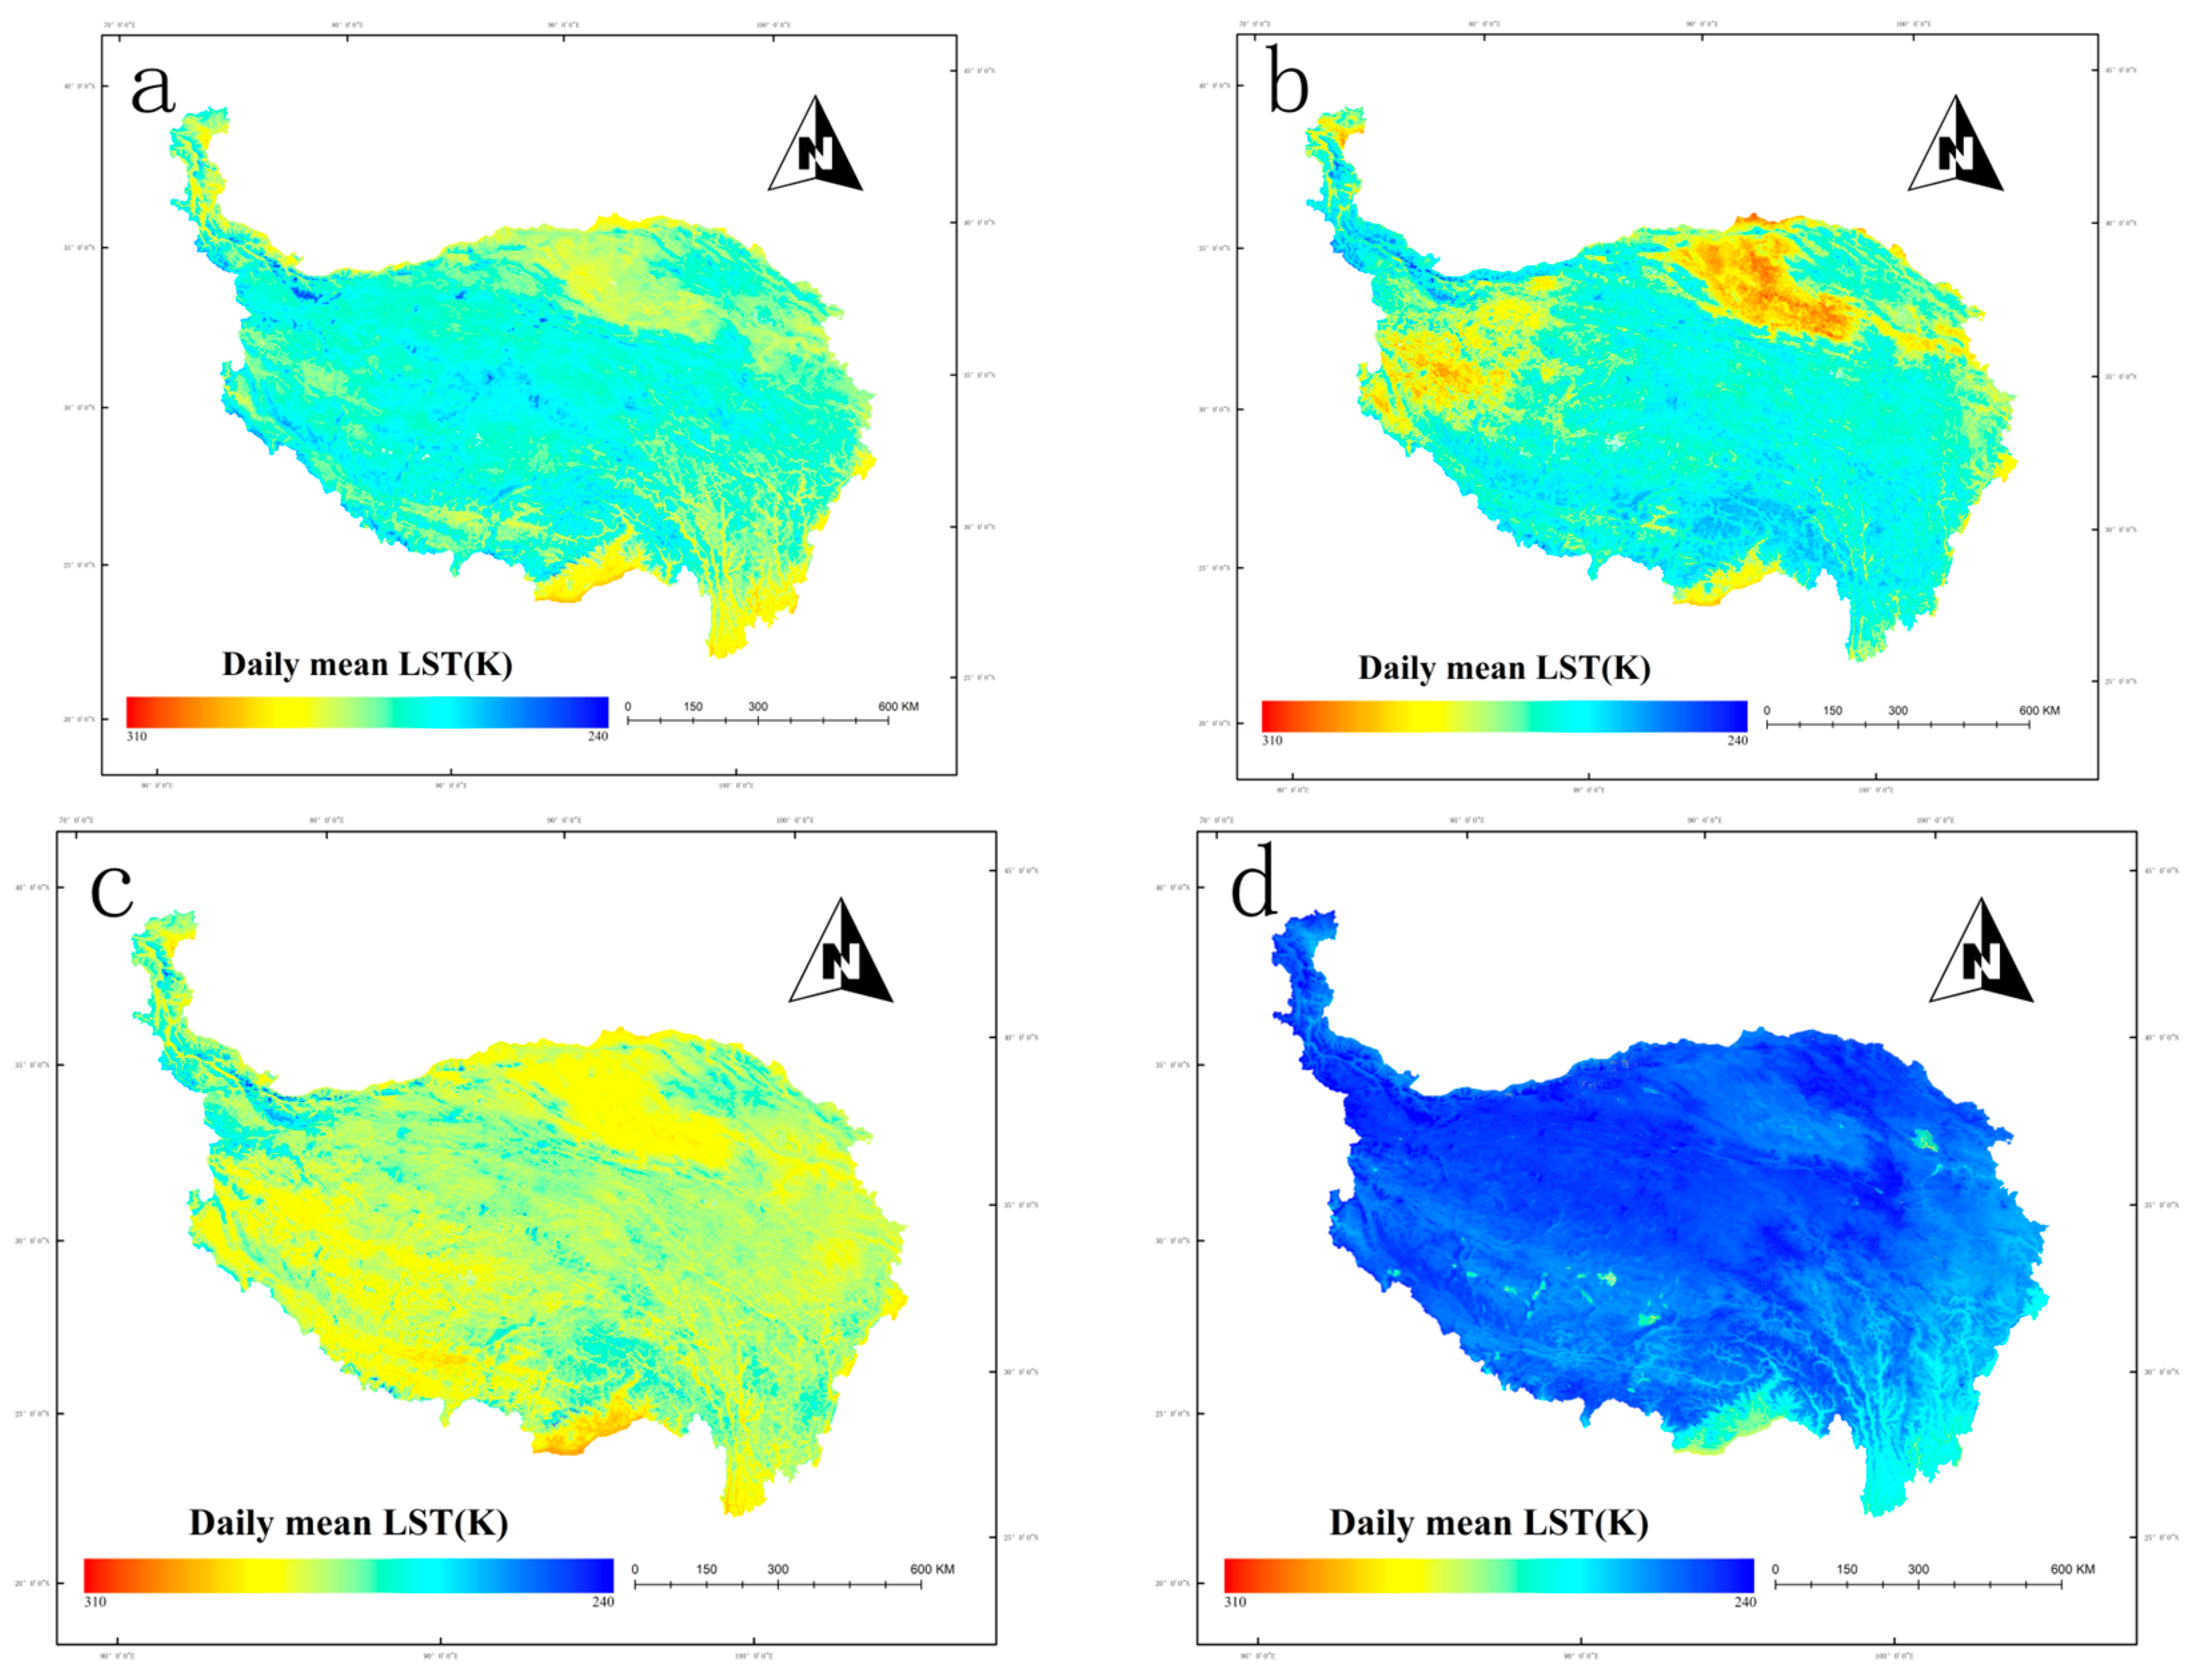
Figure 8.
Annual variation curves of daily surface mean temperature ((a–g) represent the seven sites, Ali, Arou, Dashalong, Mushitage, Naqu, Qilianshan, and Yakou, respectively).
Figure 8.
Annual variation curves of daily surface mean temperature ((a–g) represent the seven sites, Ali, Arou, Dashalong, Mushitage, Naqu, Qilianshan, and Yakou, respectively).
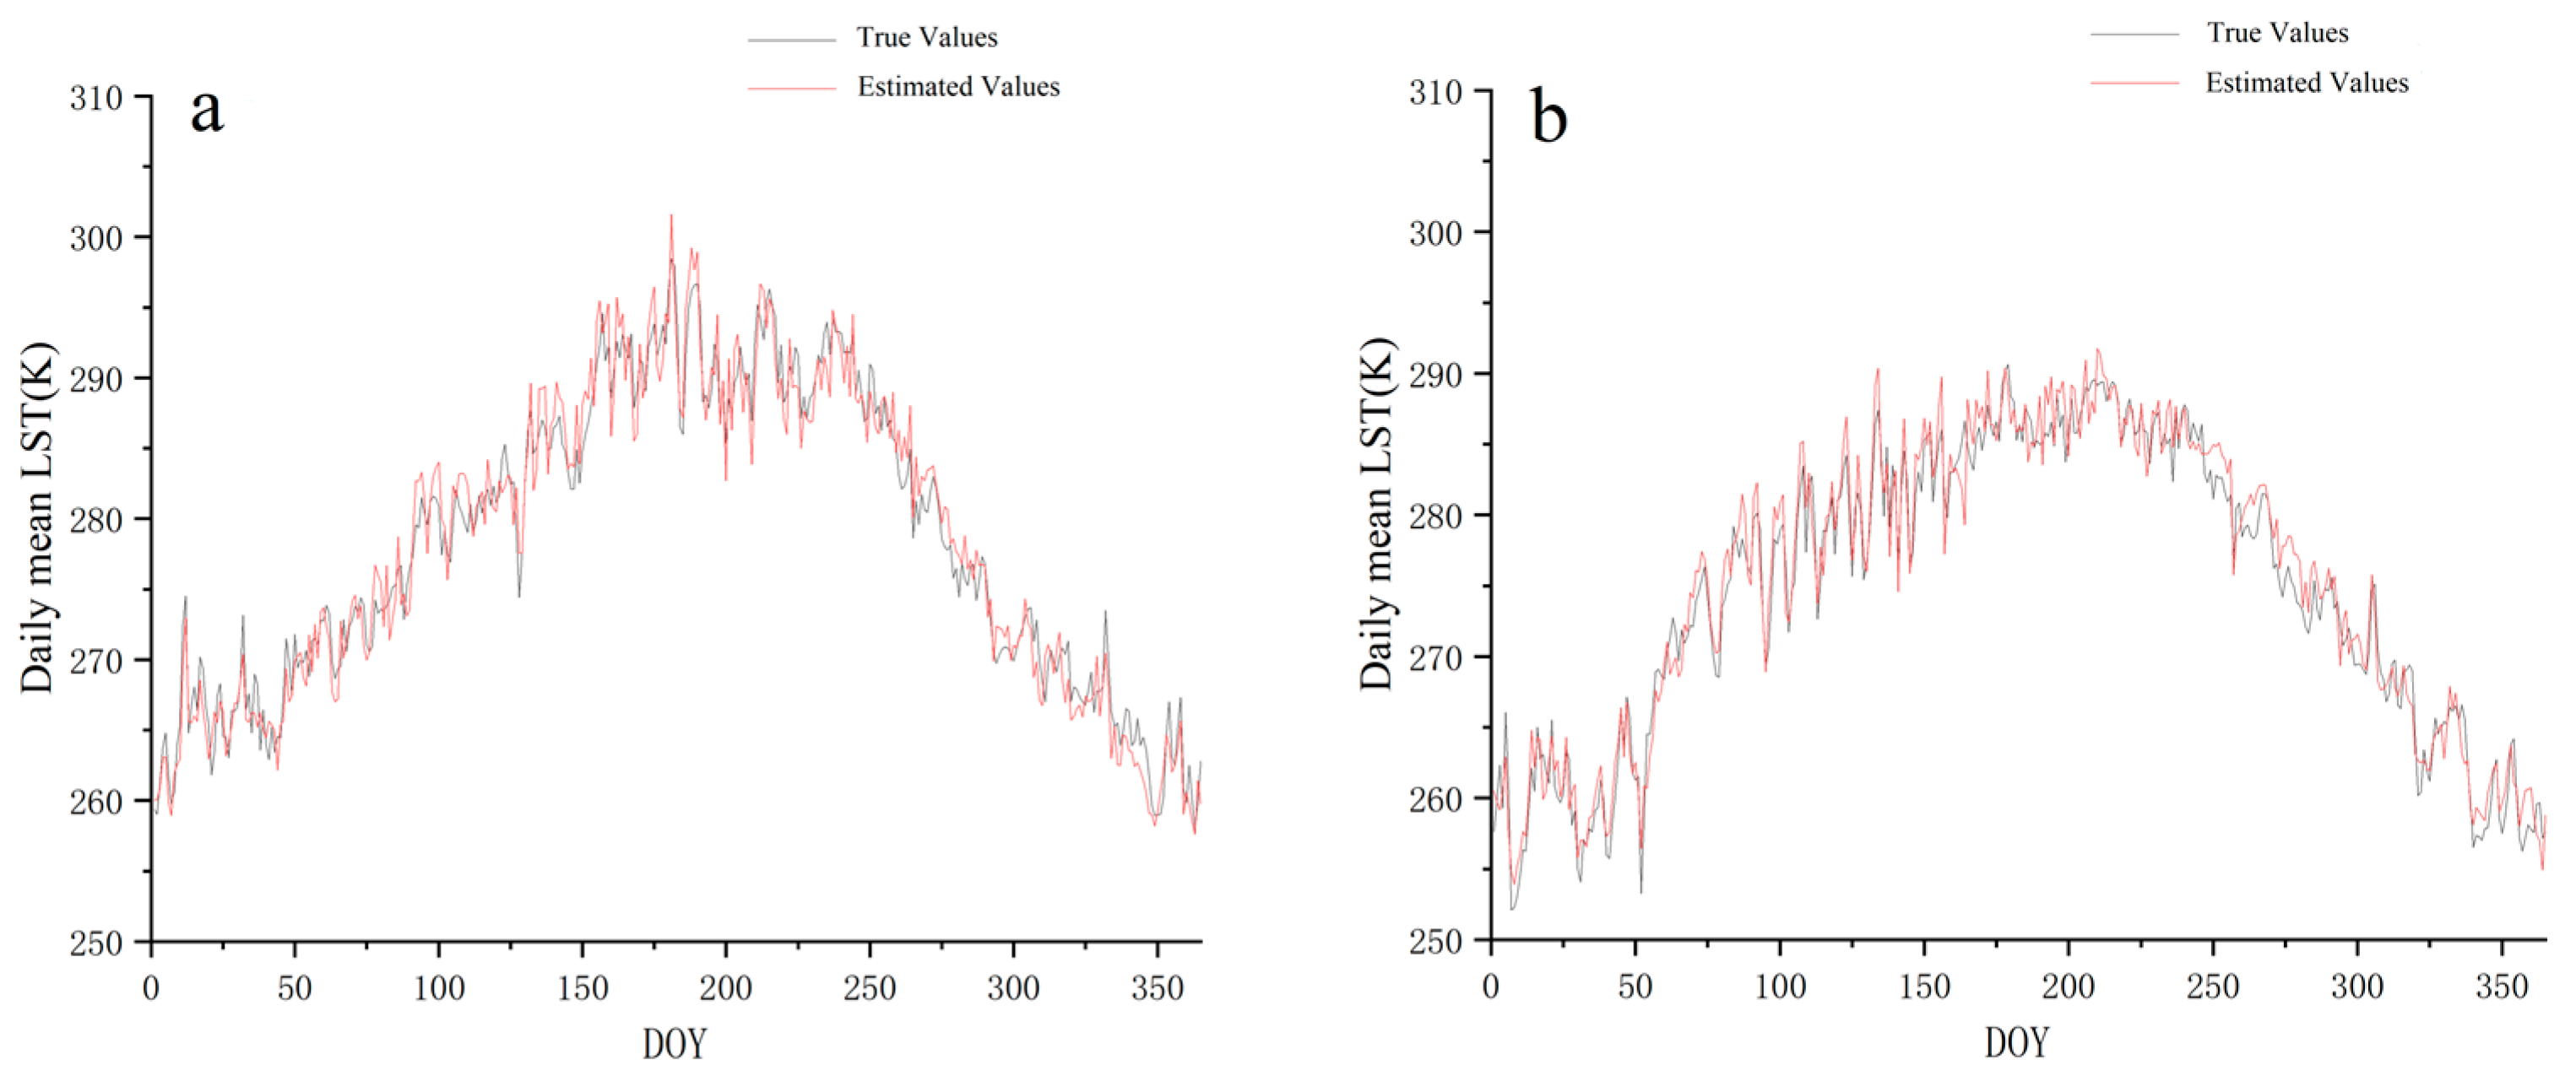
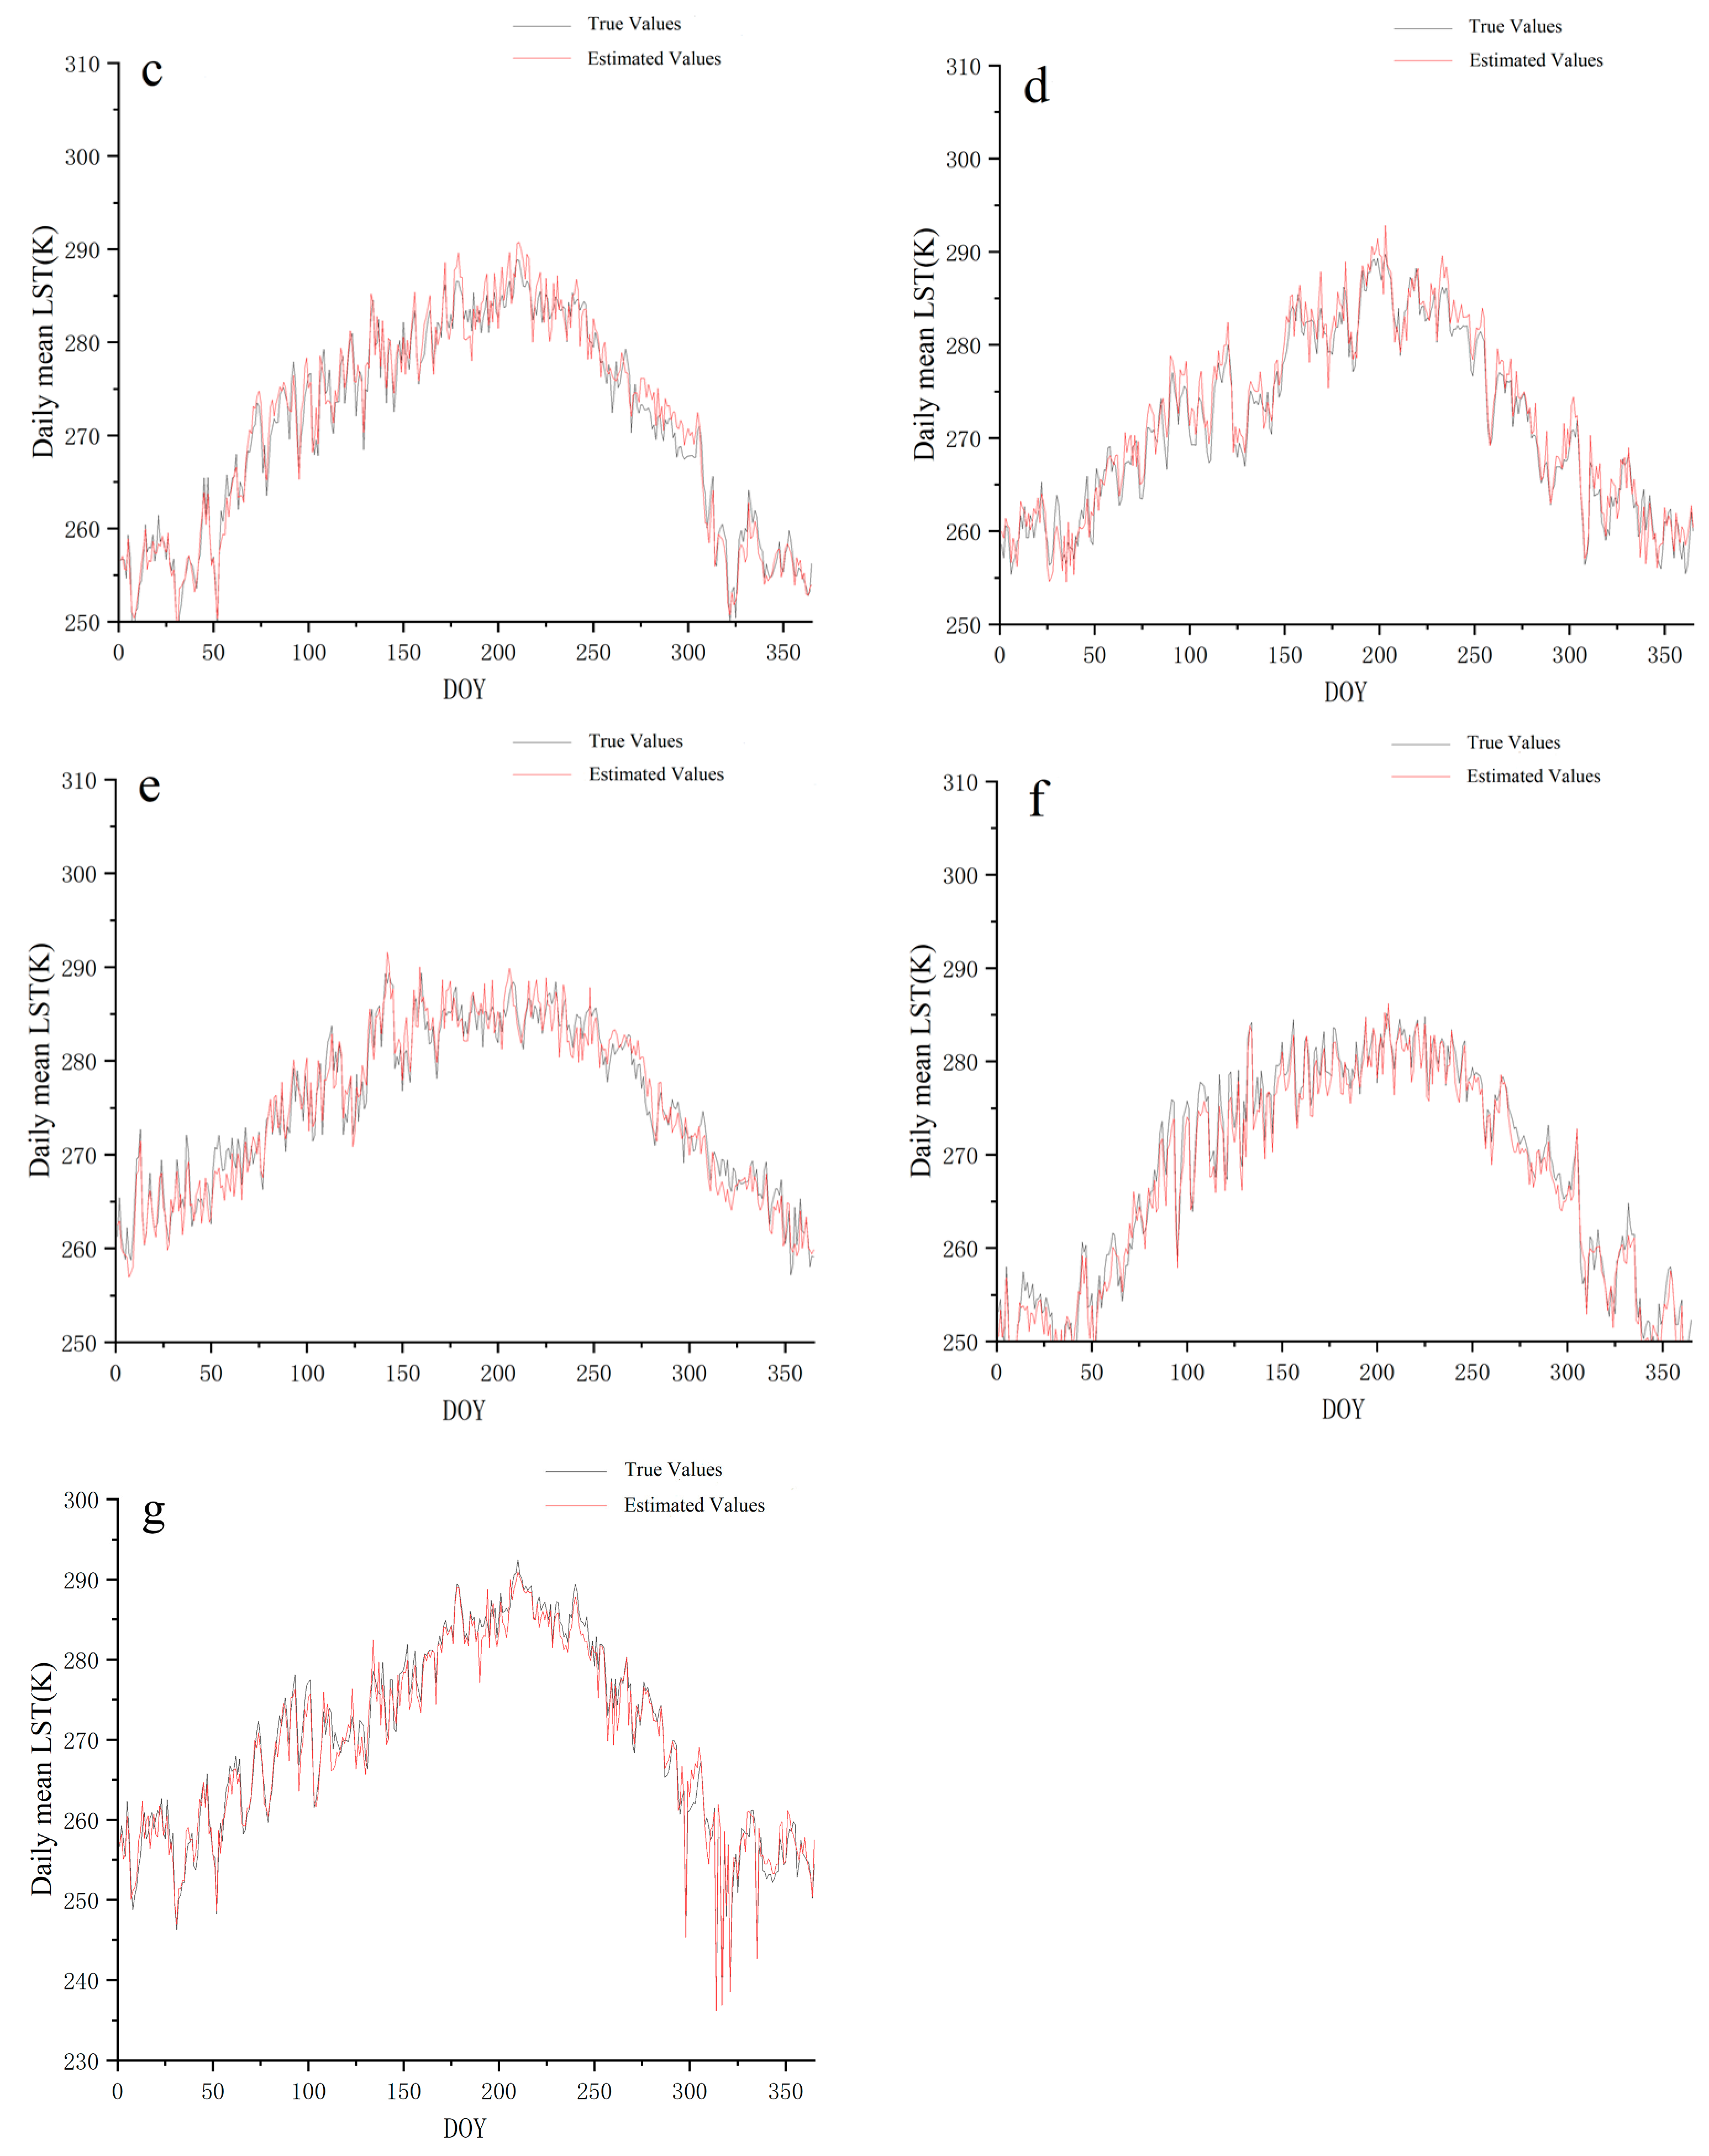
Table 1.
Distribution of observation sites on the Qinghai–Tibet Plateau.
| Site Name | Latitude (°) | Longitude (°) | Altitude | Land Cover Type | Interval |
|---|---|---|---|---|---|
| Ali | 23.39 | 79.70 | 4272 | Desert steppe | 1 d |
| Arou | 38.05 | 100.46 | 3033 | Alpine meadow | 10 min |
| Dashalong | 38.84 | 98.94 | 3739 | Alpine meadow | 10 min |
| Mushitage | 38.41 | 75.05 | 3668 | Desert steppe | 1 d |
| Naqu | 31.37 | 91.90 | 4509 | Alpine steppe | 1 d |
| Qilianshan | 39.50 | 96.50 | 4250 | Alpine meadow | 1 d |
| Yakou | 38.01 | 100.24 | 4148 | Alpine steppe | 10 min |
Disclaimer/Publisher’s Note: The statements, opinions and data contained in all publications are solely those of the individual author(s) and contributor(s) and not of MDPI and/or the editor(s). MDPI and/or the editor(s) disclaim responsibility for any injury to people or property resulting from any ideas, methods, instructions or products referred to in the content. |
© 2023 by the authors. Licensee MDPI, Basel, Switzerland. This article is an open access article distributed under the terms and conditions of the Creative Commons Attribution (CC BY) license (https://creativecommons.org/licenses/by/4.0/).
Share and Cite
MDPI and ACS Style
Zhao, L.; Xue, D.; Zhang, X.; Fu, Y. Estimation of Daily Mean Land Surface Temperature over the Qinghai–Tibet Plateau Based on an RTM-DTC Model. Atmosphere 2023, 14, 1559. https://doi.org/10.3390/atmos14101559
AMA Style
Zhao L, Xue D, Zhang X, Fu Y. Estimation of Daily Mean Land Surface Temperature over the Qinghai–Tibet Plateau Based on an RTM-DTC Model. Atmosphere. 2023; 14(10):1559. https://doi.org/10.3390/atmos14101559
Chicago/Turabian StyleZhao, Lei, Dongjian Xue, Xiaoxuan Zhang, and Yudi Fu. 2023. "Estimation of Daily Mean Land Surface Temperature over the Qinghai–Tibet Plateau Based on an RTM-DTC Model" Atmosphere 14, no. 10: 1559. https://doi.org/10.3390/atmos14101559
Note that from the first issue of 2016, this journal uses article numbers instead of page numbers. See further details here.