
Impact of Land Use on Atmospheric Particulate Matter Concentrations: A Case Study of the Beijing–Tianjin–Hebei Region, China


1
College of Resource Environment and Tourism, Capital Normal University, Beijing 100048, China
2
Land Satellite Remote Sensing Application Center, Ministry of Natural Resources, Beijing 100048, China
3
College of Geomatics, Shandong University of Science and Technology, Qingdao 266590, China
4
School of Environment and Spatial Informatics, China University of Mining and Technology, Xuzhou 221116, China
*
Author to whom correspondence should be addressed.
Atmosphere 2022, 13(3), 391; https://doi.org/10.3390/atmos13030391
Submission received: 9 December 2021
/
Revised: 21 February 2022
/
Accepted: 21 February 2022
/
Published: 26 February 2022
(This article belongs to the Special Issue Air Pollution at the Urban and Regional Level: Sources, Sinks, and Transportation)
Abstract
:The increasing frequency of human activities has accelerated changes in land use types and consequently affected the atmospheric environment. In this manuscript, we analyze the relationships between the particulate matter concentration and land use changes in the Beijing–Tianjin–Hebei (BTH) region, China, from 2015 to 2018. The experimental results indicate that (1) an improved sine function model can suitably fit the periodic changes in the particulate matter concentration, with the average R2 value increasing to 0.65 from the traditional model value of 0.49, while each model coefficient effectively estimates the change characteristics of each stage. (2) Among all land use types, the particulate matter concentrations in construction land and farmland are high, with a large annual difference between high and low values. The concentration decreases slowly in spring and summer but increases rapidly in autumn and winter. The concentrations in forestland and grassland are the lowest; the difference between high and low values is small for these land use types, and the concentration fluctuation pattern is relatively uniform. Natural sources greatly influence the concentration fluctuations, among which frequent dusty weather conditions in spring impose a greater influence on forestland and grassland than on the other land use types. (3) The landscape pattern of land use exerts a significant influence on the particulate matter concentration. Generally, the lower the aggregation degree of patches is, the higher the fragmentation degree is, the more complex the shape is, the higher the landscape abundance is, and the lower the particulate matter concentration is. The higher the construction land concentration is, the more easily emission sources can be aggregated to increase the particulate matter concentration. However, when forestland areas are suitably connected, this land use type can play a notable role in inhibiting particulate matter concentration aggravation. This conclusion is of great relevance to urban land use planning and sustainable development.
1. Introduction
Land not only provides an important basis of human survival but is also an essential resource for human development [1]. Land use and land cover are two different but closely related concepts. Land use refers to the dynamic and purposeful utilization of natural land resources by humans, while land cover constitutes the synthesis of natural and human-made buildings covering the Earth’s surface. Both of these concepts are important land system attributes [2,3]. All human activities are inseparable from land. These activities have affected the distribution patterns and change mechanisms of the original land system and exerted far-reaching influences on resources, the environment, geographical processes, and biodiversity [4,5]. The urban environment is the result of the combined influence of industrial production and urban construction. Land use types have increasingly changed from natural types, such as farmland, forestland, and grassland, to artificial types, which is one of the important characteristics of urbanization. The increasing frequency of human activities has accelerated land use type changes, altered the original urban landform and regional energy balance, damaged the natural ecological functions of the surface system, and driven air flow exchange variations between surface particles and the atmosphere, affecting the generation, diffusion, dilution, and collection of particles and thus affecting the atmospheric environment [6,7]. The compositional structure, content, and properties of the atmosphere can change due to changes in land use/land cover, and the chemical properties and processes of the atmosphere can also be affected, which can impact the gas-generation mechanism, thus influencing the circulation of atmospheric materials within a given region. In the long term, these effects may alter the local climate and even affect the global climate [8]. Landscape patterns describe the spatial distribution of landscape patches of different shapes and sizes, which is an important manifestation of landscape heterogeneity and can reflect the effects of various ecological processes. The study of landscape patterns can elucidate the inherent spatial distribution of seemingly disorderly patches and quantitatively describe their changes over time [9]. Analyzing changes in land use/land cover types and the evolution of landscape patterns can provide insights into the extent, directions, and characteristics of changes in particulate matter [10]. Environmental protection, environmental improvement, and the optimization of land use patterns in development to improve urban air quality are all major issues related to the effects of land use/land cover on atmospheric particulate matter.
In recent years, the contribution of human activity-related emissions to particulate matter has gradually increased. Vehicle exhaust, road dust, industrial emissions, domestic emissions, fuel combustion-related emissions and building dust continuously drive particulate matter emissions into the atmosphere, and these activities mainly occur in construction land areas. Buildings in cities also have a significant impact on particulate matter dispersion [11,12]. Many research results revealed that the higher the construction land proportion is, the higher the air pollution degree. Xu et al. [8] found that the construction land and road area proportion in the Changsha–Zhuzhou–Xiangtan urban agglomeration was significantly positively correlated with the concentrations of NO2 and particles with aerodynamic diameters of 2.5 μm or smaller (PM2.5), and the influence on NO2 was greater than that on PM2.5. In contrast, the influence on particles with an aerodynamic diameter of 10 μm or smaller (PM10) was unstable, which may have been because vehicle exhaust emissions comprised the main NO2 source and were closely related to construction land and road areas. Peng et al. [13] determined that forestland in Chengdu exerted an obvious influence on NO2 concentration variations; urban land was highly correlated with the highest total suspended particulate matter concentration; and the spatial distributions of NO2 and total suspended particulate matter concentrations were highly consistent with those of urban land, industrial and mining land, and transportation land areas. Font et al. [14] reported that PM10 greatly increased during and after road expansion in London, but the impact on PM2.5 was relatively limited, indicating that construction activities contributed more notably to PM10. Zhai et al. [15] observed a highly positive correlation between the NO2 column concentration in the troposphere and the coverage rates of impervious surfaces in various cities and municipal districts, and the spatial distribution patterns in these two hot-spot areas were consistent. The mean NO2 column concentration in the troposphere above open, compact, intensive, and highly intensive municipal districts increased sequentially, and the standardized concentration index of the NO2 column in the troposphere above areas exhibiting impervious surface expansion exhibited an upward trend. Tang et al. [10] found that hazy days in Beijing showed obvious positive correlations with construction land, residential areas, industrial and mining land, and transportation land. There was a significant positive correlation between the building area and PM1.0 concentration in the 0.5- and 1-km buffer zones. Wei et al. [16] determined that an obvious negative correlation existed between urban land use and pollution-free weather; however, positive correlations with other weather conditions were found, and these correlations gradually increased. Mo et al. [17] reported that the concentrations of PM2.5, PM10, and other particulate matter types in Beijing were positively correlated with the resident population density, regional gross domestic product (GDP), and other factors that significantly reflected the urbanization level.
Forestland and grassland, as typical vegetation types, are generally considered to reduce particulate matter. First, human activities in forestland and grassland are limited; few anthropogenic emission sources occur; and natural emissions are the main source of particulate matter. Second, vegetation cover can effectively separate the surface and atmosphere, thus preventing floating dust near the surface from rising into the atmosphere. Third, vegetation with a complex canopy structure can reduce the wind speed and prevent particles from entering local areas. In addition, particles fall onto vegetation surfaces due to dry sedimentation and are adsorbed or captured by leaves, stems, and other organs, which can play notable roles in dust retention. Xu et al. [8] found that forestland, green land, and cultivated land areas were negatively correlated with NO2 and PM2.5 concentrations. Wei et al. [16] reported that forestland was positively correlated with nonpolluted and slightly polluted weather conditions but negatively correlated with highly polluted weather conditions. Shi et al. [11] determined that a decrease in cultivated land and forestland areas and an increase in construction land areas contributed to a decrease in the number of foggy days but aggravated the haze occurrence degree and frequency. Mo et al. [17] observed that the trend of the concentrations of PM2.5, PM10, and other particulate matter types in Beijing was the opposite of the development trend of forest coverage, exhibiting a significant negative correlation. Tang et al. [10] found that an obvious negative correlation existed between ecological land and cultivated land areas and the number of haze days in Beijing, and an obvious negative correlation between the green space area proportion and PM1.0 concentration in 0.5- and 1-km buffer zones was identified. Sun [18] reported that the PM10 concentrations associated with various land use types in the Pearl River Delta region followed the ascending order of forestland, grassland, farmland, construction land, and desert wasteland. Generally, the influence of farmland on particulate matter is bidirectional. During the crop growing season, vegetation cover causes farmland to exert a certain dust-retention effect, but the corresponding efficiency may be lower than that of forestland and grassland [19,20]. After crop harvesting, dust emitted during straw burning represents an important source of particulate matter [21,22]. Moreover, in winter, without vegetation coverage, a large amount of dust becomes exposed on the surface and is easily lifted into the atmosphere [19,20]. The influence of water on particles is complicated. On the one hand, when particles fall on the water surface due to sedimentation, these particles are not resuspended. On the other hand, the presence of water causes the temperature to decrease and the humidity to increase, which may affect the accumulation and diffusion of particulate matter [20,23]. Due to the lack of vegetation coverage, a large amount of floating dust is exposed near the surface of unused land and is easily lifted into the atmosphere under the action of wind. Generally, floating dust readily becomes the main source of particles, and the corresponding contribution to particles with a large aerodynamic equivalent diameter is relatively high.
The temporal and spatial variability of particulate matter concentrations is a complex system that is driven by a combination of influencing factors. The effects of meteorological factors, human activities, and topographic conditions on particulate matter have been studied by several scholars [24,25,26,27]. In this manuscript, we focus on the intrinsic patterns of land use, and it is essential to explore its impact on the atmospheric environment to guide land use planning scientifically. In this paper, land use distribution and changes are analyzed using land use classification data in the Beijing–Tianjin–Hebei (BTH) region in 2015–2018. The differences in different land use types on the temporal changes in atmospheric particulate matter concentrations are explored with the help of an improved sine function model. The correlation between landscape patterns and atmospheric particulate matter is analyzed using landscape ecology and statistical methods. The results of this paper are important for the prevention and control of atmospheric pollution and the sustainable development of resources and the environment and can also provide a scientific reference for the optimal allocation of land resources.
2. Methods
2.1. Optimized Particle Concentration Fitting Model
Systematic mathematical models can be used to fit concentration change patterns. Comparison of the parameters in the fitted results among different regions is a powerful tool for analyzing the changes in pollutant concentrations. The concentration exhibits a significant periodicity in annual cycles, with a peak and a trough in each cycle. To analyze the characteristics of the variation in particulate matter concentration over time quantitatively, many scholars fitted periodic quantitative mathematical function models, among which the sinusoidal function model is the most widely adopted [28,29,30,31,32]. The traditional sine model is based on the least-squares method and comprises linear and sine functions. The general form of the sine function model is shown in Figure 1a. The corresponding equation is defined as follows:
where y is the particulate matter concentration, and the first two terms on the right side of the equal sign constitute a linear function, i.e., , representing the interannual variation trend of the particulate matter concentration. The third term is a sine function, i.e., , which is applied to describe the periodic variation characteristics of the particulate matter concentration on a monthly scale. Scholars evaluated and applied this model in monthly analyses of mean particulate matter concentrations at the country, region, and city spatial scales and confirmed that it can describe the general temporal variation patterns of particulate matter concentrations. However, due to its relatively simple function shape, the model is limited in its ability to provide detailed information on the variation in particulate matter. To capture the actual trends in changes in particulate matter concentrations more closely, describe temporal changes in monthly mean concentrations more accurately, and determine the inherent mechanisms, this paper improves the traditional sinusoidal function model in the following aspects [33]:
- (1)
- Regarding general concentration change trends, a quadratic function is employed instead of a linear function, and this function can suitably fit various situations, such as initially rising and then falling, initially falling and then rising, accelerated rising or falling, decelerated rising or falling, and steadily rising or falling concentrations.
- (2)
- In particulate matter concentration fluctuations, when the overall concentration increases, the fluctuation range also increases. When the overall concentration decreases, the fluctuation amplitude also decreases. Therefore, the first half of a quadratic function, i.e., , is added to the coefficient of the original sine function. This improvement ensures that the amplitude no longer remains fixed over time but varies with the overall concentration change trend.
- (3)
- At the monthly scale, changes in the particulate matter concentration are often not symmetrical periodic fluctuations, and often, the durations of periods with low values are long, while the durations of periods with high values are short. Notably, narrower peaks and wider valleys or the opposite, i.e., wider peaks and narrower valleys, may occur. Considering these concentration change characteristics, this paper replaces the original sine function with and adds a deformation factor Ft to control the shape of the sine function based on its magnitude.
- (4)
- The particulate matter concentration variation during a given cycle is often not symmetrical or uniform, and the concentration increase and decrease rates in this case are not equal. In particular, the time from one wave peak to the next wave trough is not the same as the time from one wave trough to the next wave peak. According to this feature, an oscillation term with the same period and a π/2-phase difference is added to x in the sine function; x is replaced with ; and the left/right shifting of the peak or trough is controlled by the magnitude of the offset factor Ht.
After the above 4 improvements, the general form of the improved sine function model is schematically shown in Figure 1b. The improved function is reorganized, and an improved sine function model equation is obtained as follows:
where y is the particulate matter concentration, and the terms on the right side of the equal sign comprise a quadratic function and the improved sine function that captures uneven fluctuations. There are a total of 8 parameters from At to Ht in the formula, and the meaning and description of each parameter are shown in Table 1.
2.2. Landscape Pattern Index
In this paper, the landscape pattern changes reflected by common landscape pattern indices at the landscape and patch levels were evaluated. It should be noted that certain indices may yield different meanings at different levels and should be examined separately [34,35].
2.2.1. Landscape Level
At the landscape level, the calculation methods and specific meanings of the patch density (PD), largest patch index (LPI), edge density (ED), contagion index (CONTAG), splitting index (SPLIT), Shannon’s diversity index (SHDI), Simpson’s diversity index (SIDI), aggregation index (AI), and eight other landscape pattern indices are explained below.
PD is equal to the number of patches in the landscape divided by the total landscape area (m2), which is then multiplied by a scaling factor of 1,000,000 (conversion into 100 hectares), with a value range of (0, +∞). Moreover, PD is expressed as the number of patches per 100 hectares. When each unit involves an individual patch, the PD value is the largest, which indicates that based on the number of patches per unit area, landscapes of different sizes can be compared. PD can be calculated as follows:
where N is the number of patches in the landscape, and A is the total landscape area (m2).
LPI is expressed as a percentage and is equal to the percentage coverage of the largest patch in the area, with a value range of (0, 100). When the largest patch in the landscape decreases in coverage, the LPI gradually approaches 0. When the whole landscape comprises only one patch, i.e., the largest patch accounts for 100% of the landscape area, LPI = 100. This index is a simple way to measure dominance. The LPI equation is
where aij is the area of patch ij (m2), and A is the total landscape area (m2).
ED is equal to the sum of the lengths (m) of all edge segments related to the corresponding patch types divided by the total landscape area (m2), which is then multiplied by 10,000 (conversion into hectares), with a value range of (0, +∞) in meters per hectare. When no graded edges occur in the landscape, i.e., when the whole landscape comprises only one patch, ED = 0. This index can be adopted to compare landscapes of different sizes. ED can be calculated as
where eik is the total length (m) of the edge segments in the landscape of patch type i, and A is the total landscape area (m2).
CONTAG represents the highest possible contagion degree observed for a given number of patch types, with a value range of (0, 100) expressed as a percentage. When the patch types are decomposed and dispersed to the greatest extent, CONTAG approaches 0. CONTAG = 100 when all patch types exhibit the maximum aggregation degree. CONTAG reflects the aggregation or expansion degrees of different patches in the landscape. A high value indicates a good relationship between certain major patch types, while a low value indicates that the landscape encompasses a multielement intensive pattern with a high degree of landscape fragmentation. The CONTAG calculation equation is
where Pi is the proportion of the landscape occupied by patch type I; gik is the number of connections between pixels of patch types i and k based on the double-counting method; and m is the number of patch types in the landscape.
SPLIT is equal to the square of the total landscape area (m2) divided by the sum of the squared patch areas (m2), and its value range is [1, n2], where n is the total number of pixels in the area (dimensionless). When the landscape comprises a single patch, SPLIT = 1. SPLIT reaches its maximum value when the landscape is subdivided to the greatest extent. SPLIT is based on the regional distribution of accumulated patches and can characterize the degrees of separation between various patch types. SPLIT can be calculated as follows:
where aij is the area of patch ij (m2), and A is the total landscape area (m2).
SHDI denotes the proportional abundance of each patch type among all negative patch types multiplied by the sum of the proportions, and its value range is [0, +∞). When the landscape contains only one patch type, SHDI = 0. As the proportional distribution of areas among various patch types becomes increasingly uniform, SHDI increases. SHDI can reflect landscape heterogeneity and is particularly sensitive to an unbalanced distribution of various patch types in the landscape. If the land use diversity and fragmentation degree are high, the information content in the uncertainty and the SHDI value will increase. The SHDI equation is
where Pi is the proportion of the landscape occupied by patch type i.
SIDI is equal to 1 minus the sum of the proportional abundance of the square of each patch type among all patch types, with a unitless range of [0, 1]. When the landscape contains only one patch type, SIDI = 0. With an increasing number of different patch types (i.e., increasing patch abundance), SIDI approaches 1. SIDI is another popular diversity index borrowed from community ecology that is insensitive to the presence of rare types and provides a more intuitive explanation than does the Shannon index. SIDI can be calculated as follows:
where Pi is the proportion of the landscape occupied by patch type i.
AI denotes the number of similar adjacencies of a certain type divided by the maximum possible number of similar adjacencies of this type, which is then multiplied by the landscape proportion of this type. Subsequently, the total value for all types is multiplied by 100 (conversion into a percentage), and AI has a value range of [0, 100] expressed as a percentage. For AI = 0, the patch types are decomposed to the greatest extent. With increasing landscape aggregation, AI increases. When the landscape comprises a single patch type, AI equals 100. AI represents the frequency of different patch types occurring side by side on the map, which can reflect the patch aggregation degree. The AI equation is
where gii is the number of similar adjacencies between pixels of type i based on the single-counting method; max(gii) is the maximum value of gii; and Pi is the landscape proportion of type i.
2.2.2. Class Level
At the class level, five landscape pattern indices, including the percentage of the landscape (PLAND), PD, LPI, largest shape index (LSI), and SPLIT, were selected, and their calculation methods and specific meanings are explained below.
PLAND is the percentage of the area of the corresponding patch type in the total landscape area, with a range of (0, 100) expressed as a percentage. When the number of corresponding patch types in the landscape decreases, PLAND approaches 0. When the whole landscape comprises a single patch type, PLAND = 100. PLAND quantifies the proportional abundance of each patch type in the landscape, which is an important measure of the landscape composition in many ecological applications. The PLAND calculation equation is
where Pi is the landscape proportion occupied by patch type i; aij is the area of patch ij (m2); and A is the total landscape area (m2).
PD is equal to the number of patches of the corresponding patch type divided by the total landscape area (m2) and multiplied by 1,000,000 (converted to 100 hectares), and its value range is (0, +∞) in units of the patch number per 100 hectares. When each cell is an individual patch, PD is the largest, and the final cell size determines the maximum number of patches per unit area. PD represents the number of patches per unit area, which is helpful for comparing landscapes of different sizes. The formula of PD is
where ni is the number of patches i of the corresponding type, and A is the total landscape area (m2).
LPI denotes the percentage coverage of the largest patch of the corresponding type in the total area, with a value range of (0, 100) expressed as a percentage. When the largest patch area of the corresponding type decreases, the LPI gradually approaches 0. When the whole landscape comprises individual patches of corresponding patch types, LPI = 100. This is a simple method to measure the dominant position. LPI can be calculated as
where aij is the area of patch ij (m2), and A is the total landscape area (m2).
LSI is equal to 0.25 multiplied by the sum of the whole landscape boundary and the lengths (m) of all edge segments of the corresponding patch type in the landscape boundary, which is then divided by the square root (m2) of the total landscape area. The LSI value range is [1, +∞] and is unitless. When the landscape contains a single square patch of the corresponding type, LSI = 1. With increasing edge lengths of the corresponding patch type in the landscape, LSI increases infinitely, which provides a standardized measure of the total edges or ED. The LSI calculation equation is
where is the total length (m) of lateral edges between patch types i and k, and A is the total landscape area (m2).
SPLIT is determined as the square of the total landscape area (m2) divided by the sum of the squares of all patch areas (m2), and its value range is [1, n2], where n is the total number of pixels in the area (dimensionless). When the landscape contains a single patch type, SPLIT = 1. As the area of the focal patch type gradually decreases or the focal patch type is subdivided into smaller patches, SPLIT increases. SPLIT is based on the regional distribution of accumulated patches and can characterize the degrees of separation between various patch types. The SPLIT equation is
where aij is the area of patch ij (m2), and A is the total landscape area (m2).
3. Results and Discussion
3.1. Overview of the Study Area and Data
The BTH region is located between 113°27′~119°51′ E and 36°05′~42°40′ N (Figure 2). The terrain is inclined, exhibiting high elevations in the northwest and low elevations in the southeast, with complex and heterogeneous landforms, including plateaus, mountains, hills, basins, and plains. From northwest to southeast, the region is roughly divided into the Bashang Plateau, Yanshan-Taihang Mountains, and Haihe Plain. The BTH region experiences a temperate of a semihumid continental monsoon climate, with distinct winters and summers, and more than 67% of precipitation is concentrated in the summer. The BTH region covers an area of approximately 217,200 square kilometers, which accounts for 2.3% of the total land area in China. This area hosts a dynamic economy, the highest degree of economic openness, the strongest innovation ability, and the highest foreign population absorption level in China. However, many particulate matter indicators seriously exceed relevant standards due to the dense population and notable industrial agglomeration, and smog and other air pollution phenomena frequently occur in the BTH region due to its rapid economic development. Air pollution seriously threatens the ecological environment and human health and affects the residential quality of life. The pollution conditions in the BTH region are highly representative of those in China and worldwide.
3.1.1. Land Use Data
The land use/land cover data analyzed in this experiment included the C6 version of MCD12Q1, which is a land cover product of the Moderate Resolution Imaging Spectroradiometer (MODIS, https://modis.gsfc.nasa.gov/, accessed on 1 December 2021). The temporal resolution of the data was 1 year; the spatial resolution was 500 m; and a data mosaic of four scenes could cover the entire BTH region. Since 2001, relevant data were updated at annual intervals and stored in the HDF4 file format. The projection method is sinusoidal projection, which includes 8-day comprehensive MODIS observation results obtained from Terra and Aqua satellite MODIS sensors throughout the year. Combined with the characteristics of the surface reflectivity and surface temperature, the data were analyzed with a supervised decision tree classification algorithm based on a high-quality land cover training sample database. The land cover classification schemes for the dataset include the International Geosphere-Biosphere Programme (IGBP) scheme, University of Maryland (College Park, MD, USA), leaf area index (LAI)/fraction of the absorbed photosynthetically active radiation (FPAR), net primary production (NPP), plant functional type (PFT), and Food and Agriculture Organization-Land Cover Classification System (FAO-LCCS, https://www.fao.org/home/en/, accessed on 1 December 2021) (Rome, Italy). The PFT classification scheme, including water bodies, evergreen coniferous forestland, evergreen broad-leaved forestland, deciduous broad-leaved forestland, shrub/forestland, grassland, cereal crops, broad-leaved crops, built-up areas, snow and ice, bare land, and other types, was adopted in this experiment [36,37]. Many experiments show that the MCD12Q1 dataset has a high classification accuracy. For more information on the accuracy of the dataset products, please refer to Sulla-Menashe et al. [36,37]. Before conducting the experiment, we first reclassified the data and organized them into six types (Table 2).
3.1.2. Air Quality Monitoring Data
The air quality data obtained in this experiment included real-time monitoring data from monitoring stations. The China National Environmental Monitoring Center (Beijing, China) releases automatic hourly air quality monitoring results from all monitoring stations and cities in China to the public through the National Urban Air Quality Real-time Publishing Platform (http://106.37.208.233:20035/) accessed on 1 December 2021. In this experiment, 215 stations distributed in the BTH region and surrounding cities were selected (as shown in Figure 3). From 0:00 on 1 December 2014, to 23:00 on 31 December 2018, 35,808 h of hourly PM2.5 and PM10 concentration data were acquired. First, the data were calculated and integrated. For the small amount of missing data, hourly average values on other days in the corresponding months were used to obtain PM2.5 and PM10 values at each point. Then, the ordinary kriging interpolation method was applied to obtain the spatial distribution of particulate matter concentrations in each time interval within the study area, with a spatial resolution of 500 m. Moreover, the PM2.5/PM10 ratio at each spatial position and each region was calculated. Finally, the spatial mean values of particulate matter concentrations in the whole study area in each region and for each land use type at different time scales were obtained by the statistical partitioning method. The ordinary kriging method dynamically determines the values of variables according to an optimization criterion function in the interpolation process to ensure that the interpolation function is in the best state; this process takes into account both the positional relationship between the observed and estimated points and the relative positional relationship among the observed points and is more effective when the number of points is relatively sparse.
3.1.3. Accuracy Verification of the Optimization Model
To verify the accuracy of the improved model, both the traditional and improved models were adopted to fit the monthly mean values of PM2.5 and PM10 concentrations in the whole study area and in cities. In addition, the goodness-of-fit R2 value was compared between these two models, and the results are listed in Table 3. Among the PM2.5 and PM10 fitting results, the average R2 values of the traditional model are 0.51 and 0.49, respectively, and the average R2 values of the improved model are 0.65 and 0.57, respectively, which indicate increases of approximately 0.14 and 0.08, respectively. The goodness of fit of the improved model is considerably higher than that of the traditional model, which verifies that the improved model achieves a higher fitting accuracy, can extract more information from the data, and is more suitable for quantitative analyses of the variation characteristics of particulate matter concentrations. In addition, compared to the traditional sine function, the improved function better quantifies the general trends, amplitudes, deformation degrees, deviation degrees, and other parameters. In addition to the particulate matter concentration, this method can be extended to other elements conforming to the periodic variation pattern involving a single peak and a single valley, such as the vegetation coverage, monthly mean temperature, and monthly mean precipitation. The corresponding patterns of variation can be examined based on the obtained fitting results.
3.2. Influence of Land Use on the Atmospheric Particulate Matter Concentration
3.2.1. Spatiotemporal Characteristics of Land Use
The spatial distribution of land use in the study area for each year is shown in Figure 4a–d. The eastern and southern parts of the study area are on the Haihe Plain, and the construction land is concentrated in the built-up areas of the cities and the surrounding villages, while the agricultural land is mostly between the cities and villages. The northeastern and southwestern parts of the study area are in the Yanshan Mountain Range and Taihang Mountain Range, and forestland is mostly distributed in areas with higher elevations and higher slopes, while grassland is distributed in areas with lower elevations and gentler slopes. The northwestern part of the study area is in the Bashang Plateau, and grassland is the most dominant land use type. The locations where land use changes occurred are shown in Figure 4e. Forestland, as the largest land use type with the largest new area, occurred mainly in the mountainous areas. The increase in grassland occurred mostly on the gentle slopes of the mountains. New farmland is mainly present in the northwestern Bashang Plateau, the eastern side of the Taihang Mountains, and the eastern coastal areas. The new construction land mainly occurs on the periphery of the built-up areas of the cities and is the spatial manifestation of urban expansion.
The area of each land use type in descending order is farmland, grassland, forestland, construction land, water bodies, and unused land, among which the areas of farmland and grassland are decreasing; the areas of forestland and construction land are increasing at relatively fast and slow rates, respectively; and the area of water bodies and unused land is small and has remained relatively unchanged. The land use conversion matrix is shown in Table 4. Approximately 4.5% of the study area underwent land use change in mid-2015–2018, with grassland and forestland being the two relatively active types. A total of 8.8% of grassland was transformed, mainly to forestland and farmland. A total of 4.8% of forestland was transformed, mainly to grassland. A total of 2.6% of farmland was transformed into grassland, forestland, and construction land. Construction land is the most stable of all types and is generally not converted to other types. Smaller areas of water bodies and unused land underwent negligible conversion.
3.2.2. Comparison of Atmospheric Particulate Matter Concentrations between Various Land Use Types
The spatial distributions of each land use type in the study area from 2015 to 2018 were extracted, and the extracted distributions were superimposed onto the interpolation data of the monthly mean values of the particulate matter concentration in the corresponding year and month to determine the monthly mean particulate matter concentrations corresponding to each land use type. Moreover, the average values for the same month in each year were calculated. The results are shown in Figure 5. The results indicate obvious differences in particulate matter concentrations among the various land use types. Among the land use types, the particulate matter concentrations corresponding to construction land and farmland were higher than those corresponding to the other types. Among the various land use types, construction land encompasses areas with the highest human activity intensity and motor vehicle exhaust, road dust, industrial emissions, domestic emissions, fuel combustion-related emissions, and construction dust, all of which are closely related to particulate matter emissions. In addition, the building density and height in urban built-up areas are high. The resultant blocking and friction effects weaken regional winds, greatly affecting particulate matter diffusion [11,12]. The influence of farmland on particulate matter exhibited seasonal differences. During the crop growing season, farmland is mostly covered with vegetation, which inhibits the emission of surface particulate matter to a certain extent, while leaves generate a certain dust-retention effect. However, due to the relatively low heights and comparatively neat arrangements of crops, this dust-retention effect may be lower than those of forestland and grassland [19,20]. After harvest, the dust emitted during straw burning represents an important source of particulate matter [21,22]. Especially during the cold winter season, farmland lacking vegetation coverage is mostly bare, and a large amount of dust becomes exposed and is easily emitted into the atmosphere under windy weather conditions, resulting in a notable increase in the wintertime particulate matter concentration [19,20,38]. The particulate matter concentrations corresponding to forestland and grassland were significantly lower than those corresponding to the other land use types, and the intensity of particulate matter removal was positively related to the vegetation growth degree, which was considerably higher in summer than in winter. Vegetation stems, leaves, and other organs remove particles suspended in air via retention, attachment, and adhesion mechanisms [39]. First, the plant canopy can block airflow and locally reduce the wind speed, which can result in the deposition of atmospheric particles onto the surfaces of leaves. Moreover, the turbulence between branches and leaves is very high, which makes it easier for particles to collide with and contact branches and leaves, thus increasing the settling rate [40]. Second, the surface structures of plant leaves and bark are very rough, and certain groove-like tissues, cilia, waxy layers, etc. can intercept particles that become embedded into their rough surfaces, and the deposition effect remains relatively consistent [41]. Third, plant leaves often secrete sticky substances, which can cause particle adhesion to their surfaces. This dust retention effect remains the most stable and can withstand rain erosion. Vegetation can also create an environment conducive to particle sedimentation. Tree canopies generate shade effects, and leaves generate transpiration effects, which can achieve cooling effects. Moreover, vegetation can increase the relative air humidity and adjust the local microclimate, thus altering the viscosity and quality of particles, shortening the particle suspension time and accelerating the sedimentation process. Furthermore, vegetation effectively inhibits chemical reactions of particles and reduces the generation of secondary particles [42]. In addition, the PM10 concentrations in forestland and grassland areas increased the most in spring, which is mainly attributed to frequent dusty weather conditions. The effect of water on the particulate matter concentration is complicated. On the one hand, the particulate matter emission levels of water bodies were lower than those of the other types, and water simultaneously exerted a certain adsorption effect on suspended particulate matter. On the other hand, water evaporation can increase humidity, which can affect the secondary formation, accumulation, and diffusion of particulate matter [19,43,44,45]. The vegetation coverage in unused land areas is low, and bare soil or sand on the surface can easily be entrained by wind, resulting in particulate pollution. However, because the unused land area in the study region is small and mostly distributed in the coastal areas and northwestern Bashang Plateau, unused land areas are mostly surrounded by water bodies and grasslands. Therefore, the particulate matter concentration mostly varied between the levels corresponding to water bodies and grasslands.
3.2.3. Variation Patterns of the Atmospheric Particulate Matter Concentration for Different Land Use Types
The analysis of the temporal variation in the particulate matter concentration corresponding to each land use type in the study area revealed that the particulate matter concentration corresponding to each land use type was similar to that in the whole study area, and an obvious periodic variation pattern occurred. Therefore, the improved sine function model was employed to fit the particulate matter concentration corresponding to each land use type, and the inherent relationship between the land use type and particulate matter concentration was explored by comparing the fitting parameters between various land use types. The results are shown in Figure 6 and Figure 7.
Fitting parameters were separately obtained for the whole study area and each city, and the results are summarized in Table 5.
First, the goodness-of-fit R2 value was evaluated. The average R2 values of the PM2.5 and PM10 concentrations corresponding to the six land use types are 0.70 and 0.53, respectively, verifying that the improved model can better reflect the change pattern of the monthly mean particulate matter concentration for each land use type. The fitting R2 value of the PM2.5 concentration for all land use types is above 0.6, and the fitting effect is good. The fitting R2 value of the PM10 concentration exceeds 0.6 for construction land; is above 0.5 for water bodies, farmland, and unused land; and is below 0.5 for forestland and grasslands. Generally, the fitting R2 value of the PM2.5 concentration for all land use types is higher than that of the PM10 concentration, which once again demonstrates that the periodic fluctuation patterns of the PM2.5 concentration were stronger than those of the PM10 concentration. Among all types, construction land exhibits the highest R values, which is attributable to the close relationship between the seasonal patterns of human activities. Especially after the heating period in winter, the particulate matter concentration corresponding to construction land sharply increased, resulting in the largest differences between high and low values for all land use types and the most notable periodicity. The fitting R2 values for forestland and grassland are relatively low. On the one hand, periodic fluctuations were slightly limited in forestland and grassland areas due to the presence of fewer particulate matter emission sources and fewer anthropogenic emissions. On the other hand, particulate matter concentrations corresponding to forestland and grassland were significantly lower than those corresponding to the other land use types, and random factors imposed a great influence, producing certain randomness and consequently reducing the periodic fluctuation patterns, thus yielding slightly poor fitting effects.
The quadratic coefficient At and linear coefficient Bt reflect the overall change trends of particulate matter concentrations in the whole study area and in cities. The PM2.5 concentrations corresponding to all land use types exhibited downward trends, with those of water bodies exhibiting an accelerated downward trend; those in forestland, grassland, and unused land all exhibiting gradual downward trends; and those in both construction land and farmland first increasing and then decreasing. Additionally, the axis of symmetry occurred in 2015, i.e., an accelerated downward trend was exhibited throughout most of the research period. In terms of the overall change trends of PM10 concentrations for various land use types, the PM10 concentrations corresponding to water bodies, farmland, and construction land decreased at an accelerated rate; the concentration corresponding to unused land decreased at a low rate; the concentrations in forestland and grassland areas first decreased and then increased; and the axis of symmetry occurred in 2017. However, the average PM10 concentration was the lowest among all types, with a limited decline and increase; thus, the PM10 concentrations basically remained at low levels. Overall, although the overall average concentrations in the study area exhibited downward trends, the change rates varied between different land use types. The particulate matter concentrations corresponding to construction land and farmland were relatively high but simultaneously decreased at higher rates, and the decrease rates were accelerated. The particulate matter concentrations in forestland and grassland areas were low; the decrease rates of the PM2.5 concentration were decelerated; and the PM10 concentrations slightly increased after decreasing to a constant level. The particulate matter concentrations in areas containing water bodies and unused land were lower than those in farmland and construction land areas but higher than those in forestland and grassland areas, with the particulate matter concentration corresponding to water bodies rapidly decreasing, while the particulate matter concentration corresponding to grassland decreased gradually.
The amplitude Dt is the ratio of the focal concentration fluctuation amplitude to that of the overall concentration. Construction land and farmland exhibited significantly higher values than did the other land use types because these two types are the most affected by human activities. Therefore, these land use types exhibited large differences between winter and summer. Moreover, the amplitude of the PM2.5 concentration for all land use types was obviously larger than that of the PM10 concentration, which also indicates that the PM2.5 concentration is more closely related to human sources.
The deformation factor Ft reflects the durations of periods with high and low concentrations. The larger the value is, the shorter the durations of high and low concentrations are. The deformation factor Ft of the PM2.5 concentration for each type was larger than 1, which suggests that the duration of low-value periods was longer than that of high-value periods, with the Ft values of construction land and farmland being significantly higher than those of the other land use types. This finding was attributable to the maximal intensity of human activities in construction land and farmland areas producing sharp increases in particulate matter concentrations in winter. This pattern was quite different from the low-value periods in summer. The relatively high values further shortened the duration of high-value periods. However, the Ft values of the PM10 concentration for water bodies, forestland, grassland, and unused land were smaller than 1, which indicates that the duration of high-value periods was longer than that of low-value periods for these land use types. This pattern occurred because the frequent dusty weather conditions in spring prolonged the duration of high-PM10-concentration periods, and high values continued to occur in winter and spring, which imposed a particularly notable impact on water bodies, forestland, grassland, and unused land. Farmland and construction land areas are more affected by human activities, and the Ft values were larger than 1, i.e., the duration of low-value periods was increased.
The phase Gt reflects the time when a peak value occurs during a period. The larger the value, the earlier the peak and valley values are observed. There was little difference in the phases of PM2.5 concentrations among different land use types, which indicates that the peak and valley values for each land use type occurred at similar times. Regarding the PM10 concentration model, the phases Gt of forestland and grassland were obviously lower than those of the other land use types, which was attributed to the low vegetation coverage in spring. In addition, frequent dust events slightly increased the PM10 concentration for all land use types, while the spring season exhibited relatively low vegetation coverage, which exerted a notable impact on vegetation types such as forestland and grassland. Therefore, the PM10 concentrations in forestland and grassland areas were higher than the notable peak values observed in March and April, while the peak values for the other land use types often occurred in December or January, resulting in higher values of the phase Gt in forestland and grassland areas.
The offset factor Ht controls the slight shift in the peaks and valleys from left to right. A positive value indicates a rightward shift in the valleys; a negative value indicates a leftward shift in the valleys; and the larger the absolute value is, the greater the shift. The shift factor Ht of the PM2.5 concentration for each land use type was larger than 0, which indicates that for all land use types, each valley was far from the previous peak and that the next peak was closer. Notably, the concentration slowly decreased and subsequently increased rapidly. The PM10 concentration indicates that the Ht values in forestland and grassland areas were smaller than or close to 0, i.e., the peak values occurred later. In addition, the concentrations decreased faster and increased slower, which is similar to the reason why the Gt values of the PM10 concentrations of forestland and grassland were smaller than those of the other land use types. Among all types, the Ht value of farmland was the largest because farmland reduced particulate matter concentrations during the crop growth period. Hence, the particulate matter concentration exhibited a steady and gradual downward trend. However, after crops were harvested, surface dust became exposed due to the absence of vegetation coverage and was emitted into the air, and the particulate matter concentration rapidly increased.
3.3. Influence of Landscape Pattern on the Atmospheric Particulate Matter Concentration
According to the division of county-level administrative regions, the study area was divided into 200 county-level units, and the average PM2.5 and PM10 concentrations throughout the whole year and during the four seasons of 2018 in each district and county were separately determined. The landscape pattern indices of each district and county at the landscape and class levels were obtained in Fragstats 4.2 software (University of Massachusetts Amherst, Amherst, MA, USA), and the influence of the landscape pattern on the atmospheric particulate matter concentration was evaluated by correlation analysis. Considering that water bodies and unused land accounted for only 1.3% and 0.2%, respectively, of the total area of the study region and imposed limited regulation effects on the large-scale particulate matter concentration, only the four most important land use types, namely, forestland, grassland, farmland, and construction land, were examined at the class level.
3.3.1. Atmospheric Particulate Matter Concentration Distribution
The average PM2.5 and PM10 concentrations in all districts and counties throughout the whole year and in the four seasons were statistically analyzed. The results are shown in Figure 8. The results reveal that the overall particulate matter concentration exhibited a spatial distribution trend similar to that in the whole region, in which the annual average PM2.5 concentration exhibited a trend of high values in the southeast and low values in the northwest. High values were mainly concentrated in the Shijiazhuang–Baoding and Handan–Xingtai areas, while the concentrations in Zhangjiakou, Chengde, and other cities in the north were low. During each season, the spatial distribution patterns of the seasonal average concentrations in winter and spring in all districts and counties were similar to those of the annual average concentrations, while in spring and summer, excluding the Shijiazhuang–Baoding and Handan–Xingtai areas, relatively high concentrations were observed in Beijing, Tianjin, Langfang, and other cities. The annual average trend of the PM10 concentration was similar to that of the PM2.5 concentration, exhibiting the same distribution trend of high values in the southeast and low values in the northwest. The difference is that Tangshan city on the eastern coast also contained relatively high-concentration areas, with the lowest concentrations mainly concentrated in Zhangjiakou city and Chengde city in the north. The distribution pattern during each season was similar to that of the annual average concentration. Moreover, the frequent dusty weather conditions in spring caused a slight increase in the concentration in Northwest China, and simultaneously, the concentration in Tangshan increased, while relatively high-concentration areas moved slightly northwards.
3.3.2. Effects of Land Use Types on Atmospheric Particulate Matter Concentrations
The landscape pattern indices at the landscape level are shown in Figure 9, and the correlation between the particle concentration and indices at the landscape level is shown in Table 6. At the landscape level, each selected index exhibited a certain correlation with the particulate matter concentration, but the correlation degrees were lower than those at the class level, indicating that the distribution pattern of the whole landscape influenced the particulate matter concentration, but the effect degree was weaker than that observed in specific land cover types. Among the indices, LPI, AI, and CONTAG mostly exhibited positive correlations with the particulate matter concentration, while PD, ED, SPLIT, SHDI, and SIDI mostly showed negative correlations with the particulate matter concentration. The remaining indices exhibited weak correlations. The lower the aggregation degree is, the higher the fragmentation degree, the more complex the shape, and the richer the land use types are, the more closely the landscape resembles a natural landscape. Conversely, the opposite characteristics indicate an artificial landscape. Compared to artificial landscapes, natural landscapes contain fewer emission sources, and natural landscapes can simultaneously reduce and limit particulate matter concentrations. In a comparison of the seasons, the correlation of each index in winter and summer was generally higher than that in spring and autumn, which may be attributed to the high particulate matter concentration and notable spatial heterogeneity in winter. In contrast, in summer, the vegetation coverage was the highest; the reduction effect of vegetation on the particulate matter concentration was the strongest; and the landscape pattern distribution exerted a notable influence.
The landscape pattern indices of forestland, grassland, farmland, and construction land at the class level are shown in Figure 10, and the correlation between the particle concentration and indices at the class level is shown in Table 7. PLAND, PD, LPI, and LSI all exhibited negative correlations with the particulate matter concentration, with LSI showing the highest correlation. In contrast, SPLIT exhibited no significant correlation, indicating that the larger the area, density, dominance, and shape complexity of forestland patches were, the lower the particulate matter concentration was, and the complexity of the patch shape imposed the greatest influence on the particulate matter concentration. If the forestland area within a given region is large, this land use type can become the dominant type in the region. However, if the forestland area is concentrated and connected as one unit, this area can reduce and inhibit particles. Among all seasons, the correlation in summer was slightly higher than that in the other seasons, which was related to the high vegetation coverage in forestland areas in summer and the strongest particulate matter inhibition effect of lush trees. Moreover, the influence of forestland areas on the PM10 concentration exceeded that on the PM2.5 concentration.
PLAND and LPI reflect the proportion, dominance degree, and patch connectivity of grassland patches, respectively, and these indices decreased spatially from northwest to southeast. High values were mainly concentrated on the Bashang Plateau and Taihang Mountains, indicating that these areas contained high grassland proportions and high dominance degrees and good connectivity of grassland patches. PD reflects the density of grassland patches, and high PD values were mostly concentrated in the Yanshan Mountains and eastern coastal areas, indicating that although the grassland patches in these areas are small, many patches are present, and their distribution is fragmented. LSI reflects the shape of grassland patches, and high LSI values largely occurred in the Yanshan Mountains and Taihang Mountains, where grassland and forestland are staggered, with complex shapes, dense patches, and small patch sizes. High SPLIT values primarily occurred in the Haihe Plain in the southeast, where the grassland coverage is low, and the distribution is scattered.
Among the various indices for farmland patches, PLAND and LPI exhibited strong positive correlations with the particulate matter concentration, while PD and LSI showed negative correlations. SPLIT exhibited no significant correlation, which indicates that the higher the farmland proportion in the region, the higher the connectivity and the more complete the patches, the higher the particulate matter concentration, and corresponding regions mainly occurred in the Haihe Plain. However, the particulate matter concentration was low in areas with high densities, scattered distributions, and irregular shapes of farmland patches. Among all seasons, PLAND, PD, and LPI exhibited the highest correlations in winter or spring, and there was less vegetation coverage in farmland patches in winter and spring. In areas where farmland dominated, bare surfaces became the main emission particulate matter source, and the resultant correlation was high. LSI showed the highest negative correlation in summer, which may have occurred because the more complex the shapes of farmland patches are, the closer the landscape is to a natural landscape. These areas were dominated by mountains, and farmlands were mostly distributed among many forestlands and grasslands. In summer, the farmland coverage intensity increased. Moreover, the forestland and grassland in the surrounding areas played a notable role in blocking and settling particles, thus reducing the particulate matter concentration.
PLAND and LPI were mostly positively correlated with the PM2.5 concentration but not significantly correlated with the PM10 concentration. Notably, the PM2.5 concentration was higher in areas with high proportions of construction land, once again verifying that human activities comprise the main PM2.5 source, while PM10 is more related to natural factors. PD and LSI were positively correlated with the particulate matter concentration, indicating that the denser the construction land patches and the more complex the shape are, the higher the particulate matter concentration is. A dense distribution of construction land patches can lead to the concentration of emission sources. In contrast, a complex shape indicates that the city is highly developed, and the human activity intensity is high, which produces higher particulate emissions and does not facilitate particulate matter diffusion. SPLIT was negatively correlated with the particulate matter concentration, which indicates that in areas where the distribution of construction land patches is scattered, construction land is mostly separated by other land use types, and it is difficult to establish centralized emission sources. Moreover, the other land use types limited particulate matter concentrations, and the particulate matter concentrations were therefore low. Among the seasons, PLAND, LPI, and SPLIT exhibited the highest correlations with the PM2.5 concentration in spring, which demonstrates that the influence of construction land on the PM2.5 concentration was the strongest in spring. In the other seasons, the PM2.5 concentration was more notably influenced by other factors. PD and LSI showed the highest correlations with the particulate matter concentration in winter, which may be related to the overall high particulate matter concentration and highest spatial heterogeneity in winter.
4. Implications and Limitations
As urbanization continues to accelerate, the extent to which human activities contribute to particulate matter emissions is increasing. A large amount of harmful substances are emitted into the atmosphere, which poses a great danger to production and living activities and human health. The problem of atmospheric pollution is receiving more and more attention from relevant departments and individuals. China, especially the eastern part of the country, is one of the more serious regions in the world. Many cities have concentrations of atmospheric pollutants that far exceed the guideline values provided by the World Health Organization (Geneva, Switzerland). At the same time, with the rapid expansion of built-up areas, many cities are gradually approaching saturation in terms of space. Therefore, to control air pollution, a rational planning and layout of the limited space available is necessary. In this experiment, an attempt was made to establish the relationship between land use and particulate matter concentrations using geography, landscape ecology, and statistics. Firstly, the differences in the patterns of change in particulate matter concentrations on each land use type were analyzed, and then the relationship between landscape patterns and particulate matter concentrations was compared for each type. These analyses can provide some theoretical support for the optimization of land use structures. This can be useful for urban planning in the study area and can also provide a reference for other regions and cities. The results obtained from the experiments may be deficient due to limitations in the data sources or experimental methods. The spatial distribution of particulate matter concentrations is obtained by spatial interpolation of the Ordinary Kriging method based on the measured data at the stations. Due to the limited number of stations and the uneven spatial distribution, the interpolation results may have some errors. The experiment covers the period from 2015 to 2018, which is a limited time span. It should also be noted that the spatial and temporal characteristics of particulate matter concentrations are a complex system driven by a combination of influencing factors. Land use affects air quality both through anthropogenic emissions and agricultural activities that alter pollutant emission potential, and through interactions with the atmosphere, such as turbulence stimulation and wind speed reduction. In this manuscript, we have not explored the influence of meteorological factors in depth. All of the above will be focused on in subsequent experiments.
5. Conclusions
In this manuscript, we collated land use and atmospheric particulate matter concentration data pertaining to Beijing, Tianjin, and Hebei in China and analyzed the corresponding temporal and spatial changes and correlations. The conclusions are as follows:
- (1)
- The optimized sine function model can better represent periodic changes in atmospheric particulate matter concentrations. The experimental results reveal that the concentrations corresponding to land use types with higher concentrations, such as construction land and farmland, generally exhibited rapid downward trends, while the concentrations corresponding to land use types with lower concentrations, such as forestland and grassland, generally exhibited gradual downward or consistent trends.
- (2)
- The concentration gradually decreased in spring and summer and rapidly increased in autumn and winter. Human activities such as heating in winter in construction land areas and planting and harvesting of crops in farmland areas were the main factors affecting the concentration fluctuations. The concentrations in forestland and grassland areas were the lowest; the differences between high and low values were small; the fluctuation patterns of the particulate matter concentrations remained relatively uniform; and the peak times occurred slightly later than those of the other land use types. Natural sources greatly influenced the concentration fluctuations, among which the frequent dusty weather conditions in spring imposed a greater influence on forestland and grassland than on the other land use types.
- (3)
- The landscape pattern associated with the land use type significantly affects the particulate matter concentration. Overall, the lower the aggregation degree, the higher the fragmentation degree, the more complex the shape, and the higher the landscape abundance, the lower the particle concentration is. Among the land use types, the density and diversity of forestland, grassland, farmland, and construction land patches contribute to a reduction in the particulate matter concentration. The higher the dominance of forestland and grassland patches in the landscape, the more favorable the setting is to a reduction in the particulate matter concentration.
- (4)
- The protection of the atmosphere is essential in the context of high social and economic development. According to the experimentally observed results, the limiting effect of vegetation such as trees and grasses on the concentration of particulate matter is significant. Theoretically, increasing the percentage of vegetation can help control air pollution. However, in a highly developed urban city with high population density such as Beijing, the area of land that can be changed is very limited. Therefore, it is more important to adjust the rationality of land use in densely populated and motorized built-up areas. The area of urban green space can be appropriately increased to create better connectivity of vegetation in order to give full play to the limiting effect of green vegetation on particulate matter concentration. In addition, targeted selection of tree species for urban greening and increasing the rationality of the vertical level of vegetation are also key to improving the efficiency of urban land use and environmental protection functions.
Author Contributions
J.Y. is the corresponding author. H.Z. contributed to improving the methodology and wrote the manuscript. X.T. helped edit and improve the manuscript. G.W. contributed to testing the methodology. All authors have read and agreed to the published version of the manuscript.
Funding
This work was jointly supported by grants from the Application Demonstration System of GaoFen Remote Sensing Mapping of China (No. 42-Y30B04-9001-19/21); the Chinese Postdoctoral Science Foundation (No. 2021M693782).
Conflicts of Interest
The authors declare no conflict of interest.
References
- Zhai, H.; Tang, X.; Wang, G.; Li, J.; Liu, K. Characteristic analyses, simulations and predictions of land use in poor mountainous cities: A case study in the central area of Chengde County, China. Environ. Earth Sci. 2018, 77, 585. [Google Scholar] [CrossRef]
- Gong, J.; Xie, Y.; Jia, Z.; Qian, D. Recent progress in land use and cover change in Heihe River Basin. J. Lanzhou Univ. (Nat. Sci.) 2014, 50, 390–397, 407. [Google Scholar] [CrossRef]
- Zhang, X. Simulation of land use change scenarios of Tangshan Coastal Zone Based on CLUE-S Model. Master’s Thesis, Hebei Normal University, Shijiazhuang, China, 20 March 2008. [Google Scholar] [CrossRef]
- Yan, J.; Zhai, H. Dynamic simulation of land use with CLUE-S model and change rate of land-sea gradient. Int. J. Earth Sci. Eng. 2016, 9, 1447–1453. [Google Scholar]
- Yan, J.; Zhai, H.; Cheng, F. Spatio-temporal evolution of land use and its socio-economic effects in the Shandong Peninsula. Int. J. Earth Sci. Eng. 2015, 8, 1994–2003. [Google Scholar]
- Wang, G.; Yang, K.; Yang, Y. The spatio-temporal variation of PM2.5 pollution and the its correlation with the impervious surface expansion. China Environ. Sci. 2017, 37, 2470–2481. [Google Scholar]
- Yang, K.; Wang, G.; Yang, Y.; Luo, Y. Association between impervious surface and PM2.5 concentrations in Kunming, China. Res. Environ. Sci. 2017, 30, 499–509. [Google Scholar] [CrossRef]
- Xu, S.; Zou, B.; Pu, Q.; Guo, Y. Impact analysis of land use/cover on air pollution. J. Geo-Inf. Sci. 2015, 17, 290–299. [Google Scholar] [CrossRef]
- Fu, B. The spatial pattern analysis of agricultural landscape in the loess area. Acta Ecol. Sin. 1995, 15, 113–120. [Google Scholar] [CrossRef]
- Tang, X.; Liu, H.; Li, J.; Xie, Z.; Zhao, W. Response analysis of haze/particulate matter pollution to Land Use/Cover in Beijing. China Environ. Sci. 2015, 35, 2561–2569. [Google Scholar] [CrossRef]
- Shi, J.; Cui, L.; He, Q.; Sun, L. The changes and causes of fog and haze days in Eastern China. Acta Geogr. Sin. 2010, 65, 533–542. [Google Scholar] [CrossRef]
- Shi, J.; Cui, L.; Zhou, W. Change trend of climatic factors in the Yangtze River Delta from 1959 to 2005. Resour. Sci. 2008, 30, 1803–1810. [Google Scholar]
- Peng, W.; Zhou, J.; Luo, H.; Yang, C.; Zhao, J. Relationship between land use change and its urban air environmental impacts. Res. Soil Water Conserv. 2010, 17, 87–91. [Google Scholar]
- Font, A.; Baker, T.; Mudway, I.S.; Purdie, E.; Dunster, C.; Fuller, G.W. Degradation in urban air quality from construction activity and increased traffic arising from a road widening scheme. Sci. Total Environ. 2014, 497-498, 123–132. [Google Scholar] [CrossRef] [PubMed] [Green Version]
- Zhai, H.; Tang, X.; Wang, G.; Li, J.; Xing, L. Impact of impervious surface expansion on tropospheric NO2 column density in Chinese megacities. Acta Sci. Circumstantiae 2019, 39, 797–808. [Google Scholar] [CrossRef]
- Wei, J.; Sun, L.; Liu, S.; Duan, D.; Guo, Y.; Mi, X.; Tian, X.; Yu, H. Response analysis of particulate air pollution to Land-use and land-cover change. Acta Ecol. Sin. 2015, 35, 5495–5506. [Google Scholar] [CrossRef]
- Mo, L.; Yu, X.; Zhao, Y.; Sun, F.; Mo, N.; Xia, H. Correlation analysis between urbanization and particle pollution in Beijing. Ecol. Environ. Sci. 2014, 23, 806–811. [Google Scholar] [CrossRef]
- Sun, N. Using Satellite Remote Sensing Data for Monitoring PM10 Concentrating in the Pearl River Delta and Study on the Correlation between PM10 and Underlying Surface. Master’s Thesis, China University of Geosciences, Beijing, China, 1 May 2013. [Google Scholar]
- Lou, C.; Liu, H.; Li, Y.; Li, Y. Research on the response of air particles (PM2.5, PM10) to landscape structure: A review. Acta Ecol. Sin. 2016, 36, 6719–6729. [Google Scholar] [CrossRef]
- Lou, C. Tempo-spatial characteristics of PM2.5 at multi-scales and its influencing in the core of the Yangtze River Delta. Ph.D. Thesis, Nanjing Normal University, Nanjing, China, 19 May 2018. [Google Scholar]
- Zhuang, Y.; Chen, D.; Li, R.; Chen, Z.; Cai, J.; He, B.; Gao, B.; Cheng, N.; Huang, Y. Understanding the Influence of Crop Residue Burning on PM2.5 and PM10 Concentrations in China from 2013 to 2017 Using MODIS Data. Int. J. Environ. Res. Public Health 2018, 15, 1504. [Google Scholar] [CrossRef] [Green Version]
- Zhuang, Y.; Li, R.; Yang, H.; Chen, D.; Chen, Z.; Gao, B.; He, B. Understanding Temporal and Spatial Distribution of Crop Residue Burning in China from 2003 to 2017 Using MODIS Data. Remote Sens. 2018, 10, 390. [Google Scholar] [CrossRef] [Green Version]
- Li, J.; Wang, H.; Wang, G.; Guo, J.; Zhai, H. A new method of high resolution urban water extraction based on index. Remote. Sens. Inf. 2018, 33, 99–105. [Google Scholar] [CrossRef]
- Jiang, Y.; Zhu, R.; Zhu, K.; Li, Z. Numerical simulation on the air pollution potential in the severe air pollution episodes in Beijing-Tianjin-Hebei Region. Acta Sci. Circumstantiae 2015, 35, 2681–2692. [Google Scholar] [CrossRef]
- Wang, X.; Lang, J.; Cheng, S.; Chen, G.; Liu, X. Study on transportation of PM2.5 in Beijing-Tianjin-Hebei (BTH) and its surrounding area. China Environ. Sci. 2016, 36, 3211–3217. [Google Scholar] [CrossRef]
- Wang, Y.; Li, Y.; Qiao, Z.; Lu, Y. Atmospheric transmission rule on air pollution in Beijing-Tianjin-Hebei urban agglomeration: A comparative analysis of two emission inventories. China Environ. Sci. 2019, 39, 4561–4569. [Google Scholar] [CrossRef]
- Yang, X.; Zhao, W.; Xiong, Q.; Wang, L.; Zhao, W. Spatio-temporal distribution of PM2.5 in Beijing-Tianjin-Hebei (BTH) area in 2016 and its relationship with meteorological factors. Ecol. Environ. Sci. 2017, 26, 1747–1754. [Google Scholar] [CrossRef]
- Liu, X.; Zheng, T.; Wan, Q.; Tan, H.; Deng, X.; Li, F.; Deng, T. Spatio-temporal characteristics of NO2 in concentrated PRD Urban Districts and analysis of anthropogenic influences based on OMI remote sensing data. J. Trop. Meteorol. 2015, 31, 193–201. [Google Scholar] [CrossRef]
- Wang, Y.; Jiang, H.; Zhang, X.; Zhou, G.; Yu, S.; Xiao, Z. Temporal-spatial distribution of tropospheric NO2 in China using OMI satellite remote sensing data. Res. Environ. Sci. 2009, 22, 932–937. [Google Scholar] [CrossRef]
- Zhang, Y.; Niu, Z.; Wang, L.; Chang, C. Study on tropospheric NO2 change trend in cities using OMI satellite data. Geogr. Geo-Inf. Sci. 2008, 24, 96–99. [Google Scholar]
- Xu, J.; Jiang, H.; Xiao, Z. Estimate PM10 concentration over the Yangtze Delta using remote sensing: Analysis of spatial and temporal variations. Chin. J. Environ. Eng. 2016, 10, 1349–1357. [Google Scholar] [CrossRef]
- Xu, J.; Jiang, H. Estimation of PM2.5 concentration over the Yangtze Delta using remote sensing: Analysis of spatial and temporal variations. Environ. Sci. 2015, 36, 3119–3127. [Google Scholar] [CrossRef]
- Zhai, H.; Yao, J.; Wang, G.; Tang, X. Spatio-Temporal Characteristics and Variation Pattern of the Atmospheric Particulate Matter Concentration: A Case Study of the Beijing–Tianjin–Hebei Region, China. Atmosphere 2022, 13, 120. [Google Scholar] [CrossRef]
- McGarigal, K.; Cushman, S.A.; Ene, E. Fragstats v4: Spatial Pattern Analysis Program for Categorical and Continuous Maps. Computer Software Program Produced by the Authors at the University of Massachusetts, Amherst. 2012. Available online: http://www.umass.edu/landeco/research/fragstats/fragstats.html (accessed on 8 May 2013).
- Fu, B.; Chen, L. Landscape diversity types and their ecological significance. Acta Geogr. Sin. 1996, 51, 454–462. [Google Scholar] [CrossRef]
- Sulla-Menashe, D.; Friedl, M.A. User Guide to Collection 6 MODIS Land Cover (MCD12Q1 and MCD12C1) Product. 2018. Available online: https://lpdaac.usgs.gov/documents/101/MCD12_User_Guide_V6.pdf (accessed on 8 December 2021).
- Sulla-Menashe, D.; Gray, J.; Abercrombie, S.P.; Friedl, M.A. Hierarchical mapping of annual global land cover 2001 to present: The MODIS Collection 6 Land Cover product. Remote Sens. Environ. 2019, 222, 183–194. [Google Scholar] [CrossRef]
- Li, J.; Wang, H.; Wang, G.; Zhai, H.; Han, M.; Cheng, Q. Plastic-mulched farmland extraction with multi-source satellite data. Bull. Surv. Mapp. 2018, 78–82. [Google Scholar] [CrossRef]
- Chen, X.; Jiao, Y.; Pei, T.; Zhou, Z. The effect of adsorbing fine particulate matter (PM2.5) by garden plants: A review. Chin. J. Ecol. 2014, 33, 2558–2566. [Google Scholar] [CrossRef]
- Matsuda, K.; Fujimura, Y.; Hayashi, K.; Takahashi, A.; Nakaya, K. Deposition velocity of PM2.5 sulfate in the summer above a deciduous forest in central Japan. Atmos. Environ. 2010, 44, 4582–4587. [Google Scholar] [CrossRef]
- Freer-Smith, P.H.; Holloway, S.; Goodman, A. The uptake of particulates by an urban woodland: Site description and particulate composition. Environ. Pollut. 1997, 95, 27–35. [Google Scholar] [CrossRef]
- Zhao, C.; Wang, Y.; Wang, Y.; Zhang, H. Interactions between fine particulate matter (PM2.5) and vegetation: A review. Chin. J. Ecol. 2013, 32, 2203–2210. [Google Scholar] [CrossRef]
- Chen, A.; Lei, Y.; Sun, R.; Chen, L. How many metrics are required to identify the effects of the landscape pattern on land surface temperature? Ecol. Indic. 2014, 45, 424–433. [Google Scholar] [CrossRef]
- Kang, X.; Cui, L.; Zhao, X.; Li, W.; Zhang, M.; Wei, Y.; Lei, Y.; Ma, M. Effect of wetlands on reducing atmospheric fine particles PM2.5 in Beijing. Chin. J. Ecol. 2015, 34, 2807–2813. [Google Scholar] [CrossRef]
- Zhu, C.; Zeng, Y.; Chen, Y.; Guo, H. Effects of urban lake wetland on air PM10 and PM2.5 concentration: A case study of Wuhan. Chin. Landsc. Archit. 2016, 88–93. [Google Scholar]
Figure 1.
Schematic diagram of the traditional (a) and improved (b) sine function models.
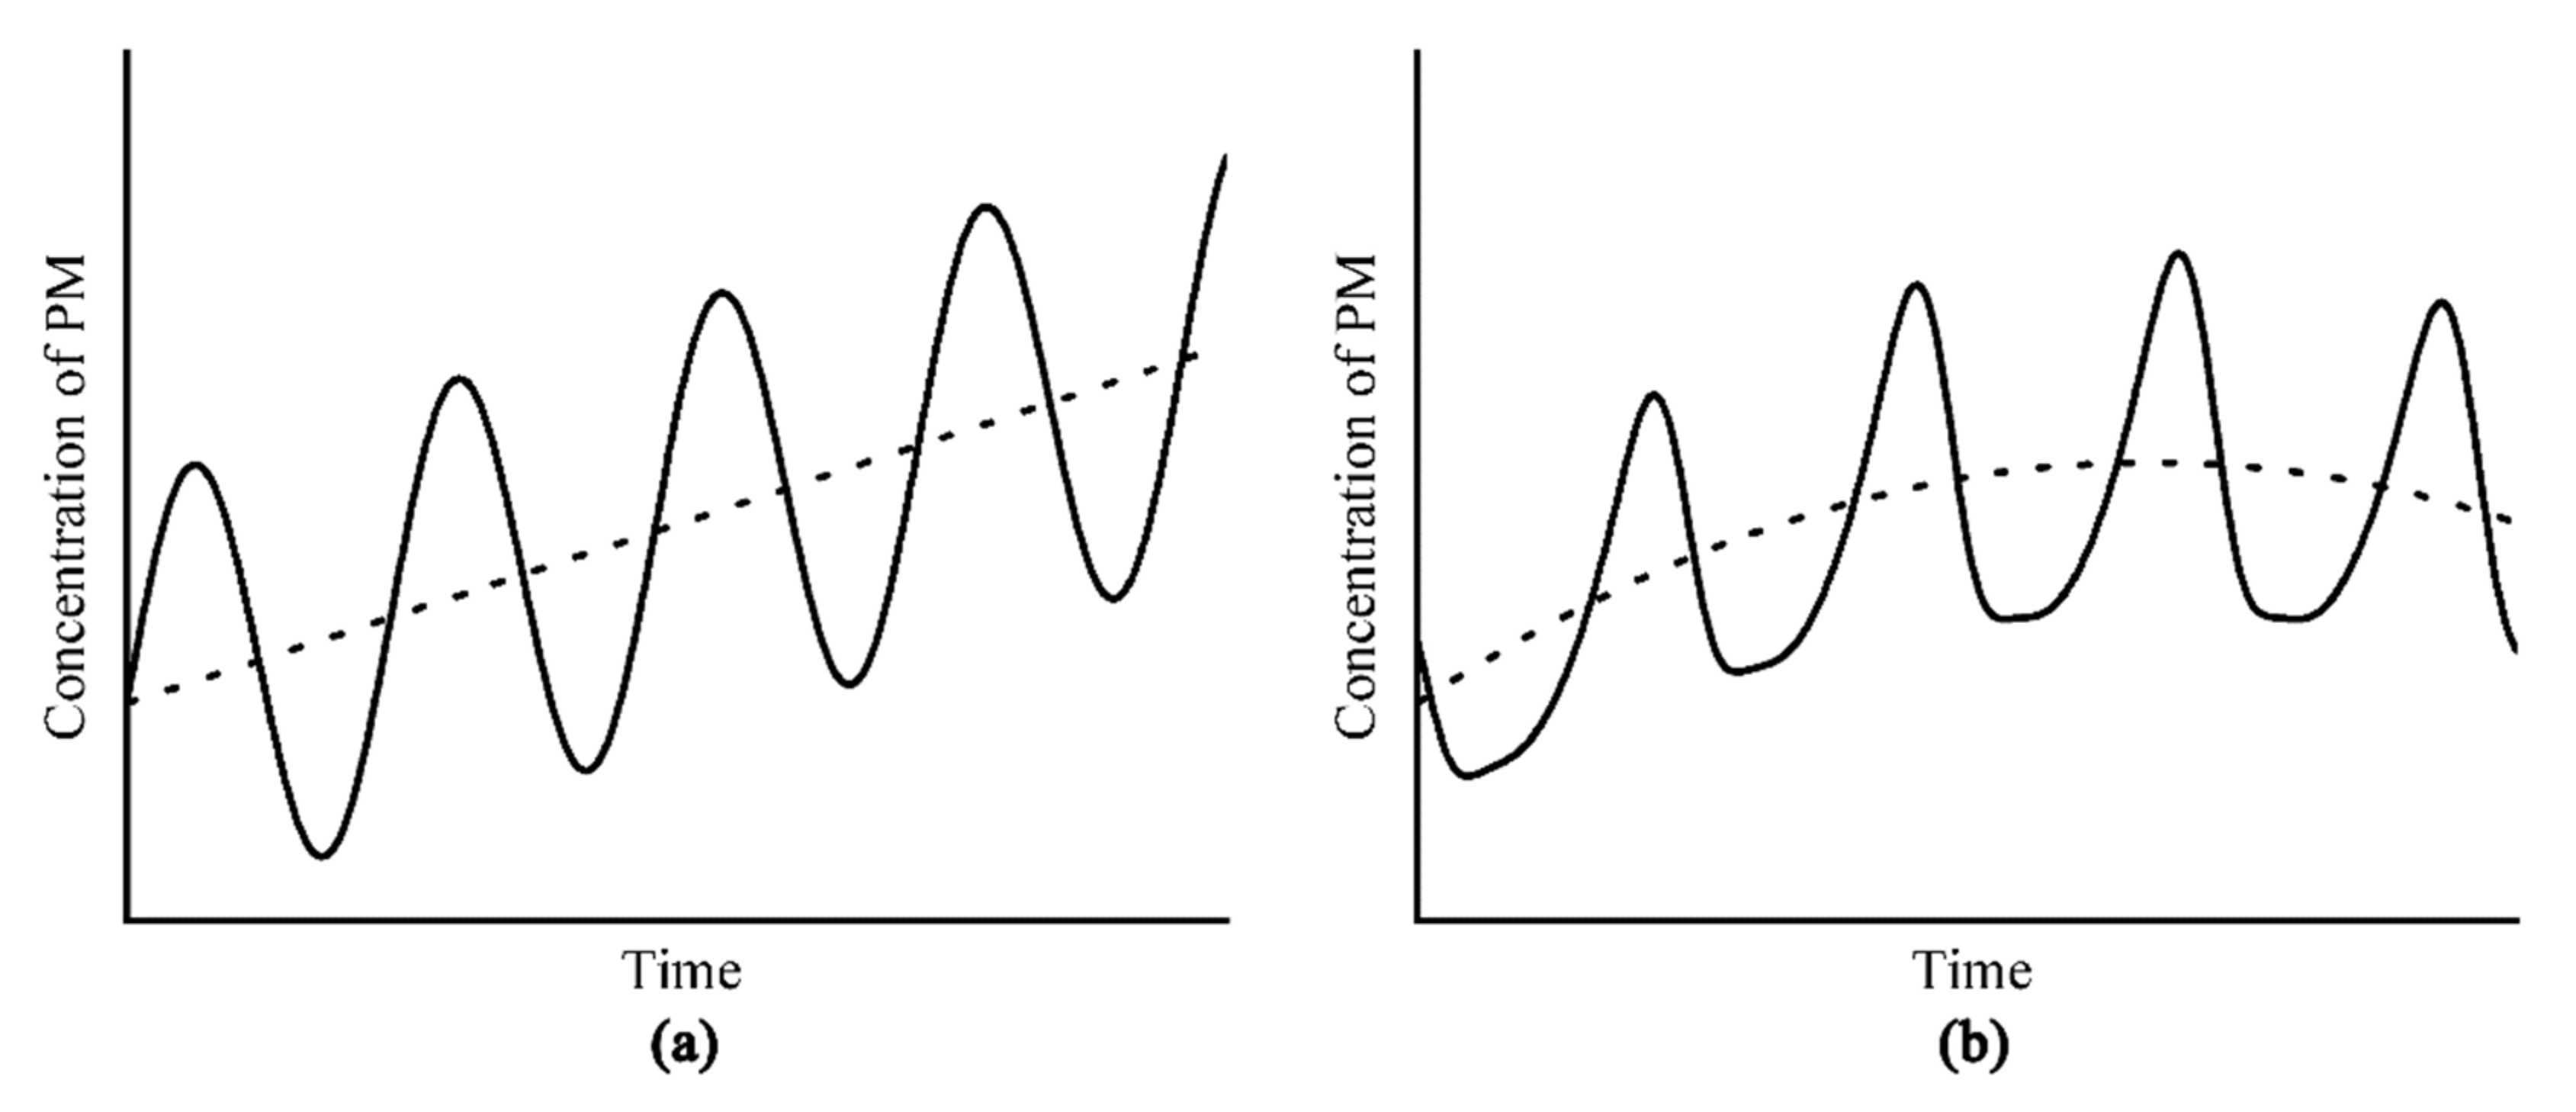
Figure 2.
Geographical location of the study area.
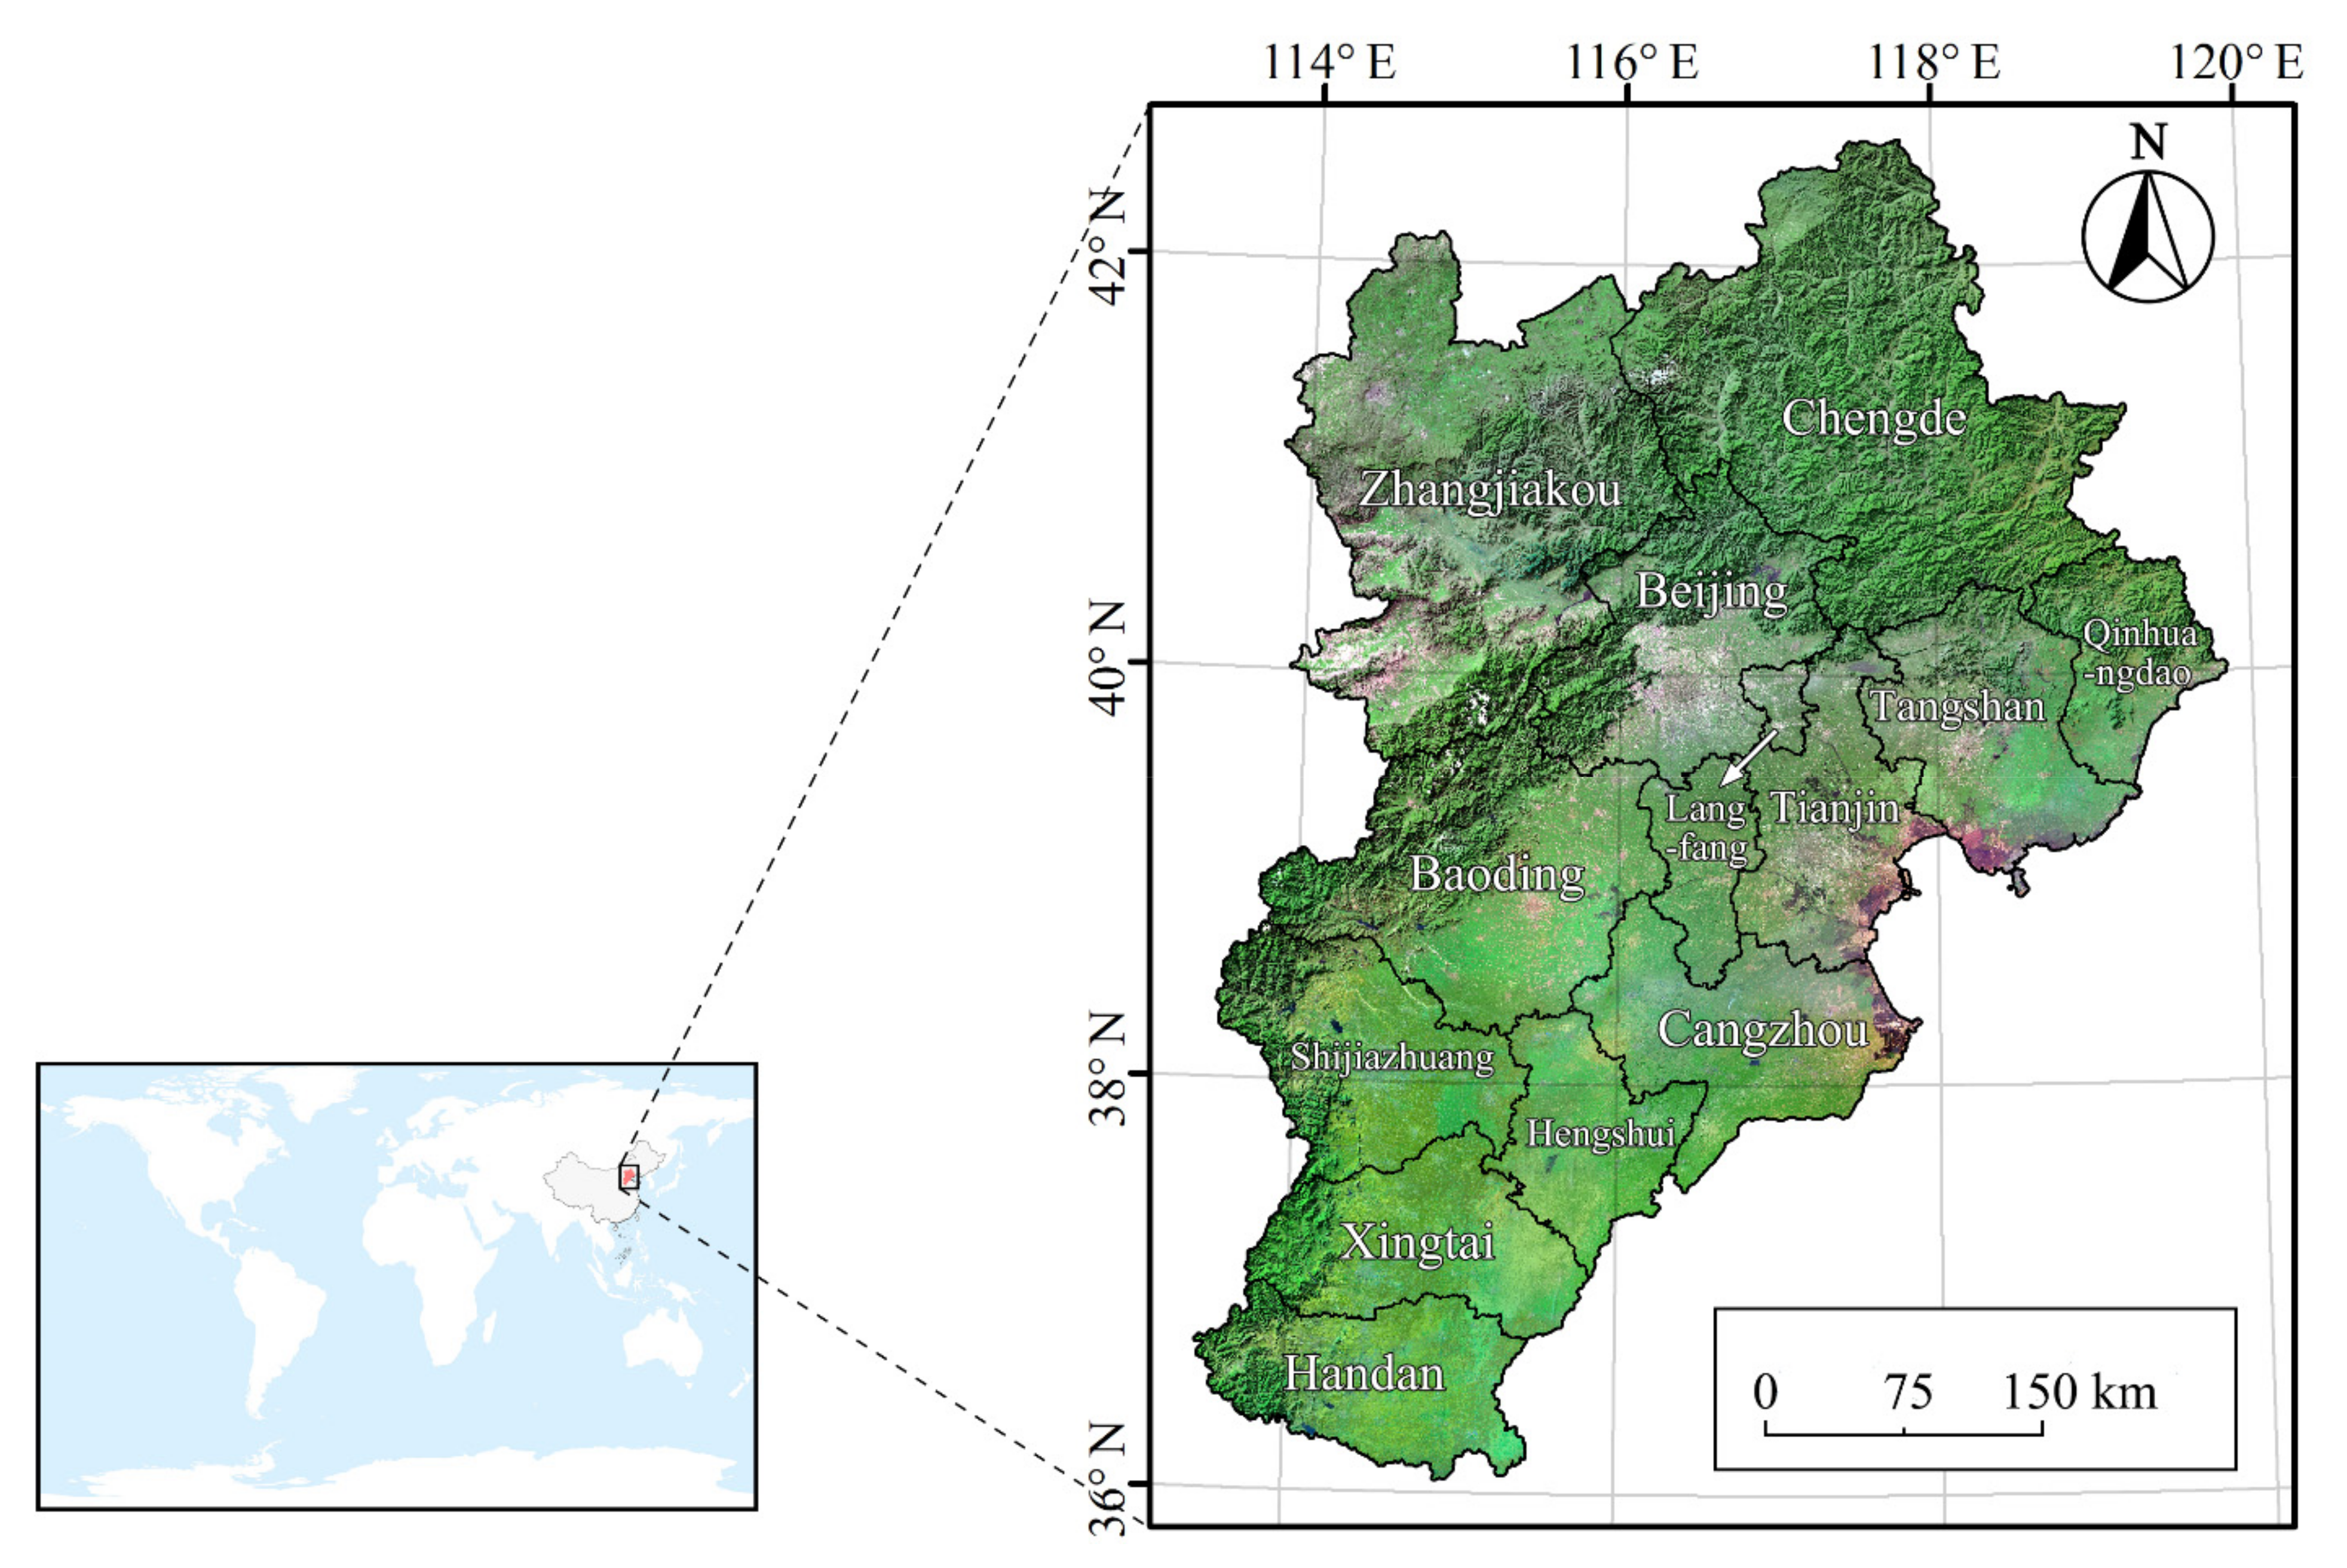
Figure 3.
Spatial distribution of the air quality monitoring sites in the study area and surrounding areas.
Figure 3.
Spatial distribution of the air quality monitoring sites in the study area and surrounding areas.
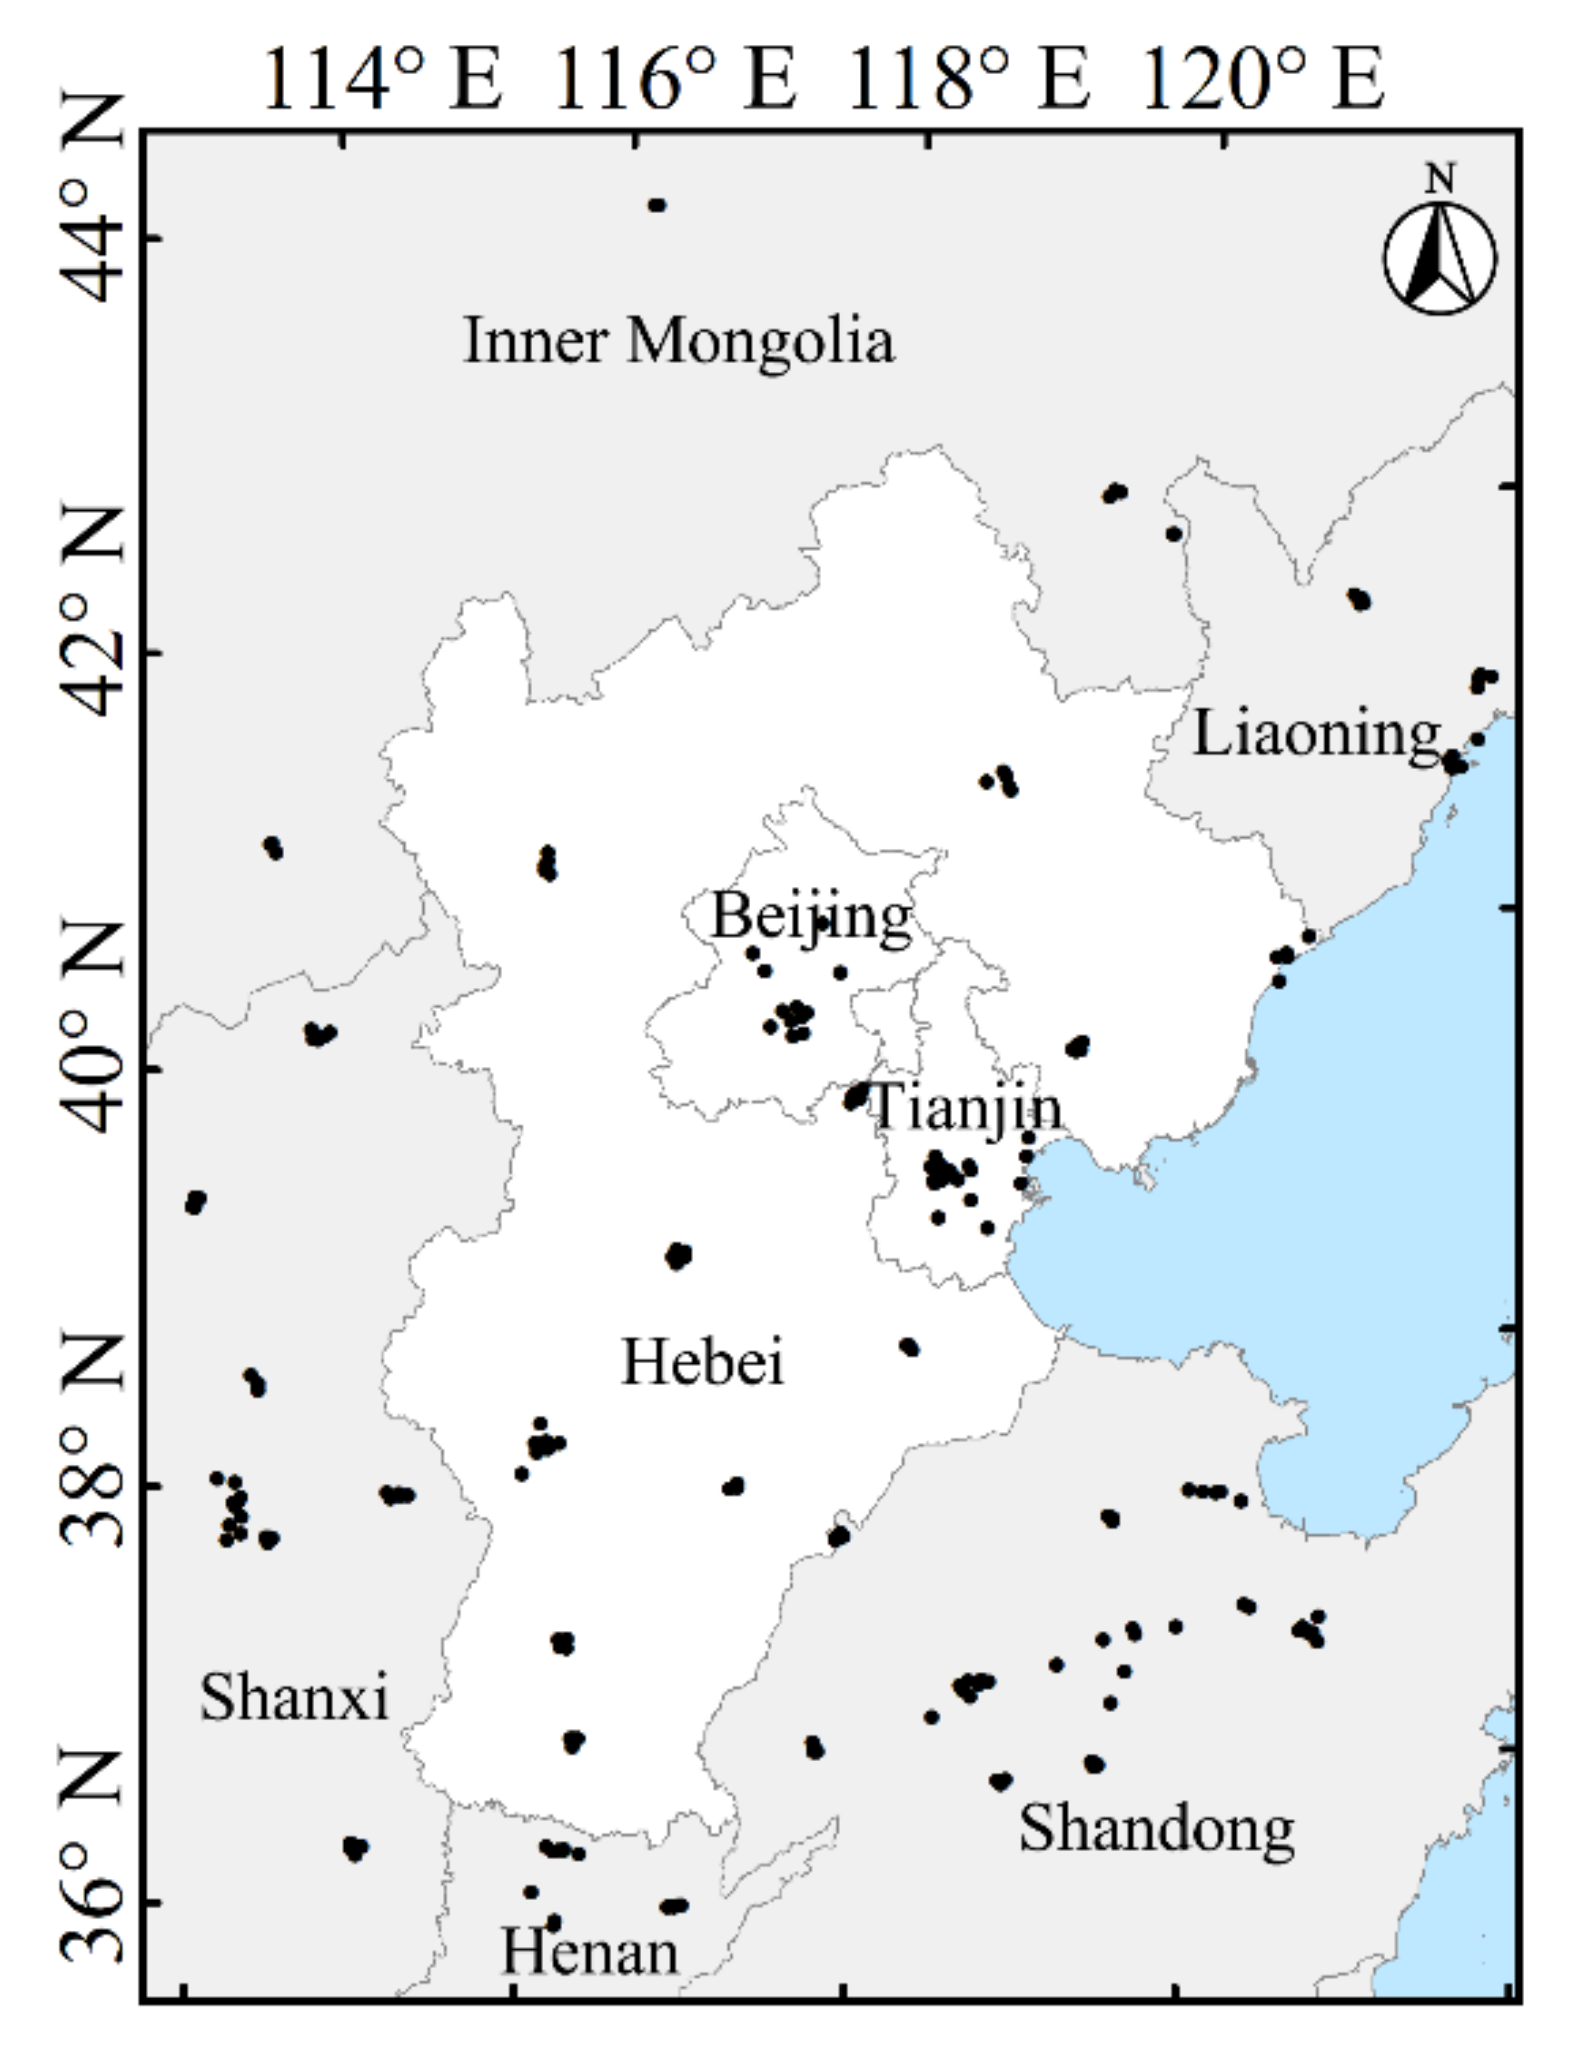
Figure 4.
Spatial distributions of land use in 2015 (a), 2016 (b), 2017 (c), and 2018 (d) and a schematic representation of the land use changes that occurred (e).
Figure 4.
Spatial distributions of land use in 2015 (a), 2016 (b), 2017 (c), and 2018 (d) and a schematic representation of the land use changes that occurred (e).
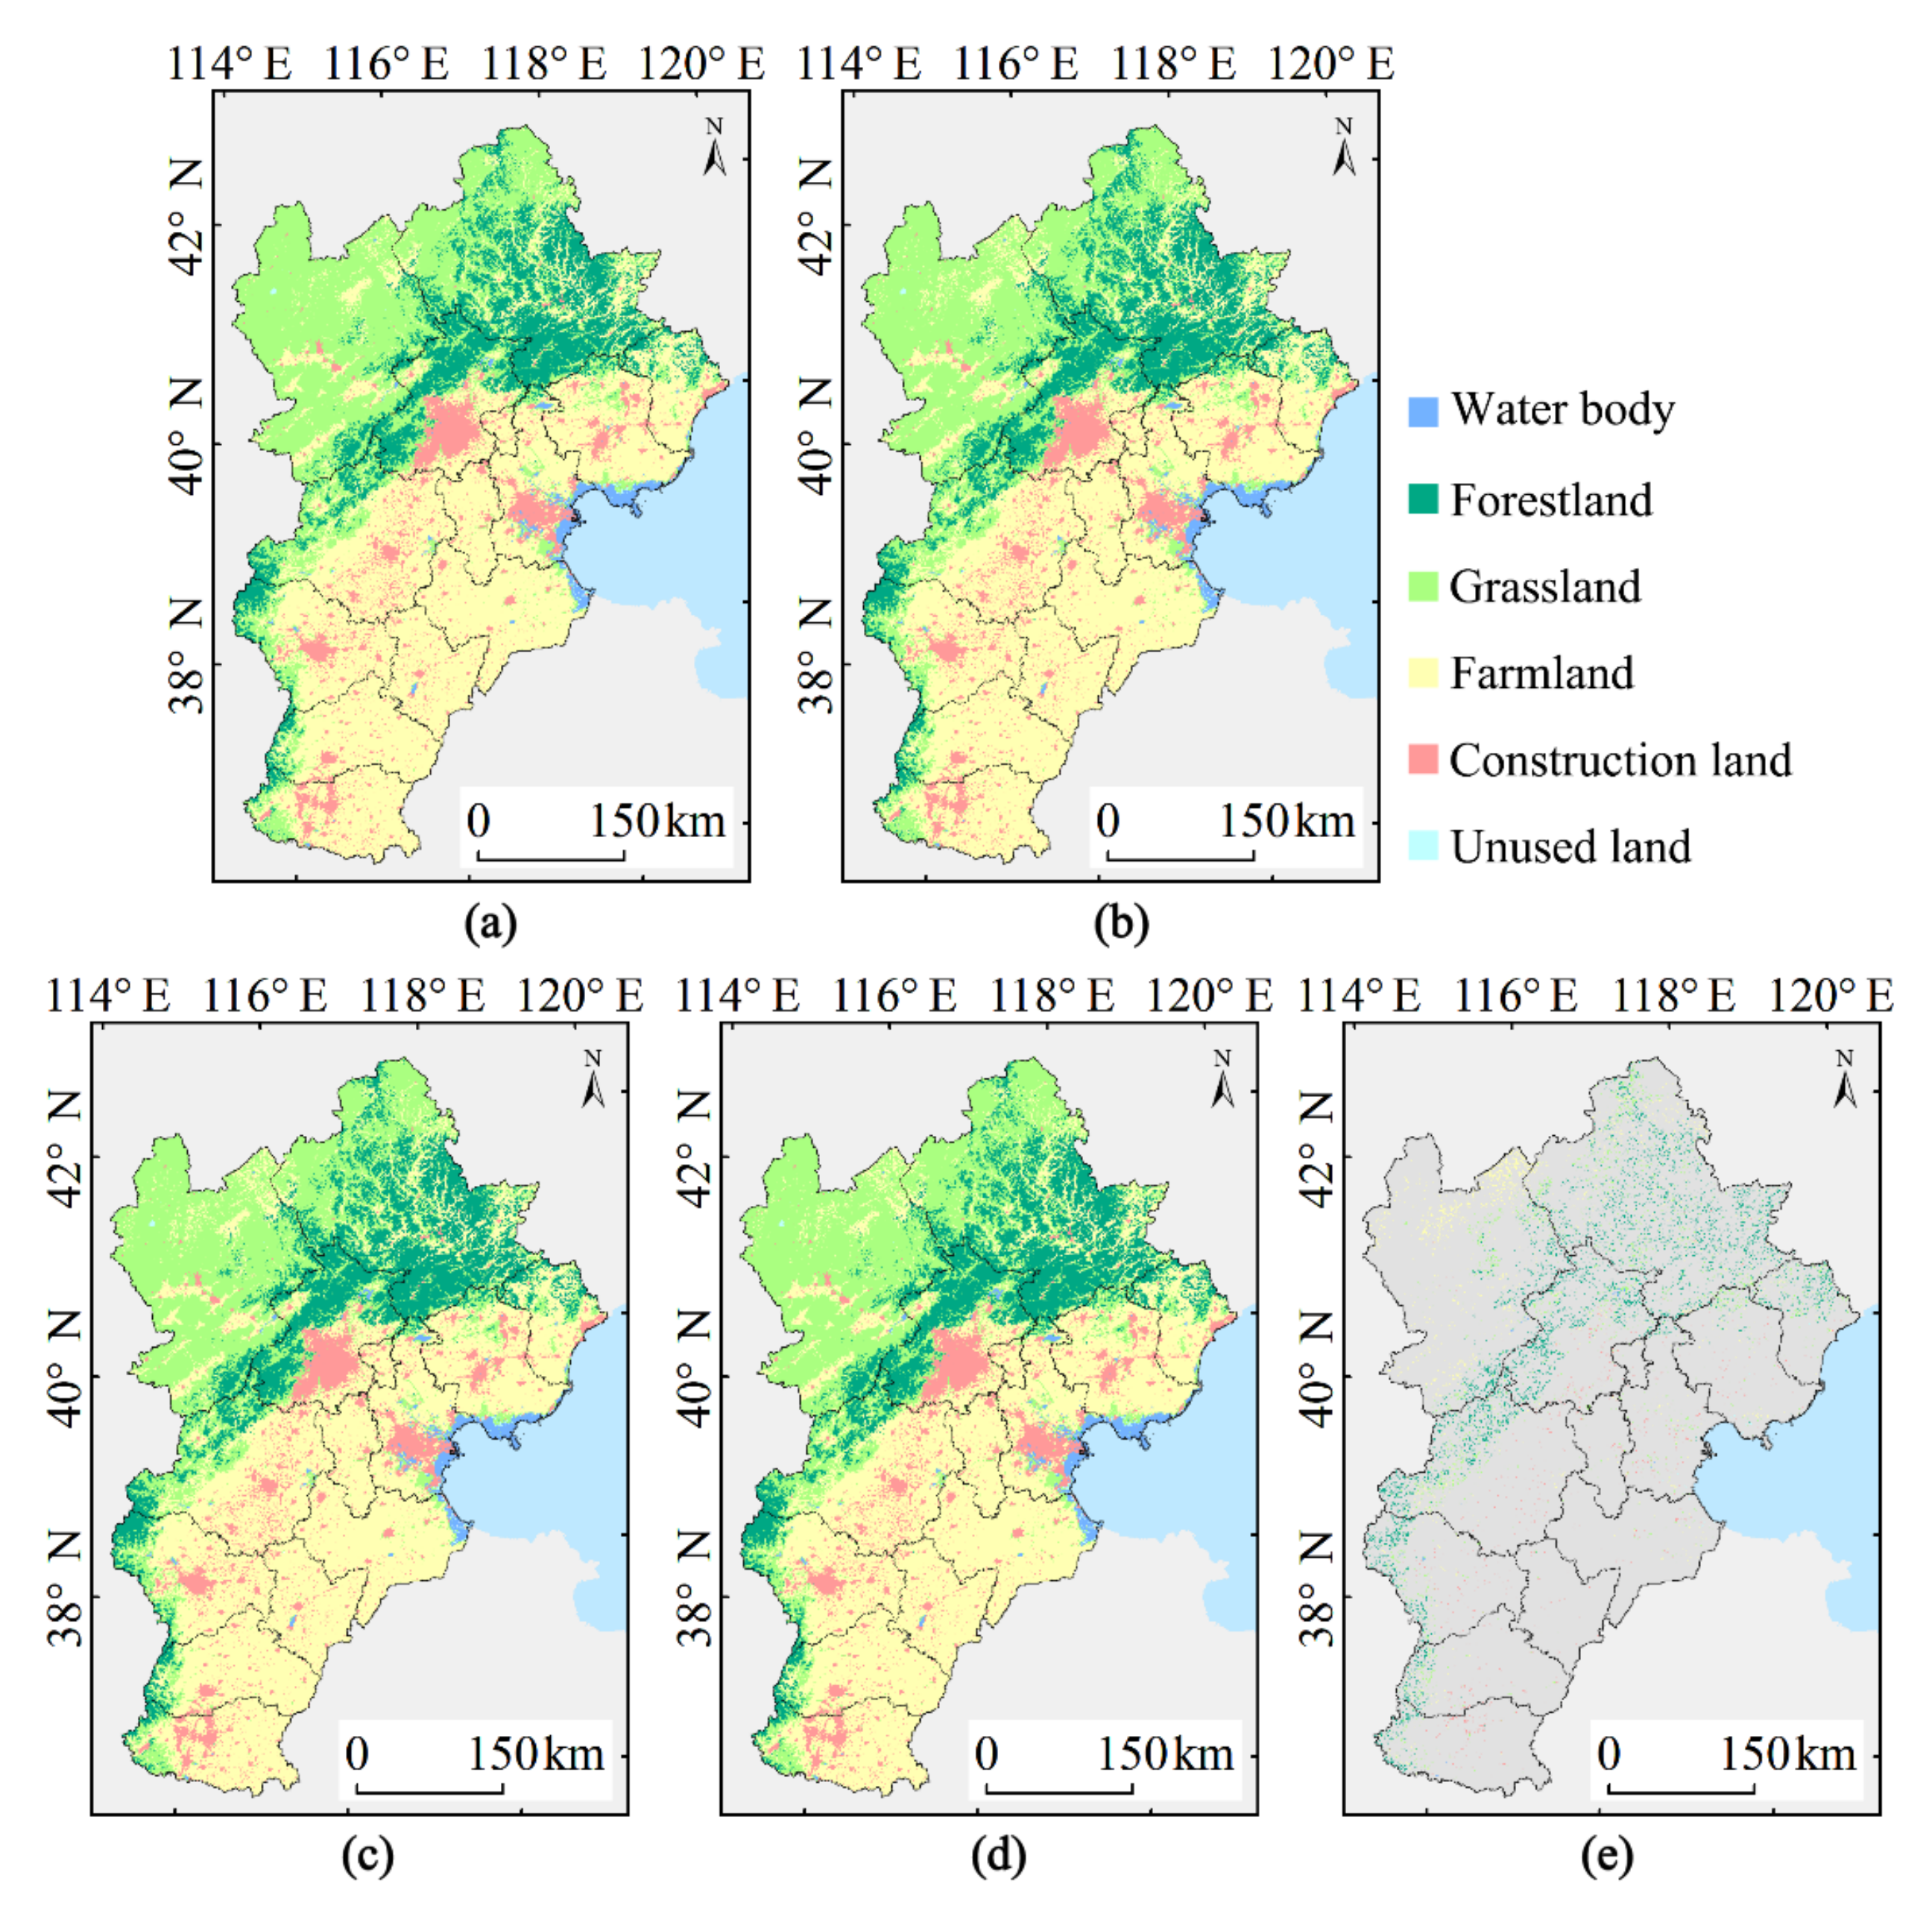
Figure 5.
Monthly mean values of the PM2.5 and PM10 concentrations corresponding to each land use type.
Figure 5.
Monthly mean values of the PM2.5 and PM10 concentrations corresponding to each land use type.
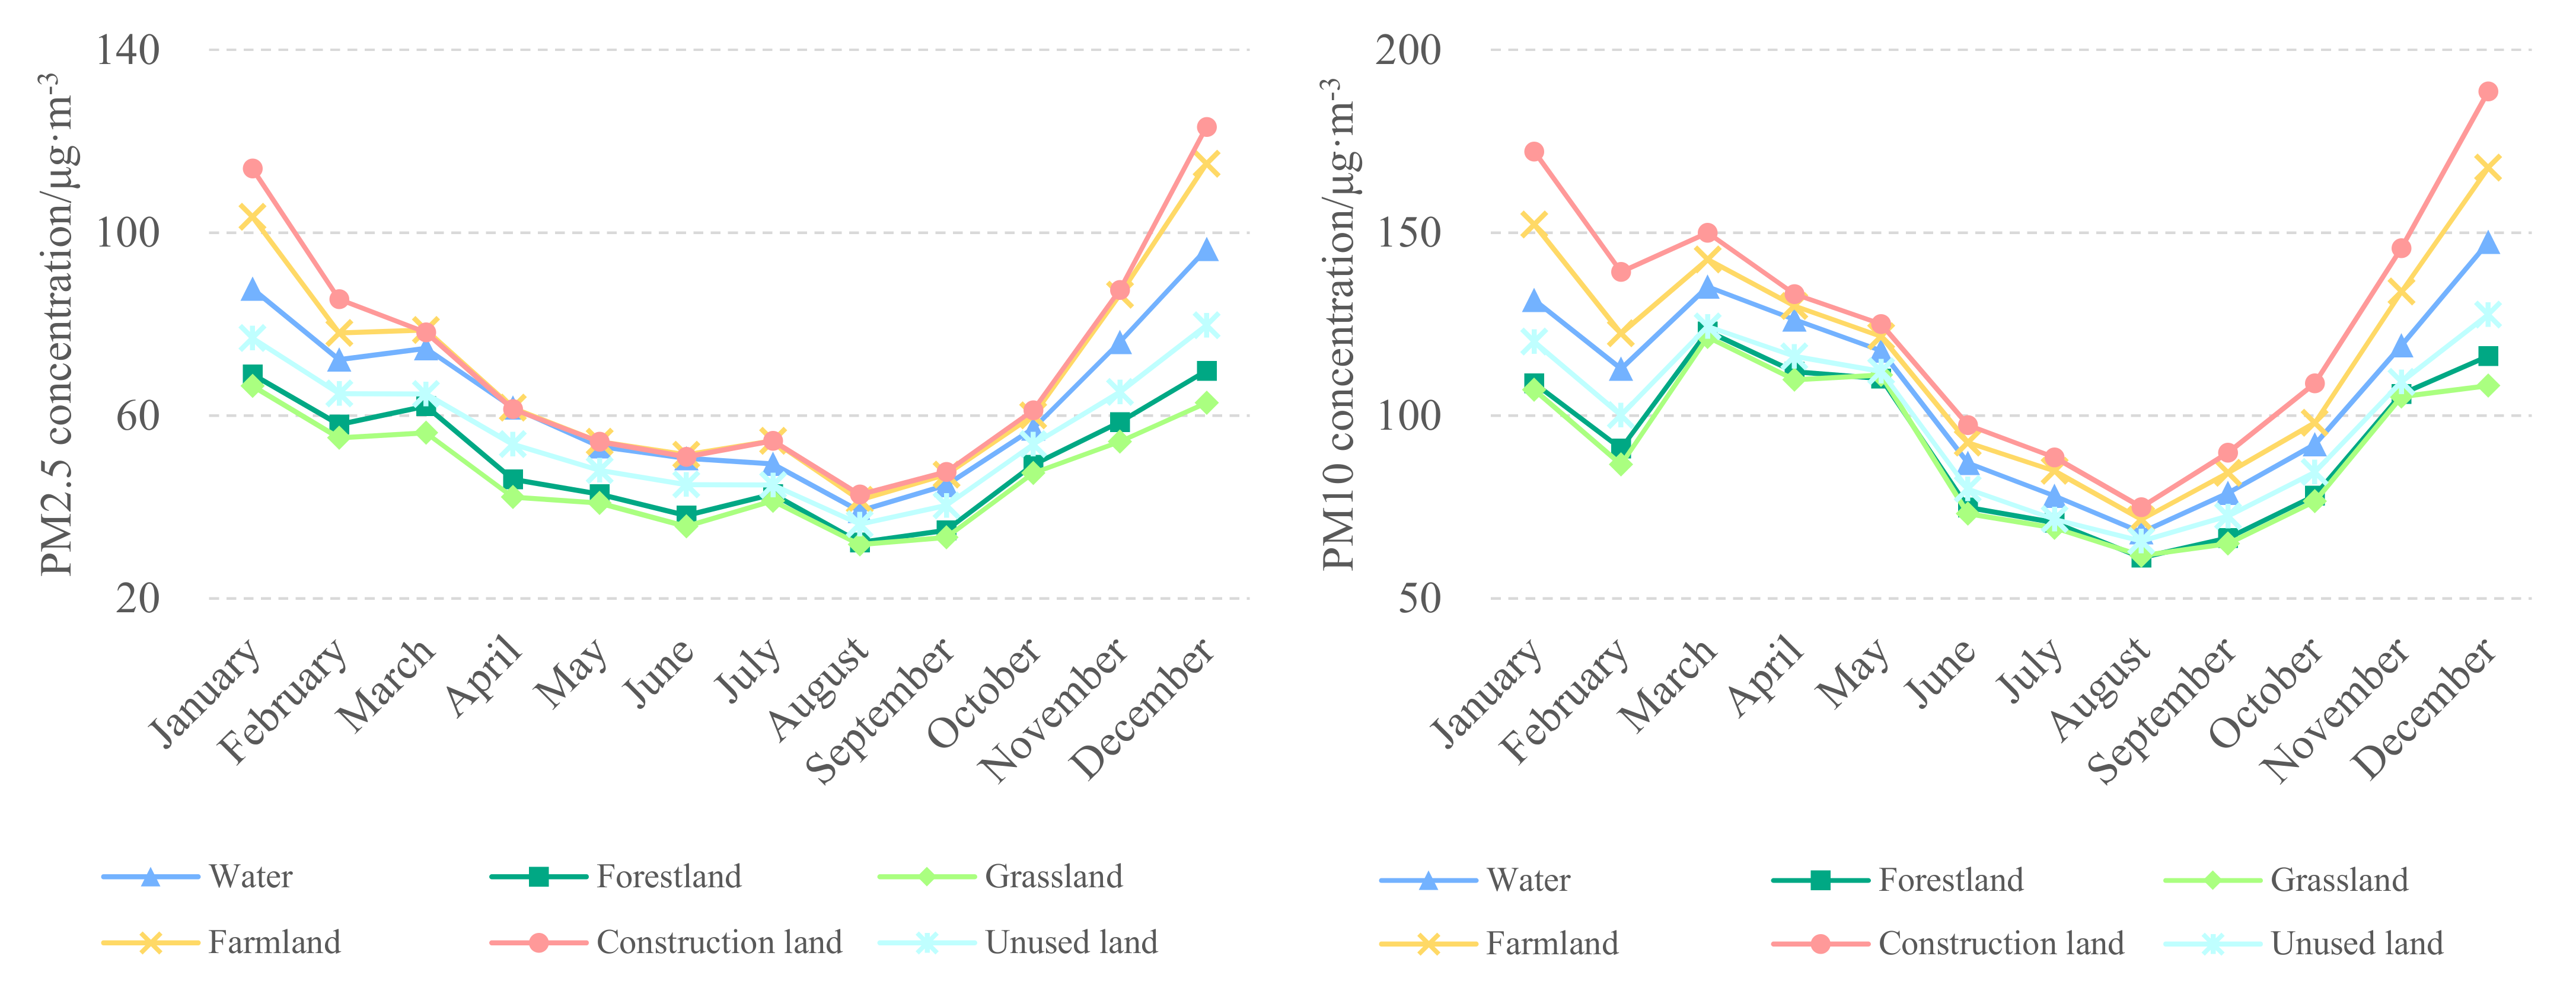
Figure 6.
Fitting results of the monthly PM2.5 concentration for each land use type: (a) water; (b) forestland; (c) grassland; (d) farmland; (e) construction land; and (f) unused land.
Figure 6.
Fitting results of the monthly PM2.5 concentration for each land use type: (a) water; (b) forestland; (c) grassland; (d) farmland; (e) construction land; and (f) unused land.

Figure 7.
Fitting results of the monthly PM10 concentration for each land use type: (a) water; (b) forestland; (c) grassland; (d) farmland; (e) construction land; and (f) unused land.
Figure 7.
Fitting results of the monthly PM10 concentration for each land use type: (a) water; (b) forestland; (c) grassland; (d) farmland; (e) construction land; and (f) unused land.
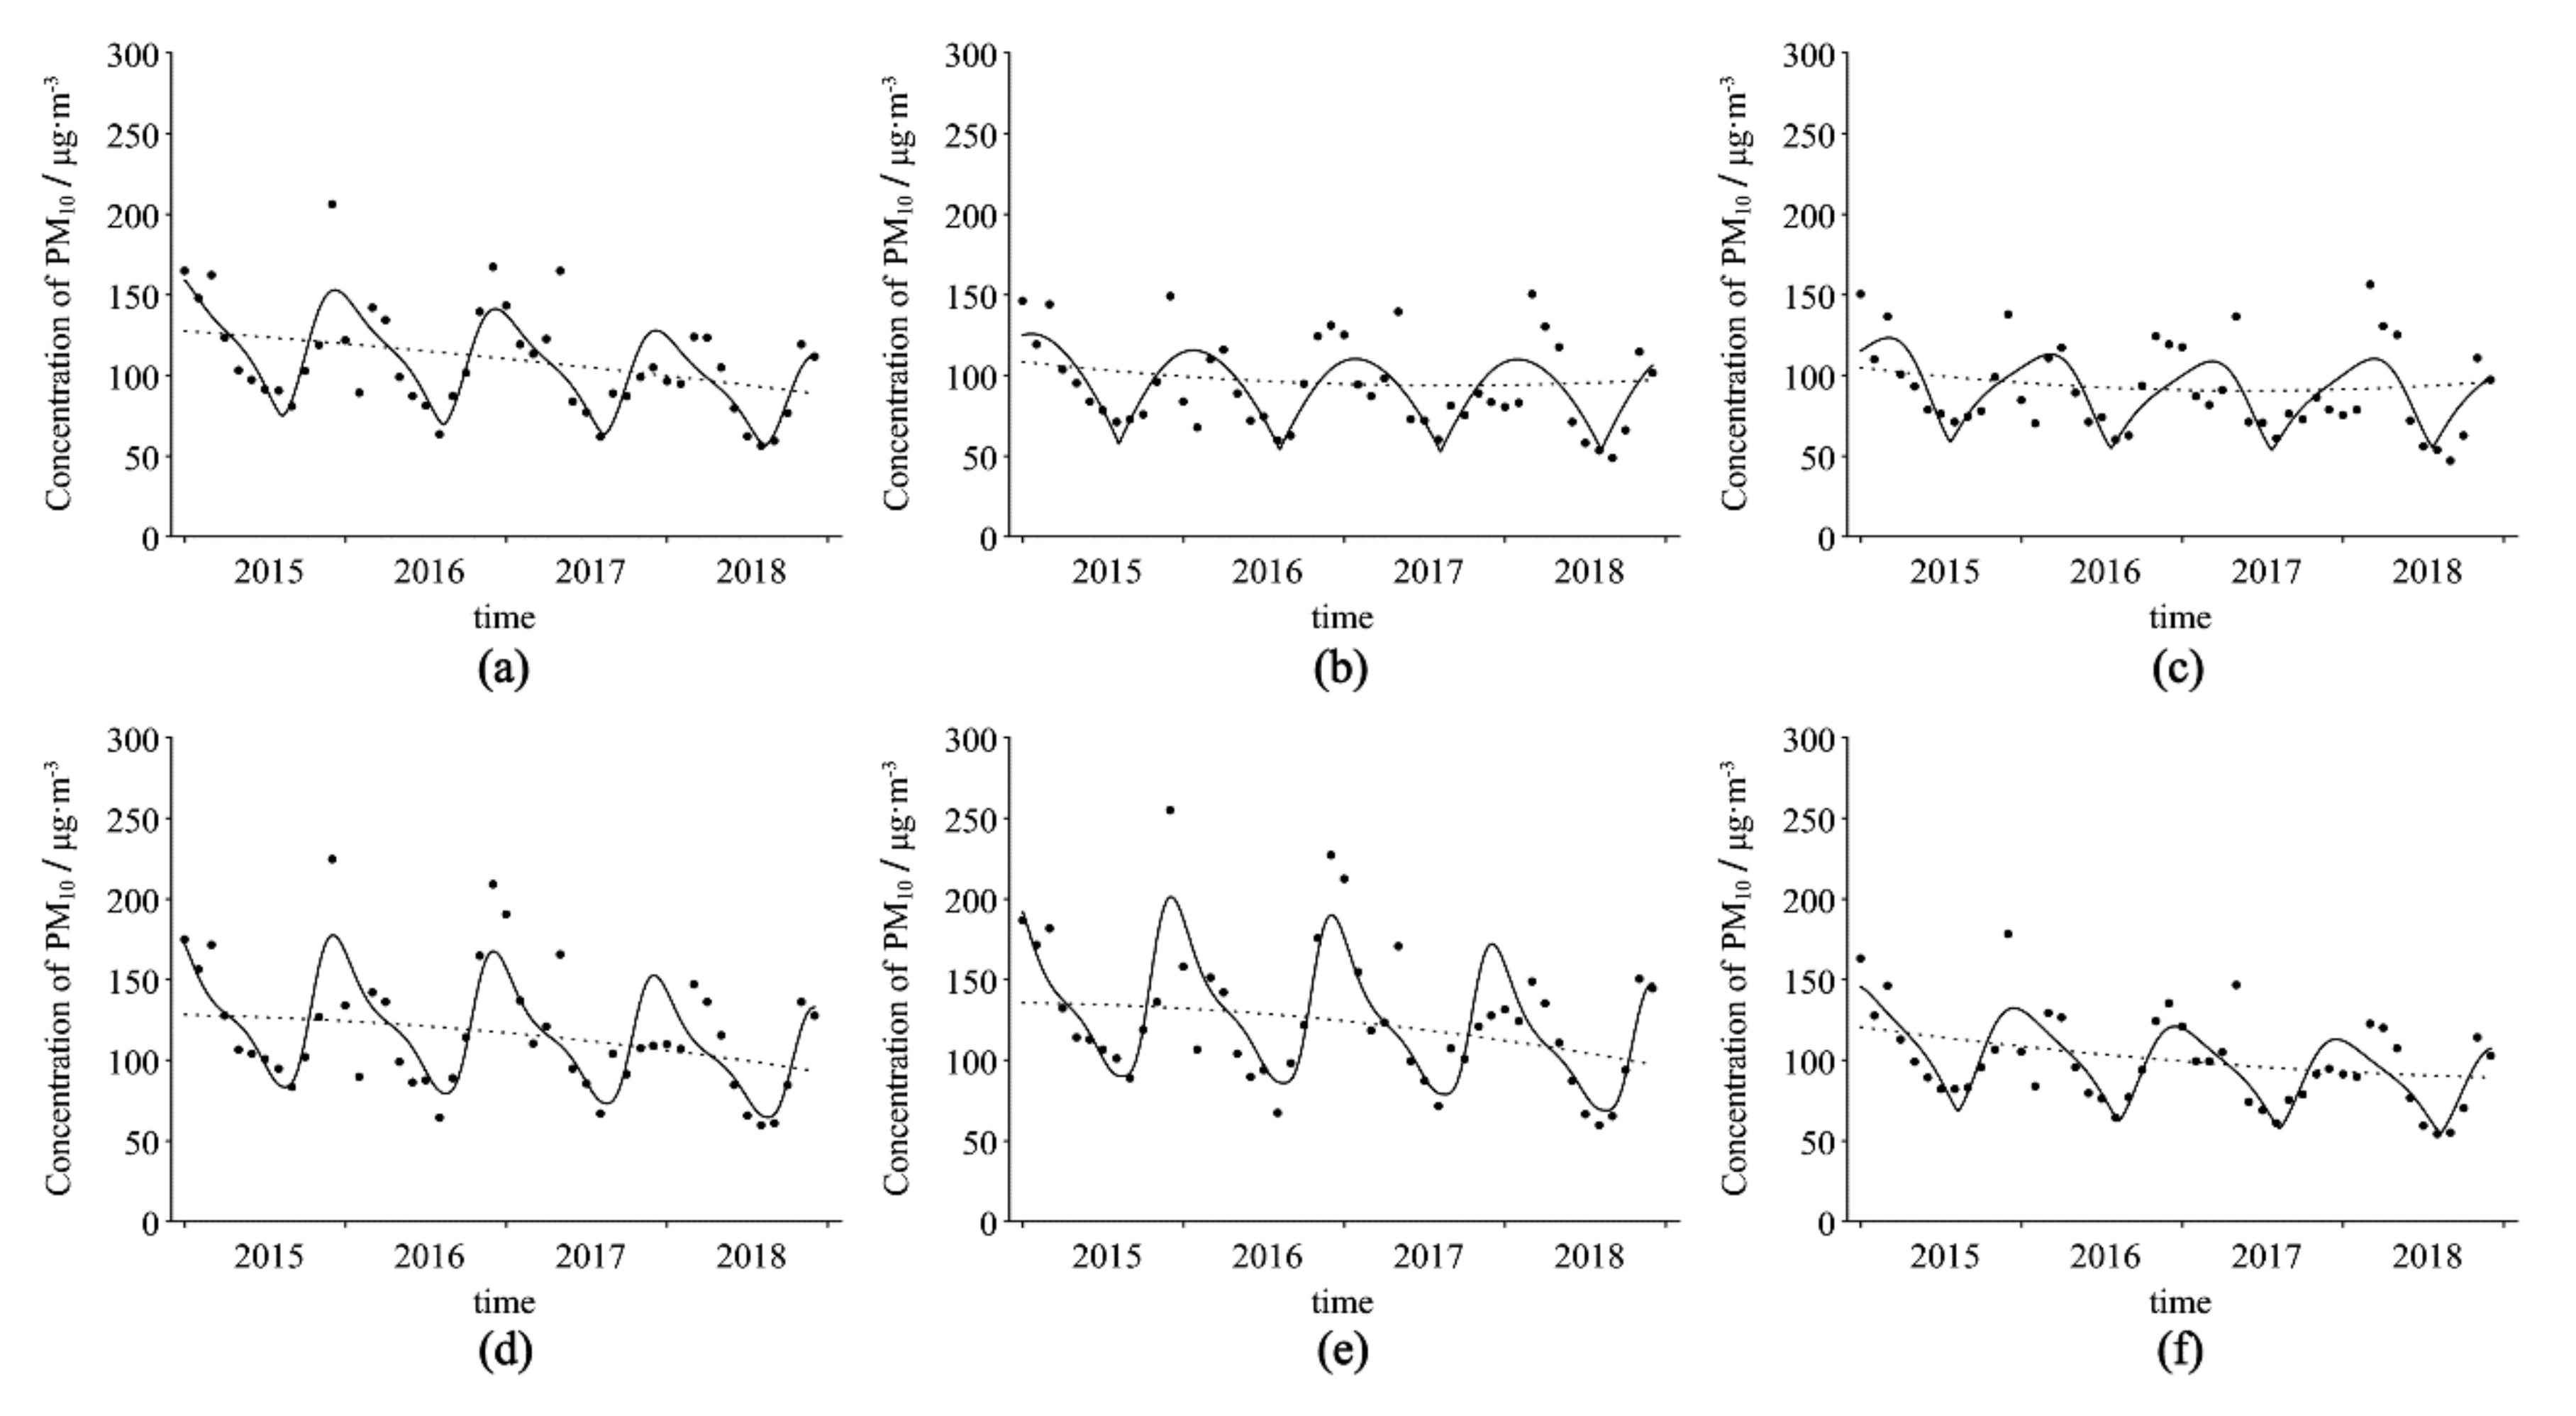
Figure 8.
Spatial distributions of the PM2.5 and PM10 concentrations at the county level.
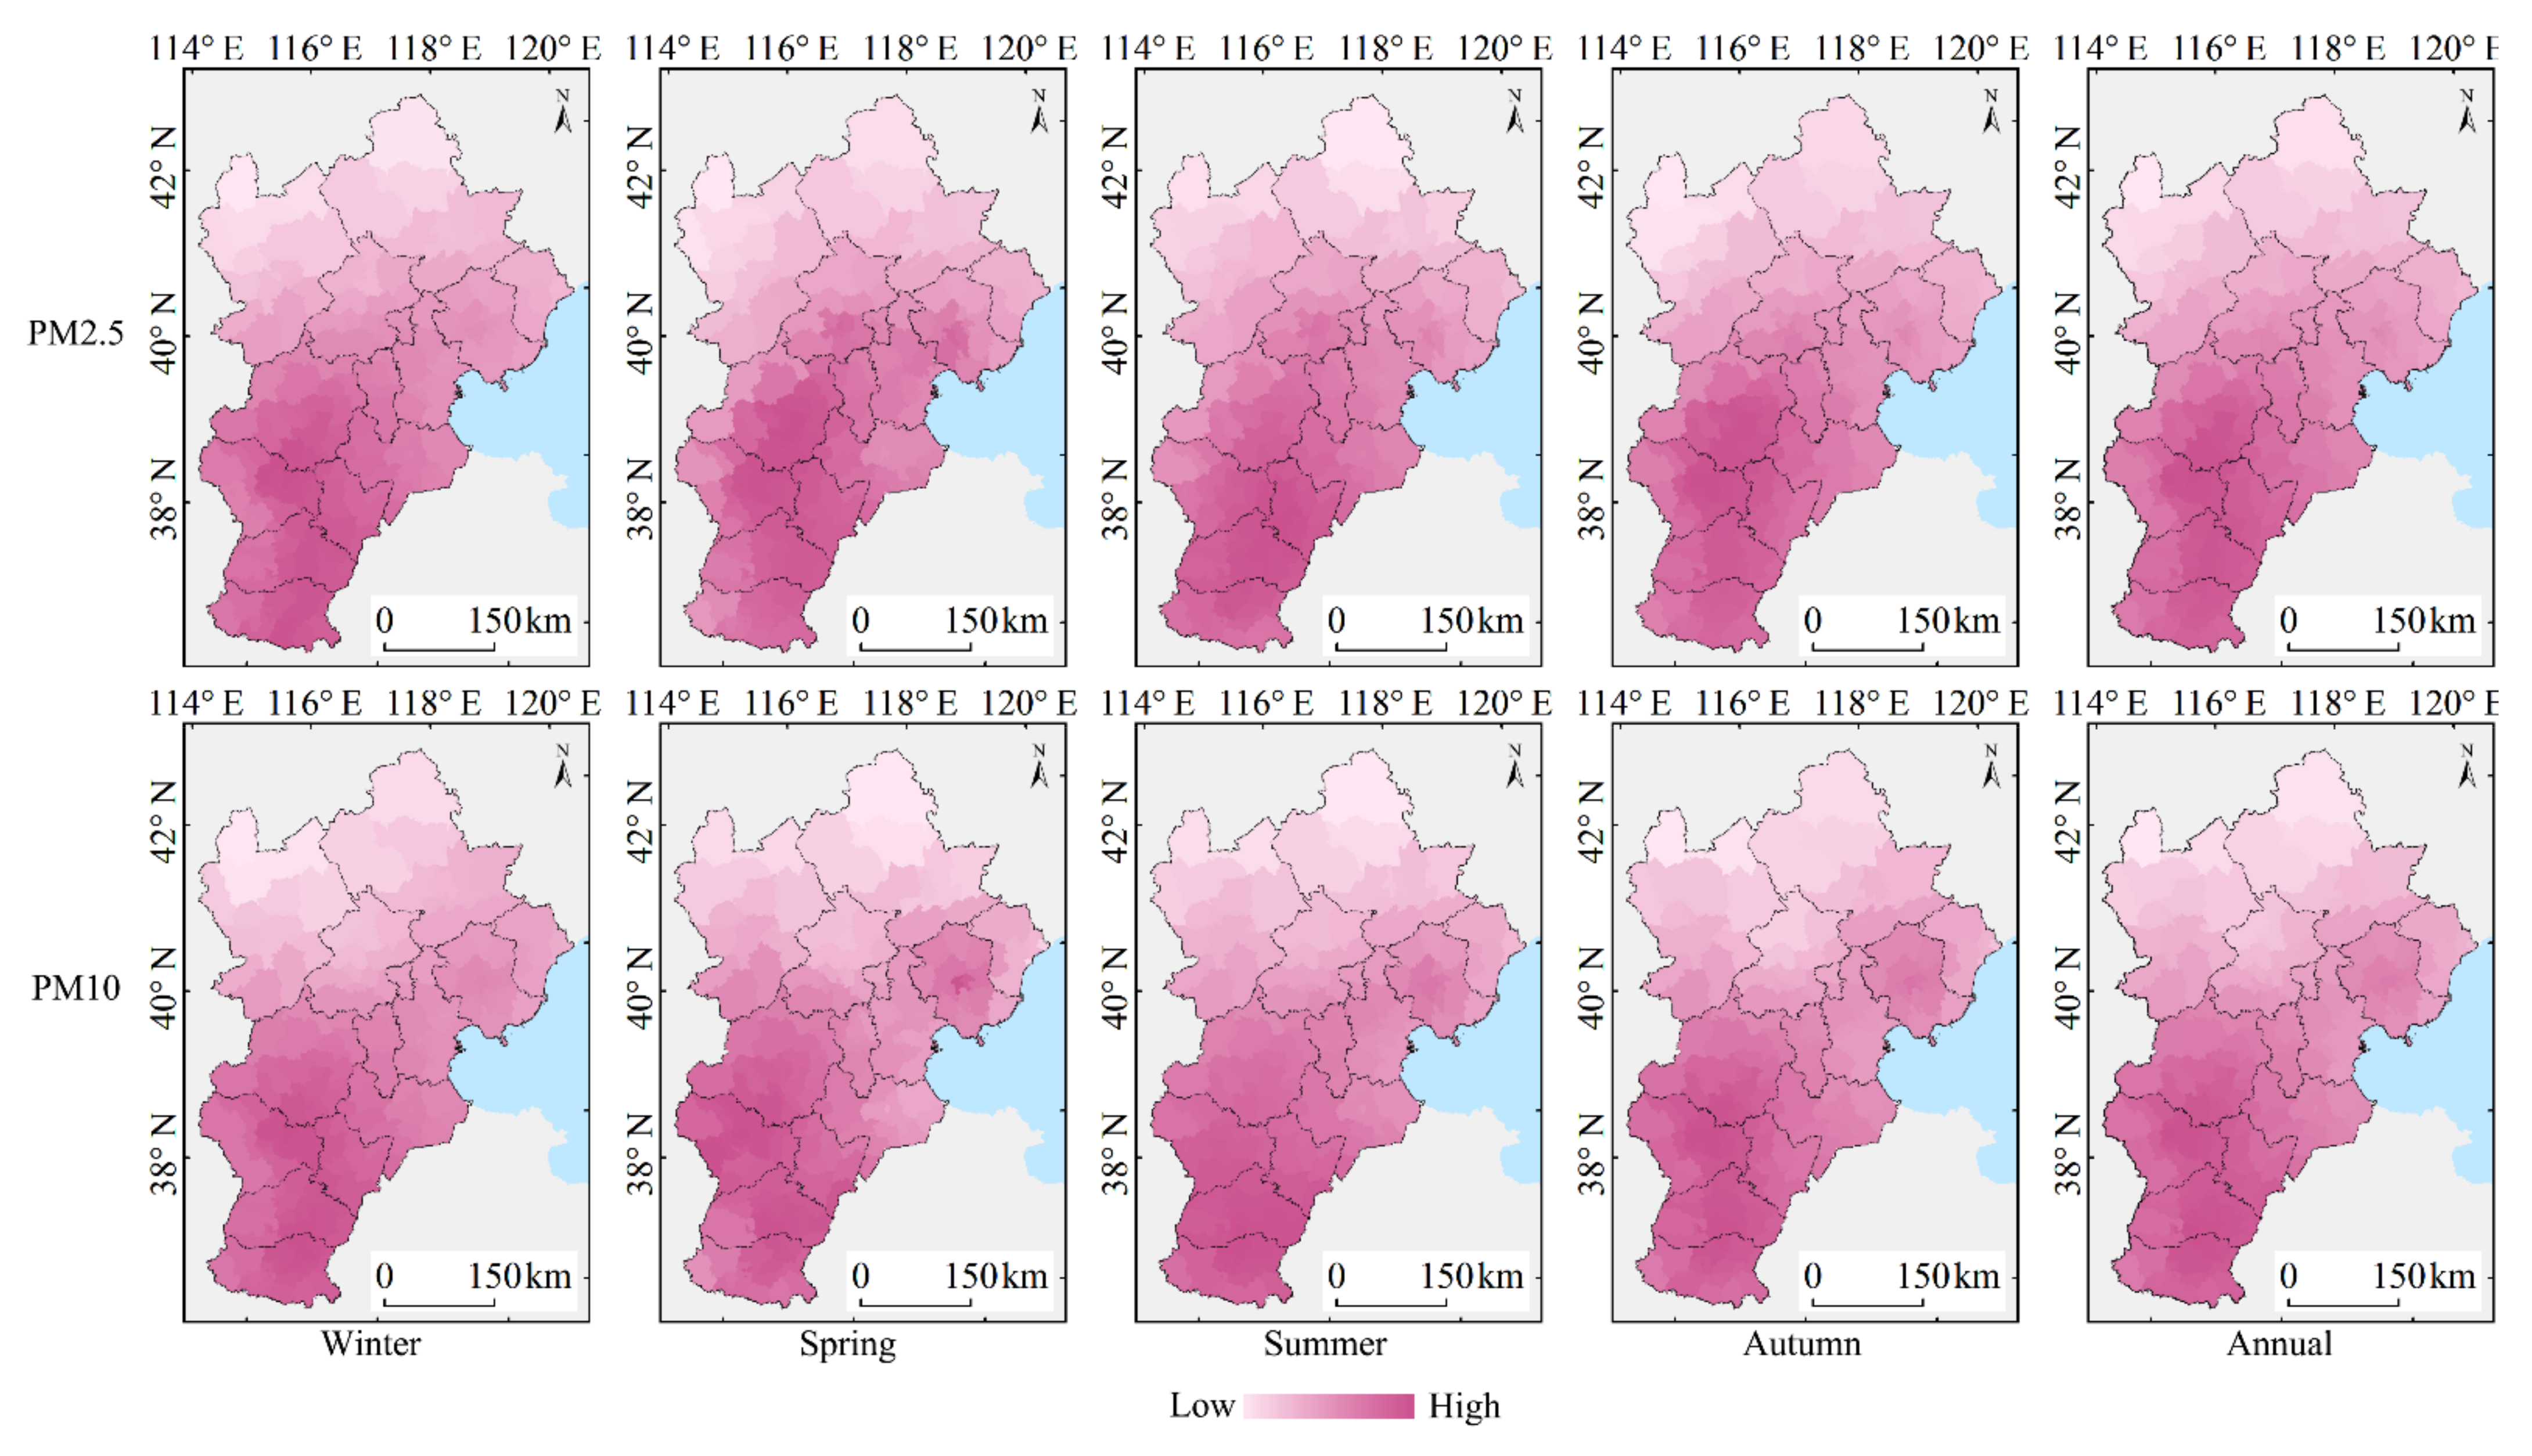
Figure 9.
Spatial distributions of the landscape pattern indices at the landscape level.

Figure 10.
Spatial distributions of the landscape pattern indices at the class level.
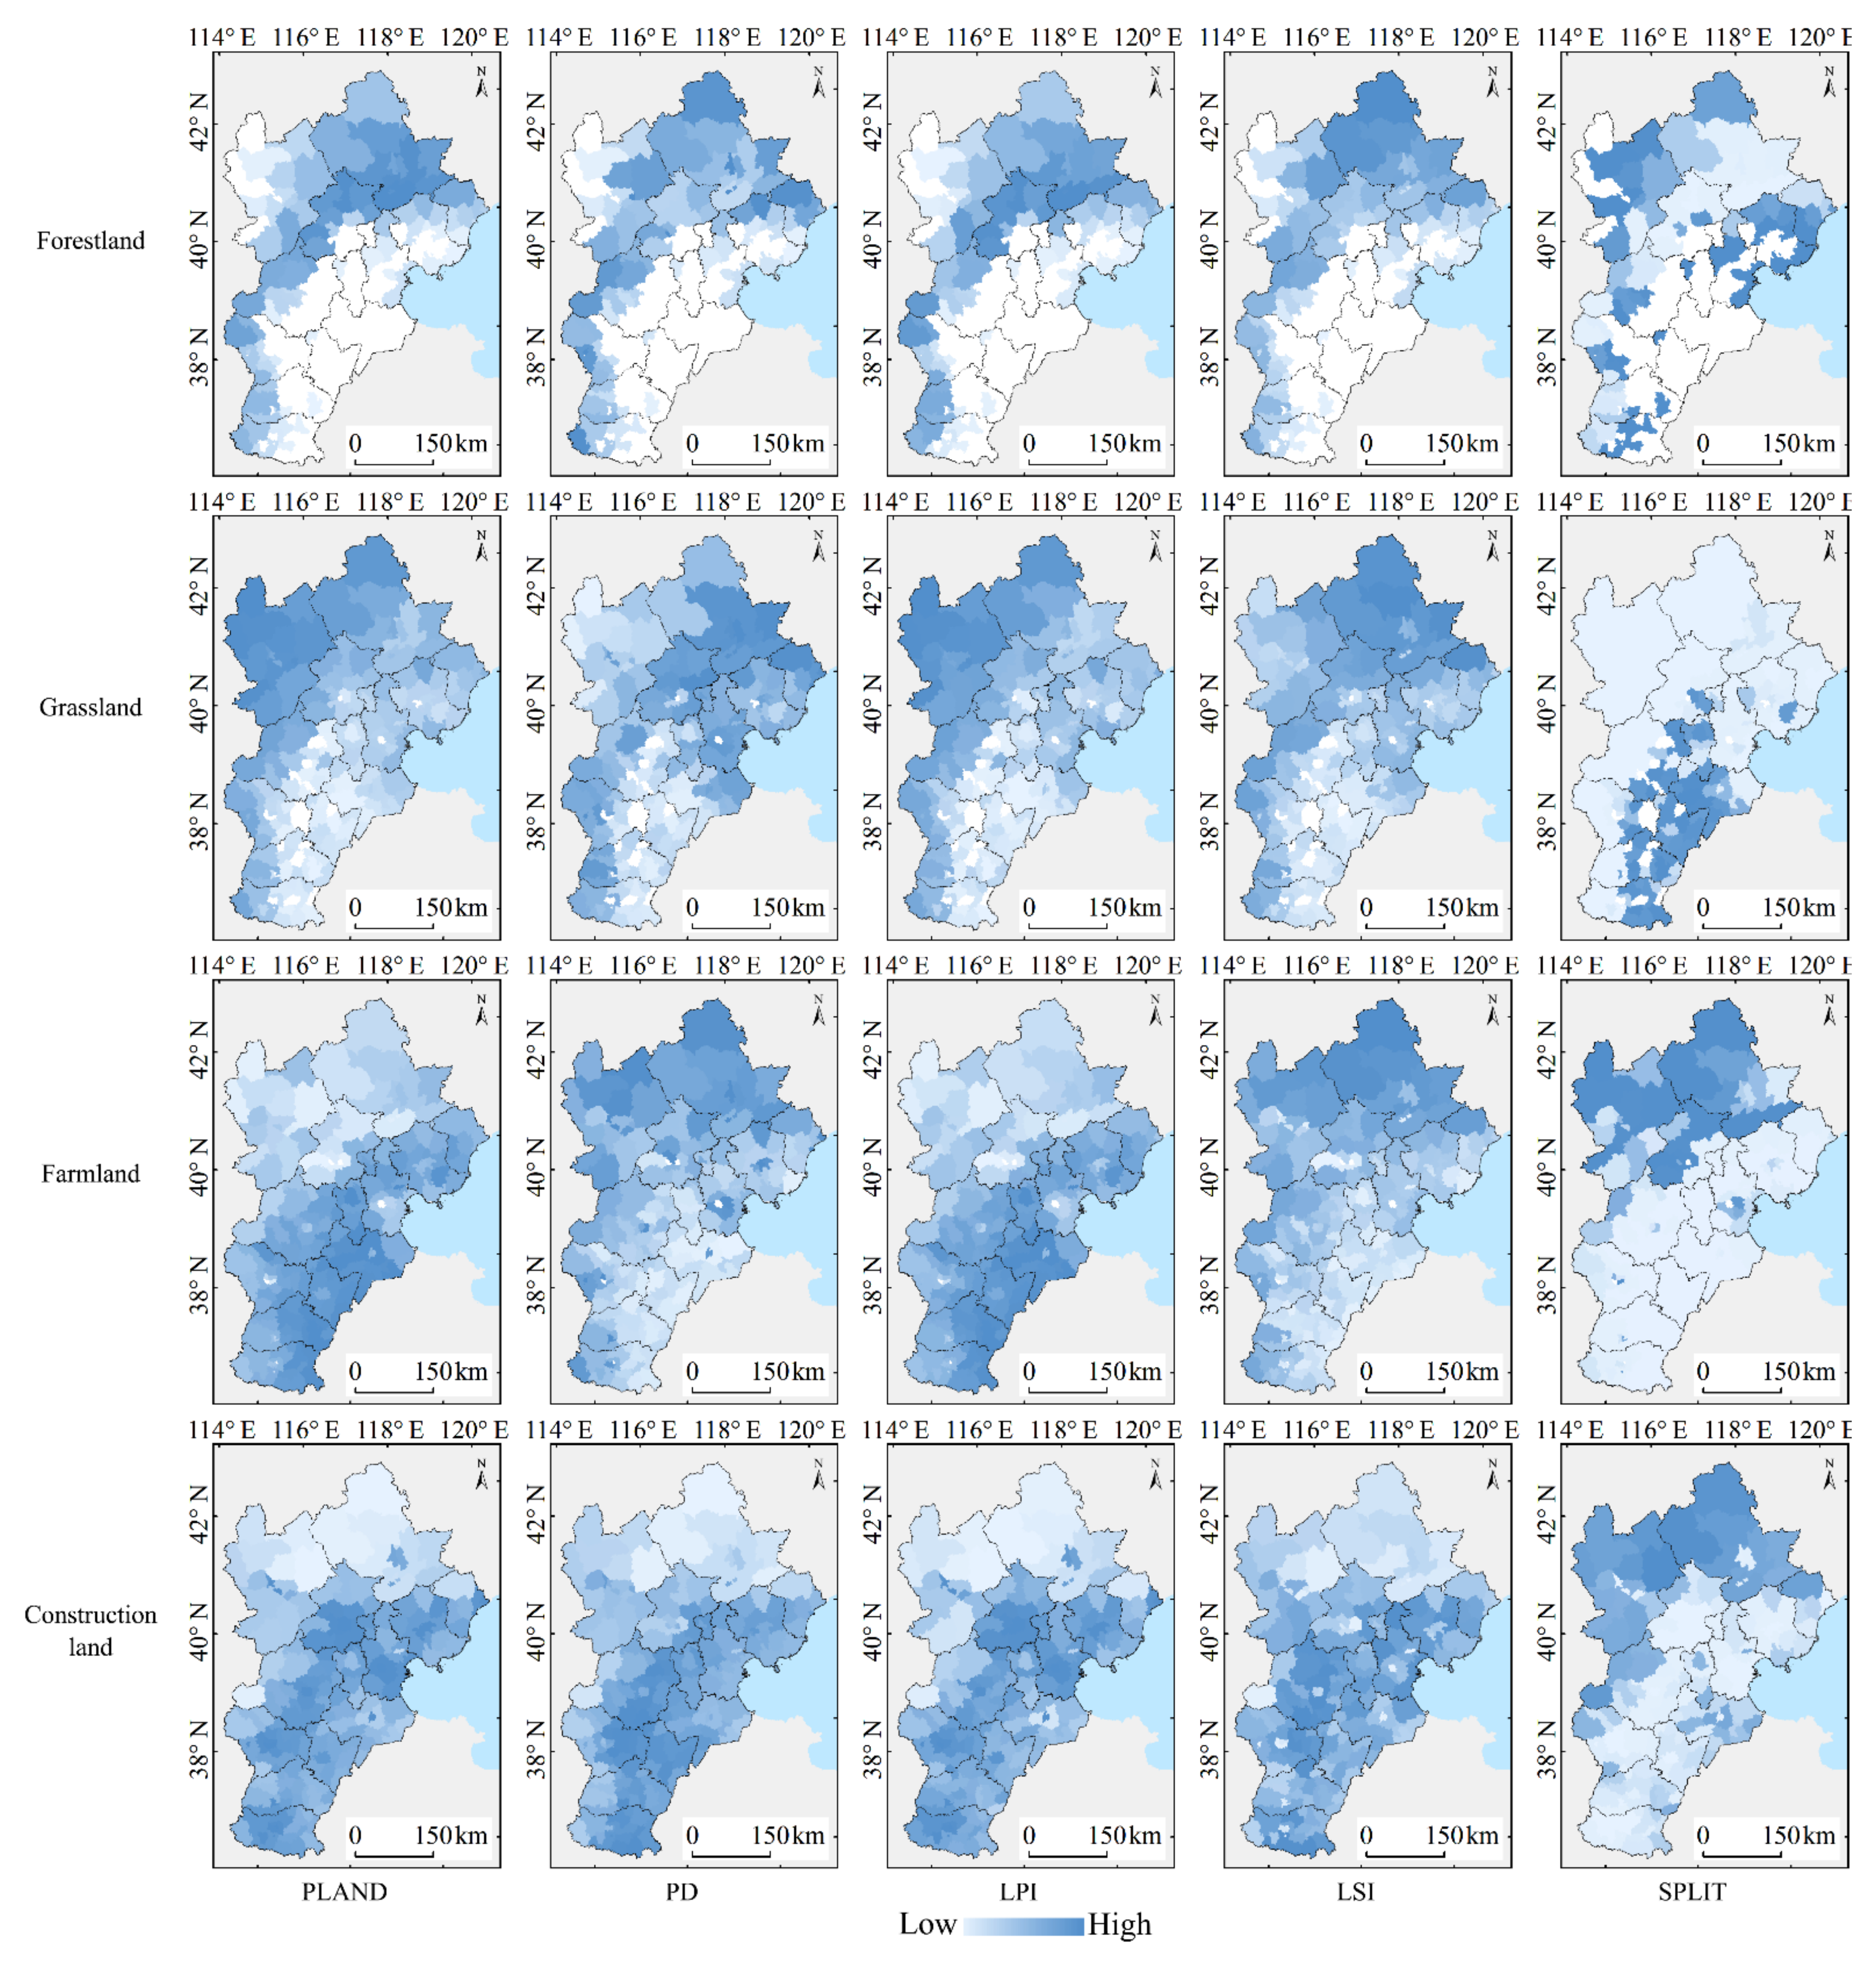

Table 1.
Parameters and their descriptions in the improved sine function model.
| Parameters | Definition | Range | Description |
|---|---|---|---|
| At | Quadratic coefficient | (−∞, ∞) | At determines the opening direction and magnitude of the parabolic curve, namely: (1) for At > 0, the parabolic curve opens upwards; (2) for At < 0, the parabolic curve opens downwards. Additionally, the larger the absolute value of At is, the smaller the opening of the parabolic curve, while the smaller the absolute value of At is, the larger the opening of the parabolic curve. |
| Bt | Primary term coefficient | (−∞, ∞) | Bt and At jointly determine the position of the axis of symmetry. |
| Bt/2At | Axis of symmetry | (1) When the axis of symmetry occurs within the studied time range, for At > 0, the concentration first decreases and then increases. Conversely, for At < 0, the concentration first increases and then decreases. (2) When the axis of symmetry occurs on the left side of the studied time range, for At > 0, the concentration continuously increases, and the rate of increase rises. Conversely, for At < 0, the concentration continuously decreases, but the rate of decrease rapidly declines. (3) When the axis of symmetry is located on the right side of the studied time range, for At > 0, the concentration continuously decreases, but the rate of decrease declines. Conversely, for At < 0, the concentration continuously increases, but the rate of increase declines. In addition, when the axis of symmetry is located far from the studied time range, the concentration can be considered to increase or decrease at an approximately constant rate. | |
| Ct | Constant | (−∞, ∞) | Ct determines the intersection of the parabolic curve and Y-axis and represents the overall particulate matter concentration at the starting time of the analysis. |
| Dt | Amplitude | [0, ∞) | Dt indicates the differences between peak and valley values and determines the oscillation amplitude. The larger its value, the stronger the fluctuations are. |
| Et | Cycle | 12 | Et represents the fluctuation duration. Because particulate matter fluctuation over a year is considered in this paper, a fixed Et value of 12 is adopted. |
| Ft | Deformation factor | (0, ∞) | Ft indicates the duration of periods with high or low values during a given cycle: (1) for Ft = 1, the curve of the sine function uniformly oscillates; (2) for Ft > 1, the function curve exhibits narrow peaks and wide valleys, and the larger the Ft value is, the stronger the deformation; (3) for 0 < Ft < 1, the function curve exhibits wide peaks and narrow valleys, and the closer the Ft value is to 0, the stronger the deformation. |
| Gt | Phase | [0, 12] | Gt determines the occurrence positions of peaks. During a given period, the larger the value, the later peaks and valleys occur. |
| Ht | Offset factor | (−∞, ∞) | Ht indicates the relative positions of peaks and valleys, namely: (1) for Ht = 0, the left and right positions of valleys are located at the centers of two adjacent peaks, i.e., the time when one peak reaches the next valley is equal to the time when one valley rises to reach the next peak; (2) for Ht > 0, the trough moves towards the right, i.e., the time required for one peak to reach the next trough increases, and the time required for one trough to reach the next peak decreases; (3) for Ht < 0, the trough moves towards the left, i.e., the time required for one peak to reach the next trough decreases, and the time required for one trough to reach the next peak increases. The larger the absolute value of Ht is, the larger the offset. |
Table 2.
Land use types and descriptions after reclassification.
| Land Use Type | Description |
|---|---|
| Water bodies | Permanent water coverage rates not lower than 60%. |
| Forestland | Tree cover not lower than 10%. |
| Grassland | Dominated by herbaceous annuals (less than 2 m) with no cultivation. |
| Farmland | Dominated by herbaceous annuals (less than 2 m) and no less than 60% cereal crops or broadleaf crops. |
| Construction land | Impervious surface coverage, including building materials, asphalt, and vehicles, not lower than 30%. |
| Unused land | Unvegetated barren (sand, rock, soil) with less than 10% vegetation. |
Table 3.
Comparison of R2 between the traditional and improved models.
| PM2.5 | PM10 | |||
|---|---|---|---|---|
| The Traditional Model | The Improved Model | The Improved Model | The Improved Model | |
| The BTH region | 0.60 | 0.74 | 0.53 | 0.58 |
| Beijing | 0.36 | 0.50 | 0.29 | 0.32 |
| Tianjin | 0.50 | 0.67 | 0.51 | 0.56 |
| Shijiazhuang | 0.52 | 0.67 | 0.48 | 0.56 |
| Tangshan | 0.53 | 0.64 | 0.48 | 0.57 |
| Qinhuangdao | 0.55 | 0.56 | 0.60 | 0.64 |
| Handan | 0.50 | 0.77 | 0.53 | 0.68 |
| Xingtai | 0.64 | 0.81 | 0.63 | 0.68 |
| Baoding | 0.66 | 0.81 | 0.65 | 0.72 |
| Zhangjiakou | 0.08 | 0.18 | 0.19 | 0.34 |
| Chengde | 0.54 | 0.59 | 0.36 | 0.42 |
| Cangzhou | 0.58 | 0.76 | 0.60 | 0.71 |
| Langfang | 0.50 | 0.67 | 0.43 | 0.50 |
| Hengshui | 0.63 | 0.84 | 0.64 | 0.74 |
Table 4.
Land use transfer matrix from 2015 to 2018.
| 2018 | ||||||||
|---|---|---|---|---|---|---|---|---|
| Water Bodies | Forestland | Grassland | Farmland | Construction Land | Unused Land | Total | ||
| 2015 | Water bodies | 2650 | 0 | 4 | 0 | 0 | 5 | 2658 |
| Forestland | 1 | 30,066 | 1404 | 107 | 4 | 0 | 31,582 | |
| Grassland | 53 | 3404 | 57,858 | 2008 | 115 | 23 | 63,461 | |
| Farmland | 7 | 304 | 1861 | 98,473 | 447 | 0 | 101,091 | |
| Construction land | 0 | 0 | 0 | 0 | 16613 | 0 | 16,613 | |
| Unused land | 4 | 0 | 36 | 0 | 2 | 348 | 390 | |
| Total | 2714 | 33,773 | 61,163 | 100,588 | 17181 | 376 | 215,795 | |
| Unit: km2 | ||||||||
Table 5.
Fitting parameters of the monthly PM concentration.
| R2 | Average Concentration | At | Bt | Turning Point | Overall Trend | Average Monthly Variation | Ct | Dt | Et | Ft | Gt | Ht | ||
|---|---|---|---|---|---|---|---|---|---|---|---|---|---|---|
| PM2.5 | Water bodies | 0.71 | 64 | −0.0066 | −0.13 | Before 2015 | Descends rapidly | −0.46 | 53.20 | 1.20 | 12 | 1.95 | 1.86 | 1.43 |
| Forestland | 0.63 | 50 | 0.0008 | −0.45 | After 2018 | Descends slowly | −0.41 | 46.92 | 0.97 | 12 | 1.77 | 2.09 | 1.00 | |
| Grassland | 0.63 | 47 | 0.0040 | −0.62 | After 2018 | Descends slowly | −0.42 | 47.69 | 0.87 | 12 | 1.93 | 2.22 | 0.72 | |
| Farmland | 0.71 | 69 | −0.0148 | 0.19 | 2015.06 | Rises and then descends | −0.54 | 56.19 | 1.48 | 12 | 2.85 | 1.86 | 1.41 | |
| Construction land | 0.79 | 72 | −0.0154 | 0.24 | 2015.07 | Rises and then descends | −0.51 | 56.23 | 1.60 | 12 | 3.12 | 1.84 | 1.25 | |
| Unused land | 0.71 | 56 | 0.0026 | −0.56 | After 2018 | Descends slowly | −0.43 | 52.46 | 0.99 | 12 | 1.81 | 2.00 | 1.19 | |
| PM10 | Water bodies | 0.58 | 108 | −0.0027 | −0.37 | Before 2015 | Descends rapidly | −0.50 | 78.17 | 1.09 | 12 | 0.76 | 1.73 | 1.18 |
| Forestland | 0.41 | 93 | 0.0082 | −0.53 | 2017.08 | Descends and then rises | −0.13 | 61.02 | 1.09 | 12 | 0.46 | 0.97 | 0.14 | |
| Grassland | 0.38 | 91 | 0.0101 | −0.60 | 2017.06 | Descends and then rises | −0.11 | 62.81 | 1.02 | 12 | 0.58 | 0.54 | –0.86 | |
| Farmland | 0.57 | 117 | −0.0080 | −0.10 | Before 2015 | Descends rapidly | −0.49 | 84.77 | 1.15 | 12 | 1.17 | 1.74 | 1.46 | |
| Construction land | 0.66 | 126 | −0.0102 | −0.05 | Before 2015 | Descends rapidly | −0.55 | 91.18 | 1.26 | 12 | 1.37 | 1.76 | 1.42 | |
| Unused land | 0.56 | 99 | 0.0058 | −0.69 | After 2018 | Descends slowly | −0.40 | 73.82 | 1.00 | 12 | 0.63 | 1.60 | 0.94 |
Table 6.
Correlations between the particle concentrations and indices at the landscape level.
| PM2.5 | PM10 | |||||||||
|---|---|---|---|---|---|---|---|---|---|---|
| Winter | Spring | Summer | Autumn | All | Winter | Spring | Summer | Autumn | All | |
| PD | −0.185 ** | −0.108 | −0.181 ** | −0.158 * | −0.170 * | −0.155 * | −0.114 | −0.144 * | −0.128 | −0.143 * |
| LPI | 0.401 ** | 0.368 ** | 0.407 ** | 0.372** | 0.399 ** | 0.366 ** | 0.291 ** | 0.346 ** | 0.309 ** | 0.343 ** |
| ED | −0.362 ** | −0.307 ** | −0.395 ** | −0.322 ** | −0.356 ** | −0.331 ** | −0.280 ** | −0.358 ** | −0.284 ** | −0.320 ** |
| CONTAG | 0.249 ** | 0.200 ** | 0.251 ** | 0.195 ** | 0.234 ** | 0.227 ** | 0.154 * | 0.214 ** | 0.168 * | 0.203 ** |
| SPLIT | −0.385 ** | −0.387 ** | −0.419 ** | −0.386 ** | −0.398 ** | −0.343 ** | −0.330 ** | −0.357 ** | −0.317 ** | −0.342 ** |
| SHDI | −0.446 ** | −0.332 ** | −0.403 ** | −0.373 ** | −0.415 ** | −0.425 ** | −0.324 ** | −0.382 ** | −0.362 ** | −0.395 ** |
| SIDI | −0.418 ** | −0.320 ** | −0.386 ** | −0.349 ** | −0.391 ** | −0.395 ** | −0.293 ** | −0.355 ** | −0.329 ** | −0.364 ** |
| AI | 0.291 ** | 0.263** | 0.333 ** | 0.265 ** | 0.293 ** | 0.254 ** | 0.198 ** | 0.281 ** | 0.205 ** | 0.241 ** |
* indicates a significant correlation at the 0.05 level, and ** indicates a significant correlation at the 0.01 level.
Table 7.
Correlations between the particle concentration and indices at the class level.
| PM2.5 | PM10 | ||||||||||
|---|---|---|---|---|---|---|---|---|---|---|---|
| Winter | Spring | Summer | Autumn | All | Winter | Spring | Summer | Autumn | All | ||
| Forestland | PLAND | −0.382 ** | −0.346 ** | −0.372 ** | −0.359 ** | −0.376 ** | −0.389 ** | −0.367 ** | −0.424 ** | −0.378 ** | −0.393 ** |
| PD | −0.280 ** | −0.289 ** | −0.286 ** | −0.269 * | −0.285 ** | −0.255 * | −0.176 | −0.255 * | −0.212 | −0.235 * | |
| LPI | −0.270* | −0.195 | −0.222 * | −0.229 * | −0.246 * | −0.293 ** | −0.252 * | −0.306 ** | −0.278 * | −0.288 ** | |
| LSI | −0.464 ** | −0.551 ** | −0.530 ** | −0.487 ** | −0.502 ** | −0.444 ** | −0.468 ** | −0.477 ** | −0.439 ** | −0.457 ** | |
| SPLIT | 0.099 | 0.113 | 0.088 | 0.070 | 0.095 | 0.106 | 0.053 | 0.094 | 0.070 | 0.088 | |
| Grassland | PLAND | −0.656 ** | −0.791 ** | −0.713 ** | −0.713 ** | −0.712 ** | −0.623 ** | −0.515 ** | −0.592 ** | −0.564 ** | −0.598 ** |
| PD | −0.394 ** | −0.259 ** | −0.351 ** | −0.333 ** | −0.360 ** | −0.369 ** | −0.325 ** | −0.348 ** | −0.336 ** | −0.357 ** | |
| LPI | −0.588 ** | −0.737 ** | −0.648 ** | −0.653 ** | −0.647 ** | −0.560 ** | −0.462 ** | −0.530 ** | −0.508 ** | −0.537 ** | |
| LSI | −0.528 ** | −0.505 ** | −0.553 ** | −0.515 ** | −0.535 ** | −0.509 ** | −0.507 ** | −0.527 ** | −0.487 ** | −0.514 ** | |
| SPLIT | 0.237 ** | 0.174 * | 0.212 ** | 0.199 ** | 0.220 ** | 0.237 ** | 0.162 * | 0.188 * | 0.183 * | 0.210 ** | |
| Farmland | PLAND | 0.631 ** | 0.619 ** | 0.618 ** | 0.602 ** | 0.633 ** | 0.630 ** | 0.512 ** | 0.586 ** | 0.554 ** | 0.597 ** |
| PD | −0.267 ** | −0.291 ** | −0.278 ** | −0.261 ** | −0.276 ** | −0.236 ** | −0.138 | −0.183 * | −0.170 * | −0.202 ** | |
| LPI | 0.626 ** | 0.613 ** | 0.614 ** | 0.597 ** | 0.627 ** | 0.621 ** | 0.508 ** | 0.576 ** | 0.543 ** | 0.588 ** | |
| LSI | −0.507 ** | −0.587 ** | −0.594 ** | −0.541 ** | −0.549 ** | −0.483 ** | −0.510 ** | −0.531 ** | −0.471 ** | −0.498 ** | |
| SPLIT | −0.058 | −0.014 | −0.018 | −0.031 | −0.040 | −0.081 | −0.048 | −0.068 | −0.079 | −0.075 | |
| Construction land | PLAND | 0.084 | 0.242 ** | 0.195 ** | 0.188 ** | 0.150 * | 0.026 | 0.058 | 0.083 | 0.046 | 0.044 |
| PD | 0.555 ** | 0.503 ** | 0.505 ** | 0.538 ** | 0.548 ** | 0.551 ** | 0.536 ** | 0.510 ** | 0.524 ** | 0.545 ** | |
| LPI | 0.034 | 0.189 ** | 0.147 * | 0.135 | 0.098 | −0.021 | 0.015 | 0.043 | 0.002 | −0.002 | |
| LSI | 0.388 ** | 0.365 ** | 0.344 ** | 0.371 ** | 0.383 ** | 0.370 ** | 0.335 ** | 0.294 ** | 0.324 ** | 0.349 ** | |
| SPLIT | −0.378 ** | −0.492 ** | −0.458 ** | −0.435 ** | −0.428 ** | −0.357 ** | −0.390 ** | −0.384 ** | −0.356 ** | −0.371 ** | |
* indicates a significant correlation at the 0.05 level, and ** indicates a significant correlation at the 0.01 level.
Publisher’s Note: MDPI stays neutral with regard to jurisdictional claims in published maps and institutional affiliations. |
© 2022 by the authors. Licensee MDPI, Basel, Switzerland. This article is an open access article distributed under the terms and conditions of the Creative Commons Attribution (CC BY) license (https://creativecommons.org/licenses/by/4.0/).
Share and Cite
MDPI and ACS Style
Zhai, H.; Yao, J.; Wang, G.; Tang, X. Impact of Land Use on Atmospheric Particulate Matter Concentrations: A Case Study of the Beijing–Tianjin–Hebei Region, China. Atmosphere 2022, 13, 391. https://doi.org/10.3390/atmos13030391
AMA Style
Zhai H, Yao J, Wang G, Tang X. Impact of Land Use on Atmospheric Particulate Matter Concentrations: A Case Study of the Beijing–Tianjin–Hebei Region, China. Atmosphere. 2022; 13(3):391. https://doi.org/10.3390/atmos13030391
Chicago/Turabian StyleZhai, Haoran, Jiaqi Yao, Guanghui Wang, and Xinming Tang. 2022. "Impact of Land Use on Atmospheric Particulate Matter Concentrations: A Case Study of the Beijing–Tianjin–Hebei Region, China" Atmosphere 13, no. 3: 391. https://doi.org/10.3390/atmos13030391
Note that from the first issue of 2016, this journal uses article numbers instead of page numbers. See further details here.