Article

Multi Field Coupled Coseismic Changes of the Jiashi Ms = 6.4 Earthquake of 19 January 2020, Based on Ground Temperature Observation

1
Xinjiang Pamir Intracontinental Subduction National Field Observation and Research Station, Urumqi 830011, China
2
Earthquake Agency of Xinjiang Uygur Autonomous Region, Urumqi 830011, China
3
China Earthquake Networks Center, Beijing 100045, China
*
Author to whom correspondence should be addressed.
Atmosphere 2022, 13(2), 154; https://doi.org/10.3390/atmos13020154
Submission received: 25 November 2021 / Revised: 6 January 2022 / Accepted: 17 January 2022 / Published: 18 January 2022

Abstract

:
The coseismic geothermal changes of ground temperature observed at observatories near the epicenter of the 2020 Jiashi Ms = 6.4 earthquake in China, provide a unique opportunity to study heat generation and conduction in rock. Here, evolutions of rock temperature at the Xikeer, Jiashizongchang, and Gedaliang observatories, which are located at epicentral distances of 1.4, 27.42, and 50 km respectively, were analyzed. Significant coseismic geothermal changes of 0.0432 °C were observed at the Xikeer observatory at the depth of 33.38 m, at which clear diurnal variations can be observed. Smaller changes of ~0.0001 °C were observed at the depths of 12.3 and 22.8 m at the Xikeer observatory and 22.3 m at the Jiashizongchang observatory. The stress transfer induced by the coseismic rupture induced a rise in local ground temperature, but the magnitude of the change was relatively small. The larger amplitude change at the Xikeer observatory was caused by fluid infiltration. We note that diurnal variation has been recorded at the Gedaliang observatory, but the coseismic response is no longer in existence. The temperature increases at the hypocentral area were higher than expected in the ground due to the coseismic stress transfer, but the change attenuated rapidly with distance.

1. Introduction

Coseismic geothermal change generally refers to the physical change process of ground temperature that is a direct response to the occurrence of earthquakes, which could be used as an effective and useful tool for studying and monitoring coseismic ground deformation and the rupture process. However, there are not many studies in this field. Many experts and scholars have carried out coseismic studies in other fields. For example, Timofeev et al. [1] studied the coseismic changes of the 9.0 Tohoku-Oki earthquake by gravity and GPS methods. Qu et al. [2] used deformation data to study the coseismic change of the 2010 Yushu Ms = 7.1 earthquake in Qinghai, and Zhu et al. [3] studied the coseismic effect of an Ms = 9.0 earthquake in Japan around the Yishu fault zone through GPS observations. Tang et al. [4] used electromagnetic data to analyze the coseismic change of the strong aftershocks following the 2008 Wenchuan Ms = 8.0 earthquake, and Che et al. [5] used subsurface fluid observation data to study the 2004 Sumatra Ms = 8.7 earthquake that triggered the coseismic blowout phenomenon of the Chagan well. The coseismic changes of strong earthquakes are mostly monitored via technical methods, such as monitoring groundwater [6,7] and measuring major topographic changes [8]. The studies mentioned above showed that the coseismic changes of strong earthquakes are mostly triggered by seismic wave propagation or stress transfer [9], which raises the question of whether this process can cause changes in ground temperature.
Chen et al. [10] carried out research on this scientific field. They used Terra and Aqua satellite surface temperature to observe the coseismic geothermal change induced by the 2008 Wenchuan earthquake. Subsequently, Chen et al. [11] used ground temperature data to assess the coseismic ground temperature change of the Kangding Ms = 6.3 earthquake in 2014, but the magnitude of the change was small. A similar coseismic geothermal change on ground temperature was observed again when studying the meta-instability process before the Jiashi Ms = 6.4 earthquake in 2020 [12], and it has been speculated that the physical mechanism of the coseismic response can mainly be attributed to changes in seismic stress and secondary fluid effects.
In fact, the physical mechanism of the coseismic geothermal change can be explained by the friction along the seismic fault plane [13], the ascension of underground heat flow [14], and the deformation or fracture attributable to local bedrock stress [15]. Green [16] found that there is an obvious heat generation phenomenon due to friction during the high-speed sliding of faults. This phenomenon can also be proven by rock experiments [17]. Gao [18] further found that the sliding friction caused by the rapid displacement of the fault plane when an earthquake occurs can cause the temperature near the fault plane to rise sharply, and that the temperature can rise more than 10 °C in an instant. Coseismic geothermal changes in groundwater are generally caused by changes in reservoir and pore pressure caused by crustal stress, upward movement of magma [19], and convective oscillations caused by seismic waves [20]. These elevated temperatures are transmitted through the medium, which may cause the coseismic ground temperature change.
At the same time, the coseismic change of ground temperature can also be caused by the ascension of underground heat. Wang [21] studied a three-level structural model of a north–south seismic zone and found that there is a ductile rheological layer in the middle and lower crust, which serves as an energy storage unit for accumulation and transformation of seismic energy. The fluid and energy carried by asthenospheric uplift continues to ascend, and upwelling thermal fluid can cause the ground temperature to rise rapidly. Xin et al. [22] discovered that there was a participation of subsurface heat flow when studying the coseismic ground temperature phenomenon of the Tangshan Ms = 7.8 earthquake in 1978.
In addition, coseismic ground temperature changes may also be caused by local bedrock stress loading. Liu et al. [23,24] performed rock thermal stress load experiments and found that temperature changes occur in the process of rock deformation. They pointed out that the elastic stage is a stress-heating stage, whereas the stick–slip stage produces a temperature increase as a result of friction. In the rupture stage, the rapid friction along the fault plane causes a sharp temperature rise. Chen et al. [25] further found that the temperature response in the source media is proportional to the body strain, and pure shear deformation can hardly cause temperature changes.
The high design accuracy of ground temperature observation methods should provide a useful tool of observing the coseismic ground temperature change. However, due to the small distribution of ground temperature observations, relatively few earthquake observations have been acquired. The 2020 Jiashi Ms = 6.4 earthquake and the observation of proximal ground temperature undoubtedly provided a rare opportunity for research. In this study, by comparing the coseismic responses recorded at different locations and different layers within 50 km of the epicenter, we examined the heat source, generation method, and conduction process of the coseismic geothermal change.

2. Observation Stations

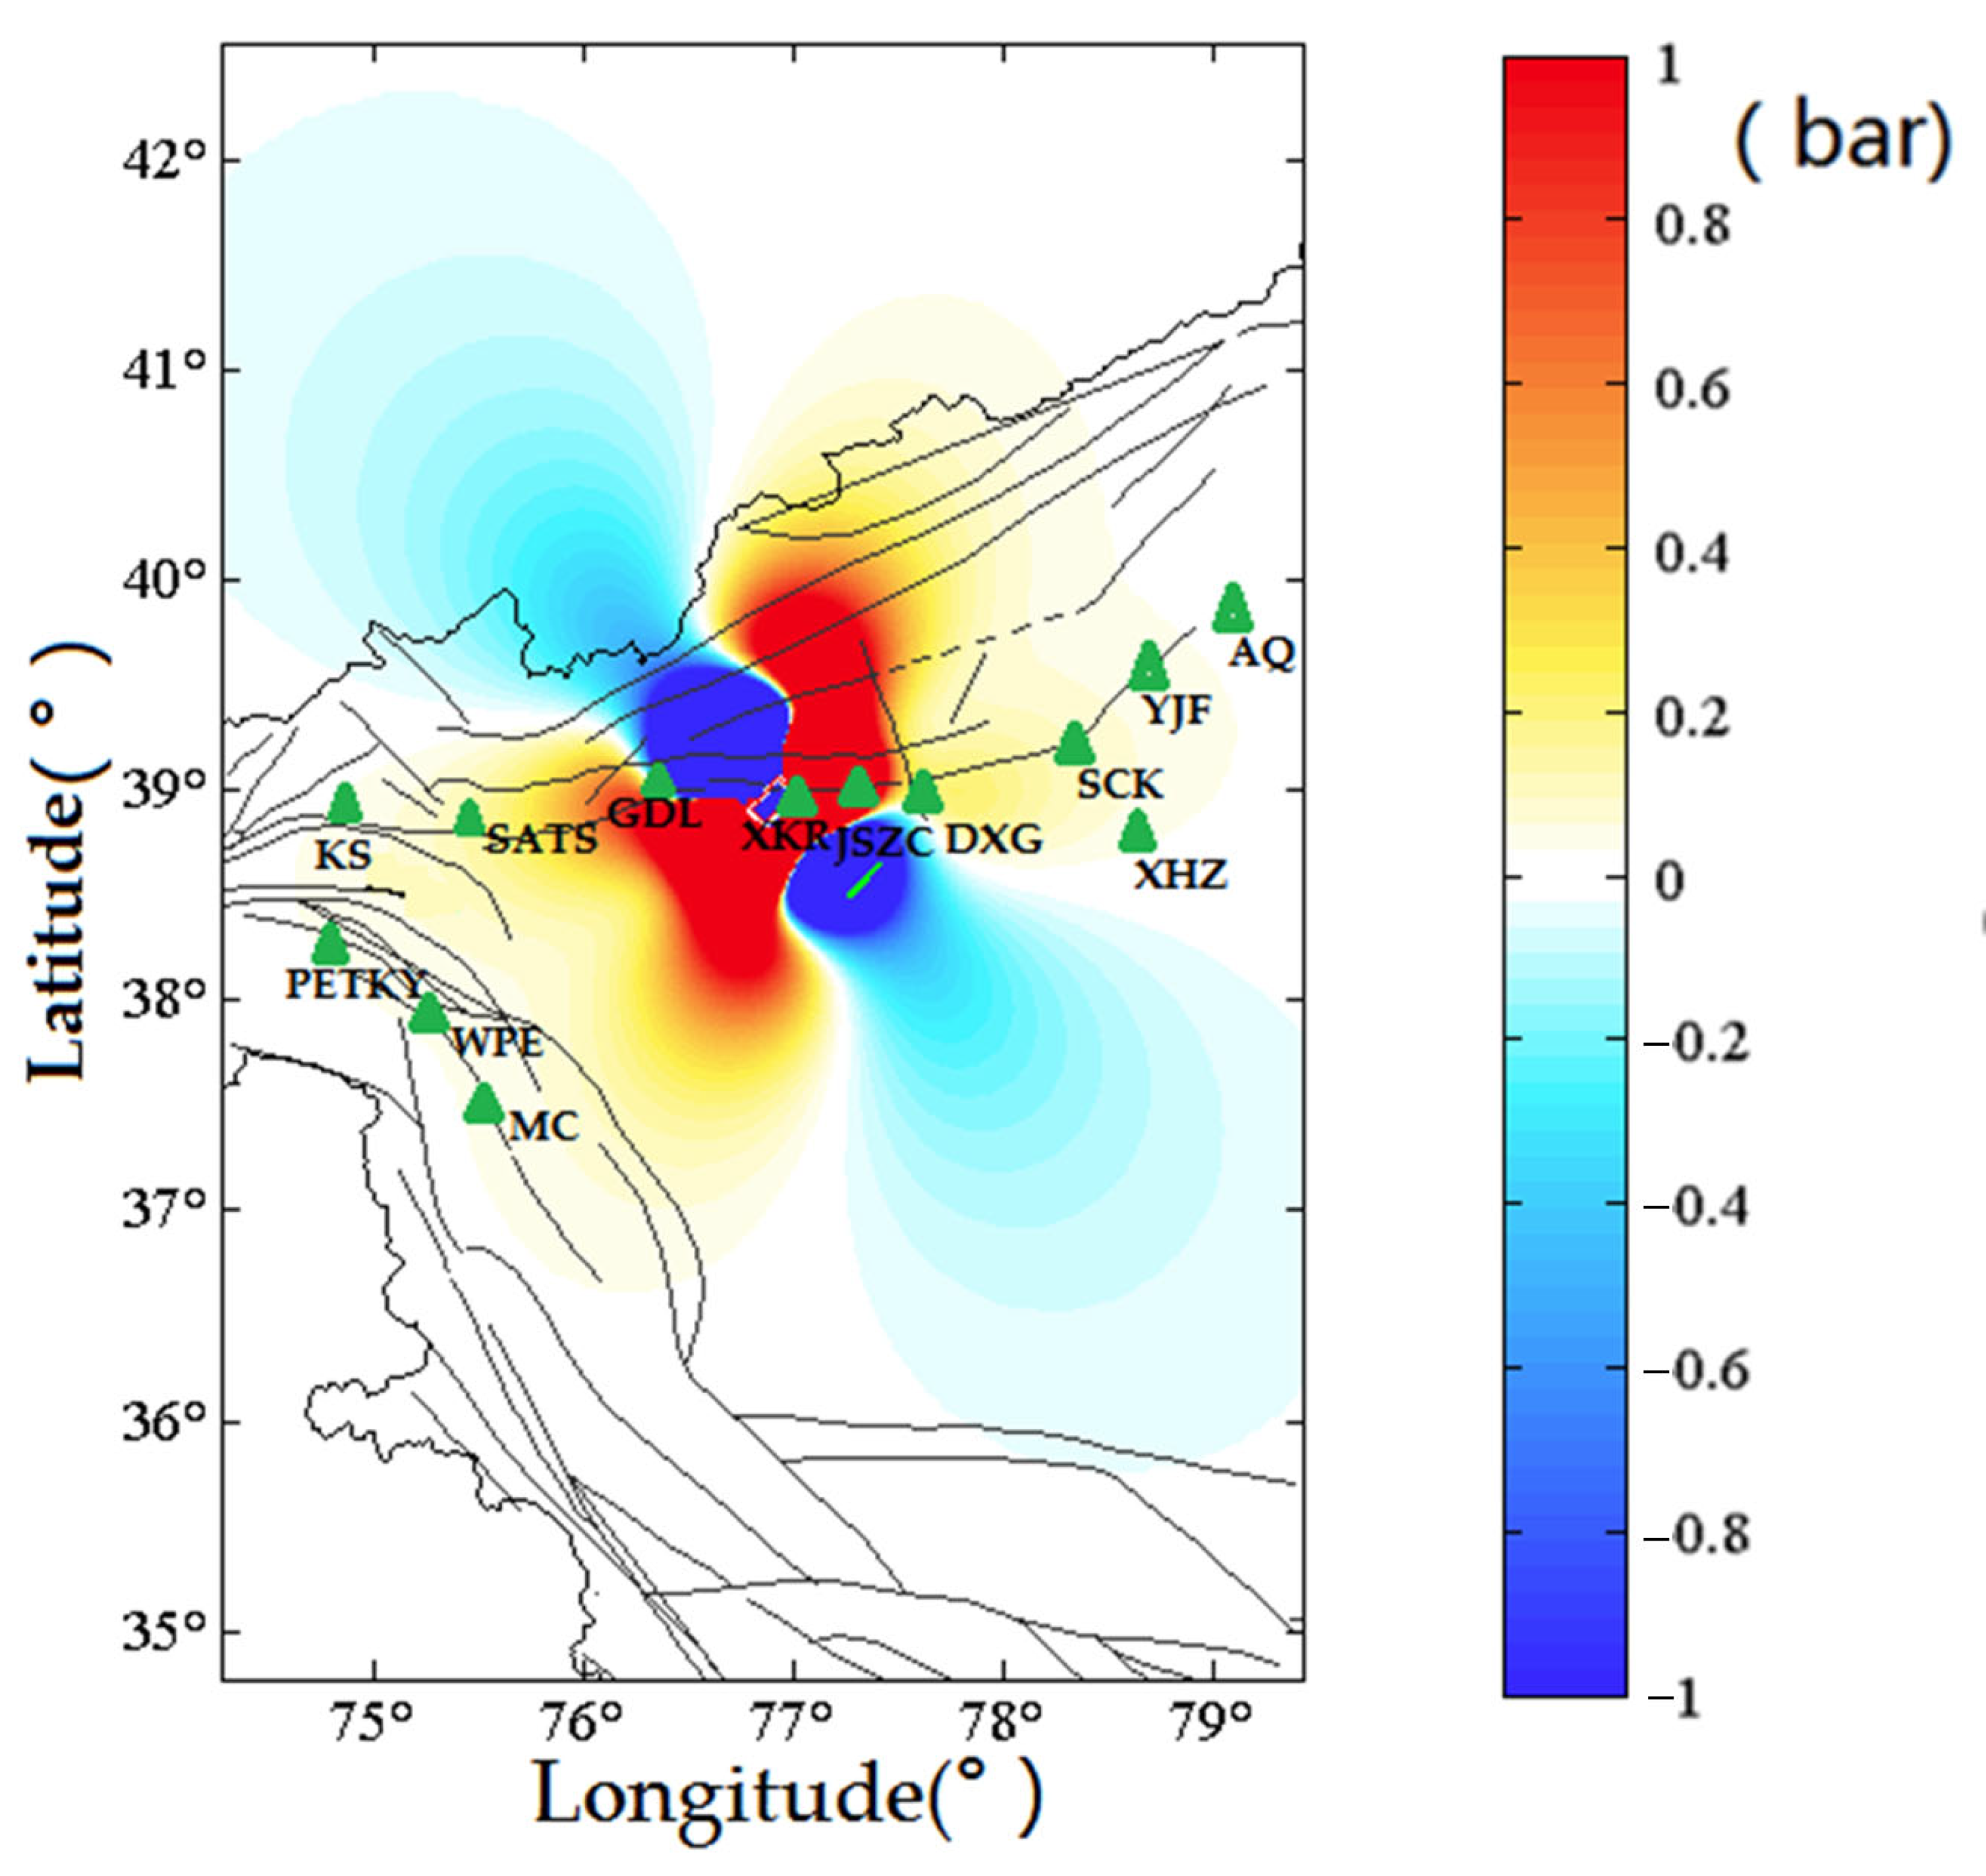
2.1. Geological Setting of the Study Area

The Xinjiang Jiashi Ms = 6.4 earthquake, with a depth of 16 km, occurred on 19 January 2020, and was in the area where the South Tianshan Fold Belt, the Pamir arc structure, and the Tarim Basin intersect. The seismogenic fault was the nearly east–west Keping Fault (KPF in Figure 1). The precise positioning results showed that the aftershocks were mainly distributed on the north side of the main shock [26,27]. The focal mechanism results indicated that the earthquake was a thrust-type rupture, which is consistent with the Kepingtage thrust nappe structure. The Kepingtage nappe structural belt (indicated by the yellow contour) is an active reverse fault–fold belt formed since the late Cenozoic in the Tianshan orogenic belt. It consists of a piggyback basin or valley bottom [27] and is divided into east and west parts by the Puchang fault (PCF in Figure 1). As the collision front between the Tianshan Mountains in the southwest and the Tarim Basin, this area has frequented moderate and strong earthquakes (Figure 1).

2.2. Ground Temperature Monitoring

In 2019, the Institute of Geology of the China Earthquake Administration and the Xinjiang Earthquake Administration jointly constructed multiple ground temperature observation stations along the Keping fault in the western section of the South Tianshan Mountains. There are three ground temperature observation stations within 50 km of the epicenter of the Jiashi earthquake: Gedaliang (GDL), Jiashizongchang (JSZC), and Xikeer (XKE). The nearest ground temperature observation station is XKE, which is about 1.4 km away. According to the seismic rupture area inverted by Li et al. [28], from the interferometric synthetic aperture radar (InSAR) deformation field, the XKE ground temperature observation station happens to be within the area (Figure 1).
The ground temperature monitoring utilizes wireless ground temperature telemetering equipment developed by the Geological Institute, with an accuracy of 0.00003 °C. In order to save power, a sampling period of 10 min was adopted. The sensor was installed with a high-grade cement pour seal, which is closely integrated within the bedrock. The XKE ground temperature observation station (Figure 1) is located on the hanging wall of the Keping Fault, at the southern end of the rupture zone. The lithological structure at the survey point is dominated by sandstone and mudstone. Twelve temperature sensors were installed at depths of 0–50 m.

3. Coseismic Temperature Change of Jiashi Ms = 6.4 Earthquake

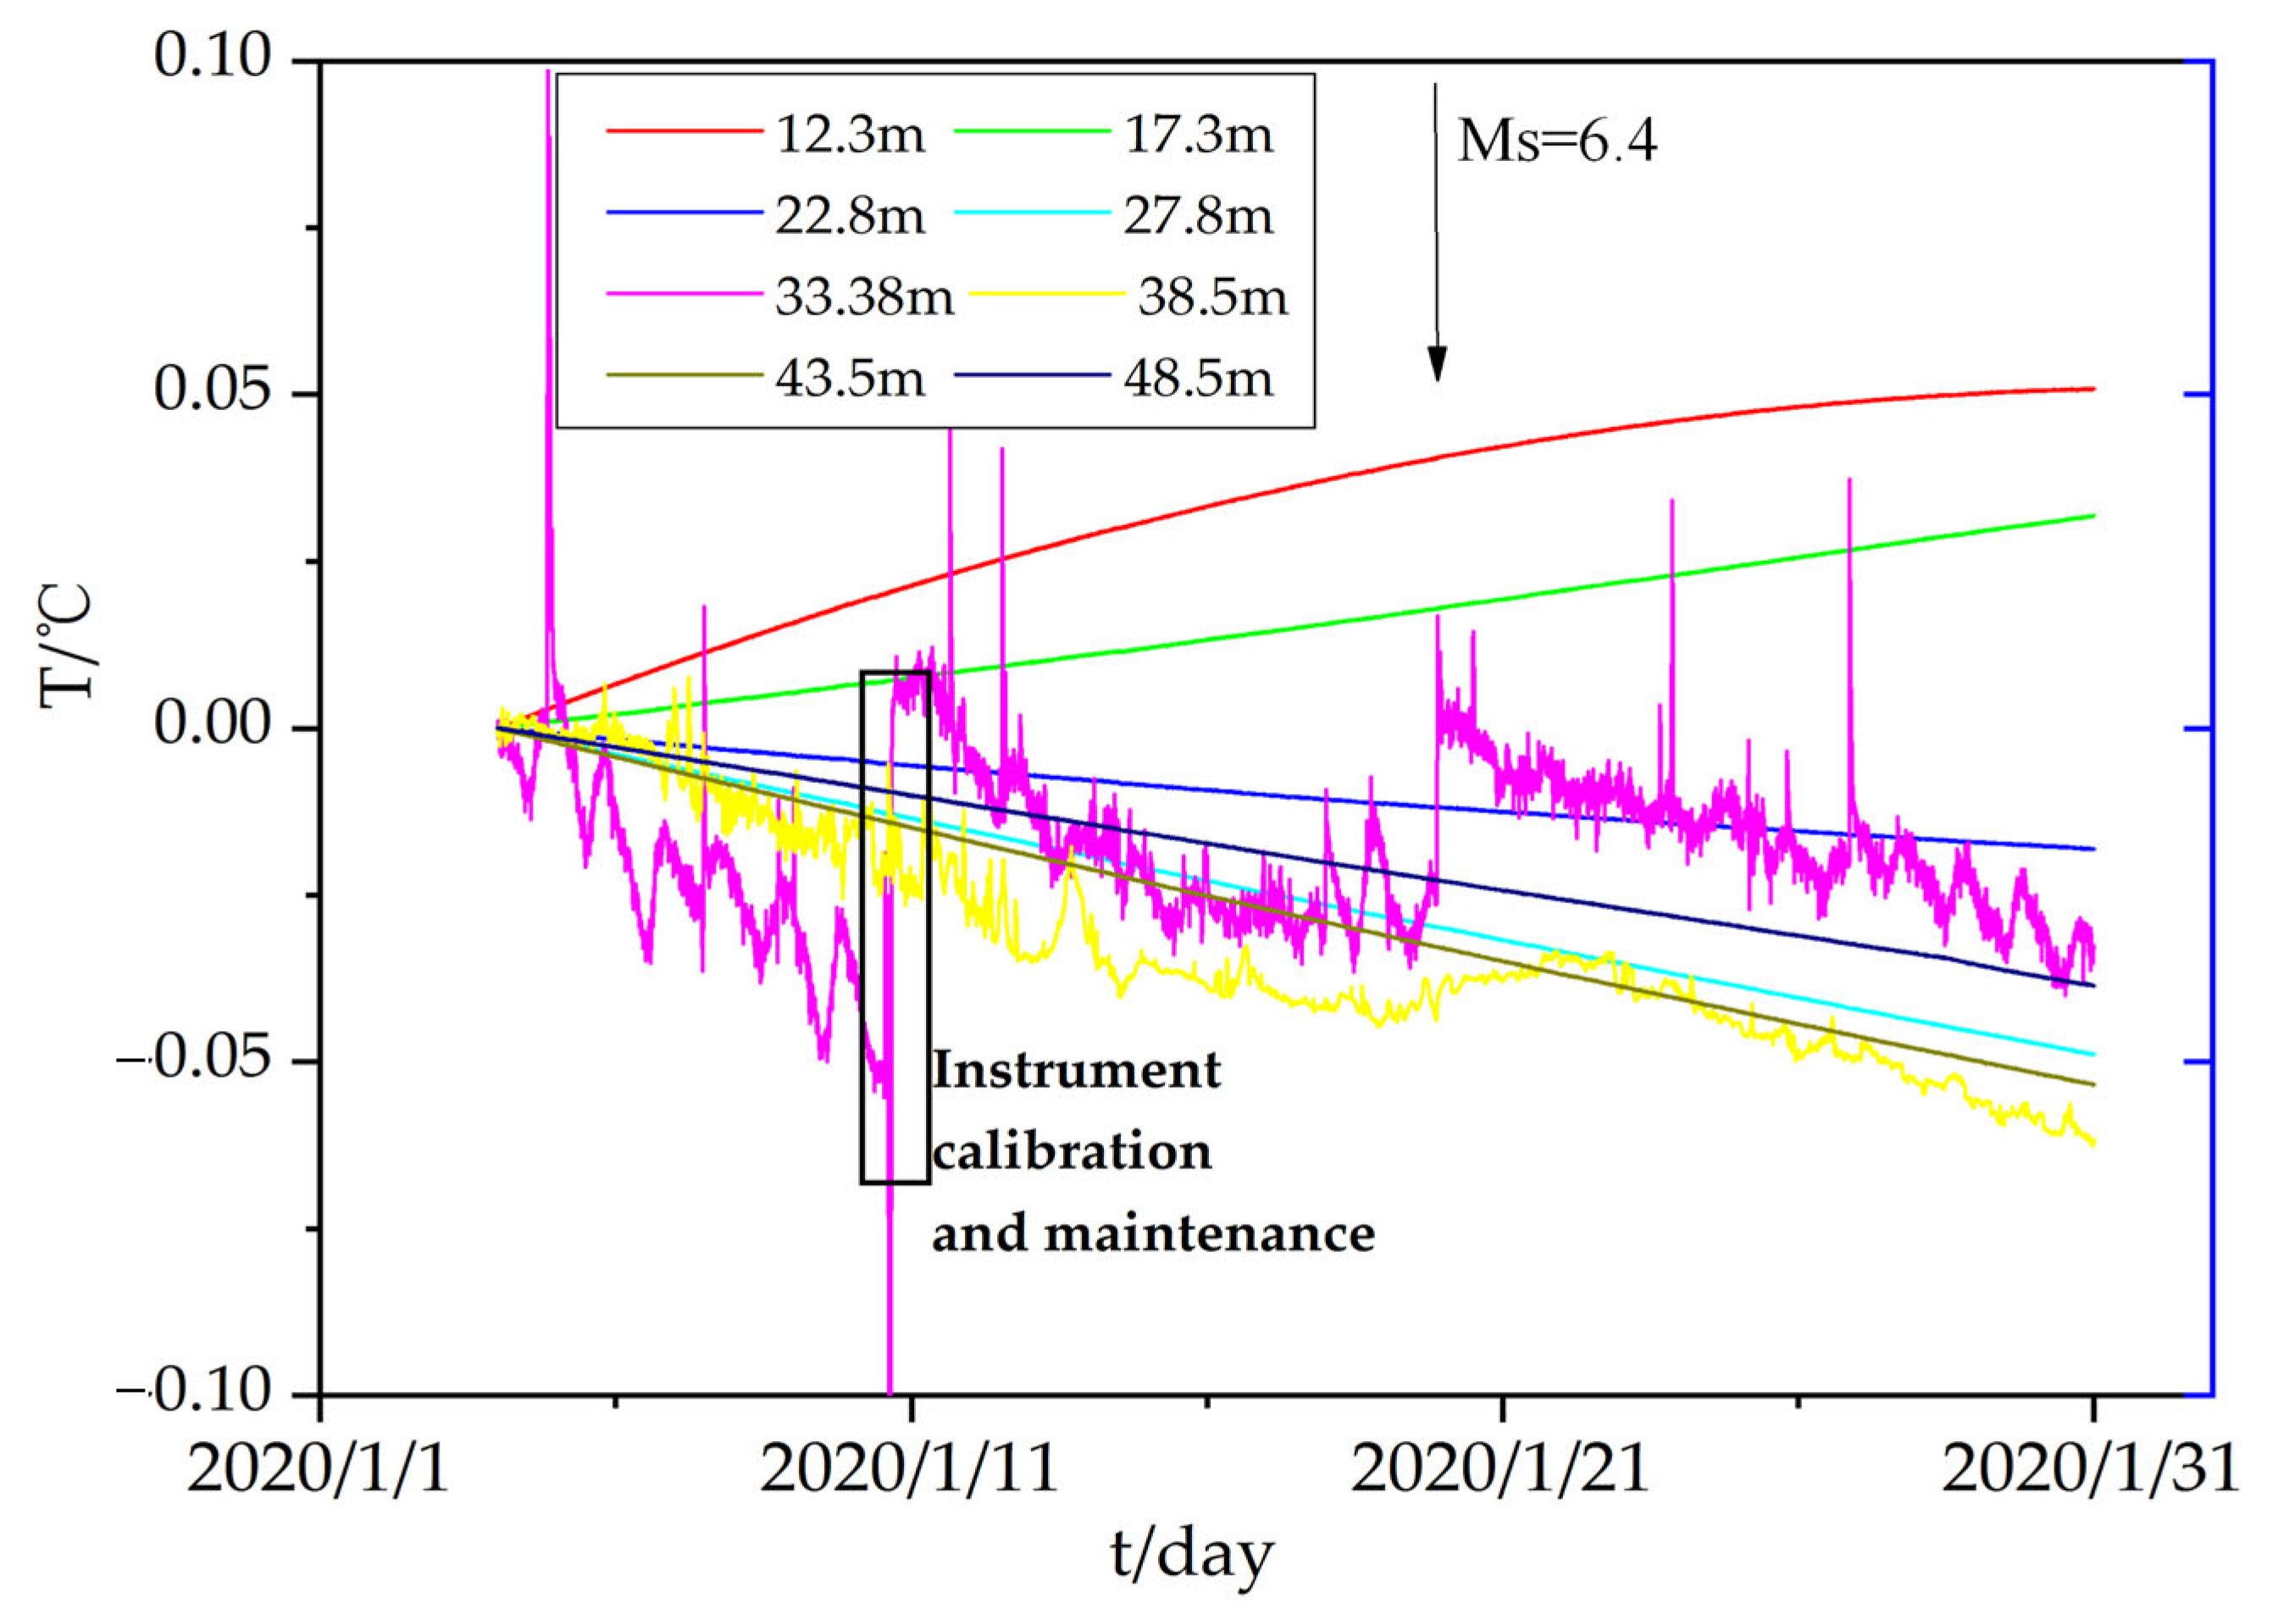
3.1. XKE Ground Temperature Observation Station

At the time of the earthquake, the coseismic temperature changes were detected at depths of 12.3, 22.8, and 33.38 m in this observation station (Figure 2). The initial value has been subtracted from the data. The ground temperature changes at 12.3 and 22.8 m were relatively stable, and the coseismic geothermal changes were relatively small, about ΔT = 0.0001 °C (Figure 3a,b). A significant coseismic change was observed at the 33.38 m layer (Figure 2), and the temperature step increased to ΔT = 0.0432 °C. It is worth noting that the ground temperature of this layer was observed to have obvious diurnal changes. Previous studies have found that when the layer contains fluid related to the change of surface temperature, the ground temperature of the layer will show diurnal change [29]. So fluid infiltration may cause the temperature changes. This layer showed a rapid temperature rise on 10 January 2020, with an amplitude of ΔT = 0.056 °C, which was the artificial noise.

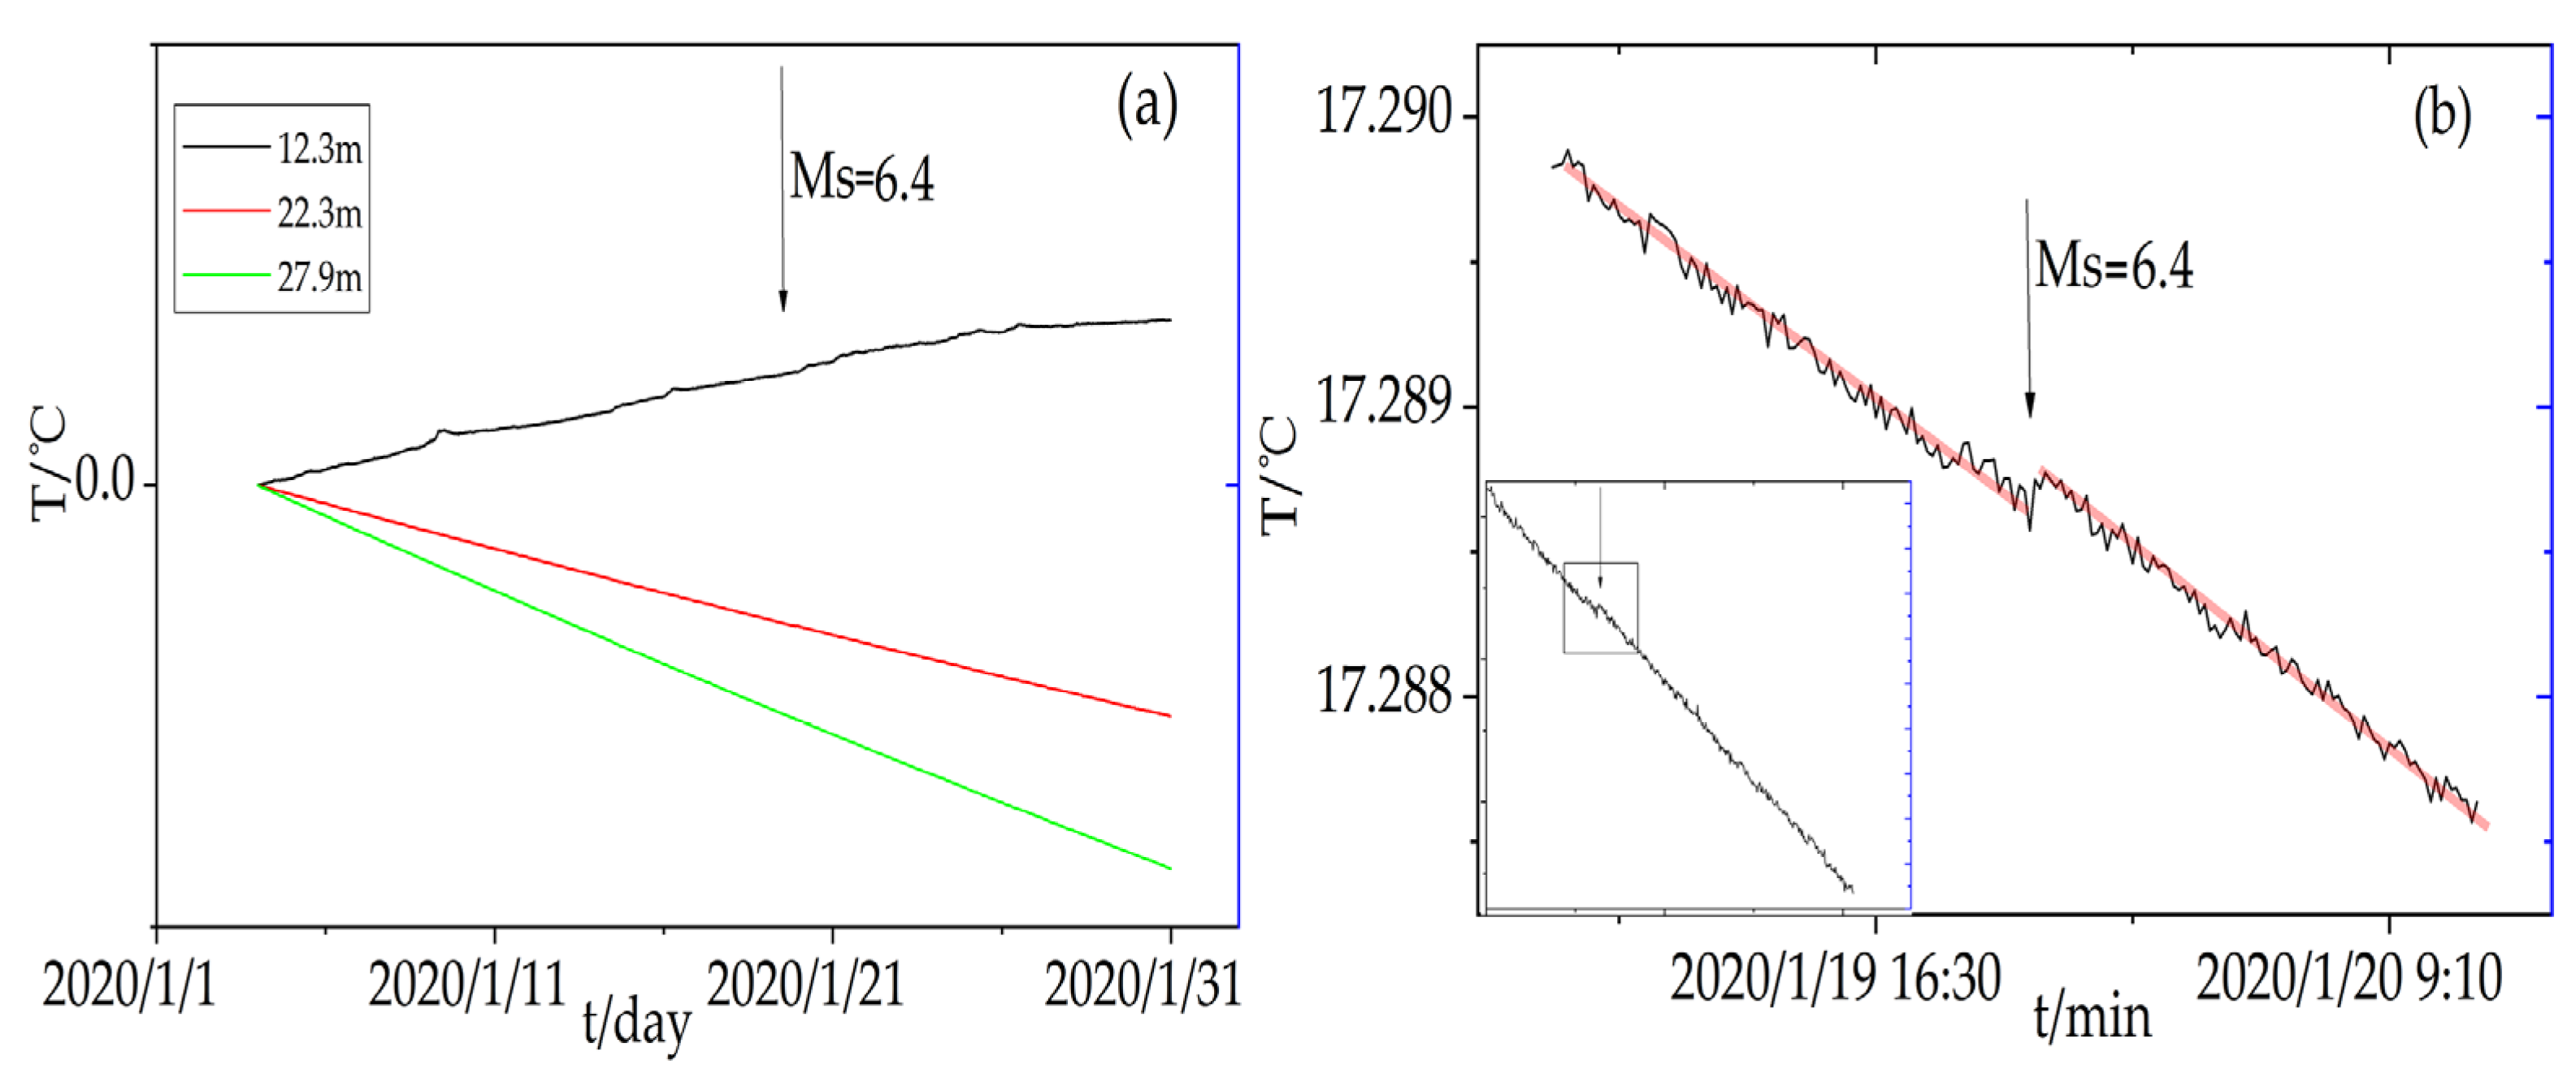
3.2. JSZC Ground Temperature Observation Station

The JSZC ground temperature observation station, which is 27.42 km from the epicenter, is located on the hanging wall of the Keping fault, at the junction of basins and mountains. The station has a depth of 50.6 m, and the lithology is dominated by interbedded siltstone and mudstone. There are 12 temperature sensors in different layers. However, due to sensor failure, there were only three continuous records, at 12.3, 22.3, and 27.9 m (Figure 4a). At the time of the earthquake, a coseismic geothermal change was observed at the 22.3 m layer (Figure 4b), which had a temperature change of ΔT = 0.0001 °C. The temperature change of the bedrock at this station may have been caused by the stress released by the earthquake rupture or an extension of heat conduction to the area. From the rock thermal stress load experiments, Liu et al. [23,24] found that the temperature of rock can be changed due to deformation. Due to the heterogeneity of rock, the stress of different layers varies. Some layers may be deformed, the others may be intact or only have minor deformation.

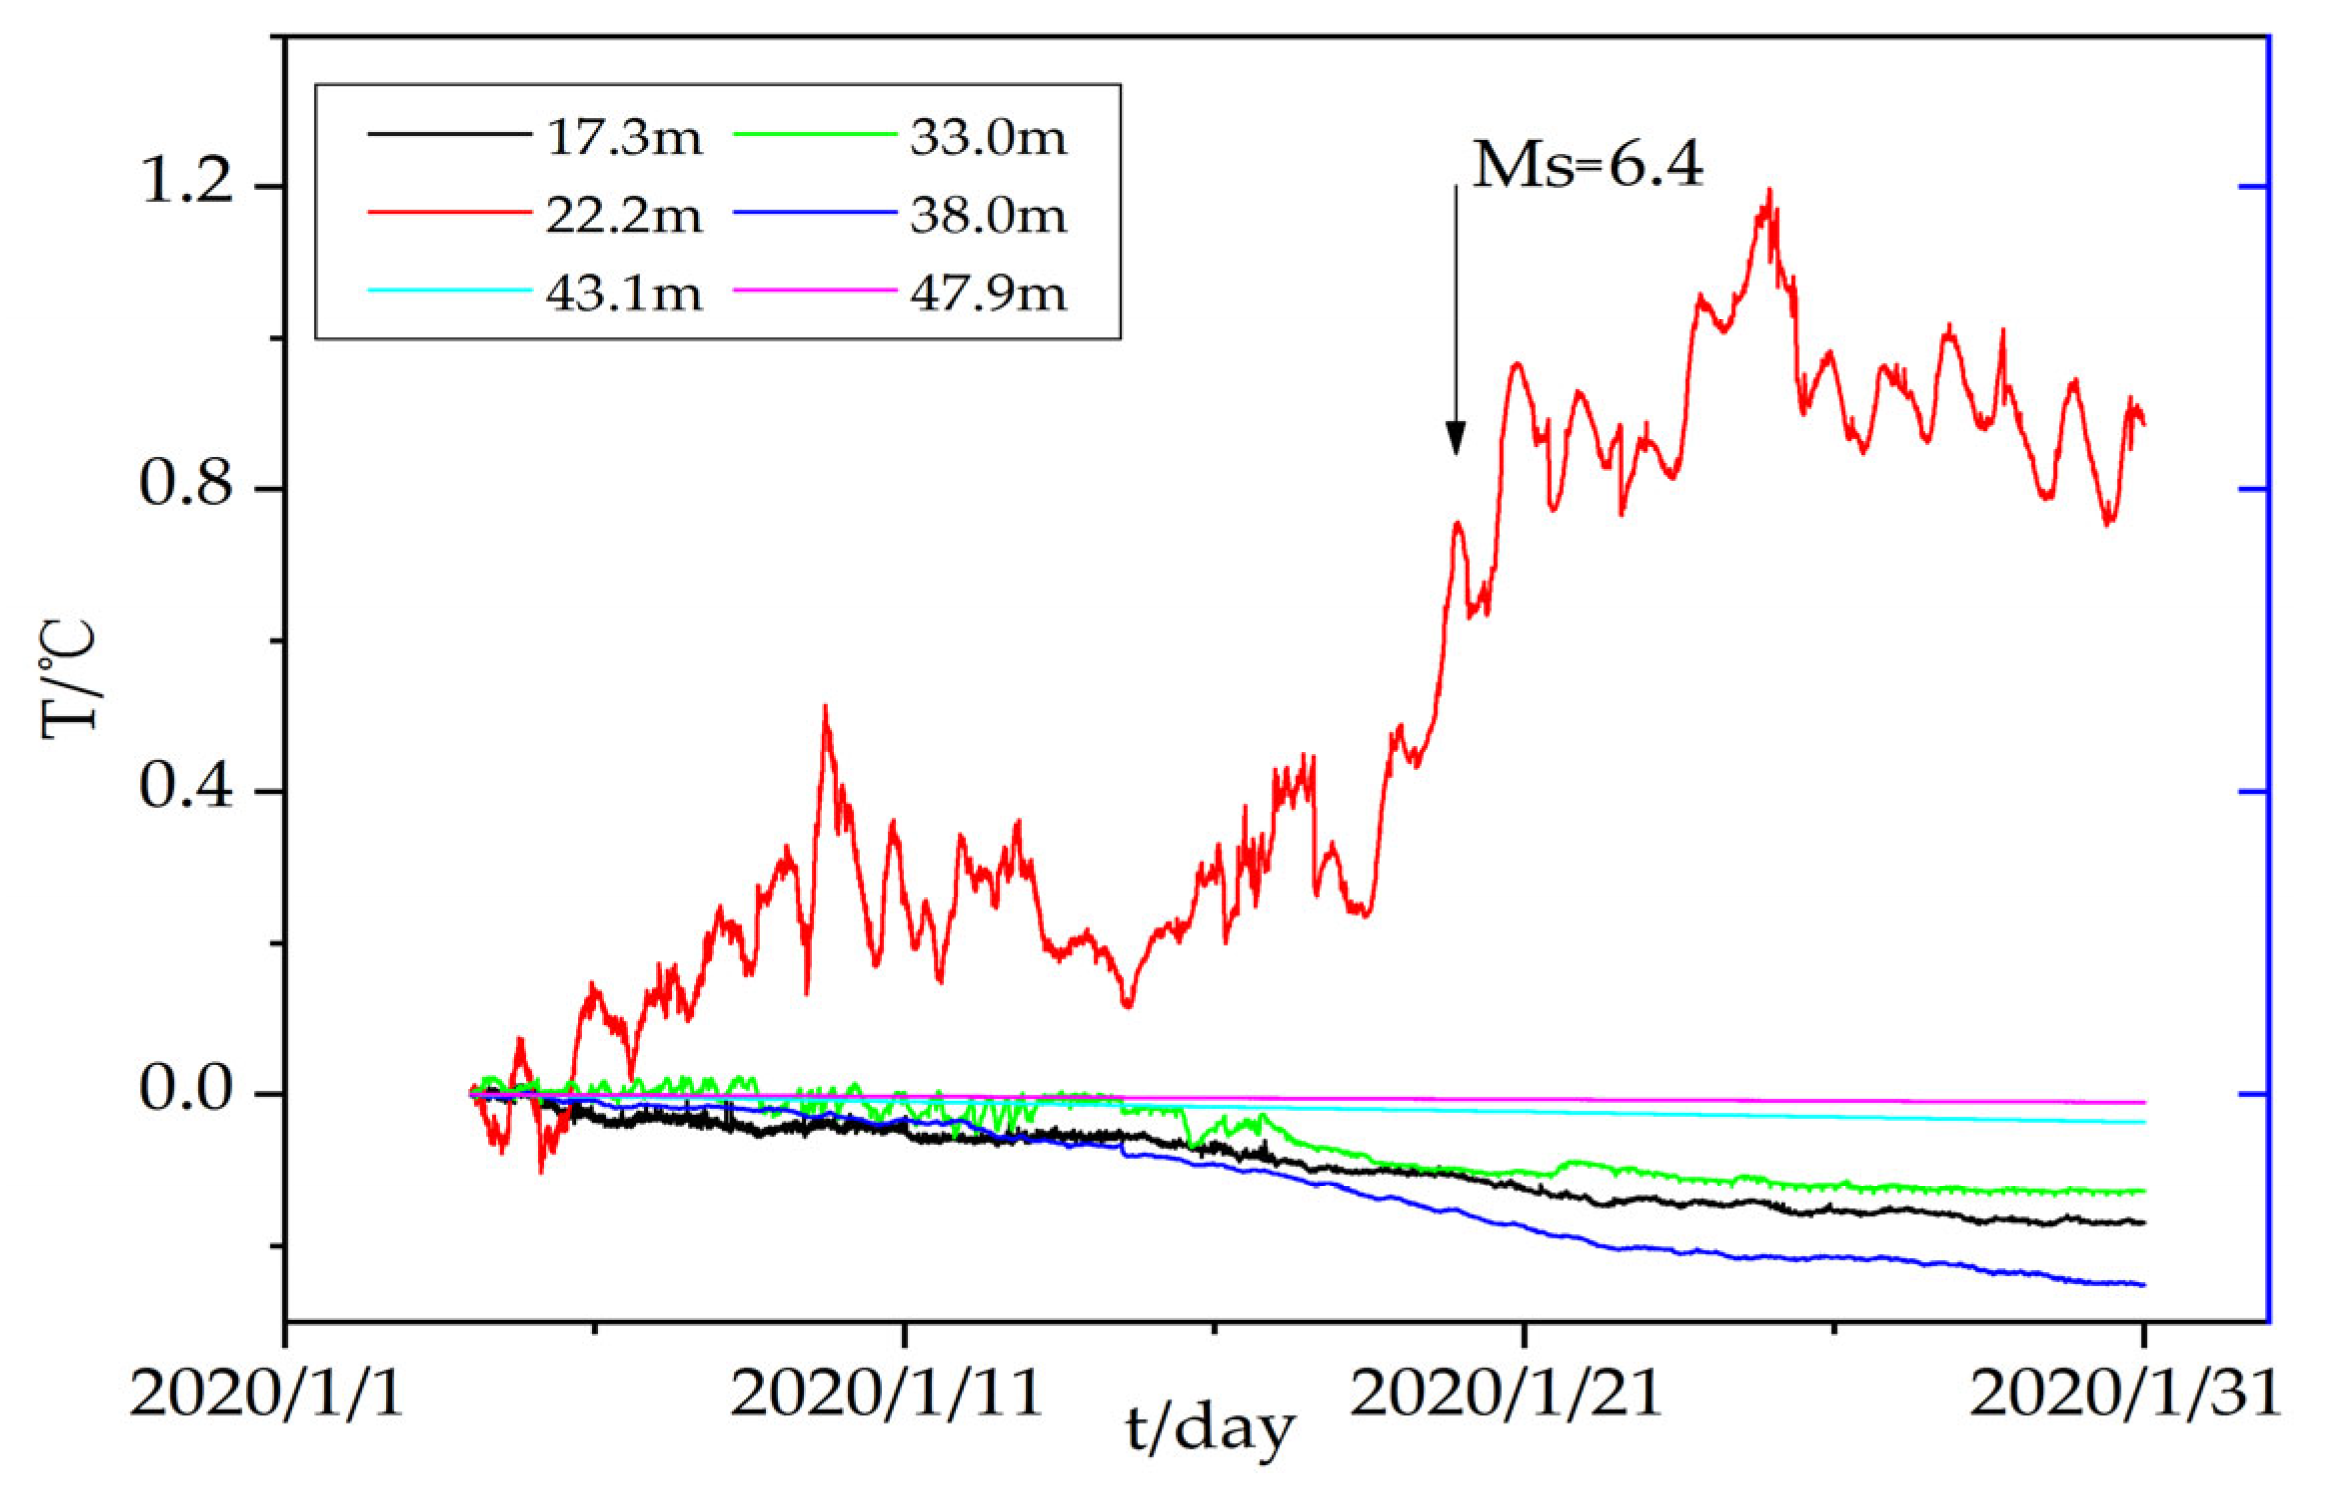
3.3. GDL Ground Temperature Observation Station

The ground temperature observation station GDL is 50 km from the epicenter, and the depth of the observation point is 50.6 m. Twelve temperature sensors are distributed within the range of 0–47.9 m. The record results showed no coseismic geothermal changes in all layers after the Jiashi Ms = 6.4 earthquake (Figure 5). This may be caused by the increased distance from the epicenter of the earthquake; meanwhile, the station is located in the shallow area of the coseismic coulomb stress field (Figure 6), calculated by using the software of the Coulomb stress 3.3 [29], https://pubs.usgs.gov/of/2011/1060/ (accessed on 3 January 2016). Detailed source models were from Yao et al. [30], with strike = 221, dip = 20, and slip = 72. Similar changes have been observed by Chen et al. [15] when they studied the coseismic response of rock temperature during the Kangding China Ms = 6.3 earthquake in 2014.
The temperature changes on 33 m are similar in amplitude similar to fluctuations before and after the earthquake. The only significant feature is the gradual increase of temperature a couple of days before the earthquakes. We also noted that clear diurnal variation can be observed in this layer. The lithology of this layer is dominated by sandstone. It is speculated that the change may be caused by fractures in the rock mass and fluid infiltration into the fissures [31,32]. Generally, the temperature of the rock in the deeper layer is not affected easily by a surface temperature change.

4. Analysis and Discussion

4.1. Heat Source Analysis

There are three possible mechanisms for the heat source of ground temperature changes. One is that the rock medium at the observation station generated heat due to seismic stress compression or stick–slip friction. Another is that the seismic fault ruptured and generated heat, causing the fault to release a large amount of heat instantaneously, leading to a rapid heating effect. The third is ascending flow of subsurface heat. When the rupture channel is opened, such heat flow will induce a warming. These three mechanisms have been illustrated by previous studies [13,14,15]. However, the reason for the change in bedrock temperature is very complex. It is difficult to estimate temperature changes by taking into account distance and depth of the earthquake if three mentioned mechanisms were involved. This paper focuses on the explanation derived from the magnitude of the observed coseismic variations at different stations during the 2020 Jiashi Ms = 6.4 earthquake.
When comparing the temperature records at 12.3 and 22.8 m at XKE and at 22.3 m at JSZC, it is obvious that the recorded data are stable and of high quality. The coseismic geothermal change of the Jiashi earthquake is obvious and has a consistent variation, about ΔT = 0.0001 °C for both stations. This synchronous temperature change is not likely to have been caused by the same heat source, such as the epicenter rupture or upwelling of heat source material, because the epicenter is not located in the middle area between the two ground temperature observation stations, but rather in a southwest direction from both XKE and JSZC. Therefore, it can be inferred that the coseismic stress transfer in the vicinity of the source area caused the ground temperature observation stations to heat due to stress compression. According to the study of Yang et al. [33], the magnitude relationship between stress change and temperature response is 0.0015 °C/MPa. From the coseismic temperature change of ΔT = 0.0001 °C, we obtain the coseismic stress change at these stations, which should be enhanced by 0.067 MPa (0.67 bar). This value correlates well with the coseismic Coulomb stress distribution of the Jiashi earthquake (Figure 6). Both XKE and JSZC stations were located in the increased Coulomb stress area with a stress increase of about 0.8 bar. However, the coseismic geothermal changes in only a few observation layers. This may be caused by the heterogeneity of the rock. The lithology of XKE 12.3 m and 22.8 m is red, fine sandstone, and the other layers are mudstone and core fractured sandstone. The layers above 18.5 m of JSZC are mudstone, and the layers below 18.5 m are the gray siltstone in which the core fissure is developed, and the bottom rock layer is vertical. Only a complete core can be seen near 22.3 m. The lithology and integrity of the core determine the effectiveness of stress transfer.
The coseismic geothermal change at the 33.38 m layer of XKE showed that a large amount of heat was released when the Jiashi Ms = 6.4 earthquake occurred, causing the temperature of the adjacent ground to rise (0.0432 °C). In combination with the observation of obvious diurnal variation in this layer, it can be further speculated that the large coseismic geothermal changes at XKE may have been caused by an increase in the surrounding water temperature. The thermal conductivity at this layer is more than 400 times that of the 12.3 and 22.8 m, which is determined by the porosity and permeability of the rock [15].
Although the 33.0 m layer of GDL 50 km from the epicenter also has recorded diurnal variation, no obvious similar coseismic geothermal change was recorded, indicating that the distance between the heat source and XKE was much smaller than the distance between the heat source and GDL, that is, the GDL was farther from the rupture point. It is easier to observe changes in ground temperature at a proximal location, so it can be inferred that the source of the heat was the seismic source area. The heat release may be attributable to earthquake fault rupture, frictional heating, or upwelling of hot subsurface material. Yao et al. [30] found that sand liquefaction occurred in the area southeast of the epicenter and that gray-brown muddy sandstone gushed from cracks in some roads. The XKE ground temperature observation station is located to the southeast of the epicenter. It is located between the epicenter and the XKE reservoir, indicating that there may have been an upwelling of underground fluids in this area.

4.2. Heat Transfer Analysis

There are eight temperature observation layers below 10 m at the XKE ground temperature observation station. The formations at 12.3 and 22.8 and from 34 to 50 m comprises sandstone, which is relatively fractured. Mudstone and conglomerates are also observed at several depths. The deeper observation data at 43.49 m and 48.55 m are stable, and the coseismic diurnal variation change of the Jiashi earthquake was not recorded. This indicates that the thermal conductivity of the sandstone was insufficient to transmit the heat generated during the earthquake rupture to the temperature sensor. However, the coseismic heating change recorded by the 33.38 m layer temperature sensor at XKE was two orders of magnitude larger than the coseismic response at 22.8 and 12.3 m. This difference is unlikely to be resulted from the depths of different layers. It is speculated that the fluid in the fractures played a major role in the coseismic heat transfer, which is also consistent with the experimental results of Guo et al. [34] showing that the thermal conductivity of sandstone increases with the increase of water content. The heat transfer efficiency of sandstone containing fluid is higher than that of ordinary sandstone. As shown in Figure 7, the temperature attenuation rates before (Figure 7a) and after (Figure 7b) the earthquake were not consistent. The post-earthquake temperature attenuation trend was linearly fitted to the pre-earthquake temperature attenuation trend. The attenuation curve before the earthquake is y = −3 × 10⁻⁵x + 17.042, and the attenuation curve after the earthquake is y = −2 × 10⁻⁵x + 17.033. A comparison of the slopes of the curves shows that the temperature attenuation rate before the earthquake was 1.5 times faster than the rate after the earthquake, which may be attributable to some factors slowing the temperature attenuation. The XKE ground temperature observation station is in the southern part of the epicentral rupture zone, which is the uplift area [27]. There may have been ascending subsurface heat flow associated with the surface deformation, which caused the temperature to rise. Replenishment of this heat flow would have slowed the temperature attenuation. From another perspective, the temperature increase caused by the upwelling of hot matter after the earthquake did not reach the magnitude of the Jiashi coseismic change. Therefore, the coseismic geothermal change of the Jiashi Ms = 6.4 earthquake may have been the result of the combination effect of earthquake rupture friction and subsurface upwelling.

5. Conclusions

By studying the coseismic temperature variation of the Jiashi Ms = 6.4 earthquake, three important conclusions were obtained: (1) Coseismic stress transfer can cause local bedrock compression and heating at the ground temperature observation station. (2) Jiashi Ms = 6.4 earthquake fault rupture and friction released a large amount of heat quickly, formed a thermal field, and caused a temperature surge. Due to the lower thermal conductivity of the sandstone with high porosity, the heat decayed quickly during the sandstone transfer process, but the fluid in cracks played a major role in assisting the transfer of heat. (3) The heat source of the Jiashi Ms = 6.4 earthquake should have been an upwelling of subsurface fluids, which could be approved by Xin et al. [22].
In general, the coseismic geothermal changes of the Jiashi Ms = 6.4 earthquake provide a case study revealing the frictional heating of earthquake rupture and seismic fluid migration. The study also provides practical experience illustrating the temperature efficiency of ground conduction. There are additional deep-seated problems associated with the relationships among ground temperature changes, stress changes, and earthquakes, which need to be explored further.

Author Contributions

Conceptualization, D.J. and H.Y.; methodology, Y.X.; software, B.Z.; validation, D.J.; formal analysis, B.Z.; investigation, H.Y.; resources, W.Y.; data curation, D.J.; writing—original draft preparation, B.Z.; writing—review and editing, D.J.; visualization, H.Y.; supervision, D.J. and Y.M.; project administration, H.Y.; funding acquisition. All authors have read and agreed to the published version of the manuscript.

Funding

This research was funded by the Earthquake Joint Funds of NSFC [grant number U2039205], the National Key R&D Program of China [grant number 2018YFE0109700], the Xinjiang Earthquake Science Foundation [grant number 202102], and the Earthquake Prediction Open Fund [grant number 2021EF0F08].

Institutional Review Board Statement

Not applicable.

Informed Consent Statement

Not applicable.

Data Availability Statement

All data used during the study are available from the corresponding author by request.

Acknowledgments

The data in this paper came from ground temperature observation stations constructed jointly by the Institute of Geology China Earthquake Administration and the Seismological Bureau of Xinjiang Uygur Autonomous Region. We thank researcher Chen Shunyun for his long-term help at the Xinjiang ground temperature observation station.

Conflicts of Interest

The authors declare no conflict of interest.

References

  1. Timofeev, V.; Kulinich, R.; Valitov, M.; Stus, Y.; Kalish, E.; Ducarme, B.; Gornov, P.; Ardyukov, D.; Sizikov, I.; Timofeev, A.; et al. Coseismic Effects of the 2011 Magnitude 9.0 Tohoku-Oki Earthquake Measured at Far East Russia Continental Coast by Gravity and GPS Methods. Int. J. Geosci. 2013, 2, 362–370. [Google Scholar] [CrossRef] [Green Version]
  2. Qu, C.Y.; Zhang, G.F.; Shan, X.J.; Zhang, G.H.; Liu, Y.H.; Song, X.G. 2010 Qinghai Yushu Earthquake Coseismic-Post-Earthquake Deformation Field Characteristics and Evolution Process. Chin. J. Geophys. 2013, 56, 2280–2291. (In Chinese) [Google Scholar]
  3. Zhu, C.L.; Gan, W.J.; Jia, Y.; Yin, H.T.; Xiao, G.R.; Li, J.; Liang, S.M.; Zhang, H.P. Research on the Coseismic Impact of the 2011 MW9.0 Earthquake in Japan on the Crustal Movement of the Yishu Fault Zone and Its Sides. Chin. J. Geophys. 2020, 63, 3698–3711. (In Chinese) [Google Scholar]
  4. Tang, J.; Zhan, Y.; Wang, L.F.; Dong, Z.Y.; Zhao, G.Z.; Xu, J.L. Electromagnetic Coseismic Effects of the Strong Aftershocks of the Wenchuan Earthquake. Chin. J. Geophys. 2010, 53, 526–534. (In Chinese) [Google Scholar]
  5. Che, Y.T.; Yu, J.Z.; Liu, C.L.; Wan, Y.F.; Luo, S.Q.; He, Y.Q.; Xiao, Z.D. Investigation and analysis of coseismic blowout phenomenon in Chagan well. Chin. J. Geophys. 2009, 31, 226–232. (In Chinese) [Google Scholar]
  6. Brodsky, E.E.; Roeloffs, E.; Woodcock, D.; Gall, I.; Manga, M. A mechanism for sustained groundwater pressure changes induced by distant earthquakes. J. Geophys. Res. 2003, 108, 2390. [Google Scholar] [CrossRef] [Green Version]
  7. Shi, Z.M.; Wang, G.C.; Liu, C.G. Inversion of Aquifer Volume Strain Based on the Coseismic Groundwater Level Change of the Wenchuan Earthquake. Acta Seismol. 2012, 34, 215–223. (In Chinese) [Google Scholar]
  8. Cheng, H.H.; Zhang, B.; Zhang, H.; Shi, Y.L. Calculation of the co-seismic deformation and stress changes of the Kaikoura MW7.8 earthquake, Nov 13, 2016. Chin. J. Geophys. 2017, 60, 2641–2651. (In Chinese) [Google Scholar]
  9. Montgomery, D.R.; Manga, M. Streamflow and water well response to earthquake. Science 2003, 300, 2047–2049. [Google Scholar] [CrossRef] [PubMed] [Green Version]
  10. Chen, S.Y.; Ma, J.; Liu, P.X.; Liu, L.Q.; Hu, X.Y. Using Terra and Aqua Satellite Surface Temperature to Explore the Coseismic Thermal Response of the Wenchuan Earthquake. Chin. J. Geophys. 2013, 56, 3788–3799. (In Chinese) [Google Scholar]
  11. Chen, S.Y.; Liu, P.X.; Chen, L.C.; Liu, Q.Y. Thermal Stress Measurement: Seismological Evidence. Chin. Sci. 2020, 65, 1–11. (In Chinese) [Google Scholar] [CrossRef] [Green Version]
  12. Chen, S.Y.; Song, C.Y.; Yan, W.; Liu, Q.Y.; Liu, P.X.; Zhuo, Y.Q.; Zhang, Z.H. Changes in Bedrock Temperature Before and After the Jiashi Ms6.4 Earthquake on 19 January 2020. Seismol. Geol. 2021, 43, 447–458. (In Chinese) [Google Scholar]
  13. Kaneki, S.; Hirono, T. Kinetic effect of heating rate on the thermal maturity of carbonaceous material as an indicator of frictional heat during earthquakes. Earth Planets Space 2018, 70, 92. [Google Scholar] [CrossRef] [Green Version]
  14. Li, C.; Sou, O.Y.; Tang, M. Ground temperature “currents” and earthquake prediction. Kybernetes 1998, 27, 773–787. [Google Scholar] [CrossRef]
  15. Chen, S.Y.; Liu, P.X.; Guo, Y.S.; Liu, L.Q.; Ma, J. Coseismic Response of Bedrock Temperature to the Ms6.3 Kangding Earthquake on 22 November 2014 in Sichuan, China. Pure Appl. Geophys. 2019, 176, 97–117. [Google Scholar] [CrossRef]
  16. Green, H.W. Phase-transformation-induced lubrication of earthquake sliding. Philos. Trans. R. Soc 2017, 375, 8. [Google Scholar] [CrossRef] [PubMed]
  17. Yao, L.; Ma, S.L. Experimental Simulation of Fault Co-Seismic Sliding-Significance, Methods and Research Progress of High-Speed Rock Friction Experiment. Prog. Geophys. 2013, 28, 607–623. (In Chinese) [Google Scholar]
  18. Gao, Y.Q.; Shi, B.P. Based on the Chester-Higgs Model, the Influence of Frictional Heat Generation on the Evolution of Faults Is Discussed. Acta Seism. 2019, 41, 13–32. (In Chinese) [Google Scholar]
  19. Hedeki, S.; Hidefumi, W. Coseismic changes in groundwater temperature of the Usu volcanic region. Nature 1981, 291, 137–138. [Google Scholar]
  20. Sun, X.L.; Liu, Y.W. Changes in groundwater level and temperature induced by distant earthquakes. Geosciences 2012, 16, 327–337. [Google Scholar] [CrossRef]
  21. Wang, J. Three-Level Structural Model and Earthquake Precursor Monitoring in the Middle Section of the North–South Seismic Belt. Ph.D. Dissertation, China University of Geosciences, Beijing, China, 2014. (In Chinese). [Google Scholar]
  22. Xin, B.H. The Sudden Rise in Ground Temperature Before the Tangshan M7.8 Earthquake in July 1976. North China Earthq. Sci. 2008, 26, 47–51. (In Chinese) [Google Scholar]
  23. Liu, P.X.; Liu, L.Q.; Chen, S.Y.; Chen, G.Q.; Ma, J. Experimental Study on Thermal Infrared Radiation Caused by Surface Rock Deformation. Seismol. Geol. 2004, 26, 502–511. (In Chinese) [Google Scholar]
  24. Liu, P.X.; Ma, J.; Liu, L.Q.; Ma, S.L.; Chen, G.Q. Experimental Study on the Evolution of Thermal Field in the Process of Compressive Geese Structural Deformation. Prog. Nat. Sci. 2007, 17, 454–459. (In Chinese) [Google Scholar]
  25. Chen, S.Y.; Liu, L.Q.; Liu, P.X.; Ma, J.; Chen, G.Q. Theoretical and Experimental Studies on the Relationship between Stress–Strain and Temperature Response. Chin. Sci. 2009, 39, 1446–1455. (In Chinese) [Google Scholar]
  26. Ran, H.M.; Shangguan, W.M.; Liu, D.Y. Research on the Positioning of the Ms6.4 Earthquake and Aftershock Sequence in Jiashi, Xinjiang on 19 January 2020. Inland Earthq. 2020, 34, 56–62. (In Chinese) [Google Scholar]
  27. Wen, S.Y.; Li, C.L.; Li, J. On 19 January 2020, Xinjiang Jiashi Ms6.4 Earthquake, InSAR coseismic deformation field characteristics and preliminary discussion of seismogenic structure. Inland Earthq. 2020, 34, 1–9. (In Chinese) [Google Scholar]
  28. Li, C.L.; Zhang, G.H.; Shan, X.J.; Qu, C.Y.; Gong, W.Y.; Jia, R.; Zhao, D.Z. InSAR coseismic deformation field and fault slip distribution inversion of the Ms6.4 earthquake in Jiashi County, Xinjiang on 19 January 2020. Prog. Geophys. 2020, 36, 481–488. (In Chinese) [Google Scholar]
  29. Stein, R.S.; King, G.C.P.; Lin, J. Change in failure stress on the southern San Andreas fault system caused by the 1992 magnitude = 7.4 Landers earthquake. Science 1992, 258, 1328–1333. [Google Scholar] [CrossRef]
  30. Yao, Y.; Li, T.; Liu, Q.; Di, N. Characteristics of Geological Hazards in the Epicenter of the Jiashi Mw6.0 Earthquake on 19 January 2020. Seismol. Geol. 2021, 43, 410–429. (In Chinese) [Google Scholar]
  31. Chen, S.Y.; Liu, P.X.; Liu, L.Q.; Ma, J. The Phenomenon of Kangding Ground Temperature Change Before Lushan Earthquake. Seismol. Geol. 2013, 35, 634–640. (In Chinese) [Google Scholar]
  32. Chen, C.; Zhu, C.Q.; Zhang, B.S.; Tang, B.N.; Li, K.Y.; Li, W.Z.; Fu, X.D. Effect of Temperature on the Thermal Conductivity of Rocks and Its Implication for In Situ Correction. Geofluids 2021, 2021, 1–12. [Google Scholar] [CrossRef]
  33. Yang, X.Q.; Lin, W.R.; Tadai, O.; Zeng, X.; Yu, C.H.; Ye, E.C.; Li, H.B.; Wang, H. Experimental and numerical investigation of the temperature response to stress changes of rocks. J. Geophys. Res. Solid Earth 2017, 122, 5101–5117. [Google Scholar] [CrossRef] [Green Version]
  34. Guo, P.Y.; Bai, B.H.; Chen, S.; Shi, C.X.; Du, H.Y. Experimental Study on the Influence of Temperature and Water Content on the Thermal Conductivity of Sandstone. Chin. J. Rock Mech. Eng. 2017, 36, 3910–3914. (In Chinese) [Google Scholar]
Figure 1. General situation of Jiashi Ms = 6.4 aftershock sequence area and distribution of ground temperature observation stations. KPF: Keping fault.
Atmosphere 13 00154 g001
Figure 2. Time series of ground temperature in each layer of the XKE ground temperature observation station.
Atmosphere 13 00154 g002
Figure 3. Geothermal time series of 12.3 m (a) and 22.8 m (b) layers at XKE.
Atmosphere 13 00154 g003
Figure 4. (a) Ground temperature changes in different layers at the JSZC ground temperature observation station. (b) Time series of ground temperature in the 22.3 m layer of JSZC.
Atmosphere 13 00154 g004
Figure 5. Geothermal time series of ground temperature in different layers at the GDL observation station.
Atmosphere 13 00154 g005
Figure 6. The coseismic Coulomb stress field of the Ms = 6.4 Jiashi earthquake by using the Coulomb 3.3. The software was downloaded from https://pubs.usgs.gov/of/2011/1060/ (accessed on 3 January 2016).
Atmosphere 13 00154 g006
Figure 7. Comparison of the coseismic phenomenon of ground temperature at the 33.38 m layer at XKE and comparison of the temperature attenuation curve before (a) and after (b) the earthquake.
Atmosphere 13 00154 g007
Publisher’s Note: MDPI stays neutral with regard to jurisdictional claims in published maps and institutional affiliations.

