
Impact Analysis of Variable Resolution of MPAS on Intrinsic Predictability Using Bred Vectors

1
Korea Institute of Science and Technology Information, Daejeon 34141, Republic of Korea
2
Korea Research Institute of Standard and Science, Daejeon 34113, Republic of Korea
*
Author to whom correspondence should be addressed.
Atmosphere 2022, 13(12), 2070; https://doi.org/10.3390/atmos13122070
Submission received: 15 November 2022
/
Revised: 2 December 2022
/
Accepted: 7 December 2022
/
Published: 9 December 2022
(This article belongs to the Special Issue High-Resolution Weather and Climate Modeling with Industrial Applications)
Abstract
:Variable resolution configuration is a defining feature of the NCAR MPAS (Model for Prediction Across Scales) model, which allows us to smoothly vary the horizontal resolution for taking a closer look at an area of interest. In this study, we aimed to analyze the impact of variable resolution on intrinsic predictability using bred vectors. Thus, the breeding cycles of the MPAS model with and without variable resolution configuration were implemented and tested with two different rescaling intervals of 6 h and 1 day. Rescaling within our breeding cycles were centered by the nature run, thus we could deal with the intrinsic predictability limited only by the initial error growth. We confirmed reasonable estimates of fast-growing errors by bred vectors at two different scales of convective and synoptic systems. We then found that the variable resolution configuration gave consistent improvement of intrinsic predictability not only over the high-resolution area but also outside. A quantitative analysis showed that an improvement with the variable resolution could be found in general for most vertical levels for both rescaling interval experiments. Additionally, we present the computational cost and experience of performing the variable resolution model which would help users in their decisions on this setting.
1. Introduction
When developing a numerical modeling system of a dynamic nature to predict and analyze phenomena of interest, estimating the predictability of the selected numerical models is valuable because there is no perfect model in reality. This helps to quantify how errors grow in time and space with the model and understand imperfect results from a simulation of the model. In other words, we must understand how the model tends to behave under a circumstance with various error sources before analyzing its simulation results. Since Lorenz [1,2,3] introduced the concept of chaotic nature and the predictability limits of nature, many researchers (e.g., [4,5,6,7,8,9]) examined the predictability of the phenomena of interest using an ensemble forecast system and/or identical twin experiments. When exploring the predictability of the numerical weather prediction models, the predictability was analyzed separately in two concepts (e.g., [3,10,11]): intrinsic predictability and practical predictability. Intrinsic predictability is obtained by excluding systematic model errors but tiny initial condition errors. On the other hand, practical predictability is obtained by experiments including the initial condition error as well as model deficiencies. Understanding both types of predictability help users correctly analyze the results from numerical model simulations.
Ensemble forecasting is a straightforward system that provides good information regarding the predictability of the model, because the spread of the ensemble forecast can be interpreted as model uncertainties (e.g., [12,13,14,15]). Agreement of the ensemble forecast members indicates confidence of the model forecast while divergence indicates uncertainty. If we can control the true state with the nature run in the experimental setting, we can exactly quantify the intrinsic predictability with ensemble forecasting. For an experiment with such ideal environments, we can generate the true states of the nature run using the same model that is used for the forecast; thus, only initial condition errors are included in the forecasting experiments. In the meantime, we can estimate practical predictability with more realistic forecast configurations, which includes not only the initial condition error but also imperfection of the model such as a lack of resolution, deficiency of parameterizations, etc.
Furthermore, when knowledge of the error growth dynamics of the numerical model is needed, the breeding method [16,17] could be a good approach with an ensemble forecasting system. This method has been widely used by many operational centers and research groups to initialize an ensemble forecast, which generates effective initial ensembles that well represents flow-dependent fast-growing errors. It is also known that the bred vectors are comparable with the forecast and analysis errors [18]. Thus, bred vectors can be a reasonable index to address the predictability of the model. Depending on rescaling intervals and amplitudes, breeding can also isolate the slow modes of a system [16,19,20,21,22]. Therefore, we can explore error growth dynamics of specific phenomena of interest selectively in terms of temporal and spatial scales with proper rescaling intervals and amplitudes.
We are interested in the model for prediction across scales (MPAS [23]) which has been developed by the National Center for Atmospheric Research (NCAR) in the US. This model is a candidate for the forecast system of marine weather prediction that our research grant has pursued, and is a newly developed numerical atmospheric model that broke away from the traditional rectangular latitude-longitude grid. Indeed, a defining feature of MPAS is a variable resolution configuration that allows for a smooth varying resolution in the horizontal plane as shown in Figure 1. Indeed, Kang et al. [24] tested this model with the variable resolution configuration that played a role of the atmospheric forcing for the prediction system of coastal flooding and concluded that the atmospheric forcing from MPAS worked well with the prediction of significant wave height over the coastal area of a typhoon on the Korean peninsula.
Here, we examine if an improvement of the model predictability is obtained and how much we could benefit from the variable resolution setting compared to the quasi-uniform horizontal resolution setting. Judt (2018) explored MPAS predictability regarding convection-permitting scales with identical twin experiments of 4-km horizontal resolution and confirmed the finite limit of predictability that was introduced by Lorenz [3,10]. However, there is no direct comparison of the predictability between quasi-uniform resolution and variable resolution. We believe that the variable resolution looks good and advanced; however, would like to know just how much an improvement this configuration provides. Therefore, we have implemented MPAS breeding cycles with and without a variable resolution configuration separately, and then compared the bred vectors from each model configuration for both a rescaling period of 6 h and 1 day. In this study, we explore intrinsic predictability in a way to rescale bred vectors of an ensemble forecast centered by the nature run that we assume to be the true states. Details of methodology and experimental design are described in Section 2 and the results are analyzed in Section 3. We then summarize and discuss our findings in Section 4.
2. Methodology and Experimental Design
2.1. MPAS Model
MPAS is a global nonhydrostatic numerical weather prediction model with C-grid Voronoi discretization (Skamarock et al., 2012 [23]). One of its fascinating features is the horizontal grid structure of unstructured centroidal Voronoi meshes using selective grid refinement. Those meshes are mostly hexagons, but some are pentagons and seven-sided cells. There are quasi-uniform mesh datasets from 480 km resolution to 3 km resolution and variable resolution mesh datasets (92–25 km, 46–12 km, 60–15 km, 60–10 km, 60–3 km, 15–3 km with various shapes of refinement) that can be downloaded from the MPAS github site (https://mpas-dev.github.io/atmosphere/atmosphere_meshes.html accessed on 8 March 2020). For this study, we chose 60–15 km elliptical refinement variable resolution meshes that include 535,554 cells in the horizontal direction and used it after rotating the refinement area to East Asia and the Western Pacific Ocean as shown in Figure 1.
To analyze the impact of the variable resolution model on the predictability, we also conducted experiments with 60 km quasi-uniform resolution meshes that include 163,842 cells in the horizontal direction. From now, the 60–15 km variable resolution experiments will be referred to as Vres, while the quasi-uniform 60 km resolution experiments will be referred to as Ures. Figure 1a show the horizontal meshes on a globe that was used for the Vres experiments in this study. Figure 1b,c shows how the meshes and results looked different over the mesh transient area between Vres and Ures. Both Vres and Ures had the same vertical configuration of 80 levels with a 50 km top of the atmosphere, and the same physics package called the “mesoscale_reference” of which Table 1 provides the details of its physics schemes. Since we desire a good forecasting system for marine weather, we focus on relevant variables such as surface latent heat fluxes and surface wind than on upper atmospheric variables.
Considering the number of horizontal meshes, we can theoretically estimate how much computational cost would be required by the variable resolution compared with the quasi-uniform meshes. For this study, we directly measure the actual computing time for the experiments and present the results in Section 3. Our experiments were examined on the KISTI supercomputer NURION that ranked 42nd in the world as of June 2022 (Top500.org). Here, we used an Intel Xeon Phi processors (Knight Landing, KNL) with a clock speed of 1.4 GHz; relatively lower than other processors. However, 68 CPU cores were soldered onto each KNL node. Although imperfect computing resources were used for our applications, the comparison of computing time data is still useful information for users who might consider the variable resolution configuration of the global numerical weather prediction model.
2.2. Breeding Cycles
Since we aim to explore the intrinsic predictability of MPAS with different horizontal resolution configurations, there were two different nature runs that were prepared for the breeding cycles of Vres and Ures. We made two independent integrations starting from NCEP GFS FNL 0.25-degree data valid at 00UTC on 30 July 2020, for a month; one with the Vres horizontal resolution configuration and the other with the Ures horizontal resolution configuration. These nature runs are used for the rescaling of breeding cycles, described in detail below. We then perturbed the variable of potential temperature for the very initial ensembles. Initial perturbations were generated by the following process; (1) we randomly chose 20 restart files at 20 different time steps within the period of each of the two nature runs, (2) subtracted the 6 h-prior state of potential temperature from each state of potential temperature in the chosen files at step (1), and then (3) multiplied those perturbations by 0.01, which is about a typical scale of a multiplier when the ensemble perturbations for additive inflation are generated in an ensemble data assimilation system [25,26,27]. The initial conditions were generated for both Ures and Vres experiments, while the experiments with different rescaling intervals used the same initial conditions.
From these initial conditions, we developed an ensemble forecast system for two different lead times of 6 h and 1 day to isolate errors of weather phenomena with different scales. As previous studies by Peña and Kalnay [20] and Yang et al. [21] reported, we may find different scales of dominant error growth from the results with different rescaling intervals. Thus, we conducted four experiments with different horizontal resolution configurations and different rescaling intervals as shown in Table 2. There were other experiments to test different sizes of perturbations in a way to multiply the perturbation by 0.001, one order smaller than the experiments of Table 2, at the third step of the initial perturbation generation processes described in the previous paragraph. However, the difference that was induced by those two scaling factors does not look as significant as the sensitivity to the horizontal meshes and to the rescaling intervals; therefore, we did not include the results from this set of tests in this paper.
After ensemble forecasting for the corresponding rescaling interval period, the ensemble perturbations were rescaled with the temperature-squared norm scaled by area and weighted equally in the vertical by the model level, , as in Greybush et al., (2013). [7] However, the conversion between the temperature and the potential temperature of MPAS prognostic variable is needed. Thus, we perturbed the temperature, converted it to potential temperature, and then overwrote the potential temperature onto the restart file. Subsequently, other variables such as pressure and Exner function are updated in the model initialization procedure within MPAS, for the balance of initial states. We computed the amplitude of bred vectors separately for each hemisphere (Northern Hemisphere over 20° N latitude and Southern Hemisphere below 20° S latitude) and used it for rescaling, because a growth rate from each hemisphere could be different due to different season, land-sea distribution, and so on. Then, the rescaling factors were computed and applied respectively by the different growth rate from each hemisphere as in Greybush et al. [7]. A rescaling factor between 20° S and 20° N latitude was linearly interpolated for the continuity in space.
We explored and compared fast-growing errors that were computed by our breeding cycle systems with various experimental settings, after a 5-day spin-up period. We confirmed that the growth rate of the bred vectors, where nΔt indicates the rescaling interval in time and indicates the norm of rescaling which is the temperature-squared norm scaled by area and weighted equally in the vertical dimension by the model level, became stable after about five-day cycles (not shown). Thus, the results of the instantaneous fields valid at 00UTC on 10 August 2020 and the averaged fields for the last six time-steps up to the same time step for the instantaneous fields are shown in the next section.
3. Results
3.1. Forecast Uncertainty Estimated by the Breeding Cycles
We first evaluated our breeding cycle systems to examine whether a spread of the ensemble forecast within the breeding cycle well represented forecast uncertainty. Figure 2 and Figure 3 show the instantaneous fields of surface latent heat flux from Ures and Vres, respectively. Here, we computed the difference between the mean of the ensemble forecast starting from the rescaled bred vectors at the previous cycles and the nature (Figure 2b,c and Figure 3b,c), which gave the actual error of the ensemble forecast. Then, we compared those differences with the spread of ensemble forecasting to see whether bred vectors worked well for good ensemble forecasting. We needed to confirm if spreads of the ensemble forecast starting from the bred vectors captured actual dominant errors well or not. Here, the spread was defined as a standard deviation of 20 ensemble forecasts. We analyzed the major variables of the model and only show some of them here because the results were consistent across variables.
As described in the previous section, both experiments had their own nature; therefore, we could clearly find a different distribution and magnitude of latent heat flux in the nature between Ures (Figure 2a) and Vres (Figure 3a). For Ures, we found the maximum value of latent heat flux with significant variability over the Indian Ocean in the nature. Thus, the bred vectors (BVs) represented forecast uncertainty around that region especially in the experiment with a 6-hr rescaling interval. In addition, the spread of BVs in Figure 2d,e well represented significant forecast errors (Figure 2b,c) that were dependent on the flow of the nature over the tropics and midlatitude. Conversely, there was not any maximum value over the Indian Ocean in the nature of Vres (Figure 3a). Thus, less forecast uncertainty (Figure 3b,c) and little spread (Figure 3d,e) was found over the Indian Ocean (Figure 3b,c). However, the spread of BVs represented the dominant forecast errors mainly over the tropics for both a forecast lead time of 6 h and 1 day. Overall, the forecast uncertainty estimated by the spread and the actual forecast error from Vres with both 6-hr and 1-day forecast lead time looked reasonable and flow-dependent. Note that these forecast errors could be interpreted as the intrinsic predictability that is induced only by the initial errors because we let the bred vector rescale centered by the nature run. Consistent analysis also resulted in Figure 4 and Figure 5 for surface zonal wind and specific humidity at the model level near the 850 hPa, respectively. Based on the results from the comparison between the intrinsic predictability and spread, we clearly see that our breeding cycle system worked reasonably well for representing the uncertainty of predictability.
3.2. Sensitivity to Breeding Intervals
From Figure 2 and Figure 3, we can see that the most outstanding contrast was in the difference in results for different rescaling scales. The BVs from the 6-h rescaling interval (Figure 2b,d and Figure 3b,d) highlighted forecast uncertainty that is dependent on the convective scales over the tropics while the BVs from the 1-day rescaling interval (Figure 2c,e and Figure 3c,e) highlighted forecast uncertainty depending on the synoptic scales over midlatitudes. Therefore, we confirm that the longer rescaling interval saturated the small-scale error growth, thus allowing the temporally longer and spatially bigger scales to be isolated. Even though we did not adjust the size of initial perturbations, we could obtain those obvious effects in the scales of dominant errors. This tendency is consistently found in other variables.
In addition to the latent heat flux variable, we also analyzed the surface zonal wind and the mid-level specific humidity near 850 hPa (Figure 4 and Figure 5, respectively). Here, we expect that a comparison between Ures_6hr and Ures_1dy and that between Vres_6hr and Vres_1dy will reveal what scales of predictability information we can catch. Surface zonal wind had greater error growth over the midlatitude in the experiments with a 1-day rescaling interval in terms of the magnitude, while it had smaller error growth over the tropics in the experiments with a 6-h rescaling interval (Figure 4). In contrast, the pattern of significance in terms of BV amplitude looked different with the variable of specific humidity. Since specific humidity is a sensitive variable to the microphysical processes which are tightly coupled with convection processes, BVs of specific humidity adequately represented great forecast uncertainty at convective scales over the tropics. Thus, fast-growing errors of the specific humidity were pronounced over the tropics in the experiments with 6-h rescaling interval. Conversely, the forecast with a 1-day lead time shows reduced errors over the tropics but mild-magnitude errors with synoptic scales over the midlatitude (Figure 5). These findings from variable resolution simulations could be expected, but first presented and analyzed using BVs in the comparison with uniform resolution simulations. A close examination of these errors enables us to make new discoveries for future work.
3.3. Sensitivity to Horizontal Resolutions
Comparisons between Figure 2 and Figure 3, and Figure 4 and Figure 5 also show how different the intrinsic predictability of Vres is from that of Ures. In general, we confirm that the magnitude of dominant intrinsic forecast uncertainty in Vres was smaller to that from Ures. For the variable of latent heat flux, it is clearly shown that the errors from both rescaling intervals were relatively small in Vres compared to Ures (Figure 2 and Figure 3). Vres showed more structured flow-dependent errors while Ures showed more noisy and blurred patterns of errors. When we compared Figure 4a to Figure 4c and Figure 4b to Figure 4d, respectively, we can see less forecast uncertainty not only over the high-resolution area of East Asia and the western Pacific Ocean but also over the midlatitude and polar regions. This feature can also be found in Figure 5 regarding the variable of specific humidity near 850 hPa. An improvement of the predictability may transfer well globally through model integration.
In addition to analyzing the instantaneous fields of the ensemble forecasting starting from bred vectors, we examined their time-averaged fields for the variable of mid-level specific humidity and surface zonal/meridional wind (Figure 6, Figure 7 and Figure 8). Since bred vectors captured the flow-dependent and fast-growing errors, both Ures and Vres showed forecast uncertainty where the convective instability and/or midlatitude synoptic instability occurred. However, Vres tended to reduce noisy pattern of errors overall. The errors from Vres_6hr seemed to be especially suppressed around mesh transient regions such as Iran, Kazakhstan, California, and Northern Australia (Figure 1a). This is an interesting occurrence that we consistently found in the results from the three different variables of Figure 6, Figure 7 and Figure 8. The fact that intrinsic predictability looked encouraging over those mesh transient regions may be another interesting topic to explore when investigating practical predictability in future studies.
For a quantitative analysis, we horizontally averaged the forecast errors weighted by the mesh area and then drew their vertical profiles (Figure 9 and Figure 10). These errors were quantified by an RMS error and a bias between the ensemble mean of the forecast starting from bred vectors and the nature, as follows:
where Atot is the total area of global meshes, ncells is the number of total horizontal meshes, is the nature state at the n-th cell, is the ensemble mean of the forecast starting from the bred vectors, and is the area of the n-th cell. We computed these RMSE and BIAS for the variables of zonal/meridional wind, potential temperature, and specific humidity up to the model level near 100 hPa. Table 3 shows the global average of RMSE for those four variables. As a result, we gained a quantitative understanding of how much predictability improvement we achieved using the Vres configuration in contrast to the Ures configuration.
For the 6-h forecast (Figure 9), low-level RMSE of four variables were certainly smaller in Vres than Ures although the upper level errors became comparable to one another. Since we did not include systematic model errors in our experimental design, BIAS did not look significant in general. However, there were small BIAS from upper level wind, negative BIAS from lower level specific humidity, and positive BIAS from mid-level specific humidity. BIAS of specific humidity with a 6-h forecast lead time looked quite serious although wind BIAS was insignificant. These BIAS values of specific humidity were found in both Ures and Vres, which seemed to be caused by microphysics interacting with initial errors. For the 1-day forecast (Figure 10), the improvement that was obtained by Vres looked pronounced for all four variables at all vertical levels. With this forecast lead time, there was no significant BIAS. Thus, the BIAS of specific humidity found in experiments with a 6-h rescaling interval was likely to be related to the convective system. Indeed, Figure 5 and Figure 6 show strong negative errors over the tropics.
We also computed the horizonal average of RMSE and BIAS of surface two-dimensional variables that are essential for marine weather prediction (Figure 11). Every variable of the surface wind, mean sea-level pressure, surface heat/moisture flux, and latent heat flux showed a lower magnitude of errors in Vres than in Ures for both the 6-h and 1-day forecast lead time. There were some variations among the variables, but we could see that the improvement of Vres tended to be greater with the 1-day rescaling interval than with the 6-h rescaling interval. Some variables such as the mean sea-level pressure, surface fluxes of upward heat, upward moisture, and latent heat showed a minor improvement of Vres with a 6-h short-term forecast while surface wind variables showed significant improvement of Vres for both 6-h and 1-day rescaling intervals. As far as we could verify, none of the variables at the surface gave worse results for Vres than Ures.
Lastly, Table 4 shows that the variable resolution that we tested required about 3.2 times more computational cost when concerning only time integration. The use of variable resolution also required almost double the initialization time, mostly for reading input data. The longer the experiment time, the more often the system will encounter unstable situations such as system failure or load problems. Here, we also computed the standard deviation meaning the computing time deviation of each experiment from the computing time average. The larger the standard deviation, the greater the difference in the integration execution time. Except for Vres_1dy, the computing time for time integration has a 2% maximum of standard deviation. However, Vres_1dy, the most expensive experiment in terms of computational cost, showed approximately a 16% standard deviation for the time integration steps. Besides, initialization, mostly reading initial data, also resulted in more than a 10% standard deviation, indicating that the amount of time it took fluctuated. Kang et al. [24] has already mentioned the issue of communication among input/output cores within NURION. Considering the improvement in terms of forecast accuracy that users can expect with variable resolution, they must understand the amount of computational cost it will take. Of course, it is still fascinating to examine the area of interest selectively, and because there is no need to globally set a high resolution, may be efficient. Indeed, quasi-uniform 15 km resolution with 2,621,442 horizontal meshes would require about 16 times more computational cost only for time integration, with many unstable computational situations.
4. Summary and Discussion
In this study, we investigated whether there is an actual benefit from variable resolution configuration with MPAS and explored how the improvement or degradation would look. To examine the impact of variable resolution on the model predictability, we implemented a breeding cycle of ensemble forecast which allowed us to obtain fast growing errors of the model. In this study, we decided to estimate the intrinsic predictability first, excluding systematic errors of the model, to see how the initial errors grow differently with variable resolution of MPAS compared with a quasi-uniform resolution. Therefore, we ran two independent experiments with different configurations of horizontal meshes: one with quasi-uniform 60 km meshes and the other with a variable resolution of 60–15 km meshes. Then, the rescaling of bred vectors was centered by the nature run that we defined as the true state in the experiments.
We examined the validity of our breeding experiments by comparing BVs spread with the forecast errors for two different scales with different rescaling intervals of 6 h and 1 day. The spreads of BVs accurately matched with the actual forecast errors, which indicates the perturbations well represented the dominant errors without a collapse of the ensembles. For the experiments with a 6-h rescaling interval, we could confirm the errors that were highly related to convective scale instability over the tropics. Variables that were relevant to the convective system also gave strong signals over the tropics in the experiments with 6-h rescaling interval. Conversely, the experiments with a 1-day rescaling interval showed meso-scale and synoptic scale instability over midlatitude and polar regions. These experimental results may be considered as very reasonable information of forecast uncertainty.
Next, the impact of a variable resolution configuration on the intrinsic predictability of MPAS was evaluated by comparing the variable resolution experiments with the quasi-uniform resolution experiments. From the global distribution maps of forecast errors, we found out that the variable resolution experiments resulted in smaller uncertainties not only over the high-resolution refinement areas but also outside. For major three-dimensional variables and two-dimensional surface variables, the quantitative analysis revealed that the improvement stood out even more in the experiment with 1-day rescaling intervals.
We also presented the required amount of computational cost that is needed by Vres compared to Ures. The Vres experiment needed about 3.2 times more computational time only for time integration, as well as more disk space (as much as the computation increments). In practice, the longer the experiment time, the more often the system would encounter unstable situations. Therefore, the computational cost may not be ideally proportional to the number of meshes that are actually encountered, even in our experiments.
In this study, we developed a system of breeding cycles with MPAS under two different mesh configurations and two different rescaling intervals to test its reasonable performance under a perfect model scenario. The bred vector that we have obtained here showed the sensitivity of MPAS uncertainty only to the initial error because we focused on the intrinsic predictability and rescaled bred vectors centered by the nature run of the same model environment at every cycle. From these experiments, we could explicitly estimate the impact of variable resolution configuration on the intrinsic predictability of MPAS. Our future studies will start by replacing the nature run by the operational reanalysis data such as ERA5 or NCEP GDAS FNL data to analyze the practical predictability of MPAS with variable resolutions including systematic model errors.
Author Contributions
Conceptualization, J.-S.K. and S.S.; methodology, J.-S.K.; software, J.-S.K. and H.M.; validation, J.-S.K. and S.S.; formal analysis, J.-S.K.; investigation, J.-S.K. and S.S.; resources, J.-S.K. and H.M.; data curation, J.-S.K. and S.S.; writing—original draft preparation, J.-S.K.; writing—review and editing, S.S. and J.-S.K.; visualization, J.-S.K.; supervision, J.-S.K.; project administration, J.-S.K.; funding acquisition, J.-S.K. All authors have read and agreed to the published version of the manuscript.
Funding
Korea Institute of Marine Science & Technology Promotion(KIMST) funded by the Ministry of Oceans and Fisheries, Korea (20180447, Improvements of ocean prediction accuracy using numerical modeling and artificial intelligence technology): 20180447.
Institutional Review Board Statement
Not applicable.
Informed Consent Statement
Not applicable.
Data Availability Statement
Not applicable.
Acknowledgments
This research was supported by Korea Institute of Marine Science & Technology Promotion (KIMST) and funded by the Ministry of Oceans and Fisheries, Korea (20180447, Improvements of ocean prediction accuracy using numerical modeling and artificial intelligence technology). Moreover, we would like to thank to the Korea Institute of Science and Technology Information and Institute for Basic Science for their support of High-Performance Computing resources. We would also like to express our sincere gratitude to the two excellent reviewers.
Conflicts of Interest
The authors declare no conflict of interest.
References
- Lorenz, E.N. Deterministic nonperiodic flow. J. Atmos. Sci. 1963, 20, 130–141. [Google Scholar] [CrossRef]
- Lorenz, E.N. Atmospheric predictability as revealed by naturally occurring analogues. J. Atmos. Sci. 1969, 26, 636–646. [Google Scholar] [CrossRef]
- Lorenz, E.N. Atmospheric predictability experiments with a large numerical model. Tellus 1982, 34, 505–513. [Google Scholar] [CrossRef]
- Mapes, B.; Tulich, S.; Nasuno, T.; Satoh, M. Predictability aspects of global aqua-planet simulations with explicit convection. J. Meteorol. Soc. Jpn. Ser. II 2008, 86, 175–185. [Google Scholar] [CrossRef] [Green Version]
- Sippel, J.A.; Zhang, F. A probabilistic analysis of the dynamics and predictability of tropical cyclogenesis. J. Atmos. Sci. 2008, 65, 3440–3459. [Google Scholar] [CrossRef] [Green Version]
- Melhauser, C.; Zhang, F. Practical and intrinsic predictability of severe and convective weather at the mesoscales. J. Atmos. Sci. 2012, 69, 3350–3371. [Google Scholar] [CrossRef]
- Greybush, S.J.; Kalnay, E.; Hoffman, M.J.; Wilson, R.J. Identifying Martian atmospheric instabilities and their physical origins using bred vectors. Q. J. R. Meteorol. Soc. 2013, 139, 639–653. [Google Scholar] [CrossRef]
- Judt, F. Insights into atmospheric predictability through global convection-permitting model simulations. J. Atmos. Sci. 2018, 75, 1477–1497. [Google Scholar] [CrossRef]
- Markowski, P.M. What is the intrinsic predictability of tornadic supercell thunderstorms? Mon. Weather Rev. 2020, 148, 3157–3180. [Google Scholar] [CrossRef]
- Lorenz, E.N. Predictability: A problem partly solved. In Proceeding Seminar on Predictability; 1996; Volume 1. Available online: https://eapsweb.mit.edu/sites/default/files/Predicability_a_Problem_2006.pdf (accessed on 4 January 2022).
- Sun, Y.Q.; Zhang, F. Intrinsic versus practical limits of atmospheric predictability and the significance of the butterfly effect. J. Atmos. Sci. 2016, 73, 1419–1438. [Google Scholar] [CrossRef]
- Kalnay, E. Atmospheric Modeling, Data Assimilation and Predictability; Cambridge University Press: Cambridge, UK, 2003. [Google Scholar]
- Zhang, F. Dynamics and structure of mesoscale error covariance of a winter cyclone estimated through short-range ensemble forecasts. Mon. Weather Rev. 2005, 133, 2876–2893. [Google Scholar] [CrossRef] [Green Version]
- Doblas-Reyes, F.J.; Weisheimer, A.; Déqué, M.; Keenlyside, N.; McVean, M.; Murphy, J.M.; Rogel, P.; Smith, D.; Palmer, T.N. Addressing model uncertainty in seasonal and annual dynamical ensemble forecasts. Quarterly Journal of the Royal Meteorological Society: A journal of the atmospheric sciences. Appl. Meteorol. Phys. Oceanogr. 2009, 135, 1538–1559. [Google Scholar]
- Baumgart, M.; Riemer, M. Processes governing the amplification of ensemble spread in a medium-range forecast with large forecast uncertainty. Q. J. R. Meteorol. Soc. 2019, 145, 3252–3270. [Google Scholar] [CrossRef]
- Toth, Z.; Kalnay, E. Ensemble forecasting at NMC: The generation of perturbations. Bull. Am. Meteorol. Soc. 1993, 74, 2317–2330. [Google Scholar] [CrossRef]
- Toth, Z.; Kalnay, E. Ensemble forecasting at NCEP and the breeding method. Mon. Weather Rev. 1997, 125, 3297–3319. [Google Scholar] [CrossRef]
- Corazza, M.; Kalnay, E.; Patil, D.J.; Yang, S.C.; Morss, R.; Cai, M.; Szunyogh, I.; Hunt, B.R.; Yorke, J.A. Use of the breeding technique to estimate the structure of the analysis “errors of the day”. Nonlinear Process. Geophys. 2003, 10, 233–243. [Google Scholar] [CrossRef] [Green Version]
- Cai, M. Formation of the cold tongue and ENSO in the equatorial Pacific basin. J. Clim. 2003, 16, 144–155. [Google Scholar] [CrossRef]
- Peña, M.; Kalnay, E. Separating fast and slow modes in coupled chaotic systems. Nonlinear Process. Geophys. 2004, 11, 319–327. [Google Scholar] [CrossRef]
- Yang, S.C.; Kalnay, E.; Cai, M.; Rienecker, M.; Yuan, G.; Toth, Z. ENSO bred vectors in coupled ocean–atmosphere general circulation models. J. Clim. 2006, 19, 1422–1436. [Google Scholar] [CrossRef]
- Yang, S.C.; Keppenne, C.; Rienecker, M.; Kalnay, E. Application of coupled bred vectors to seasonal-to-interannual forecasting and ocean data assimilation. J. Clim. 2009, 22, 2850–2870. [Google Scholar] [CrossRef] [Green Version]
- Skamarock, W.C.; Klemp, J.B.; Duda, M.G.; Fowler, L.D.; Park, S.H.; Ringler, T.D. A multiscale nonhydrostatic atmospheric model using centroidal Voronoi tesselations and C-grid staggering. Mon. Weather Rev. 2012, 140, 3090–3105. [Google Scholar] [CrossRef]
- Kang, J.S.; Myung, H.; Yuk, J.H. Examination of computational performance and potential applications of a global numerical weather prediction model MPAS using KISTI Supercomputer NURION. J. Mar. Sci. Eng. 2021, 9, 1147. [Google Scholar] [CrossRef]
- Whitaker, J.S.; Hamill, T.M.; Wei, X.; Song, Y.; Toth, Z. Ensemble data assimilation with the NCEP global forecast system. Mon. Weather Rev. 2008, 136, 463–482. [Google Scholar] [CrossRef] [Green Version]
- Kang, J.S.; Kalnay, E.; Miyoshi, T.; Liu, J.; Fung, I. Estimation of surface carbon fluxes with an advanced data assimilation methodology. J. Geophys. Res. Atmos. 2012, 117. [Google Scholar] [CrossRef]
- Shin, S.; Kang, J.S.; Yang, S.C.; Kalnay, E. Ensemble singular vectors as additive inflation in the Local Ensemble Transform Kalman Filter (LETKF) framework with a global NWP model. Q. J. R. Meteorol. Soc. 2019, 145, 258–272. [Google Scholar] [CrossRef]
Figure 1.
(a) 60–15 km variable resolution meshes of MPAS on a globe and meshes over a transient area (marked by the red box in (a)) (b) with variable resolution and (c) without variable resolution (i.e., quasi-uniform resolution).
Figure 1.
(a) 60–15 km variable resolution meshes of MPAS on a globe and meshes over a transient area (marked by the red box in (a)) (b) with variable resolution and (c) without variable resolution (i.e., quasi-uniform resolution).

Figure 2.
Surface latent heat flux (W/m2) of (a) the nature run, (b) difference between the nature and the mean BVs with 6−h rescaling interval, (c) difference between the nature and the mean BVs with 1−day rescaling interval, (d) BVs spread with 6−h rescaling interval, and (e) BVs spread with 1−day rescaling interval from the experiments of Ures valid at 00UTC on 10 August 2020.

Figure 3.
The same as Figure 2, but from the Vres experiments.
Figure 3.
The same as Figure 2, but from the Vres experiments.

Figure 4.
Difference of the mean bred vectors from the nature (a–d) and the spread of bred vectors (e–h) of surface zonal wind from the experiments of Ures_6hr (a,e), Ures_1dy (b,f), Vres_6hr (c,g), and Vres_1dy (d,h), valid at 00UTC on 10 August 2020.
Figure 4.
Difference of the mean bred vectors from the nature (a–d) and the spread of bred vectors (e–h) of surface zonal wind from the experiments of Ures_6hr (a,e), Ures_1dy (b,f), Vres_6hr (c,g), and Vres_1dy (d,h), valid at 00UTC on 10 August 2020.

Figure 5.
The same as Figure 4 except for the variable of specific humidity at the model level near 850 hPa pressure level.
Figure 5.
The same as Figure 4 except for the variable of specific humidity at the model level near 850 hPa pressure level.

Figure 6.
Time−averaged difference of specific humidity (kg/kg) near the 850 hPa model level, between mean BVs and the nature, from (a) Ures_6hr, (b) Ures_1dy, (c) Vres_6hr, and (d) Vres_1dy.
Figure 6.
Time−averaged difference of specific humidity (kg/kg) near the 850 hPa model level, between mean BVs and the nature, from (a) Ures_6hr, (b) Ures_1dy, (c) Vres_6hr, and (d) Vres_1dy.

Figure 7.
Same as Figure 6 except for the variable of surface zonal wind (m/s).
Figure 7.
Same as Figure 6 except for the variable of surface zonal wind (m/s).

Figure 8.
The same as Figure 6 except for the variable of surface meridional wind (m/s).
Figure 8.
The same as Figure 6 except for the variable of surface meridional wind (m/s).

Figure 9.
Vertical profile of averaged RMS difference (solid lines) and bias (dashed lines) between the mean BV and the nature of (a) zonal wind, (b) meridional wind, (c) potential temperature, and (d) specific humidity. Here, red lines indicate results from Ures_6hr and blue lines indicate results from Vres_6hr.

Figure 10.
The same as Figure 9, except that red lines indicate results from Ures_1dy and blue lines indicate results from Vres_1dy.
Figure 10.
The same as Figure 9, except that red lines indicate results from Ures_1dy and blue lines indicate results from Vres_1dy.
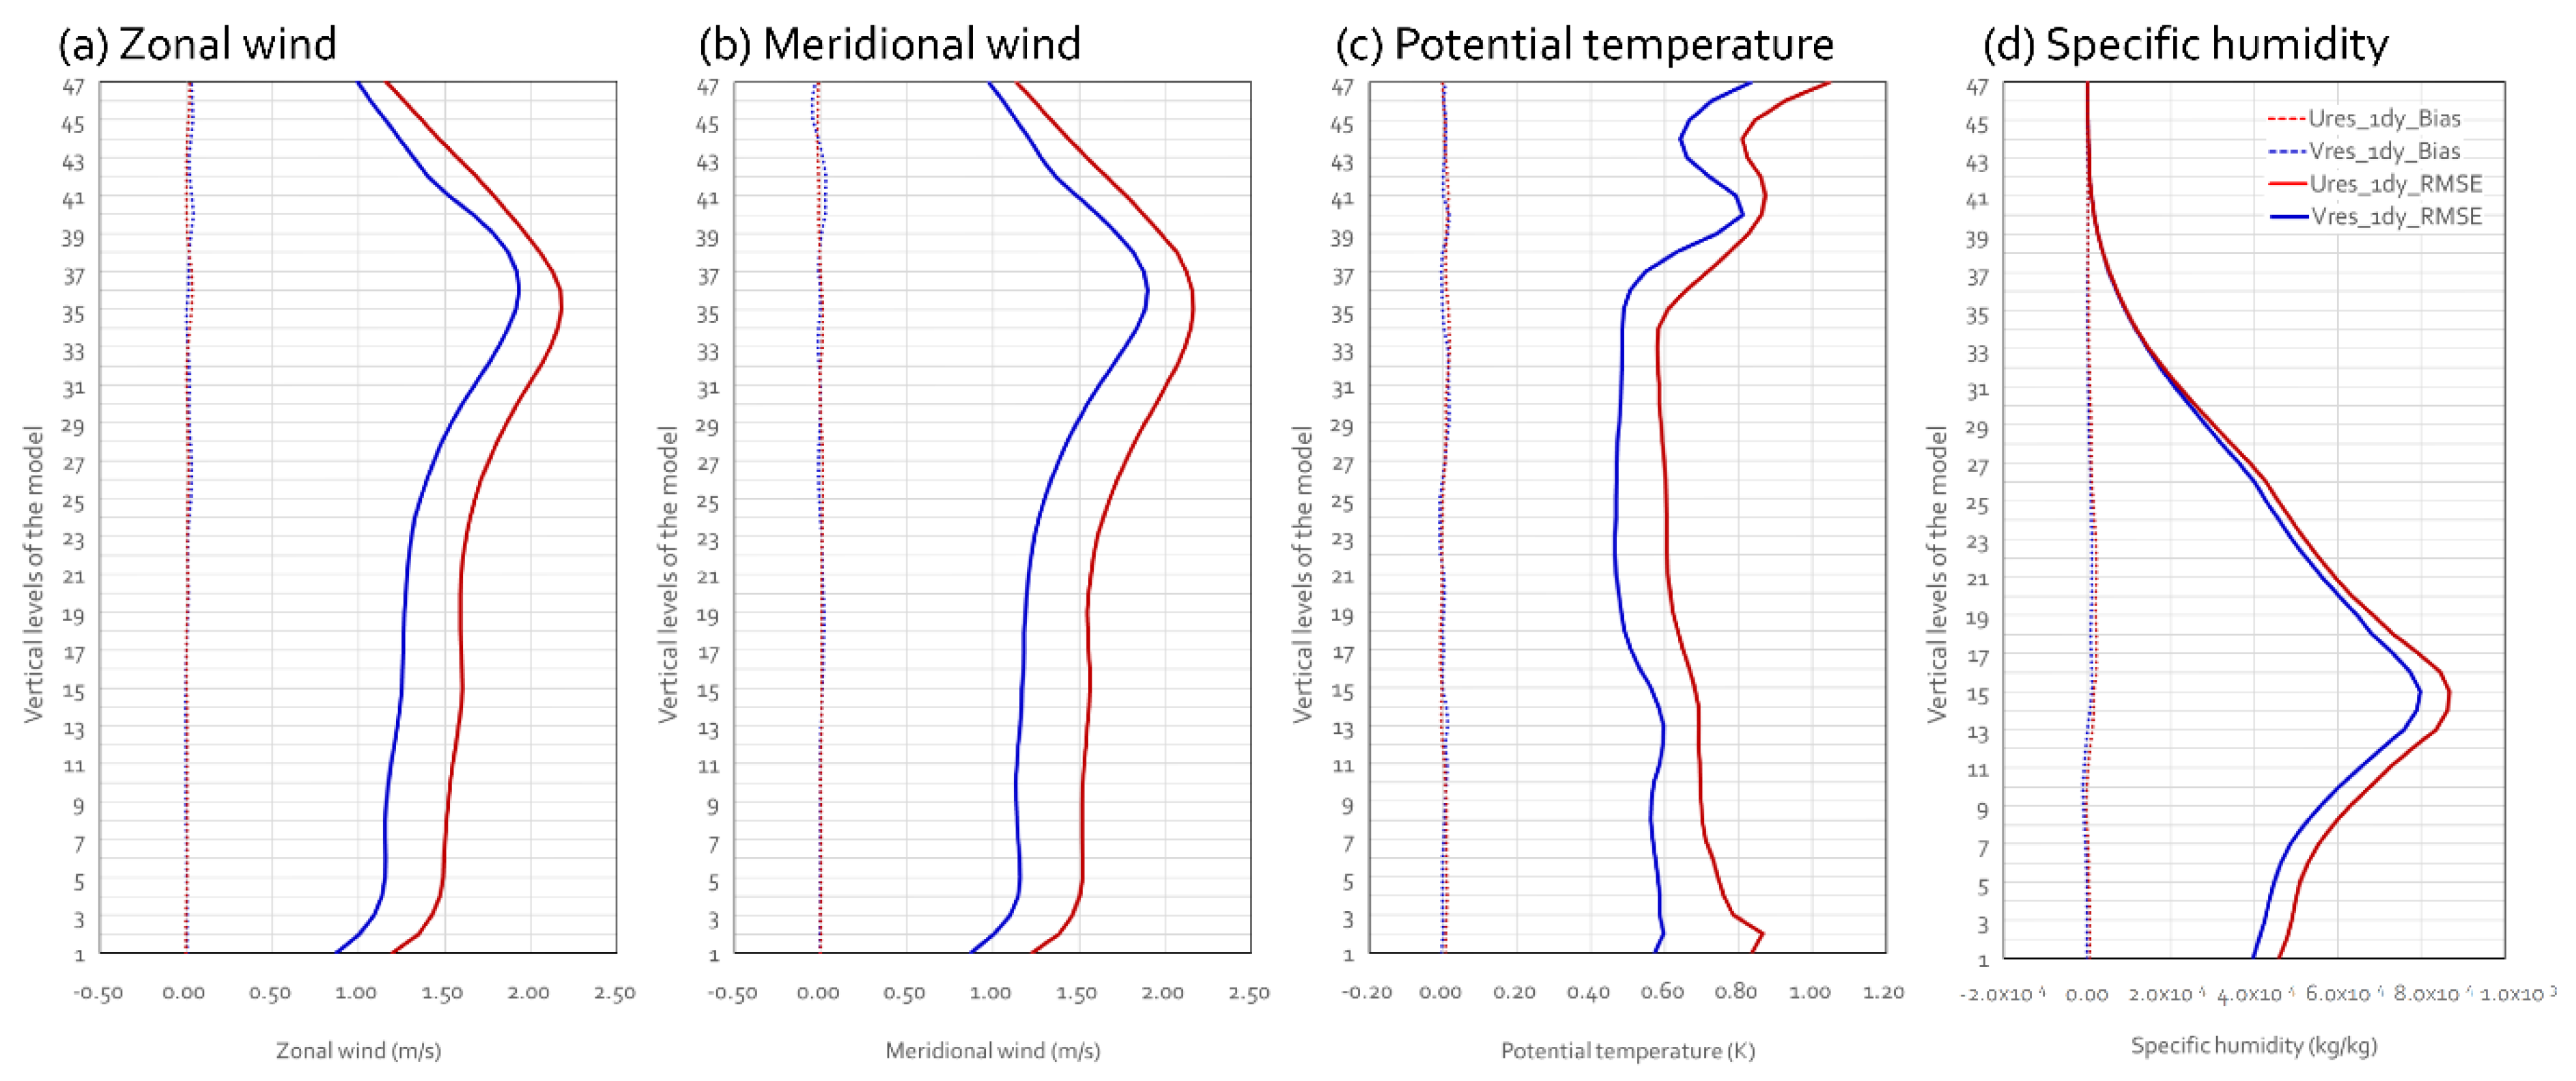
Figure 11.
Time-averaged RMS differences between mean bred vector and the nature of surface two-dimensional variables (surface zonal wind, surface meridional wind, mean sea-level pressure, surface upward heat flux, surface upward moisture, surface latent heat flux).
Figure 11.
Time-averaged RMS differences between mean bred vector and the nature of surface two-dimensional variables (surface zonal wind, surface meridional wind, mean sea-level pressure, surface upward heat flux, surface upward moisture, surface latent heat flux).


Table 1.
Parameterization schemes of “mesoscale_reference” in MPAS.
| Parameterization | Schemes |
|---|---|
| Microphysics | WSM6 |
| Convection | New Tiedtke |
| Radiation (long/short waves) | RRTMG |
| Cloud fraction for radiation | Xu–Randall |
| Gravity wave drag by orography | YSU |
| Boundary layer | YSU |
| Surface layer | Monin–Obukhov |
| Land surface | NOAH |
Table 2.
Lists of four experiments under different settings of model resolution and rescaling periods.
Table 2.
Lists of four experiments under different settings of model resolution and rescaling periods.
| Horizontal Resolution | Rescaling Period | Experiment Name |
|---|---|---|
| Quasi-uniform 60 km | 6 h | Ures_6hr |
| 24 h | Ures_1dy | |
| Variable resolution 60–15 km | 6 h | Vres_6hr |
| 24 h | Vres_1dy |
Table 3.
RMS errors of averaged bred vectors for atmospheric three-dimensional variables from the nature run.
Table 3.
RMS errors of averaged bred vectors for atmospheric three-dimensional variables from the nature run.
| Experiments | Ures_6hr | Ures_1dy | Vres_6hr | Vres_1dy | |
|---|---|---|---|---|---|
| Variables (Units) | |||||
| Zonal wind (m/s) | 1.90 | 1.67 | 1.76 | 1.37 | |
| Meridional wind (m/s) | 1.66 | 1.66 | 1.56 | 1.33 | |
| Potential temperature (K) | 6.40 × 101 | 7.05 × 101 | 5.37 × 101 | 5.66 × 101 | |
| Specific humidity (kg/kg) | 6.83 × 10⁴ | 3.93 × 10⁴ | 6.78 × 10⁴ | 3.60 × 10⁴ | |
Table 4.
Averaged use of computational time (unit: s) for one cycle of the experiments with 1024 cores of KNL node of KISTI NURION. Numbers in parentheses indicate the standard deviations.
Table 4.
Averaged use of computational time (unit: s) for one cycle of the experiments with 1024 cores of KNL node of KISTI NURION. Numbers in parentheses indicate the standard deviations.
| Experiments | Ures_6hr | Ures_1dy | Vres_6hr | Vres_1dy | |
|---|---|---|---|---|---|
| Processes | |||||
| Total time | 1663 (31) | 5886 (75) | 4811 (102) | 19,237 (3133) | |
| ┗ Initialization | 227 (25) | 242 (31) | 480 (87) | 476 (77) | |
| ┗ Time integration | 1377 (16) | 5515 (65) | 4208 (39) | 18,544 (3125) | |
Publisher’s Note: MDPI stays neutral with regard to jurisdictional claims in published maps and institutional affiliations. |
© 2022 by the authors. Licensee MDPI, Basel, Switzerland. This article is an open access article distributed under the terms and conditions of the Creative Commons Attribution (CC BY) license (https://creativecommons.org/licenses/by/4.0/).
Share and Cite
MDPI and ACS Style
Kang, J.-S.; Shin, S.; Myung, H. Impact Analysis of Variable Resolution of MPAS on Intrinsic Predictability Using Bred Vectors. Atmosphere 2022, 13, 2070. https://doi.org/10.3390/atmos13122070
AMA Style
Kang J-S, Shin S, Myung H. Impact Analysis of Variable Resolution of MPAS on Intrinsic Predictability Using Bred Vectors. Atmosphere. 2022; 13(12):2070. https://doi.org/10.3390/atmos13122070
Chicago/Turabian StyleKang, Ji-Sun, Seoleun Shin, and Hunjoo Myung. 2022. "Impact Analysis of Variable Resolution of MPAS on Intrinsic Predictability Using Bred Vectors" Atmosphere 13, no. 12: 2070. https://doi.org/10.3390/atmos13122070
Note that from the first issue of 2016, this journal uses article numbers instead of page numbers. See further details here.