
Monthly Agricultural Reservoir Storage Forecasting Using Machine Learning

1
Institutes of Green Bio Science and Technology, Seoul National University, Pyeongchang-gun 25354, Korea
2
National Center for AgroMeteorology (NCAM), Seoul 08826, Korea
3
Department of Agricultural Engineering, Institute of Agriculture and Life Science, Gyeongsang National University, Jinju-si 52828, Korea
*
Authors to whom correspondence should be addressed.
Atmosphere 2022, 13(11), 1887; https://doi.org/10.3390/atmos13111887
Submission received: 12 October 2022
/
Revised: 26 October 2022
/
Accepted: 10 November 2022
/
Published: 11 November 2022
(This article belongs to the Special Issue High-Resolution Weather and Climate Modeling with Industrial Applications)
Abstract
:Storage rate forecasting for the agricultural reservoir is helpful for preemptive responses to disasters such as agricultural drought and planning so as to maintain a stable agricultural water supply. In this study, SVM, RF, and ANN machine learning algorithms were tested to forecast the monthly storage rate of agricultural reservoirs. The storage rate observed over 30 years (1991–2022) was set as a label, and nine datasets for a one- to three-month storage rate forecast were constructed using precipitation and evapotranspiration as features. In all, 70% of the total data was used for training and validation, and the remaining 30% was used as a test. The one-month storage rate forecasting showed that all SVM, RF, and ANN algorithms were highly reliable, with R2 values ≥ 0.8. As a result of the storage rate forecast for two and three months, the ANN and SVM algorithms showed relatively reasonable explanatory power with an average R2 of 0.64 to 0.69, but the RF algorithm showed a large generalization error. The results of comparing the learning time showed that the learning speed was the fastest in the order of SVM, RF, and ANN algorithms in all of the one to three months. Overall, the learning performance of SVM and ANN algorithms was better than RF. The SVM algorithm is the most credible, with the lowest error rates and the shortest training time. The results of this study are expected to provide the scientific information necessary for the decision-making regarding on-site water managers, which is expected to be possible through the connection with weather forecast data.
1. Introduction
Water is a critical input for agricultural production, and it plays an important role in human survival [1,2,3]. Agricultural irrigation constitutes almost 70% of global water consumption [2,4,5,6]. The global water consumption rate increased by six times over the past 100 years; currently, it increases by 1% each year owing to rapid changes such as population increase, economic growth, and consumption patterns [7]. Water accessibility has become increasingly uncertain in many regions across the world affected by climate change and water scarcity; this is expected to intensify competition among water users [7,8,9].
South Korea uses 41% (15.2 billion tons) of its total water resources (37.2 billion tons) as agricultural water [10]. Agricultural reservoirs continue to be the main source of agricultural water supply to secure water during periods of water abundance such as non-cropping periods or flood seasons, and to supply water during periods of cropping or water shortage. There are 17,106 agricultural reservoirs distributed throughout South Korea [11]. Most of these are small reservoirs with limitations such as weak water supply to mild droughts; furthermore, the water loss from these reservoirs has increased and become concerning (85.6% (14,644 reservoirs) of total agricultural reservoirs) because 50 years or more have passed since their construction. The growing variability in water supply such as deepened extreme climatic phenomena, changes in farming patterns, and water demand diversification hinders the stable supply and management of agricultural water.
A stable water supply is crucial for sustainable agricultural practice, and this must be preceded by the efficient operation and management of agricultural reservoirs. The stable management of the storage rate and decision-making to ensure a moderate amount of discharge are key to the operation and management of agricultural reservoirs, and they must employ continuous monitoring and reasonable decision-making. The South Korean government and Korea Rural Community Corporation have collectively decided the available storage capacity (storage rate/water level) of ~1800 agricultural reservoirs in real time since 1991; however, this applies to only ~10% of all reservoirs. The operation of reservoirs is customarily based on the experience of the water manager, and the four-stage forecast and warning criteria (interest (mild drought), warning (moderate drought), caution (severe drought), serious (extreme drought)) for agricultural water that utilizes the common year storage rate as the storage rate operation standard [12]. Thus far, various research studies have attempted to overcome this limitation by attempting to predict the storage rate and proposed operational criteria [13,14,15,16,17,18,19]. The efficient management of water quantity in irrigation reservoirs and optimal operation methods have been studied and proposed for sustainable agricultural water management by numerous research studies worldwide [20,21,22,23]. However, these methods are not applicable on-site because the climate and topographical properties differ for each reservoir, and the crops, cultivating area, cropping pattern, and water management method also differ significantly. Meanwhile, storage rate estimation technology using the water surface extracted from satellite imagery has been developing rapidly owing to the increased applicability of drones and increased satellite image data [24,25,26,27,28,29,30]. However, the scope of their application remains limited because of the low time resolution and lack of measurement value verification [31].
Machine learning (ML) is “the scientific study of algorithms and computational models on computers using experience for progressively improving the performance on a specific task or to make accurate forecasts [32].” Further, ML has been frequently used to overcome the abovementioned limitations in the era of big data. ML models that are a black box can predict the future by learning data patterns of the past, unlike hydraulic and hydrological models that demand previous knowledge of physical processes and significant input data. Further, ML models can efficiently process complex problems and a significant amount of data [33,34,35].
Seo et al. assessed the applicability of the artificial neural network (ANN), generalized regression neural network (GRNN), adaptive neuro-fuzzy inference system (ANFIS), and random forest (RF) algorithms for predicting the daily water level of Chungju dam [36]. The applicability was distinguished into eight levels based on the composition of input data. The results of ANFIS1 and ANN6 models were outstanding on day 1 of prediction, ANN1 and RF6 showed exceptional results on day 5, and ANN3 and RF1 showed prominent results on day 10. Overall, the ANN algorithm outperformed others; however, it is reasonable to apply the optimal input variable and optimal prediction model based on the time of prediction. Zhang et al. simulated the hourly, daily, and monthly reservoir outflows using a 30-year operational record of reservoirs (nine input data including amount of inflow, amount of discharge, and water level) [37]. The highest accuracy was achieved by long short-term memory (LSTM), followed by support vector regression (SVR) and backpropagation neural network (BP). The LSTM model showed the best performance under various time and flow (NSE ≥ 0.99) although the BP and SVR models showed poor applicability under conditions of data excess and a low amount of inflow. Sapitang et al. tested a machine learning technique that can predict the low-water level of the Kenyir Dam, Malaysia, from day 1 to 7, to provide accurate water level prediction data to the reservoir operator [38].
Tests with boosted decision tree regression (BDTR), decision forest regression, neural network regression, and Bayesian linear regression (BLR) models showed that the BLR algorithm performed the best (R2 = 0.968–0.998) when testing with the water level and rainfall as the input data; BDTR performed the best (R2 = 0.998–0.999) when testing with the water level, rainfall, and discharge as the input data. Kusudo et al. predicted the water level of the Takayama reservoir (Nara Prefecture, Japan) using the deep-learning algorithm LSTM because they considered the water level prediction to be significant for managing the operation of the agricultural reservoirs [39]. The error rate was the lowest in the single-output (SO) and encoder–decoder (ED) LSTM models when the water level, rainfall, and discharge event data were used; LSTM ED was assessed to be better for long-term predictions. Ibañez et al. reviewed the long- and short-term statistics- and machine learning-based water-level prediction performance of the Angat Dam, Philippines [40]. Meteorological data and irrigation data were used to apply six models: autoregressive integrated moving average, gradient boosting machines, deep neural networks (DNN), LSTM, univariate model, and multivariate model (DNN-M). The results showed that the DNN-M model performed the best in the 30-day, 90-day, and 180-day prediction scenarios with MAE values of 2.9 m, 5.1 m, and 6.7 m, respectively. Qie et al. simulated the daily reservoir outflow using the RF, SVM, and ANN algorithms; all three were assessed to be reliable and accurate [41]. This research indicates that the variability of the optimal algorithm depends on the training data composition and temporal, spatial, and climatic characteristics of the research subject because of the intrinsic feature of machine learning that involves reproducing empirical patterns.
According to recent climate change, social demands for stable supply and efficient use of agricultural water are increasing. Stable storage rate management of agricultural reservoirs, the primary source of agricultural water, is essential. Forecasting the storage rate helps achieve stable water management by identifying the amount of agricultural water available in advance. Forecasting storage rate, especially before the farming season, is of great help in preparing agricultural drought countermeasures. In other words, storage rate forecast is helpful for preemptive responses to disasters such as agricultural drought and planning to maintain a stable agricultural water supply. Recently, machine learning technology has been widely used to solve various problems. Water management in reservoirs has a nonlinear relationship with many variables such as climate, soil, topography, and hydrology, so a machine learning model that can effectively analyze them is being reviewed [42]. Therefore, this study uses a machine learning algorithm to learn the storage rate of agricultural reservoirs and provide data for actual on-site water management decisions through future storage rate prediction. Focusing on three machine learning models, such as SVM, RF, and ANN, the monthly storage rate prediction after 1 to 3 months of the agricultural reservoir was learned, and the performance was evaluated.
2. Methods
2.1. Target Reservoir and Data Collection
This research studied agricultural reservoirs (total storage 300,000 tons or above) in Iksan-si, Gimje-si, and Jeongeup-si in Jeollabuk-do, the center of the Honam plains, a top rice-producing area. The pumped-storage-type reservoir that artificially secures storage and reservoirs lacking data from the last 30 years are excluded. In contrast, the Heungdeok reservoir (located in Gochang-gun), the largest agricultural reservoir in the Jeollabuk-do area, supplies agricultural water to Jeongeup-si and Gimje-si, and it is included as a target reservoir. In total, 13 agricultural reservoirs are selected, as shown in Figure 1.
The daily storage rates provided by the rural agricultural water resource information system (RAWRIS) are collected as the storage rate observation data of the target reservoirs. The collected storage rate data show that the irrigating and non-irrigating periods are well distinguished, and the yearly, seasonal, and regional storage rates vary significantly (Figure 2, Table 1). The storage rates were low in 1994–1995, 2001, 2012, and 2015, which are years documented to have had droughts.
The automated synoptic observation system data from January 1991 to March 2022 of two (Jeonju and Jeongeup) meteorological stations, which are nearby observatories, are collected as meteorological data. The data on rainfall, maximum temperature, minimum temperature, average wind speed, relative humidity, and duration of sunshine is collected; the average value of the observatory data is applied for the missing values. The daily reference evapotranspiration (ETo) was calculated using the Penman–Monteith equation as feature data for machine learning. Table 2 summarizes the statistical characteristics of rainfall and evapotranspiration over the entire period of the collected data.
2.2. Machine-Learning Algorithm for Regression
Regression is a supervised learning technology that predicts continuous values based on the relationship between variables [43]. This research tested the basic regression algorithms SVM, RF, and ANN among the supervised learning ML algorithms. All three algorithms are used in classification and regression problems and frequently for prediction across various fields [44,45,46,47]. This research used Python and Scikit-Learn, Pandas, Numpy, and Seaborn libraries.
The SVM is based on the Vapnik–Chervonenkis theory [48], and it minimizes the structural risk; therefore, its overfitting tendency is lower than that of the other models [49,50]. In general, SVM is used for classification, regression, and outlier detection, etc. For regression, the ε-insensitive loss function is implemented to train the model to allow the input of as many samples as possible within a certain margin of error. Nonlinear regression is resolved by mapping from low to high dimensions using kernel tricks such as the polynomial, sigmoid, and radial basis functions (RBF) [51,52]. The SVM approximates the function as:
where , are the input and output values, is weight vector, b is a scalar basis, T is degree, C is a penalty constant (regularization constant), ξ is slack variable (upper and lower constraint, respectively), ε is margin of tolerance.
The hyperplane function can be written as:
is Lagrange multiplier, is membership class label, is support vector for nth class, is the kernel function, and is bias.
The RF algorithm combines numerous decision-tree models. As a typical ensemble model, it uses the bagging (bootstrap aggregating) method, which refers to the resampling method that allows duplicates within a training dataset. The RF is simple, and its learning speed is fast; further, it is relatively less impacted by noise or outliers [53,54,55]. However, its performance is low for high dimensions or rare data. The regression uses the average value of each classifier as the final prediction value, and the major hyperparameters of RF include the number of decision trees, minimum number of samples of a node, and depth setting [56,57,58,59,60]. The RF regression model can be presented as:
where, N represents the average number of regression trees built by RF, 𝑥 is a p-dimensional vector of inputs, and refers to decision-tree.
The ANN comprises an input layer, output layer, and one or more hidden layers. Further, it is referred to as a multilayer perceptron (MLP); its strengths include outstanding non-linear mapping and normalization capacity [61,62]. In the Scikit-Learn library, stochastic gradient descent (SGD) or limited-memory quasi-Newton methods (L-BFGS) are used to find parameters that minimize the loss function. The ANN hyperparameters include the hidden layer sizes, activation functions, learning rate, batch size, and a number of epochs [63,64]. The ANN approximates the function as:
where, and are weight matrices for hidden and input layers, and are bias vectors for hidden and input layers, is an input vector, and is activation function.
The RMSE, MAE and coefficient of determination (R2) were used as indicators to evaluate the performance of the machine learning model.
where , , , and represent the target value (actual value), predicted value, number of data, and average of the target value (actual value), respectively.
RMSE and MAE with an error value closer to 0 signifies high performance; an R2 value closer to 1 indicates high performance. The possible R2 value ranges between −∞ and 1 depending on the correlation between the actual and predicted values [65]. If R2 is negative, it signifies an abnormal case in which the prediction performance is lower than the model predicted by the mean value. It can be negative when calculated on out-of-sample data (or for a linear regression without an intercept) [66].
2.3. Hyperparameter Optimization
This research uses random search to tune the hyperparameters. The random search searches for the best parameter based on the combination of random numbers that are possible within a set number range. This method is more efficient than grid search when the range is broad or when it is challenging to predict the range of the parameter value [67,68]. Further, five-fold cross-validations were implemented to prevent over/underfitting and utilize all training data for training and validation. The hyperparameters for the SVM, RF, and ANN algorithms and the range of set values are summarized in Table 3. Except for the important parameters, the default parameters provided in scikit-learn were used. For the SVM, the penalty constant (normalization constant) “C” and the “ε” value representing the allowable error are determined. Further, the default value (default = “scale”) is used for gamma because the addition of a parameter for “gamma” that determines the decision boundary curvature is required because “rbf’ is selected as the kernel function. For the RF, MSE is set as the criteria for distinguishing trees, and the values are determined for “n_estimators” that represents the number of decision-making trees and “min_samples_split” that represents the minimum number of node samples. For the ANN, the values are determined for “max_iter (epoch),” “activation,” “solver,” and “hidden layer size” which represent the maximum frequency of repetition, activation function, method of weight optimization, and the number of neurons and hidden layers, respectively. In this research, a single-layer neural network with one hidden layer is constructed; the remaining batch size and learning rate are configured as per the basic parameters of “auto” and “adaptive,”, respectively. The maximum frequency of repetition is limited to 1000 times, and the training proceeds at the adaptive learning rate.
The regulation intensity is lowered for the hyperparameter range in case of concerns related to underfitting, and it is raised in case of concerns related to overfitting. The optimal parameters are searched for by randomly creating 200 parameter combinations within the set range.
2.4. Learning Model and Training Dataset Setting
Irrigation facilities for agricultural water supply are artificially manipulated by water managers. Therefore, it is known that 10-day or monthly data reflect actual values better than daily data [69,70]. All collected daily data are transformed into monthly data for use in training. The label for constituting the learning model is set to the average storage rate (AS); a total of nine learning models are formed by altering the meteorological conditions depending on the extent of time (Table 4). The extent of time is set to one to three months, considering the cultivating period of paddy rice and the applicability of the meteorological forecast data. The input data, as the previous storage rates, are combined based on three criteria: storage rate on the last day of the month (ES), monthly cumulative rainfall (CP), and monthly cumulative standard evapotranspiration (CE).
All data are randomly shuffled to prevent a sampling bias; training and validation data are configured to 70% and 30% of the total data, respectively. Thus, 262 (70%) among 375 monthly data are used as training data for each reservoir, and the remaining 113 (30%) are used as test data to assess the test performance. Further, the average and standard deviation are standardized to 0 and 1, respectively, to manage the features on a different scale. The SVM that uses the RBF kernel assumes a Gaussian distribution, wherein data standardization must proceed. Further, employing optimization algorithms such as gradient descent after standardization can help reduce the learning time for weight values and the possibility of falling into the local optimum (local minimum). The methodology employed in this research for predicting the average storage rate using ML is illustrated in Figure 3.
3. Results and Discussion
3.1. Performance in One-Month Forecasting Models
Performance evaluation, best parameters, and learning time results were compared for three models for one-month forecasting. The results from all 13 reservoirs were highly reliable because they showed R2 values of 0.8 or above (Table 5 and Figure 4). The RMSE and MAE were also excellent. The best model has a small generalization error; i.e., training and test performances must be good, and the difference between the training and test performance must be slight. A high training performance but a significantly low learning performance implies overfitting to training data, whereas a significantly higher learning performance most likely signifies underfitting. Generalization error showed good performance in the order of ANN1, SVM1, and RF1. Considering the learning performance and generalization error, the SVM1 and ANN1 models were relatively superior to the RF1 model, but the difference was insignificant. Hyperparameter optimization results show that the parameters that give the best performance for a given dataset are different for each agricultural reservoir (Table 6). As such, the proper values of the parameters depend on the data, so it is necessary to optimize the parameters to obtain a generalizable model. This means that the data should not be over- or underfitting [71,72]. Learning time represents the average learning time (total learning time/number of parameter combinations). The learning time of each model was 0.004, 0.629, and 4.111 s for SVM1, RF1, and ANN1, respectively. The learning time was the training time for one parameter combination, and the computation time across 200 combinations showed a much more significant difference. Regarding learning time, the performance was good in the order of SVM1, RF1, and ANN1 models. The SVM algorithm involves repetitive/iterative computations involving the multiplication of large dimensional matrices, which demand substantial computational time and storage space to define the best hyperplanes [73]. The SVM algorithm provides excellent results but has limitations that apply to problems with large datasets (more than 100 K) due to significant learning times [74,75]. The RBF kernel of the SVM algorithm in particular was expected to have poor learning time performance due to relatively high temporal and spatial complexity compared to other kernels. However, a high-speed performance was observed in this study because the number of training data samples was low at 262 units. The SVM1 and ANN1 models slightly outperformed the RF1 model in learning performance, but the ANN1 model is the most inefficient regarding learning time. Therefore, the one-month forecast model is judged to be a model optimized in the order of SVM1, RF1, and ANN1 when considering everything up to the learning time.
3.2. Performance in the Two-Month Forecasting Models
The training and test performance results of the model forecast of two-month storage rates are summarized in Table 7 and Figure 5. Although not better than the one-month forecast, the lowest R2 value was 0.5. The average R2 values of SVM2, RF2, and ANN2 were 0.69, 0.65, and 0.68, respectively, and therefore, they were significantly reliable. The difference in the training and test performances was similar in the SVM2 and ANN2 models; comparatively, the SVM2 model showed a smaller generalization error. In contrast, the RF2 model showed a significant difference in performance between the training and test phases. In the training phase, the RF2 model has an MAE of 2.70–5.52 and an RMSE of 3.9–7.0, significantly outperforming the other models. However, in the test phase, the MAE was 6.30–11.98, and the RMSE was 8.7–13.7, higher than the other two models. Table 8 shows the hyperparameter optimization results and learning time results. The hyperparameters were the combination of parameters that showed the best performance by optimization, and the values for all reservoirs appeared different. The learning time was 0.005, 0.042, and 4.104 s for SVM2, RF2, and ANN2, respectively. The RF algorithm is computationally less expensive and faster in training the model and performing predictions [76]. The RF algorithm in particular is more effective in handling large datasets [73]. However, an increase in computation time was observed when a high number of trees was considered, as in the study by Rodriguez-Galiano et al. [72]. In this study, RF2 showed a large generalization error. The RF algorithm is significantly impacted by the number of data to a greater extent than other models, and thus, the number of data needs to be increased to overcome test accuracy and overfitting issues [77]. The RF2 model was relatively more straightforward to implement than the other two models, but there were limits when the data were limited. As with the one-month forecast, the SVM2 and ANN2 models did not differ significantly in learning performance, but the learning time of the SVM2 model was overwhelmingly better. Considering only the training time, the RF2 model was superior to the ANN2 model, but due to the high generalization error, the two-month storage rate forecast model was judged to be superior in the order of SVM2, ANN2, and RF2 model.
3.3. Performance in the Three-Month Forecasting Models
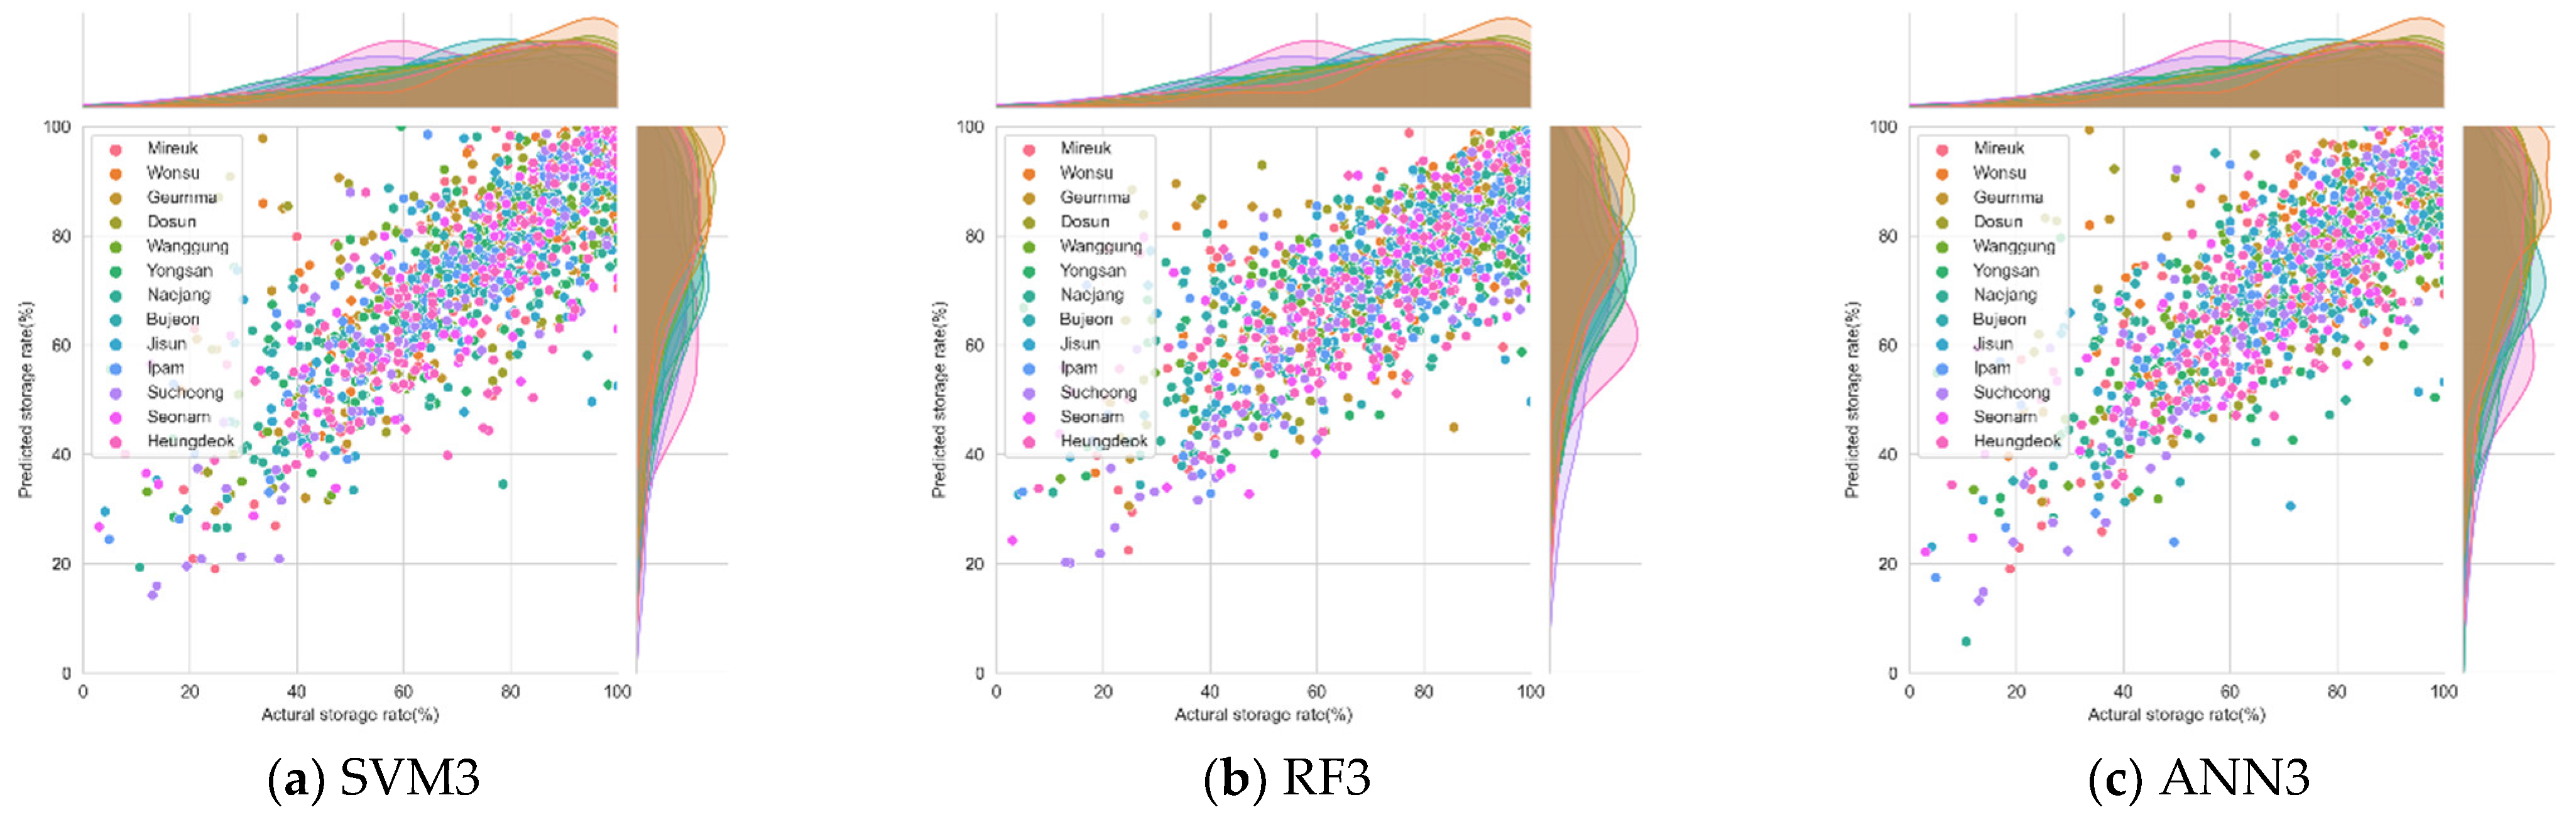
The three-month storage rate forecast performances demonstrated that all three models are reliable; the R2 values, MAE, and RMSE values for SVM3, RF3, and ANN3 are presented in Table 9 and Figure 6. SVM, RF, and ANN models for the three-month storage rate forecast showed reliable results. The MAE shows an error within 10%, and the average R2 values of SVM3, RF3, and ANN3 were 0.65, 0.60, and 0.64, respectively, all of which have explanatory power. In the case of the generalization error, the RF3 model showed relatively large errors, similar to the two-month forecast. The performance of the SVM3 and ANN3 models were similar, as were the storage rate forecast for two months. However, this study configured the hidden layer to 1 for the ANN algorithm. The hidden layer in the neural network impacts the model performance; considerable research on the method for determining the appropriate number of hidden layers is in progress [50,78,79]. Nguyen et al. recommended ANN with 2–3 hidden layers for simple regression [80], and Heaton argued that two hidden layers showed high accuracy when using a reasonable activation function [81]. Generally, the largest and most complex networks are more practical for defining a training dataset. However, these types of networks perform less accurate generalizations than smaller and simpler networks [72]. Considering these points, we should try to extend the hidden layers and number of neurons in the future and confirm the improvement of the ANN algorithm learning performance. The optimal parameters appear differently, and the learning times of SVM3, RF3, and ANN3 are 0.007, 0.732, and 4.372 s, respectively (Table 10). The learning time for ANN3 is significantly longer than SVM3 and RF3 models. The ANN algorithm uses the time-consuming backpropagation algorithm to update the weight values, which requires more time for learning than the other models. ANN has the potential to become a more widely used regression algorithm, but because of their time-consuming parameter tuning procedure, the numerous types of neural network architectures to choose from, and the high number of algorithms used for training ANN, some researchers recommend SVM or RF algorithm [82]. Considering all aspects, such as learning outcome and learning time, the SVM3 is determined to be relatively more efficient than the ANN3.
4. Conclusions
In this study, the ML algorithms such as SVM, RF, and ANN were used to forecast the monthly storage rates after 1–3 months, and their applicability was verified. To this end, the storage rate data for 13 agricultural reservoirs collected over about 30 years (1981 to March 2022) and two sources of meteorological data from nearby observatories were used as training data. Nine learning models were tested based on the algorithm type and label, and the test performances of each learning model were assessed using two performance indices, RMSE, MAE, and R2.
The one-month storage rate forecasting showed that all SVM, RF, and ANN algorithms were highly reliable, with R2 values of 0.8 or above. In the results of the storage rate prediction test for two and three months, the ANN and SVM algorithms showed relatively good explanatory power with an average R2 ranging from 0.64 to 0.69. In contrast, the RF algorithm showed high generalization error. Although the SVM and ANN algorithms were superior to the RF algorithm in terms of learning performance, it was found that the learning speed was faster in the order of the SVM, RF, and ANN algorithms in terms of learning time. Overall, the SVM algorithm is the most reasonable model for storage rate forecast by showing the best performance in all evaluations, such as learning performance and learning time.
This research investigated the regression ML algorithms for the storage rate forecasting of agricultural reservoirs; they were sufficiently applicable. In the case of limited data, the SVM algorithm was more valuable than the RF and ANN algorithms. However, this could differ based on the data’s amount, characteristics, and complexity. Therefore, a comparison of several learning algorithms is suggested before selecting the optimal model for a certain issue.
In the future, a more accurate prediction of storage rates is expected because storage rate data continue to accumulate. In addition, the provision of scientific information necessary for the decision-making of on-site water managers is expected to be possible through the connection with highly reliable meteorological forecast data. Further, subsequent research studies that focus on the optimal model for storage rate forecasting by testing various learning data and learning models relevant to the storage rate, such as the previous rainfall and deviations in rainfall, are necessary.
Author Contributions
Conceptualization, S.-J.B. and M.-W.J.; methodology, M.-W.J. and S.-J.K.; software, S.-J.K.; writing—original draft preparation, S.-J.K.; writing—review and editing, M.-W.J.; project administration, S.-J.B. and S.-J.L.; funding acquisition, S.-J.B. and S.-J.L. All authors have read and agreed to the published version of the manuscript.
Funding
This work was supported by Korea Institute of Planning and Evaluation for Technology in Food, Agriculture and Forestry(IPET) through Living Lab Project for Rural Issues Project, funded by Ministry of Agriculture, Food and Rural Affairs (MAFRA) (120099-03).
Institutional Review Board Statement
Not applicable.
Institutional Consent Statement
Not applicable.
Data Availability Statement
Not applicable.
Conflicts of Interest
The authors declare no conflict of interest.
References
- Green, P.A.; Vörösmarty, C.J.; Harrison, I.; Farrell, T.; Sáenz, L.; Fekete, B.M. Freshwater ecosystem services supporting humans: Pivoting from water crisis to water solutions. Glob. Environ. Change 2015, 34, 108–118. [Google Scholar] [CrossRef]
- Rosegrant, M.W.; Ringler, C.; Zhu, T. Water for agriculture: Maintaining food security under growing scarcity. Ann. Rev. Environ. Res. 2009, 30, 205–222. [Google Scholar] [CrossRef]
- D’Odorico, P.; Chiarelli, D.D.; Rosa, L.; Bini, A.; Zilberman, D.; Rulli, M.C. The global value of water in agriculture. Proc. Nat. Acad. Sci. USA 2020, 117, 21985–21993. [Google Scholar] [CrossRef] [PubMed]
- United Nations Educational, Scientific and Cultural Organization (UNESCO). Water for People Water for Life—Executive Summary; UNESCO: Paris, France, 2003. [Google Scholar]
- Food and Agriculture Organization of the United Nations (FAO). Water for Sustainable Food and Agriculture: A Report Produced for the G20 Presidency of Germany; FAO: Rome, Italy, 2017. [Google Scholar]
- Clark, M.; Tilman, D. Comparative analysis of environmental impacts of agricultural production systems, agricultural input efficiency, and food choice. Environ. Res. Lett. 2017, 12, 064016. [Google Scholar] [CrossRef]
- United Nations Educational, Scientific and Cultural Organization (UNESCO). The United Nations World Water Development Report 2020: Water and Climate Change; UNESCO: Paris, France, 2020. [Google Scholar]
- Borsato, E.; Rosa, L.; Marinello, F.; Tarolli, P.; D’Odorico, P. Weak and strong sustainability of irrigation: A framework for irrigation practices under limited water availability. Front. Sustain. Food Syst. 2020, 4, 17. [Google Scholar] [CrossRef]
- Rosa, L. Adapting agriculture to climate change via sustainable irrigation: Biophysical potentials and feedbacks. Environ. Res. Lett. 2022, 17, 6. [Google Scholar] [CrossRef]
- Ministry of Environment, Republic of Korea (ME). Available online: http://stat.me.go.kr/ (accessed on 12 March 2021).
- Ministry for Food, Agriculture, Forestry and Fisheries, Republic of Korea (MIFAFF). Statistical Yearbook of Land and Water Development for Agriculture in 2020; MIFAFF: Seoul, Korea, 2021. [Google Scholar]
- Agricultural Drought Management System (ADMS). Available online: https://adms.ekr.or.kr/ (accessed on 7 September 2022).
- Nam, W.H.; Choi, J.Y. Development of operation rules in agricultural reservoirs using real-time water level and irrigation vulnerability index. J. Korean Soc. Agric. Eng. 2013, 55, 77–85. [Google Scholar] [CrossRef]
- Lee, J.W.; Kim, J.U.; Jung, C.G.; Kim, S.J. Forecasting monthly agricultural reservoir storage and estimation of reservoir drought index (RDI) using meteorological data based multiple linear regression analysis. J. Korean Assoc. Geogr. Inf. Stud. 2018, 21, 19–34. [Google Scholar] [CrossRef]
- Cho, G.H.; Han, K.H.; Choi, K.S. Analysis of water supply reliability of agricultural reservoirs based on application of modified Penman and Penman-Monteith methods. J. Korean Soc. Agric. Eng. 2019, 61, 97–101. [Google Scholar] [CrossRef]
- Kim, J.U.; Lee, J.W.; Kim, S.J. Evaluation of the future agricultural drought severity of South Korea by using reservoir drought index (RDI) and climate change scenarios. J. Korean Water Res. Assoc. 2019, 52, 381–395. [Google Scholar] [CrossRef]
- Kang, H.S.; An, H.U.; Nam, W.H.; Lee, K.Y. Estimation of agricultural reservoir water storage based on empirical method. J. Korean Soc. Agric. Eng. 2019, 61, 1–10. [Google Scholar] [CrossRef]
- Mun, Y.S.; Nam, W.H.; Woo, S.B.; Lee, H.J.; Yang, M.H.; Lee, J.S.; Ha, T.H. Improvement of drought operation criteria in agricultural reservoirs. J. Korean Soc. Agric. Eng. 2022, 64, 11–20. [Google Scholar] [CrossRef]
- Lee, J.; Shin, H. Agricultural reservoir operation strategy considering climate and policy changes. Sustainability 2022, 14, 9014. [Google Scholar] [CrossRef]
- Moradi-Jalal, M.; Haddad, O.B.; Karney, B.W.; Mariño, M.A. Reservoir operation in assigning optimal multi-crop irrigation areas. Agric. Water Manag. 2007, 90, 149–159. [Google Scholar] [CrossRef]
- Zamani, R.; Akhond-Ali, A.M.; Ahmadianfar, I.; Elagib, N.A. Optimal reservoir operation under climate change based on a probabilistic approach. J. Hydrol. Eng. 2017, 22, 05017019. [Google Scholar] [CrossRef]
- Khorshidi, M.S.; Nikoo, M.R.; Sadegh, M.; Nematollahi, B. A multi-objective risk-based game theoretic approach to reservoir operation policy in potential future drought condition. Water Res. Manag. 2019, 33, 1999–2014. [Google Scholar] [CrossRef]
- Nourani, V.; Rouzegari, N.; Molajou, A.; Baghanama, A.H. An integrated simulation-optimization framework to optimize the reservoir operation adapted to climate change scenarios. J. Hydrol. 2020, 587, 125018. [Google Scholar] [CrossRef]
- Avisse, N.; Tilmant, A.; Müller, M.F.; Zhang, H. Monitoring small reservoirs storage from satellite remote sensing in inaccessible areas. Hydrol. Earth Syst. Sci. 2017, 21, 6445–6459. [Google Scholar] [CrossRef] [Green Version]
- Yoon, S.K.; Lee, S.K.; Park, K.W.; Jang, S.M.; Lee, J.Y. Development of a storage level and capacity monitoring and forecasting techniques in Yongdam Dam Basin using high resolution satellite image. Korean J. Remote Sens. 2018, 34, 1014–1053. [Google Scholar] [CrossRef]
- Vanthof, V.; Kelly, R. Water storage estimation in ungauged small reservoirs with the TanDEM-X DEM and multi-source satellite observations. Remote Sens. Environ. 2019, 235, 111437. [Google Scholar] [CrossRef]
- Lee, H.J.; Nam, W.H.; Yoon, D.H.; Jang, M.W.; Hong, E.M.; Kim, T.G.; Kim, D.E. Estimation of water storage in small agricultural reservoir using Sentinel-2 satellite imagery. J. Korean Soc. Agric. Eng. 2020, 62, 1–9. [Google Scholar] [CrossRef]
- Gourgouletis, N.; Bariamis, G.; Anagnostou, M.N.; Baltas, E. Estimating reservoir storage variations by combining Sentinel-2 and 3 measurements in the Yliki Reservoir, Greece. Remote Sens. 2022, 14, 1860. [Google Scholar] [CrossRef]
- Sorkhabi, O.M.; Shadmanfar, B.; Kiani, E. Monitoring of dam reservoir storage with multiple satellite sensors and artificial intelligence. Results Eng. 2022, 16, 100542. [Google Scholar] [CrossRef]
- Ghansah, B.; Foster, T.; Higginbottom, T.P.; Adhikari, R.; Zwart, S.J. Monitoring spatial-temporal variations of surface areas of small reservoirs in Ghana’s Upper East Region using Sentinel-2 satellite imagery and machine learning. Phys. Chem. Earth 2022, 125, 103082. [Google Scholar] [CrossRef]
- Lee, S.J.; Kim, K.J.; Kim, Y.H.; Kim, J.W.; Park, S.W.; Yun, Y.S.; Kim, N.R.; Lee, Y.W. Deep learning-based estimation and mapping of evapotranspiration in cropland using local weather prediction model and satellite data. J. Korean Cartogr. Assoc. 2018, 18, 105–116. [Google Scholar] [CrossRef]
- Morota, G.; Ventura, R.V.; Silva, F.F.; Koyama, M.; Fernanfo, S.C. Big data analytics and precision animal agriculture symposium: Machine learning and data mining advance predictive big data analysis in precision animal agriculture. J. Anim. Sci. 2018, 96, 1540–1550. [Google Scholar] [CrossRef]
- Jenny, H.; Wang, Y.; Eduardo, G.A.; Roberto, M. Using artificial intelligence for smart water management systems. ADB Briefs 2020, 143. [Google Scholar] [CrossRef]
- Benos, L.; Tagarakis, A.C.; Dolias, G.; Berruto, R.; Kateris, D.; Bochtis, D. Machine learning in agriculture: A comprehensive updated review. Sensors 2021, 21, 3758. [Google Scholar] [CrossRef]
- Durai, S.K.S.; Shamili, M.D. Smart farming using machine learning and deep learning techniques. Decis. Anal. J. 2022, 3, 100041. [Google Scholar] [CrossRef]
- Seo, Y.M.; Choi, E.H.; Yeo, W.K. Reservoir water level forecasting using machine learning models. J. Korean Soc. Agric. Eng. 2017, 59, 97–110. [Google Scholar] [CrossRef]
- Zhang, D.; Lin, J.; Peng, Q.; Wang, D.; Yang, T.; Sorooshian, S.; Liu, X.; Zhuang, J. Modeling and simulating of reservoir operation using the artificial neural network, support vector regression, deep learning algorithm. J. Hydrol. 2018, 565, 720–736. [Google Scholar] [CrossRef] [Green Version]
- Sapitang, M.; Ridwan, W.M.; Kushiar, K.F.; Ahmed, A.N.; El-Shafie, A. machine learning application in reservoir water level forecasting for sustainable hydropower generation strategy. Sustainability 2020, 12, 6121. [Google Scholar] [CrossRef]
- Kusudo, T.; Yamamoto, A.; Kimura, M.; Matsuno, Y. Development and assessment of water-level prediction models for small reservoirs using a deep learning algorithm. Water 2022, 14, 55. [Google Scholar] [CrossRef]
- Ibañez, S.C.; Dajac, C.V.G.; Liponhay, M.P.; Legara, E.F.T.; Esteban, J.M.H.; Monterola, C.P. Forecasting reservoir water levels using deep neural networks: A case study of Angat Dam in the Philippines. Water 2022, 14, 34. [Google Scholar] [CrossRef]
- Qie, G.; Zhang, Z.; Getahun, E.; Mamer, E.A. Comparison of machine learning models performance on simulating reservoir outflow: A case study of two reservoirs in Illinois, U.S.A. J. Am. Water Resour. Assoc. 2022, JAWR-21-0019-P. [Google Scholar] [CrossRef]
- Sharma, R.; Kamble, S.S.; Gunasekaran, A.; Kumar, V.; Kumar, A. A systematic literature review on machine learning applications for sustainable agriculture supply chain performance. Comput. Oper. Res. 2020, 119, 104926. [Google Scholar] [CrossRef]
- Jansen, S. Hands-On Machine Learning for Algorithmic Trading: Design and Implement Investment Strategies Based on Smart Algorithms That Learn from Data Using Python, 1st ed.; Packt Publishing: Birmingham, UK, 2018; ISBN 13-978-1789346411. [Google Scholar]
- Caruana, R.; Niculescu-Mizil, A. An empirical comparison of supervised learning algorithms. In Proceedings of the 23rd International Conference on Machine Learning, Pittsburgh, PA, USA, 25–29 June 2006; pp. 161–168. [Google Scholar] [CrossRef] [Green Version]
- Noi, P.T.; Kappas, M. Comparison of random forest, k-nearest neighbor, and support vector machine classifiers for land cover classification using Sentinel-2 imagery. Sensors 2018, 18, 18. [Google Scholar] [CrossRef] [Green Version]
- Ge, G.; Shi, Z.; Zhu, Y.; Yang, X.; Hao, Y. Land use/cover classification in an arid desert-oasis mosaic landscape of China using remote sensed imagery: Performance assessment of four machine learning algorithms. Glob. Ecol. Conserv. 2020, 22, e00971. [Google Scholar] [CrossRef]
- Boateng, E.Y.; Otoo, J.; Abaye, D.A. Basic tenets of classification algorithms K-nearest-neighbor, support vector machine, random forest and neural network: A review. J. Data Anal. Inf. Process. 2020, 8, 341–357. [Google Scholar] [CrossRef]
- Vapnik, V.N.; Chervonenkis, A.Y. A class of algorithms for pattern recognition learning. Avtom. Telemekh. 1964, 25, 937–945. [Google Scholar]
- Awad, M.; Khanna, R. Efficient Learning Machines: Theories, Concepts, and Applications for Engineers and System Designers; Springer Nature: Cham, Switzerland, 2015; ISBN 978-1-4302-5989-3. [Google Scholar] [CrossRef]
- Lv, Y.; Le, Q.T.; Bui, H.B.; Bui, X.N.; Nguyen, H.; Nguyen-Thoi, T.; Dou, J.; Song, Z. A comparative study of different machine learning algorithms in predicting the content of ilmenite in titanium placer. Appl. Sci. 2020, 10, 10020635. [Google Scholar] [CrossRef] [Green Version]
- Vapnik, V.N. An overview of statistical learning theory. IEEE Trans. Neural Netw. 1999, 10, 988–999. [Google Scholar] [CrossRef] [PubMed] [Green Version]
- Ahmad Yasmin, N.S.; Abdul Wahab, N.; Ismail, F.S.; Musa, M.J.; Halim, M.H.A.; Anuar, A.N. Support vector regression modelling of an aerobic granular sludge in sequential batch reactor. Membranes 2021, 11, 554. [Google Scholar] [CrossRef] [PubMed]
- Breiman, L. Random forests. Mach. Learn. 2001, 45, 5–32. [Google Scholar] [CrossRef] [Green Version]
- Adnan, M.S.G.; Rahman, M.S.; Ahmed, N.; Ahmed, B.; Rabbi, M.F.; Rahman, R.M. Improving spatial agreement in machine learning-based landslide susceptibility mapping. Remote Sens. 2022, 12, 3347. [Google Scholar] [CrossRef]
- Strobl, C.; Malley, J.; Tutz, G. An introduction to recursive partitioning: Rationale, application, and characteristics of classification and regression trees, bagging, and random forests. Psychol. Methods 2009, 14, 323–348. [Google Scholar] [CrossRef] [Green Version]
- González, P.F.; Bielza, C.; Larrañaga, P. Random forests for regression as a weighted sum of k-potential nearest neighbors. IEEE Access 2019, 7, 25660–25672. [Google Scholar] [CrossRef]
- Aldrich, C. Process variable importance analysis by use of random forests in a shapley regression framework. Minerals 2020, 10, 420. [Google Scholar] [CrossRef]
- Yokoyama, A.; Yamaguchio, N. Optimal hyperparameters for random forest to predict leakage current alarm on premises. E3S Web Conf. 2020, 152, 03003. [Google Scholar] [CrossRef]
- Isabona, J.; Imoize, A.L.; Kim, Y. Machine learning-based boosted regression ensemble combined with hyperparameter tuning for optimal adaptive learning. Sensors 2022, 22, 3776. [Google Scholar] [CrossRef]
- Scikit-Learn User Guide 1.1.2. Available online: https://scikit-learn.org/stable/user_guide.html (accessed on 1 May 2022).
- Yu, C.; Chen, J. Landslide susceptibility mapping using the slope unit for Southeastern Helong City, Jilin Province, China: A comparison of ANN and SVM. Symmetry 2020, 12, 1047. [Google Scholar] [CrossRef]
- Xia, D.; Tang, H.; Sun, S.; Tang, C.; Zhang, B. Landslide susceptibility mapping based on the germinal center optimization algorithm and support vector classification. Remote Sens. 2022, 14, 2707. [Google Scholar] [CrossRef]
- Abdolrasol, M.G.M.; Hussain, S.M.S.; Ustun, T.S.; Sarker, M.R.; Hannan, M.A.; Mohamed, R.; Ali, J.A.; Mekhilef, S.; Milad, A. Artificial neural networks based optimization techniques: A review. Electronics 2021, 10, 2689. [Google Scholar] [CrossRef]
- Wysocki, M.; Ślepaczuk, R. Artificial neural networks performance in WIG20 index options pricing. Entropy 2022, 24, 35. [Google Scholar] [CrossRef]
- Chicco, D.; Warrens, M.J.; Jurman, G. The coefficient of determination R-squared is more informative than SMAPE, MAE, MAPE, MSE and RMSE in regression analysis evaluation. PeerJ Comput. Sci. 2021, 7, e623. [Google Scholar] [CrossRef]
- Jansen, S. Machine Learning for Algorithmic Trading: Predictive Models to Extract Signals from Market and Alternative Data for Systematic Trading Strategies with Python, 2nd ed.; Packt Publishing: Birmingham, UK, 2020; ISBN 13-978-1839217715. [Google Scholar]
- Bergstra, J.; Bengio, Y. Random search for hyperparameter optimization. J. Mach. Learn. Res. 2012, 13, 281–305. [Google Scholar] [CrossRef]
- Yang, L.; Shami, A. On hyperparameter optimization of machine learning algorithms: Theory and practice. Neurocomputing 2020, 415, 295–316. [Google Scholar] [CrossRef]
- Song, J.H.; Song, I.H.; Kim, J.T.; Kang, M.S. Simulation of agricultural water supply considering yearly variation of irrigation efficiency. J. Korea Water Resour. Assoc. 2015, 48, 425–438. [Google Scholar] [CrossRef]
- Kim, J.U.; Jung, C.G.; Lee, J.W.; Kim, S.J. Development of Naïve-Bayes classification and multiple linear regression model to predict agricultural reservoir storage rate based on weather forecast data. J. Korea Water Resour. Assoc. 2018, 51, 839–852. [Google Scholar] [CrossRef]
- Abedi, M.; Norouzi, G.H.; Bahroudi, A. Support vector machine for multi-classification of mineral prospectivity areas. Comput. Geosci. 2012, 46, 272–283. [Google Scholar] [CrossRef]
- Rodriguez-Galiano, V.; Sanchez-Castillo, M.; Chica-Olmo, M.; Chica-Rivas, M. Machine learning predictive models for mineral prospectivity: An evaluation of neural networks, random forest, regression trees and support vector machines. Ore Geol. Rev. 2015, 71, 804–818. [Google Scholar] [CrossRef]
- Adugna, T.; Xu, W.; Fan, J. Comparison of random forest and support vector machine classifiers for regional land cover mapping using coarse resolution FY-3C images. Remote Sens. 2022, 14, 574. [Google Scholar] [CrossRef]
- Nandan, M.; Khargpnekar, P.P.; Talathi, S.S. Fast SVM training using approximate extreme points. J. Mach. Learn. Res. 2014, 15, 59–98. [Google Scholar] [CrossRef]
- Milenova, B.L.; Yarmus, J.S.; Campos, M.M. SVM in oracle database 10g: Removing the barriers to widespread adoption of support vector machines. In Proceedings of the 31st International Conference on Very Large Data Bases, Trondheim, Norway, 30 August–2 September 2005; pp. 1152–1163. [Google Scholar]
- Rodriguez-Galiano, V.F.; Ghimire, B.; Rogan, J.; Chica-Olmo, M.; Rigol-Sanchez, J.P. An Assessment of the effectiveness of a random forest classifier for land-cover classification. ISPRS J. Photogramm. Remote Sens. 2012, 67, 93–104. [Google Scholar] [CrossRef]
- Ali, J.; Khan, R.; Ahmad, N.; Maqsood, I. Random forests and decision trees. Int. J. Comput. Sci. Issues 2012, 9, 272–278. [Google Scholar]
- Sheela, K.G.; Deepa, S.N. Review on methods to fix number of hidden neurons in neural networks. Math. Probl. Eng. 2013, 7, 391901. [Google Scholar] [CrossRef] [Green Version]
- Stathakis, D. How many hidden layers and nodes? Int. J. Remote Sens. 2009, 30, 2133–2147. [Google Scholar] [CrossRef]
- Nguyen, H.; Bui, X.N.; Bui, H.B.; Mai, N.L. A comparative study of artificial neural networks in predicting blast-induced air-blast overpressure at Deo Nai open-pit coal mine, Vietnam. Neural Comput. Appl. 2018, 32, 3939–3955. [Google Scholar] [CrossRef]
- Heaton, J. Introduction to Neural Networks with Java, 2nd ed.; Heaton Research, Inc.: Chesterfield, MO, USA, 2008; ISBN 9781604390087. [Google Scholar]
- Petropoulos, G.P.; Kontoes, C.C.; Keramitsoglou, I. Land cover mapping with emphasis to burnt area delineation using co-orbital ALI and Landsat TM imagery. Int. J. Appl. Earth. Obs. Geoinf. 2012, 18, 344–355. [Google Scholar] [CrossRef]
Figure 1.
Distribution of 13 agricultural reservoirs and two meteorological stations.

Figure 2.
Variations in the average daily reservoir storage rates from January 1991 to March 2022.
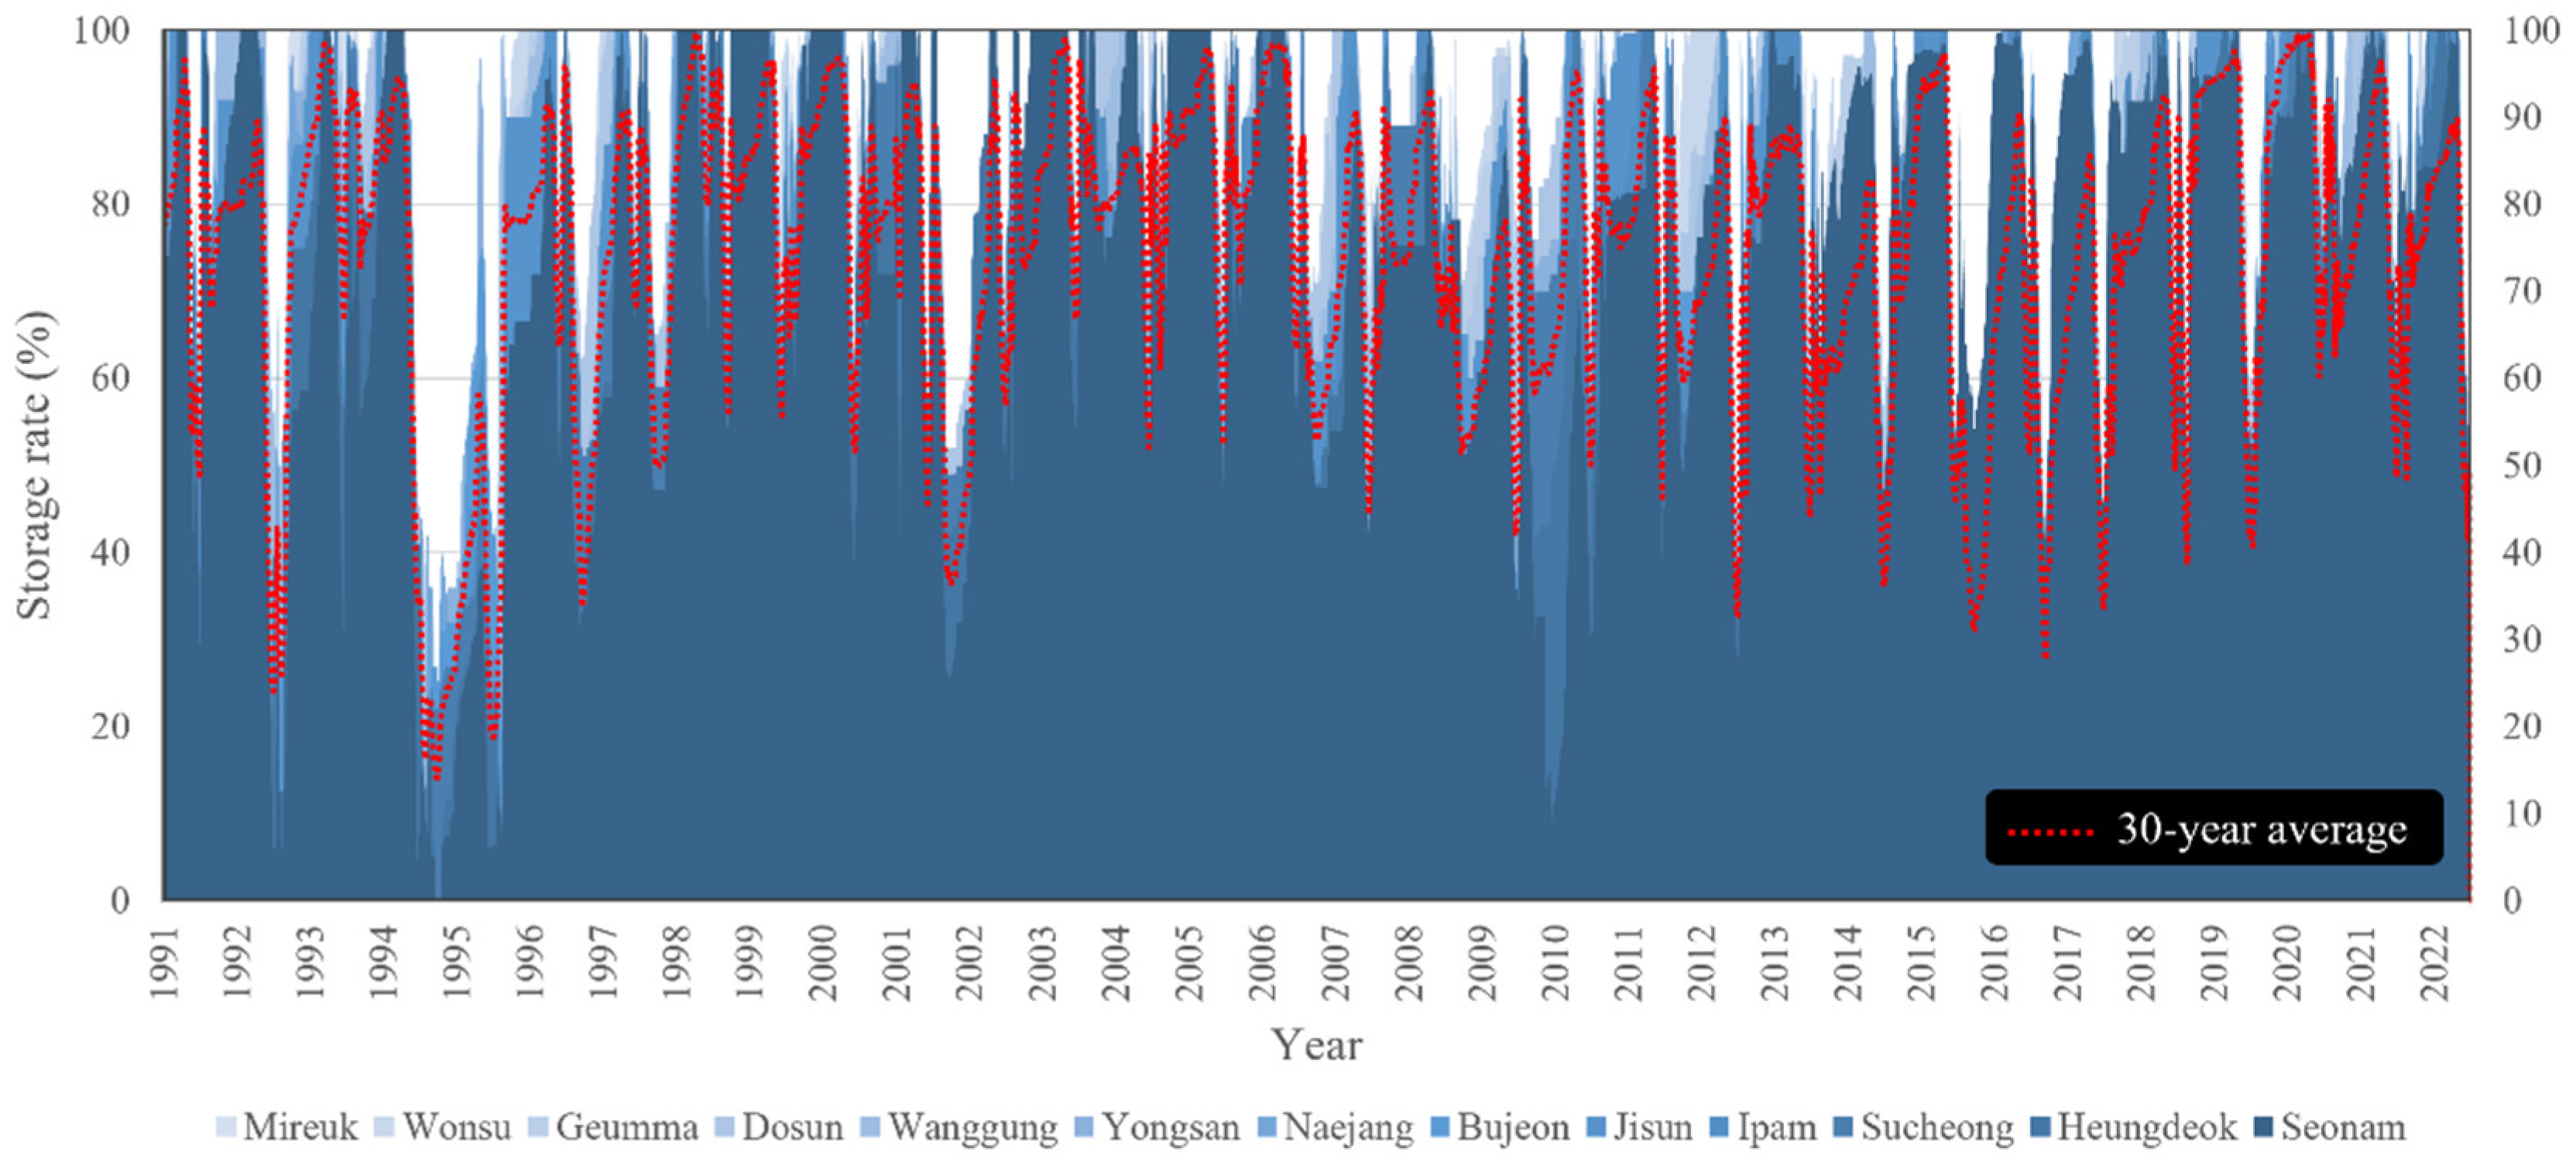
Figure 3.
Flowchart of forecasting reservoir storage rates using machine learning algorithms.

Figure 4.
Scatter plots of the observed and predicted monthly storage rates using (a) SVM, (b) RF, and (c) ANN algorithms (one-month forecast).
Figure 4.
Scatter plots of the observed and predicted monthly storage rates using (a) SVM, (b) RF, and (c) ANN algorithms (one-month forecast).
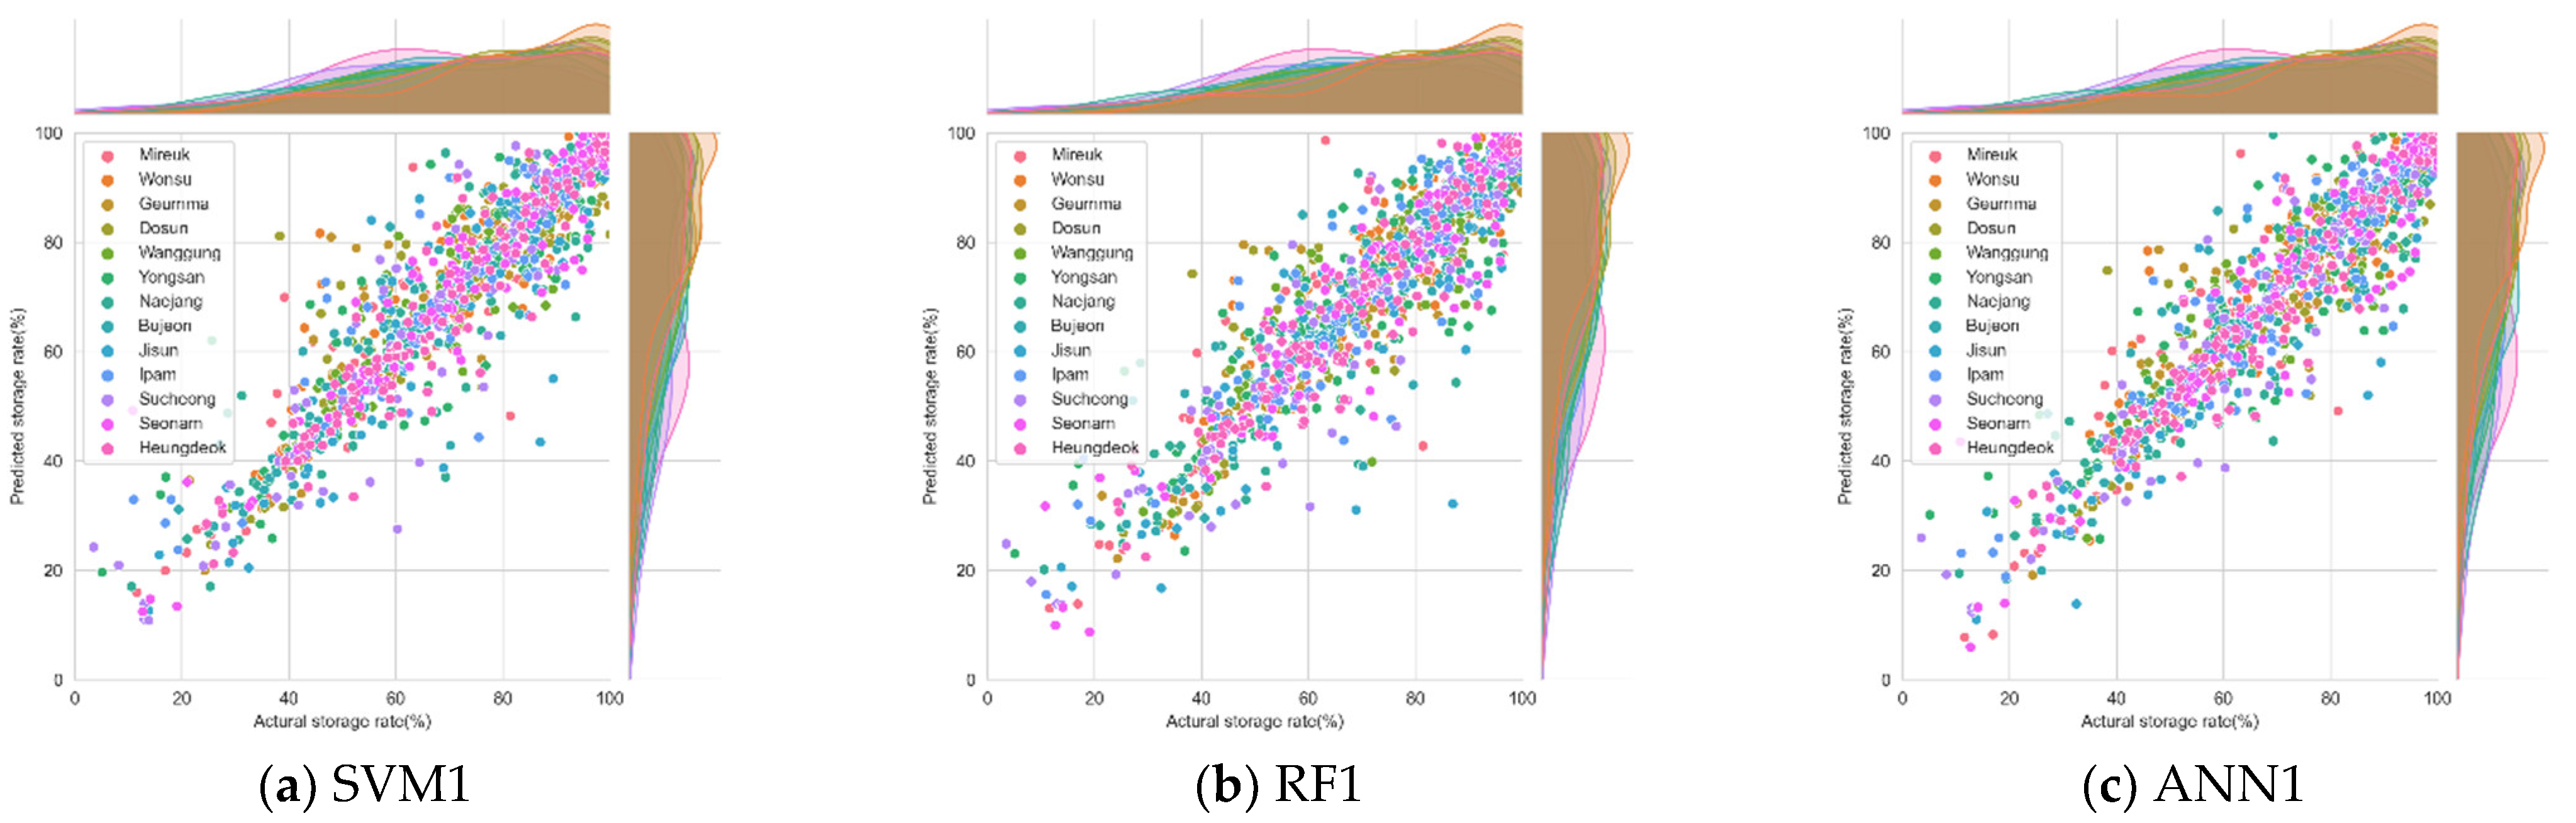
Figure 5.
Scatter plots of the observed and predicted monthly storage rates using (a) SVM, (b) RF, and (c) ANN algorithms (two-month forecast).
Figure 5.
Scatter plots of the observed and predicted monthly storage rates using (a) SVM, (b) RF, and (c) ANN algorithms (two-month forecast).
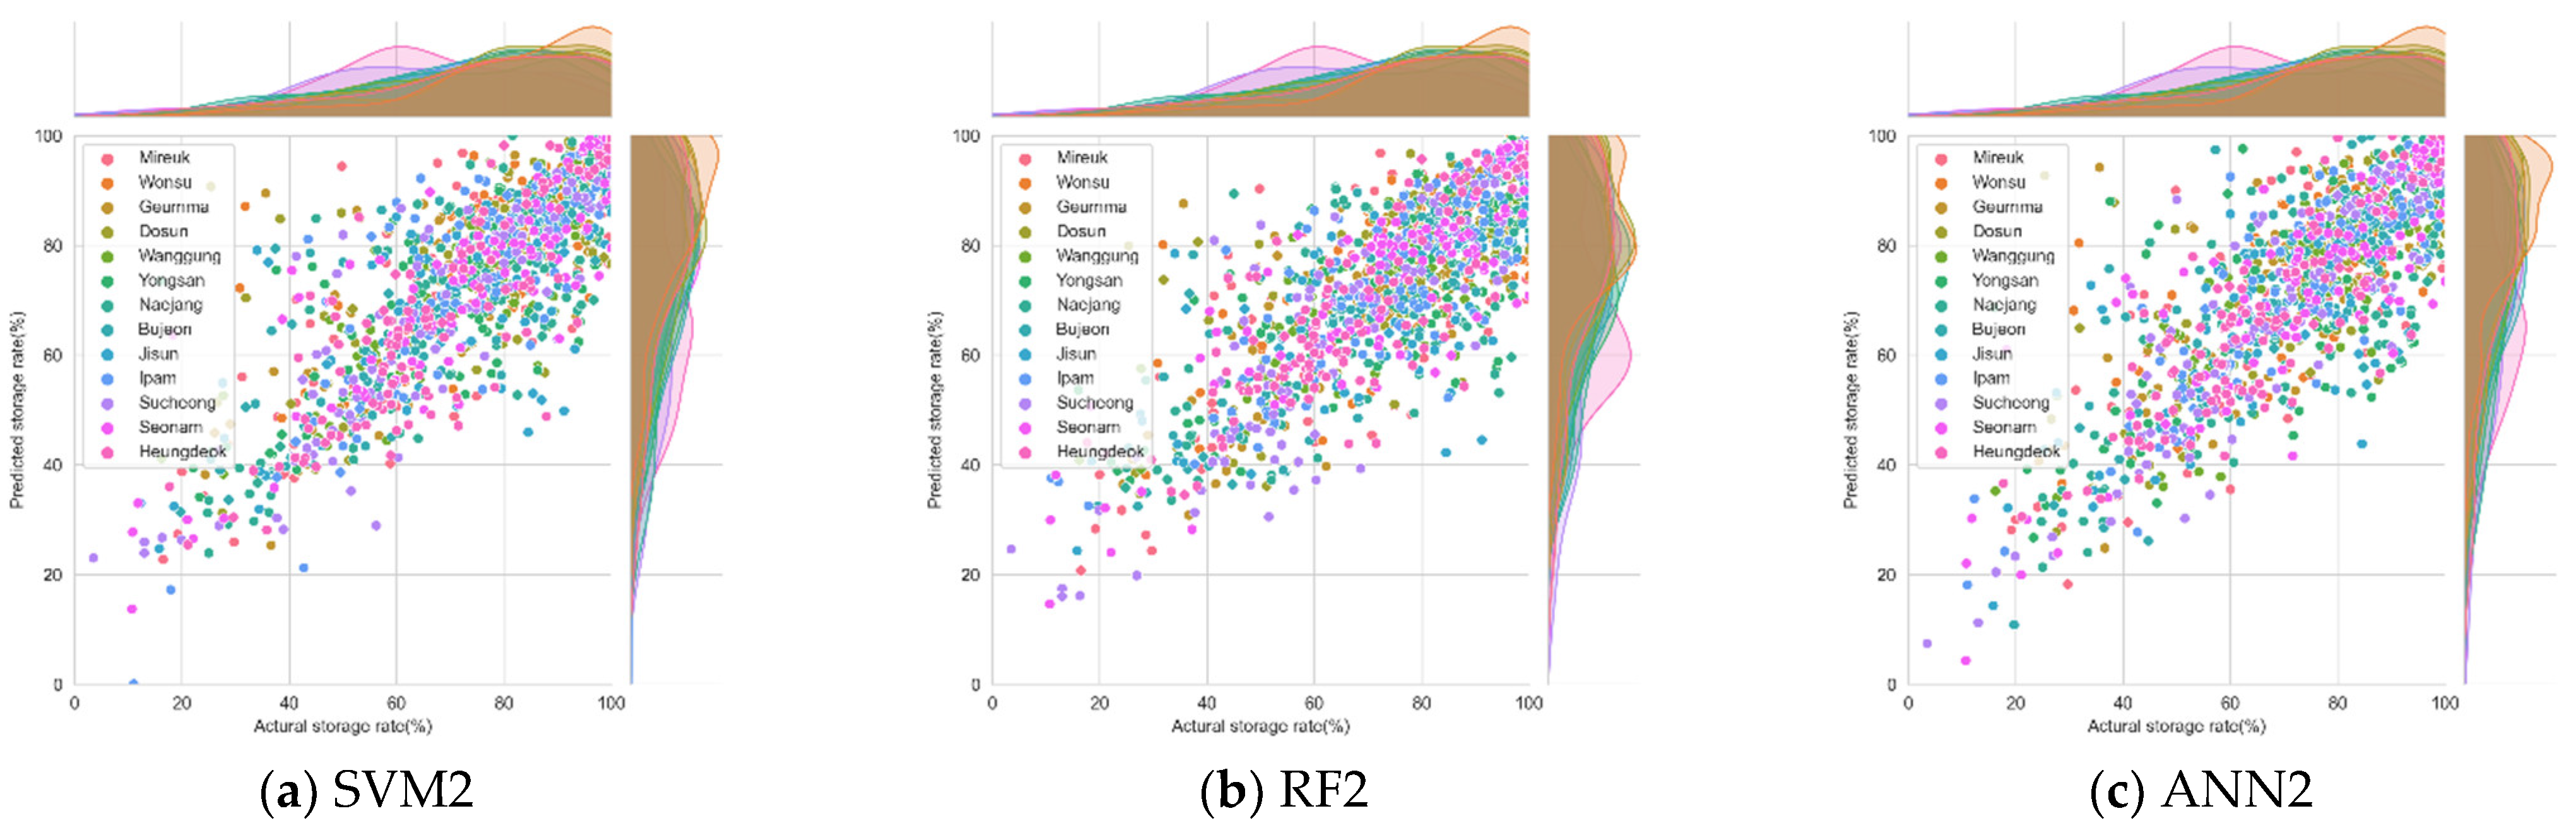
Figure 6.
Scatter plots of the observed and predicted monthly storage rates by (a) SVM, (b) RF, and (c) ANN algorithms (three-month forecast).
Figure 6.
Scatter plots of the observed and predicted monthly storage rates by (a) SVM, (b) RF, and (c) ANN algorithms (three-month forecast).

Table 1.
Statistics on the specifications and storage rates of studied agricultural reservoirs (1991–2021).
Table 1.
Statistics on the specifications and storage rates of studied agricultural reservoirs (1991–2021).
| Reservoir | Specification | Storage Rate (%) | |||||
|---|---|---|---|---|---|---|---|
| Total Storage (1000 m3) | Effective Storage (1000 m3) | Irrigated Paddy Field Area (ha) | Avg. | Min. | Max. | Std. | |
| Mireuk | 1320 | 1270 | 296.7 | 76.0 | 0 | 100 | 24.1 |
| Wonsu | 602 | 602 | 169.4 | 83.1 | 16 | 100 | 20.0 |
| Geumma | 935 | 818 | 229.1 | 78.1 | 9.3 | 100 | 21.7 |
| Dosun | 560 | 538 | 154.4 | 79.6 | 11.5 | 100 | 20.7 |
| Wanggung | 1957 | 1941 | 540.6 | 78.3 | 3.0 | 100 | 21.4 |
| Yongsan | 2447 | 2439 | 390.3 | 73.0 | 0 | 100 | 22.4 |
| Naejang | 4832 | 4828 | 591.6 | 69.8 | 2.0 | 100 | 23.4 |
| Bujeon | 1752 | 1732 | 249.0 | 71.9 | 8.0 | 100 | 20.1 |
| Jisun | 620 | 620 | 122.4 | 74.5 | 0 | 100 | 23.9 |
| Ipam | 3661 | 3482 | 522.4 | 74.0 | 0 | 100 | 22.5 |
| Sucheong | 7218 | 7001 | 540.3 | 64.7 | 1.0 | 100 | 23.7 |
| Seonam | 853 | 853 | 223.6 | 75.4 | 0 | 100 | 23.6 |
| Heungdeok | 9946 | 9946 | 2739.0 | 65.3 | 0 | 100 | 20.6 |
Avg.: Average, Min.: Minimum, Max.: Maximum, Std.: Standard deviation.
Table 2.
Statistics of rainfall and reference evapotranspiration in the studied agricultural reservoirs (1991–2021).
Table 2.
Statistics of rainfall and reference evapotranspiration in the studied agricultural reservoirs (1991–2021).
| Meteorological Station | Rainfall (mm/yr) | ETo (mm/yr) | Reservoirs | ||||||
|---|---|---|---|---|---|---|---|---|---|
| Avg. | Min. | Max. | Std. | Avg. | Min. | Max. | Std. | ||
| Jeonju | 1293.1 | 813.5 | 1860.3 | 271.2 | 911.6 | 833.9 | 979.7 | 40.3 | Mireuk, Wonsu, Geumma, Dosun, and Wanggung |
| Jeongeup | 1330.5 | 826.6 | 1917.3 | 286.4 | 872.2 | 786.8 | 960.2 | 43.4 | Yongsan, Naejang, Bujeon, Jisun, Ipam, Heungdeok, Seonam, and Sucheong |
Avg.: Average, Min.: Minimum, Max.: Maximum, Std.: Standard deviation.
Table 3.
Hyperparameter settings for SVM, RF, and ANN algorithms, respectively.
| Algorithm | Hyperparameter | Possible Values | Iteration | CV |
|---|---|---|---|---|
| SVM | kernel | rbf | 200 | 5-fold |
| gamma | scale | |||
| C | uniform (10, 300) | |||
| epsilon | uniform (0.0001, 1) | |||
| RF | criterion | mean squared error | ||
| n estimators | randint (100, 500) | |||
| Max depth | randint (5,10) | |||
| ANN | max iter | 50,000 | ||
| learning rate | adaptive | |||
| batch size | auto | |||
| activation | tanh, relu | |||
| solver (optimizer) | lbfgs, adam | |||
| hidden layer size | randint (1, 30) |
uniform: Return random floats from low (inclusive) to high (exclusive), randint: Return random integers from low (inclusive) to high (exclusive), CV: cross validation.
Table 4.
Setup of nine dataset models for forecasting reservoir storage rates using machine learning algorithms.
Table 4.
Setup of nine dataset models for forecasting reservoir storage rates using machine learning algorithms.
| Models | Algorithms | Label | Features |
|---|---|---|---|
| SVM1 | SVM | AS(m + 1) | ESm, CPm+1, CEm+1 |
| RF1 | RF | ||
| ANN1 | ANN | ||
| SVM2 | SVM | AS(m + 2) | ESm, CPm+1, CPm+2, CEm+1, CEm+2 |
| RF2 | RF | ||
| ANN2 | ANN | ||
| SVM3 | SVM | AS(m + 3) | ESm, CPm+1, CPm+2, CPm+3, CEm+1, CEm+2, CEm+3 |
| RF3 | RF | ||
| ANN3 | ANN |
AS: Average storage rate, ES: storage rate on the last day of the month, CP: monthly cumulative rainfall, CE: monthly cumulative standard evapotranspiration, and m: current period (month), m + 1: after one month, m + 2: after two months, and m + 3: after three months.
Table 5.
Performance of applied models in the training and test phases for one-month forecasting.
| Reservoir | SVM1 | RF1 | ANN1 | |||||||||||||||
|---|---|---|---|---|---|---|---|---|---|---|---|---|---|---|---|---|---|---|
| Training | Test | Training | Test | Training | Test | |||||||||||||
| RMSE | MAE | R2 | RMSE | MAE | R2 | RMSE | MAE | R2 | RMSE | MAE | R2 | RMSE | MAE | R2 | RMSE | MAE | R2 | |
| Mireuk | 6.4 | 3.60 | 0.93 | 7.7 | 4.75 | 0.88 | 3.4 | 2.26 | 0.98 | 8.1 | 4.91 | 0.87 | 5.8 | 3.64 | 0.94 | 7.8 | 4.96 | 0.88 |
| Wonsu | 5.7 | 3.14 | 0.91 | 6.8 | 3.96 | 0.87 | 2.6 | 1.63 | 0.98 | 6.6 | 4.27 | 0.88 | 5.6 | 3.46 | 0.92 | 7.2 | 4.63 | 0.85 |
| Geumma | 5.0 | 2.94 | 0.95 | 7.2 | 4.42 | 0.87 | 2.4 | 1.53 | 0.99 | 7.5 | 4.71 | 0.86 | 4.6 | 2.89 | 0.96 | 6.9 | 4.42 | 0.88 |
| Dosun | 5.1 | 2.86 | 0.94 | 7.4 | 4.29 | 0.85 | 2.8 | 1.83 | 0.98 | 7.3 | 4.57 | 0.85 | 5.6 | 3.60 | 0.93 | 7.0 | 4.32 | 0.87 |
| Wanggung | 5.1 | 2.73 | 0.94 | 6.5 | 4.12 | 0.89 | 2.4 | 1.55 | 0.99 | 7.2 | 4.62 | 0.86 | 4.8 | 2.97 | 0.95 | 6.6 | 4.39 | 0.88 |
| Yongsan | 5.6 | 3.25 | 0.93 | 8.9 | 5.69 | 0.83 | 2.9 | 2.02 | 0.98 | 9.5 | 6.32 | 0.81 | 6.4 | 4.36 | 0.91 | 9.0 | 6.11 | 0.83 |
| Naejang | 6.9 | 4.47 | 0.90 | 8.5 | 5.77 | 0.87 | 3.7 | 2.66 | 0.97 | 9.2 | 6.33 | 0.85 | 7.4 | 5.21 | 0.88 | 8.3 | 5.96 | 0.88 |
| Bujeon | 6.1 | 3.87 | 0.90 | 6.5 | 3.97 | 0.89 | 4.0 | 2.87 | 0.96 | 8.0 | 5.17 | 0.84 | 5.6 | 3.88 | 0.91 | 6.7 | 4.19 | 0.89 |
| Jisun | 7.2 | 3.93 | 0.90 | 9.0 | 5.35 | 0.83 | 3.4 | 2.2 | 0.98 | 9.5 | 5.41 | 0.81 | 7.7 | 4.61 | 0.89 | 7.9 | 4.80 | 0.86 |
| Ipam | 5.4 | 3.36 | 0.94 | 7.8 | 4.68 | 0.86 | 3.1 | 2.22 | 0.98 | 8.1 | 5.35 | 0.84 | 4.5 | 3.22 | 0.96 | 7.7 | 5.10 | 0.86 |
| Sucheong | 5.6 | 3.11 | 0.94 | 8.1 | 4.82 | 0.89 | 2.8 | 1.89 | 0.98 | 8.2 | 5.46 | 0.88 | 5.7 | 3.74 | 0.94 | 7.0 | 4.42 | 0.91 |
| Seonam | 6.7 | 4.12 | 0.91 | 7.2 | 4.56 | 0.89 | 3.1 | 2.09 | 0.98 | 7.5 | 5.04 | 0.89 | 6.2 | 4.18 | 0.92 | 7.5 | 4.83 | 0.88 |
| Heungdeok | 5.7 | 3.53 | 0.92 | 6.6 | 4.55 | 0.88 | 2.7 | 1.84 | 0.98 | 7.2 | 5.09 | 0.86 | 5.9 | 4.18 | 0.91 | 6.6 | 4.75 | 0.88 |
Table 6.
Results of best parameters and learning time of models for one-month forecasting.
| Reservoir | Hyperparameter Optimization | Learning Time (sec.) | ||||||||
|---|---|---|---|---|---|---|---|---|---|---|
| SVM1 | RF1 | ANN1 | SVM1 | RF1 | ANN1 | |||||
| C | ε | D | n | A | S | H | ||||
| Mireuk | 24.2 | 0.14 | 7 | 214 | relu | lbfgs | 14 | 0.004 | 0.572 | 4.161 |
| Wonsu | 22.9 | 0.13 | 8 | 145 | relu | lbfgs | 15 | 0.004 | 0.629 | 3.584 |
| Geumma | 24.9 | 0.76 | 9 | 484 | relu | lbfgs | 23 | 0.004 | 0.588 | 4.352 |
| Dosun | 91.5 | 0.06 | 7 | 109 | relu | lbfgs | 7 | 0.004 | 0.649 | 3.928 |
| Wanggung | 63.9 | 0.05 | 9 | 182 | relu | lbfgs | 17 | 0.005 | 0.630 | 3.594 |
| Yongsan | 108.1 | 0.25 | 8 | 235 | relu | lbfgs | 12 | 0.005 | 0.626 | 4.173 |
| Naejang | 105.6 | 0.98 | 9 | 467 | relu | lbfgs | 13 | 0.004 | 0.610 | 3.906 |
| Bujeon | 19.3 | 0.96 | 6 | 485 | relu | lbfgs | 8 | 0.004 | 0.636 | 4.215 |
| Jisun | 99.4 | 0.06 | 9 | 332 | relu | lbfgs | 6 | 0.004 | 0.643 | 4.876 |
| Ipam | 45.7 | 0.75 | 7 | 101 | relu | lbfgs | 26 | 0.005 | 0.644 | 4.263 |
| Sucheong | 108.3 | 0.04 | 9 | 140 | relu | lbfgs | 6 | 0.005 | 0.643 | 3.598 |
| Seonam | 29.8 | 0.31 | 9 | 436 | relu | lbfgs | 8 | 0.004 | 0.641 | 4.371 |
| Heungdeok | 51.7 | 0.74 | 9 | 114 | relu | lbfgs | 12 | 0.005 | 0.669 | 4.429 |
C: penalty constant, ε: epsilon, D: max depth, n: n estimators, A: activation, S: solver, and H: hidden layer size.
Table 7.
Performance of applied models in the training and test phases for two-month forecasting.
| Reservoir | SVM2 | RF2 | ANN2 | |||||||||||||||
|---|---|---|---|---|---|---|---|---|---|---|---|---|---|---|---|---|---|---|
| Training | Test | Training | Test | Training | Test | |||||||||||||
| RMSE | MAE | R2 | RMSE | MAE | R2 | RMSE | MAE | R2 | RMSE | MAE | R2 | RMSE | MAE | R2 | RMSE | MAE | R2 | |
| Mireuk | 11.1 | 6.27 | 0.79 | 11.5 | 7.75 | 0.73 | 5.1 | 3.33 | 0.95 | 12.6 | 8.74 | 0.67 | 10.3 | 6.80 | 0.81 | 11.8 | 8.40 | 0.71 |
| Wonsu | 11.0 | 5.74 | 0.69 | 10.3 | 6.30 | 0.66 | 4.8 | 3.14 | 0.94 | 11.0 | 7.52 | 0.61 | 10.7 | 7.06 | 0.71 | 10.3 | 7.26 | 0.66 |
| Geumma | 9.9 | 5.74 | 0.80 | 11.3 | 7.32 | 0.68 | 4.2 | 2.8 | 0.96 | 10.7 | 7.31 | 0.71 | 9.5 | 6.52 | 0.81 | 11.3 | 7.91 | 0.67 |
| Dosun | 8.8 | 5.57 | 0.81 | 12.6 | 7.57 | 0.57 | 4.0 | 2.76 | 0.96 | 12.2 | 7.99 | 0.6 | 8.4 | 6.02 | 0.83 | 12.6 | 7.97 | 0.57 |
| Wanggung | 8.7 | 5.31 | 0.84 | 8.7 | 5.64 | 0.79 | 3.9 | 2.5 | 0.97 | 8.7 | 5.84 | 0.8 | 8.4 | 5.97 | 0.85 | 9.3 | 7.02 | 0.77 |
| Yongsan | 10.3 | 6.78 | 0.77 | 13.0 | 9.08 | 0.61 | 5.1 | 3.66 | 0.94 | 13.6 | 10.13 | 0.58 | 9.5 | 6.72 | 0.81 | 14.7 | 9.94 | 0.50 |
| Naejang | 10.5 | 7.10 | 0.78 | 12.3 | 9.33 | 0.69 | 5.6 | 4.37 | 0.94 | 13.7 | 10.96 | 0.61 | 10.6 | 7.81 | 0.78 | 13.6 | 10.78 | 0.62 |
| Bujeon | 8.4 | 5.78 | 0.81 | 10.9 | 7.42 | 0.70 | 7.0 | 5.48 | 0.87 | 11.1 | 7.79 | 0.68 | 7.2 | 5.41 | 0.86 | 10.7 | 7.50 | 0.71 |
| Jisun | 12.0 | 7.59 | 0.74 | 13.2 | 8.84 | 0.59 | 5.2 | 3.61 | 0.95 | 13.0 | 9.53 | 0.6 | 11.9 | 8.37 | 0.75 | 12.6 | 9.22 | 0.62 |
| Ipam | 7.8 | 4.80 | 0.88 | 10.5 | 7.34 | 0.71 | 4.4 | 3.27 | 0.96 | 11.0 | 8.05 | 0.68 | 7.8 | 5.44 | 0.88 | 9.4 | 6.90 | 0.77 |
| Sucheong | 8.2 | 5.41 | 0.88 | 10.2 | 7.30 | 0.79 | 4.2 | 3.2 | 0.97 | 11.0 | 7.75 | 0.76 | 7.7 | 5.58 | 0.89 | 9.9 | 7.01 | 0.81 |
| Seonam | 10.0 | 6.83 | 0.80 | 11.0 | 7.29 | 0.76 | 4.9 | 3.65 | 0.95 | 10.5 | 7.31 | 0.78 | 9.3 | 6.88 | 0.83 | 11.7 | 8.01 | 0.72 |
| Heungdeok | 9.2 | 6.03 | 0.80 | 10.8 | 7.91 | 0.64 | 4.5 | 3.36 | 0.95 | 11.0 | 7.99 | 0.63 | 9.7 | 7.27 | 0.77 | 9.8 | 7.46 | 0.70 |
Table 8.
Results of best parameters and learning time of models for two-month forecasting.
| Reservoir | Hyperparameter Optimization | Learning Time (sec.) | ||||||||
|---|---|---|---|---|---|---|---|---|---|---|
| SVM2 | RF2 | ANN2 | SVM2 | RF2 | ANN2 | |||||
| C | ε | D | n | A | S | H | ||||
| Mireuk | 17.7 | 0.04 | 9 | 106 | tanh | adam | 28 | 0.005 | 0.688 | 4.269 |
| Wonsu | 26.6 | 0.02 | 9 | 105 | tanh | adam | 25 | 0.005 | 0.699 | 3.856 |
| Geumma | 18.6 | 0.09 | 9 | 186 | tanh | adam | 23 | 0.004 | 0.671 | 4.441 |
| Dosun | 14 | 0.09 | 9 | 159 | tanh | adam | 17 | 0.005 | 0.695 | 4.803 |
| Wanggung | 14 | 0.09 | 9 | 329 | tanh | adam | 16 | 0.005 | 0.669 | 4.365 |
| Yongsan | 21.2 | 0.01 | 8 | 228 | relu | lbfgs | 9 | 0.004 | 0.704 | 3.590 |
| Naejang | 49.8 | 0.05 | 9 | 432 | relu | lbfgs | 10 | 0.007 | 0.691 | 3.827 |
| Bujeon | 14.8 | 0.08 | 5 | 434 | relu | lbfgs | 10 | 0.004 | 0.702 | 4.376 |
| Jisun | 24.2 | 0.08 | 9 | 491 | tanh | adam | 25 | 0.004 | 0.675 | 4.141 |
| Ipam | 106 | 0.01 | 8 | 257 | relu | lbfgs | 12 | 0.004 | 0.667 | 3.916 |
| Sucheong | 16 | 0.1 | 8 | 119 | relu | lbfgs | 5 | 0.005 | 0.690 | 3.550 |
| Seonam | 28.9 | 0.07 | 9 | 125 | tanh | adam | 28 | 0.004 | 0.676 | 4.320 |
| Heungdeok | 47.5 | 0.09 | 9 | 288 | relu | adam | 17 | 0.004 | 0.675 | 3.892 |
C: penalty constant, ε: epsilon, D: max depth, n: n estimators, A: activation, S: solver, and H: hidden layer size.
Table 9.
Performance of applied models in the training and test phases for three-month forecasting.
| Reservoir | SVM3 | RF3 | ANN3 | |||||||||||||||
|---|---|---|---|---|---|---|---|---|---|---|---|---|---|---|---|---|---|---|
| Training | Test | Training | Test | Training | Test | |||||||||||||
| RMSE | MAE | R2 | RMSE | MAE | R2 | RMSE | MAE | R2 | RMSE | MAE | R2 | RMSE | MAE | R2 | RMSE | MAE | R2 | |
| Mireuk | 11.9 | 6.72 | 0.75 | 12.2 | 8.74 | 0.71 | 9.3 | 6.56 | 0.85 | 13.9 | 9.97 | 0.62 | 12.0 | 8.11 | 0.74 | 11.8 | 8.62 | 0.73 |
| Wonsu | 11.7 | 6.11 | 0.65 | 10.9 | 6.69 | 0.64 | 6.1 | 4.36 | 0.90 | 11.1 | 7.59 | 0.63 | 11.0 | 7.42 | 0.69 | 12.0 | 8.81 | 0.56 |
| Geumma | 11.4 | 6.15 | 0.73 | 14.4 | 9.56 | 0.50 | 5.5 | 3.70 | 0.94 | 13.7 | 9.18 | 0.55 | 11.2 | 7.29 | 0.74 | 13.4 | 9.04 | 0.57 |
| Dosun | 9.2 | 5.50 | 0.79 | 14.5 | 9.41 | 0.50 | 4.7 | 3.38 | 0.94 | 14.6 | 9.47 | 0.49 | 10.0 | 7.01 | 0.75 | 15.5 | 10.50 | 0.43 |
| Wanggung | 8.8 | 5.16 | 0.82 | 10.1 | 7.24 | 0.76 | 5.7 | 4.02 | 0.93 | 10.5 | 7.42 | 0.74 | 9.1 | 6.32 | 0.81 | 9.4 | 7.01 | 0.79 |
| Yongsan | 10.7 | 7.05 | 0.74 | 14.3 | 10.32 | 0.57 | 6.2 | 4.64 | 0.91 | 15.1 | 11.24 | 0.52 | 11.5 | 8.60 | 0.70 | 14.7 | 10.89 | 0.55 |
| Naejang | 11.8 | 8.30 | 0.71 | 13.3 | 10.00 | 0.67 | 6.9 | 5.68 | 0.90 | 15.1 | 12.01 | 0.57 | 12.9 | 10.44 | 0.66 | 13.4 | 10.73 | 0.66 |
| Bujeon | 8.9 | 5.81 | 0.79 | 10.1 | 7.38 | 0.73 | 5.8 | 4.59 | 0.91 | 11.5 | 8.51 | 0.65 | 8.6 | 6.49 | 0.80 | 12.0 | 9.06 | 0.62 |
| Jisun | 11.9 | 7.71 | 0.74 | 14.0 | 10.11 | 0.57 | 6.1 | 4.51 | 0.93 | 14.9 | 11.25 | 0.52 | 12.9 | 9.82 | 0.69 | 13.6 | 10.29 | 0.60 |
| Ipam | 8.4 | 5.17 | 0.85 | 10.2 | 7.43 | 0.77 | 4.9 | 3.64 | 0.95 | 12.6 | 9.28 | 0.65 | 8.5 | 6.30 | 0.85 | 10.7 | 7.95 | 0.75 |
| Sucheong | 8.4 | 5.55 | 0.87 | 10.3 | 7.22 | 0.80 | 5.3 | 4.28 | 0.95 | 11.8 | 8.77 | 0.73 | 8.1 | 6.22 | 0.88 | 10.4 | 7.54 | 0.79 |
| Seonam | 10.2 | 6.59 | 0.80 | 12.4 | 8.94 | 0.69 | 7.8 | 5.86 | 0.88 | 14.0 | 10.08 | 0.60 | 11.7 | 8.57 | 0.73 | 12.3 | 9.22 | 0.69 |
| Heungdeok | 8.8 | 5.63 | 0.81 | 13.2 | 9.88 | 0.52 | 5.4 | 4.23 | 0.93 | 13.7 | 10.37 | 0.48 | 10.0 | 7.82 | 0.76 | 12.7 | 10.08 | 0.55 |
Table 10.
Results of best parameters and learning time of models for three-month forecasting.
| Reservoir | Hyperparameter Optimization | Learning Time (sec.) | ||||||||
|---|---|---|---|---|---|---|---|---|---|---|
| SVM3 | RF3 | ANN3 | SVM3 | RF3 | ANN3 | |||||
| C | ε | D | n | A | S | H | ||||
| Mireuk | 105.1 | 0.81 | 5 | 431 | tanh | adam | 26 | 0.007 | 0.745 | 4.722 |
| Wonsu | 109.4 | 0.24 | 7 | 199 | relu | lbfgs | 9 | 0.008 | 0.742 | 2.606 |
| Geumma | 104.7 | 0.83 | 8 | 123 | tanh | adam | 24 | 0.008 | 0.708 | 4.685 |
| Dosun | 111.1 | 0.11 | 8 | 203 | relu | lbfgs | 7 | 0.008 | 0.741 | 4.548 |
| Wanggung | 100.9 | 0.36 | 6 | 491 | tanh | adam | 28 | 0.008 | 0.703 | 4.664 |
| Yongsan | 100.2 | 1.01 | 7 | 320 | tanh | adam | 19 | 0.007 | 0.751 | 4.716 |
| Naejang | 101.6 | 0.37 | 8 | 121 | tanh | adam | 29 | 0.006 | 0.724 | 4.138 |
| Bujeon | 100.5 | 0.84 | 7 | 301 | relu | lbfgs | 11 | 0.007 | 0.760 | 3.878 |
| Jisun | 113.5 | 1.00 | 9 | 147 | tanh | adam | 17 | 0.006 | 0.736 | 4.537 |
| Ipam | 122.6 | 0.95 | 9 | 111 | tanh | adam | 13 | 0.008 | 0.732 | 4.670 |
| Sucheong | 104.4 | 0.87 | 7 | 443 | relu | lbfgs | 7 | 0.008 | 0.753 | 4.656 |
| Seonam | 249.7 | 1.06 | 6 | 100 | relu | lbfgs | 6 | 0.007 | 0.697 | 4.822 |
| Heungdeok | 248.8 | 0.88 | 8 | 128 | relu | lbfgs | 6 | 0.007 | 0.718 | 4.200 |
C: penalty constant, ε: epsilon, D: max depth, n: n estimators, A: activation, S: solver, and H: hidden layer size.
Publisher’s Note: MDPI stays neutral with regard to jurisdictional claims in published maps and institutional affiliations. |
© 2022 by the authors. Licensee MDPI, Basel, Switzerland. This article is an open access article distributed under the terms and conditions of the Creative Commons Attribution (CC BY) license (https://creativecommons.org/licenses/by/4.0/).
Share and Cite
MDPI and ACS Style
Kim, S.-J.; Bae, S.-J.; Lee, S.-J.; Jang, M.-W. Monthly Agricultural Reservoir Storage Forecasting Using Machine Learning. Atmosphere 2022, 13, 1887. https://doi.org/10.3390/atmos13111887
AMA Style
Kim S-J, Bae S-J, Lee S-J, Jang M-W. Monthly Agricultural Reservoir Storage Forecasting Using Machine Learning. Atmosphere. 2022; 13(11):1887. https://doi.org/10.3390/atmos13111887
Chicago/Turabian StyleKim, Soo-Jin, Seung-Jong Bae, Seung-Jae Lee, and Min-Won Jang. 2022. "Monthly Agricultural Reservoir Storage Forecasting Using Machine Learning" Atmosphere 13, no. 11: 1887. https://doi.org/10.3390/atmos13111887
Note that from the first issue of 2016, this journal uses article numbers instead of page numbers. See further details here.