Article

Evaluation of the Performance of CMIP6 Models in Reproducing Rainfall Patterns over North Africa

1
Binjiang College, Nanjing University of Information Science and Technology, Wuxi 214105, China
2
Jiangsu Key Laboratory of Atmospheric Environment Monitoring and Pollution Control, Collaborative Innovation Centre of Atmospheric Environment and Equipment Technology, School of Environmental Science and Engineering, Nanjing University of Information Science and Technology, Nanjing 210044, China
3
Key Laboratory of Meteorological Disaster, Ministry of Education (KLME)/Joint International Research Laboratory of Climate and Environment Change (ILCEC)/Collaborative Innovation Center on Forecast and Evaluation of Meteorological Disasters (CIC-FEMD), Nanjing University of Information Science and Technology, Nanjing 210044, China
4
Uganda National Meteorological Authority, Clement Hill Road, P.O. Box 7025 Kampala, Uganda
5
Department of Geography, Geoinformatics and Climatic Sciences, Makerere University, P.O. Box 7062 Kampala, Uganda
6
Jiangsu Key Laboratory of Atmospheric Environment Monitoring and Pollution Control (AEMPC), Collaborative Innovation Center of Atmospheric Environment and Equipment Technology (CIC-AEET), Nanjing University of Information Science &Technology, Nanjing 210044, China
7
International Water Research Institute (IWRI), Mohammed VI Polytechnic University, Lot 660, Hay Moulay Rachid, Ben Guerir 43150, Morocco
*
Author to whom correspondence should be addressed.
Atmosphere 2021, 12(4), 475; https://doi.org/10.3390/atmos12040475
Submission received: 22 February 2021 / Revised: 2 April 2021 / Accepted: 6 April 2021 / Published: 9 April 2021
(This article belongs to the Special Issue Historical and Future Changes in Sub-Saharan African Climate)

Abstract

:
This study assesses the performance of historical rainfall data from the Coupled Model Intercomparison Project phase 6 (CMIP6) in reproducing the spatial and temporal rainfall variability over North Africa. Datasets from Climatic Research Unit (CRU) and Global Precipitation Climatology Centre (GPCC) are used as proxy to observational datasets to examine the capability of 15 CMIP6 models’ and their ensemble in simulating rainfall during 1951–2014. In addition, robust statistical metrics, empirical cumulative distribution function (ECDF), Taylor diagram (TD), and Taylor skill score (TSS) are utilized to assess models’ performance in reproducing annual and seasonal and monthly rainfall over the study domain. Results show that CMIP6 models satisfactorily reproduce mean annual climatology of dry/wet months. However, some models show a slight over/under estimation across dry/wet months. The models’ overall top ranking from all the performance analyses ranging from mean cycle simulation, trend analysis, inter-annual variability, ECDFs, and statistical metrics are as follows: EC-Earth3-Veg, UKESM1-0-LL, GFDL-CM4, NorESM2-LM, IPSL-CM6A-LR, and GFDL-ESM4. The mean model ensemble outperformed the individual CMIP6 models resulting in a TSS ratio (0.79). For future impact studies over the study domain, it is advisable to employ the multi-model ensemble of the best performing models.

1. Introduction

Climate change is a major concern globally, particularly in the arid and semi-arid regions such as North Africa. The changes in climate directly affect many socio-economic activities. For instance, it affects agriculture, water availability and quality, energy, and food security, limiting socioeconomic growth [1]. According to several studies [2,3,4], the North African region is regarded as one of the climate change hotspots. Unfortunately, limited gauge stations hinder quantification and assessment of impacts of climate change over the region.
To better understand climate change and its effects on the past, current, and future environments, several tools have been employed to reproduce the climate patterns. One of the main tools is Global Circulation Models (GCMs) of the Coupled Model Inter-comparison Project (CMIP). Various phases of CMIP data can be found (CMIP—https://www.wcrp-climate.org/wgcm-cmip [Accessed 10 December 2020]). The latest CMIP dataset that is available for analysis is phase 6 (CMIP6 [5]). The CMIP6 models simulate the physics, chemistry, and biology of the atmosphere, terrestrial, and oceans in fine detail. The CMIP6 dataset differs from its predecessors: CMIP5 and CMIP3 datasets, in links of forcing scenarios and carbon emissions. The CMIP6 project uses an updated version of the coupled global climate models, a new beginning year, and a novel set of Shared Socioeconomic Pathways (SSP) scenarios [6].
Many studies have been conducted to assess the impact of climate change on the Northern Africa region. Some studies focusing on the variability of the annual rainfall and drought periods over the region have projected a decrease of annual rainfall between 2071 and 2100 over the Mediterranean by 20% compared to the period 1961–1990 [7,8,9,10]. Other studies [1,10,11,12,13] also reported that the annual rainfall over North Africa is likely to decrease in future. Furthermore, according to Intergovernmental Panel on Climate Change Fifth Assessment Report (IPCC AR5), the mean annual rainfall has decreased over the northern Africa region, with an abrupt reduction noted from 1968 to date [14]. Liebmann et al. [15] reported that the region received low annual rainfall amounts, and a downward trend. Massoud et al. [16] investigated the change of atmospheric rivers (ARs) and rainfall over the Middle East and North Africa (MENA) region. According to their study [16], the mean daily rainfall is projected to decrease by 15%–30% between 2070 and 2100. In a recent study, Almazroui et al. [17] investigated the performance of CMIP6 datasets over Africa and projected a steady reduction in rainfall over North Africa region in the 21st century.
While numerous studies have projected a decrease in rainfall over the Mediterranean region, few studies have delineated with precision the intensity, frequency or magnitude of the projected decline. Moreover, the sub-regional divergent tendencies remain a source of confusion to the relevant stakeholders over the region. To illustrate this, recent studies (e.g., [18,19,20]) have observed an increase in rainfall over some regions of Morocco and Tunisia. Such contradictory scientific opinions on the spatiotemporal variability of rainfall in a region already under absolute water scarcity result into more uncertainty to the general community. This situation calls for further studies that would accurately delineate the possible future rainfall patterns over the water scarce region of MENA. The advent of CMIP6 promises robust projections due to the advanced features that characterize the model outputs akin to predecessor versions used to examine past climate patterns over the North Africa. Presently, no regional study has investigated the performance of CMIP6 models in replicating or projecting the rainfall over the region in terms of their spatial and temporal variability.
As a first step, this study seeks to evaluate the capability of 15 CMIP6 GCMs in reproducing annual, seasonal and monthly rainfall patterns over the study region. The best performing models will be utilized in examining the possible future climate patterns for vigorous policy making and adaptations. The rest of the study is organized as follows: description of the study region, data, and methods used are presented in Section 2. Section 3 outlines results and discussion, while Section 4 presents the summary and conclusion of the study.

2. Materials and Methods
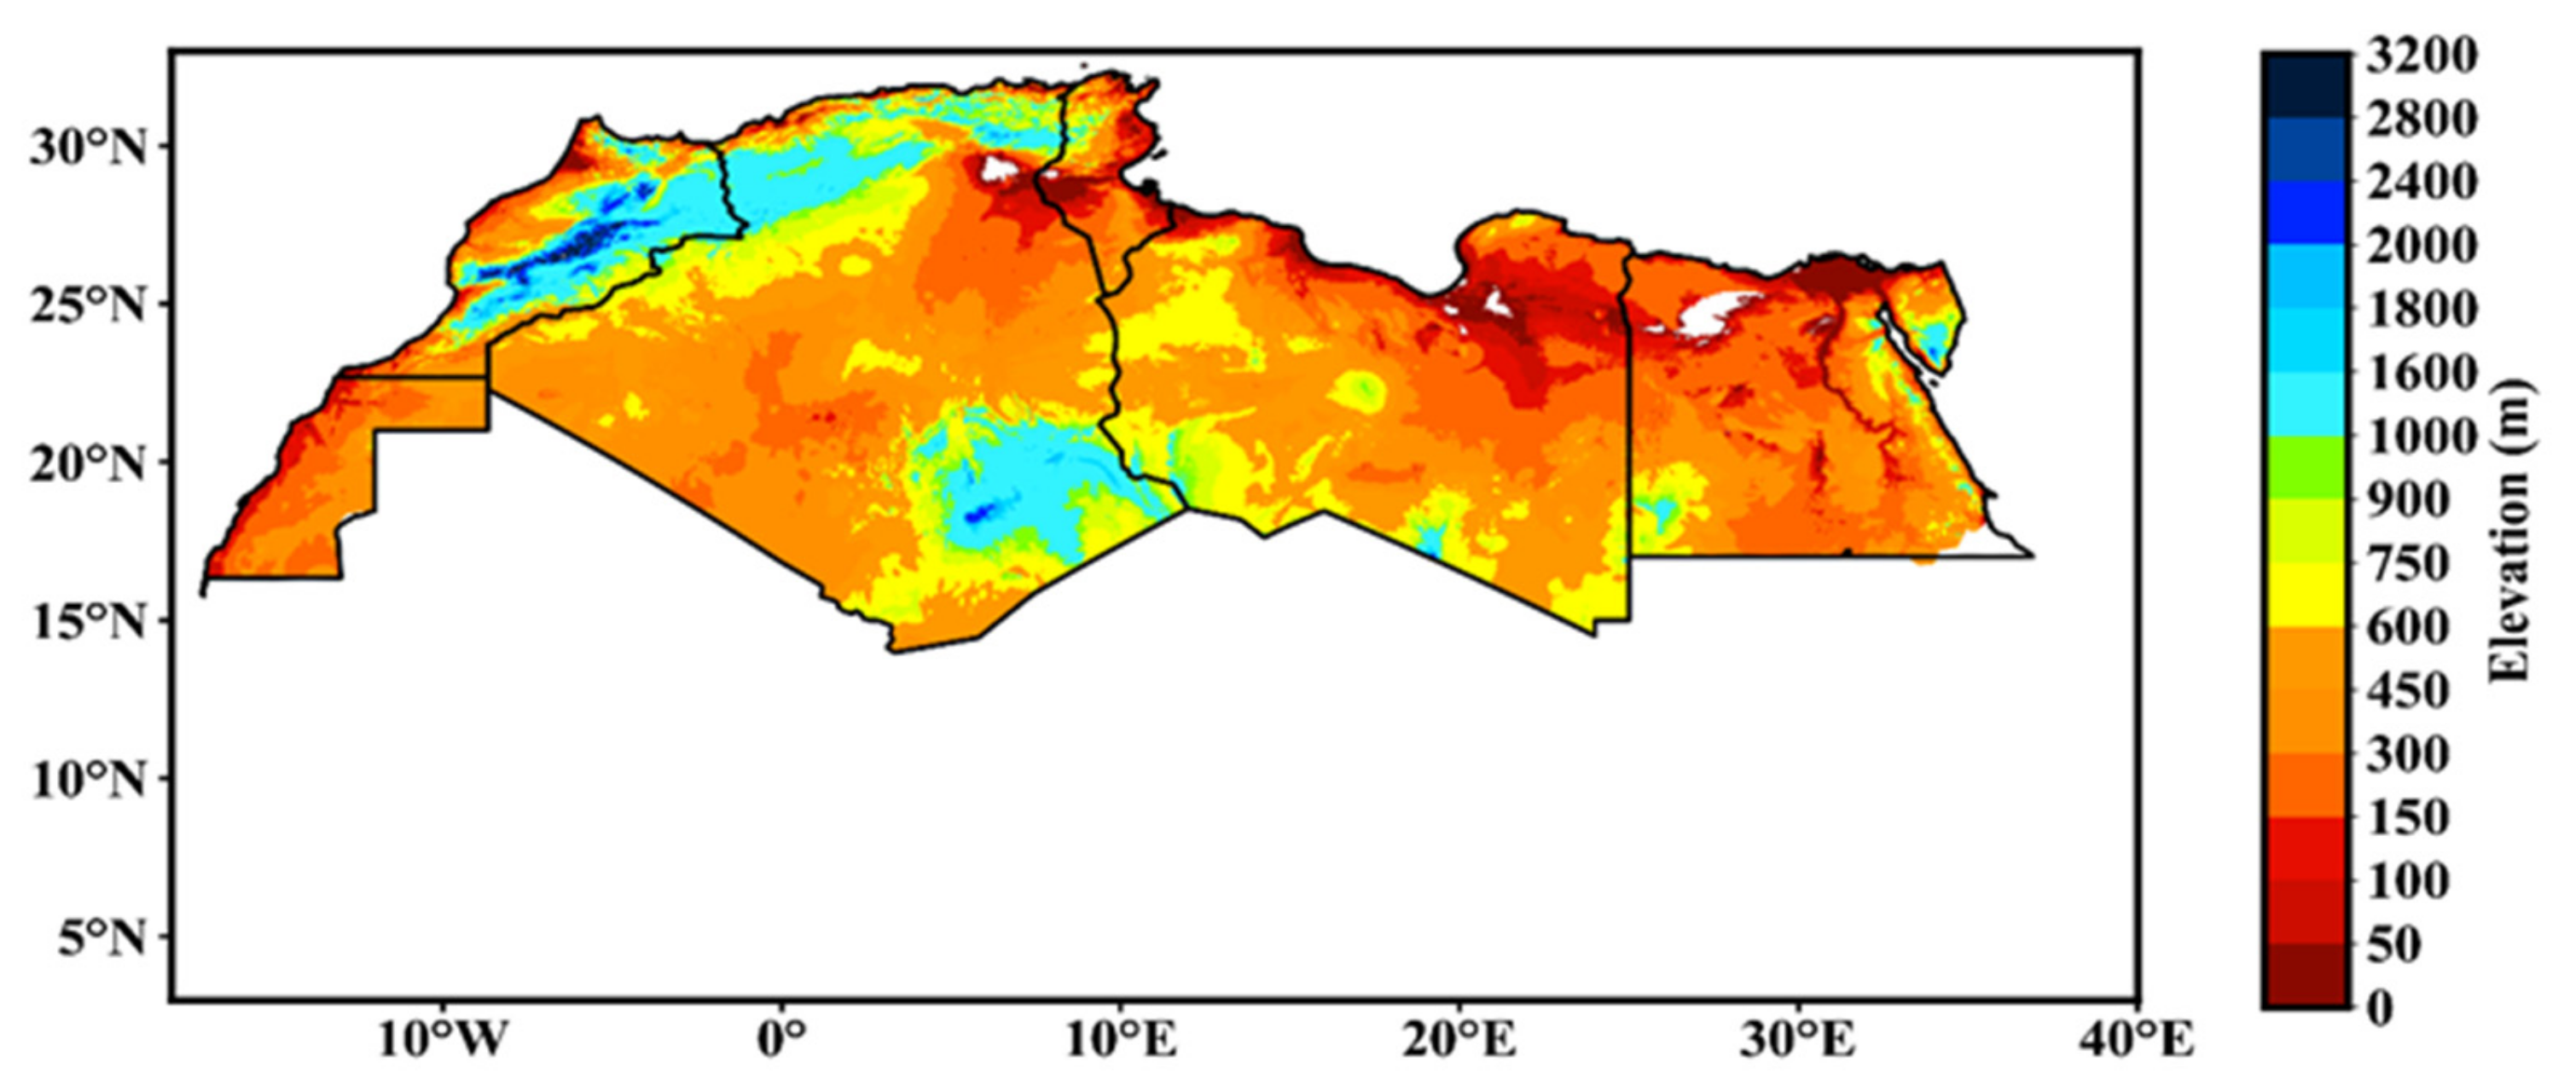
2.1. Study Domain

The study domain of the present work is confined with longitude 20° W and 38° E and latitude 19° and 37° N (Figure 1). The climate of North Africa varies greatly between coastline and inner domains of the region. North Africa has a Mediterranean climate along the coast, which is characterized by mild, wet winters and warm, dry summers, with plenty rainfall of approximately 400 to 600 mm per year. Inland, the countries of North Africa experience semiarid and arid desert climates, which are characterized by extremes in daily high and low temperatures, little rainfall of about 200 to 400 mm per year for semiarid areas and <100 mm per year for desert regions. The region is situated at the boundary of the subtropics and mid-latitudes. The changes in rainfall over the domain are attributed to different factors, such as the Hadley circulation and winter storms [16]. For instance, the changes in Hadley circulation have led to the observed decline in rainfall over the study due to the significant strengthening of Azores high pressure. Seasonal variability of rainfall is mainly influenced by the formation and passage of cyclonic disturbances. Furthermore, the spatial variability is due to the complex topography landscape [21,22]. Although the study domain has 4 distinct seasons [2,22,23,24,25,26], this work will mainly focus on two seasons: winter (December–February [DJF]) and summer (June–August [JJA]).

2.2. Data

In this study, simulated data from 15 CMIP6 model simulations alongside their ensemble were investigated. The choice for the model outputs was informed by the availability of the CMIP6 models with complete first ensemble member (r1i1p1f1) at the time of analysis. Moreover, the listed models were not sensitive to the other ensemble members. Our initial analysis using the first three ensembles’ members for two randomly selected models (NorESM2-LM and IPSL-CM6A-LR) indicated that the results were not sensitive to the ensemble member selected, with no statistically significant difference between the ensemble members and mean rainfall over North Africa. Details of the models used in this study are summarized in Table A1. More information about CMIP6 models can be found in Eyring et al. [5]. The model simulations were compared with two gauge derived gridded datasets in the absence of quality rain-gauge observational datasets to minimize uncertainty. The two datasets were Climatic Research Unit (CRU TS v. 4.04) [27], and the global precipitation analysis products of the Global Precipitation Climatology Centre (GPCC) version 2020 [28], for the period 1951–2014. For comparison, all datasets were initially re-gridded to a standard resolution (2.81° × 2.81°) of one of the participating models with the lowest resolution. The interpolation was done using the bilinear interpolation method to allow the evaluations to be made at an equal resolution.

2.3. Methods

2.3.1. Statistical Validation of CMIP6

The robustness of each CMIP6 model outputs and their ensemble was assessed at annual, seasonal (i.e., DJF), and monthly time scales by comparing rainfall estimates with the two gridded observations. In this work, the average of all CMIP6 dataset was considered as the ensemble mean. The annual and seasonal means were calculated from monthly data. Furthermore, the mean climatological description is presented by showing the spatial rainfall pattern of inter-annual variability. A student t-test was applied to examine the significance of the difference between observations and the model datasets. A typical significance level of 0.05 was employed. CMIP6 simulations were further evaluated based on statistical analysis and validation. The performance measures are statistically based and include the empirical cumulative density function (ECDF), Mean Bias (MB), Root Mean Squared Error (RMSE), and coefficient of determination (R2). The measures are defined in Equations (1)–(3);
MB = i = 1 n D n i = 1 n S n
  R 2 =   i = 1 n D D ¯ S S ¯ i = 1 n D D ¯ 2 i = 1 n S S ¯ 2 2
RMSE   =   i = 1 n D S 2 n
where S is the rainfall value acquired from the observation dataset; CRU, the D represents the assessed value obtained from the CMIP6 rainfall dataset, while   S ¯ and D ¯ are denote the observed and the CMIP6 estimated mean values, respectively. The n is the number of data pairs. Bias indicates how close the mean of CMIP6 is to the mean observed value. A bias ratio closer to 0 indicates that CMIP6 rainfall estimate data is closer to observation data and thus considered an ideal score. Root mean square error (RMSE) computes the distance between estimated (CMIP6) and observed (CRU) measurements. It states how concentrated the data is around the line of best fit; a measure of 0 is the optimal score. The coefficient of determination (R2) quantifies the correlation between the CMIP6 models and observations (CRU), with the value of R2 closer to 0 signifying no correlation whereas 1 denotes perfect correlation.
Spatial model performance is further assessed based on the Taylor diagram and Taylor Skill Score (TSS) [29]. The approach has been widely used to assess the similarity between different sets of data [29,30,31]. In this work, the Taylor skill score was employed to estimate the performance of CMIP6 models reproducing the spatial rainfall patterns over North Africa. The TSS is computed using Equation (4);
T S S =   4 1 + P C 2 / [ σ c m i p σ o b s + σ o b s σ c m i p 1 + P C 0 2 ]
where PC is the spatial pattern correlation coefficient between the model outputs and observation. The PC0 is the highest achievable (here, we set the threshold at 1). Also, variables such as   σ c m i p and   σ o b s represent standard deviation of the simulated and observed patterns, respectively. The score ~ 1 threshold value shows a perfect association between models and observed whereas 0 expresses contrary model performance. Details about TSS technique and its successful application in various studies (e.g., [32,33,34,35]).

2.3.2. Trend Analysis

The trend detection analysis was performed using the Modified Mann-Kendall (MMK) test. The MMK test [36,37,38] is used to discern statistically significant decreasing or increasing trend in time series against the null hypothesis of no trend [39,40,41,42]. The method did not require the sample to conform to any specific probability distribution since it worked well even with insufficient or abnormal values. Significance of the trend was tested at 5% significance level. Z-score exceeding the magnitude of critical values (±1.96) at 5% significance level denotes a monotonic trend of rainfall events. The S value denotes variance, which is used to calculate significance of the trend. Detailed equations of MMK can be found in relevant literature [42,43,44,45]. The magnitude of the slope in models was assessed using Theil-Sen Slope Estimator [46]. The methods were successfully applied in related studies [34,44,47].

3. Results and Discussion

3.1. Annual Cycle

Structured assessment of climate models through estimation of observations is a criterion to gaining confidence in climate analysis. Appropriate climate model evaluation involves examining mean state, trends, variability, vital physical processes, and emergent constraints [48]. In this study, the performance of CMIP6 models is examined based on their capability to mimic regional mean annual climatology, trends, and inter-annual variability. Figure 2 presents the annual rainfall cycle over North Africa. The climate of the study domain is mostly characterized by dry anomalies with rainfall mostly experienced during winter (DJF), while summer (JJA) is regarded as “hotspot” climate [23]. This is so because the region experiences stronger warming of the regional land-based hot extremes compared to the mean global temperature increase as defined by IPCC [49]. The dry (JJA)/wet (DJF) seasons over the Mediterranean are mainly regulated by the north/south oscillation of Azores anticyclone [21]. The observed annual cycle peak of the observation is 23 mm/month in December, and the lowest amount was found between June and July (4 mm/month). Some models satisfactorily simulate the peak season of regional rainfall but fail to accurately mimic the rainfall pattern. This shows the models’ capability to capture mechanisms influencing the local rainfall and the number of observed values by the majority. This presents an optimistic simulation of regional climate patterns in a region characterized by sparse gauge-based datasets.
In agreement with expectation, the multimodal mean ensemble adequately reproduces the observed features than individual models. The ensemble mean performs best from January to April and tends to overestimate the observed rainfall during the rest of the year. Moreover, some individual models (i.e., BCC-CSM2-MR, CESM2-WACCM, and NorESM2-LM) robustly reproduce the rainfall peaks while with varying rainfall amounts reproduced (Figure 2). For instance, the CMIP6 dataset scored low values during the JJA season. It is notable that EC-Earth3-veg scored the lowest rainfall value among the other GCMs (<5 mm/month) between July and August. Interestingly, SAMO-UNICON and CanESM5 are unable to accurately replicate the observed annual climatology in the North Africa region. CNRM-CM6-1 and CNRM-ESM2-1 consistently overestimate the rainfall, specifically between September and February, scoring an overestimated amount exceeding 5 mm/month. The performance of these two models was contrary to what they depicted in a recent study [34] over Uganda, East Africa where they underestimated rainfall more than all the other models. The large wet biases exhibited by CNRM-CM6-1 and CNRM-ESM2-1 calls for further studies to establish in depth understanding of the model performance in a region that is classified as hot dry climate anomaly. Overall, nine models depicted an overestimated annual cycle of regional rainfall out of the 15 participants (Figure 2). The observed wet bias noted in most CMIP6 models could be attributed to the challenges arising from the parameterization schemes which tends to capture more rainfall as compared to the observed value [5]. This is despite new improvements such higher spatial resolution in comparison to coarser resolution for CMIP5 [11], or changes in the physical processes and biogeochemical cycles, among others [5].
Further analyses of spatial patterns of regional rainfall for monthly and seasonal timescales are presented in Figure A1 and Figure A3, respectively. The observed rainfall quantities for monthly mean varies across the region from 0 to 50 mm/month, while DJF mean ranges from 0 to 80 mm/season (Appendix B, Figure A1 and Figure A3). The lowest monthly mean rainfall is recorded over the arid region of southern North Africa, while high monthly mean rainfall accrued over northern parts of the study region (Figure A1 and Figure A3). Most CMIP6 models tend to capture the observed patterns of rainfall distribution over the study domain. The spatial variation of pluviometry over North Africa is primarily influenced by anticyclone passage towards the south, giving way to the ocean disturbances to the adjacent landmass [21]. The ensemble adequately estimated the rainfall across the entire domain. In contrast, CESM2-WACCM, CESM2, and SAMO-UNICON show a moderate overestimation of the rainfall amount across the south of the study domain ranging from 5 to 10 mm/month, while CanESM5, CNRM-CM6-1, and MRI-ESM2-0 depict slight rainfall underestimation in mid and south of the domain (Figure A1). CNRM-CM6-1 and CNRM-CM2-1 demonstrated a consistent overestimation of rainfall over the north of the study area by 10–20 mm/month reaching an amount of 80 mm/month in some regions (Figure 1). On the other hand, BCC-CSM2-MR, BCC-ESM1, CanESM5, CESM2-WACCM, CESM2, EC-Earth3-veg, SAMO-UNICON, and UKESM1-0-LL models showed an underestimation (10–20 mm/month) in the northern parts of the study domain. GFDL-CM4, GFDL-ESM4, IPSL-CM6A-LR, and the ensemble mean, outperformed other models in estimating the suitably observed monthly rainfall (Figure A1).
Likewise, seasonal patterns (Figure 3) show enhanced rainfall over northern parts, similar to monthly patterns (Figure A1). However, more rainfall is simulated during DJF, with the highest amount recorded in CNRM-ESM2-1 and CNRM-CM6-1. Remarkably, SAMO-UNICON depicted pronounced underestimation over the entire domain with the least amount of rainfall <15 mm/season (Figure 3). Overall, the best performing models in seasonal rainfall simulations over North Africa are: CNRM-ESM2-1, CNRM-CM6-1, and GFDL-ESM4. Conversely, models that exemplify unsatisfactory performance over this study region include SAMO-UNICON and CESM2.

3.2. Trend Analysis

The trends were evaluated and tested for their significance and magnitude over North Africa during 1951–2014. Table 1 shows the mean, slope, Z-score, and significance of linear trend of annual and DJF rainfall for CRU, GPCC, and the CMIP6 models. The rainfall over the region exhibits significant decreasing trends for annual and DJF season. CRU depicts the significant decreasing trend with Z-score values of 2.32 during annual and DJF season, whereas GPCC show significant decreasing trend during DJF (−2.32). These results agree with past studies over the study area [2,50,51]. To illustrate, Giorgi and Lionello [2], found a pronounced decrease in rainfall, especially in warm season, with attributions pointing to increased anticyclonic circulations that yields increasingly stable conditions. Only two models: BCC-ESM1 and GFDL-ESM4, show a significant decrease during annual and DJF season with Z-scores of −2.1 and −2.35, respectively. The mean ensemble shows an insignificant decreasing trend in annual (seasonal) analysis with a Z-score of −1.05 (−1.16).
Examination of the magnitude of the slope using Sen’s slope shows capability of most models in reproducing observed trends satisfactorily (Table 1). Generally, models’ competence to reproduce the spatial variance and trends vary from one model to another and from one-time slice to another. Nevertheless, the best performing models capable of simulating annual temporal trends over North Africa can be summarized as follows: BCC-ESM1, CESM2, GFDL-ESM2, and ensemble mean. Conversely, poor performing models in mimicking the observed temporal trends include CNRM-CM6-1, EC-Earth3-Veg, and CESM2-WACCM.
Further analyses of spatial trends based on Sen’s slope during annual and DJF are presented in Figure 4 and Figure 5, respectively. The observed datasets display a slightly decreasing trend at −0.8 to 0 mm/year across the entire grids of study region. Remarkably, the northern part of the study domain depicted much lower trend values of −1.0 mm/year on annual and DJF season (Figure 4 and Figure 5). Whereas most models satisfactorily simulate temporal trends of annual and seasonal rainfall over North Africa, spatial tendencies remain a challenge on an annual scale. Few models such as BCC-ESM1, GFDL-CM4, and CNRM-ESM2-1 can reproduce observed trends. The majority of models show enhanced positive variance of rainfall tendency in a region that has experienced an intense and prolonged drought during the recent decades [52,53]. Due to the participation of diverse models, the ensemble did not perform well in capturing the observed trend.
The significant decreasing rainfall trends observed in North Africa result from the recent amplification of cyclonic circulation and northward alteration of the sequence of cyclonic depression regions [2]. This has occasioned acute water shortage due to recurrent droughts recorded over the recent decades [8]. Moreover, the continued decline of rainfall observed has equally affected most of the economic activities, with communities shifting from traditional agricultural activities to long-distance trade. This illustrates how some susceptible regions are forced to pursue drastic adaptive responses, including relocation and societal structure changes [49]. Models that robustly exemplify the observed trends presents promising future climate diagnostic and projections, unlike previous versions of CMIP3 and CMIP5 that presented varying outcomes of historical patterns and projections of North Africa climate [18,19,54].

3.3. Statistical Analysis

3.3.1. Student’s t-Test, Bias, Coefficient of Determination, RMSE, and ECDF Metrics

The skillfulness of CMIP6 models is determined by their capability to exhibit low bias (<0), high R2 (1), and small RMSE (<0). Moreover, the ability of models to mimic extreme rainfall events is examined based on the ECDF performance. Table 2 shows the Student’s t-test analysis on monthly time scale between CRU and CMIP6 models. At (p < 0.05), most CMIP6 models resulted in significant differences with the CRU, other than BCC-CSM2-MR and UKESM1-0-LL. Figure A2 displays the spread in the biases simulated by the CMIP6 models over the Northern African region for monthly rainfall against CRU observations. Over the northwest of the study domain, CNRM-CM6-1 and CNRM-ESM2-1 reveal a positive bias range of 16 to 32 mm/month. In contrast, the remaining models exhibit negative bias from 2 to 32 mm/month in the same area. Over the southern parts of North Africa, SAMO-UNICON exhibits some high positive values across the desert ranging between 8 to 16 mm/month. BCC-CSM2-MR, BCC-ESM1, CanESM5, CESM2-WACCM, CESM2, CNRM-CM6-1, CNRM-ESM2-1, MRI-ESM2-0, UKESM1-0-LL, and the mean ensemble depict positive bias values (2 to 8 mm/month). Meanwhile, EC-Earth3-Veg, NorESM2-LM, GFDL-CM4, GFDL-ESM4, and IPSL-CM6A-LR slightly underestimate the observed rainfall (0 to −2 mm/month). The summary of CMIP6 models spread with respect to the observational datasets for mean bias is presented in Figure 6. The overall distribution shows that most models tend to underestimate the observed rainfall, especially EC-Earth3-veg, NorESM2-LM, and IPSL-CM6A-LR (around 75% of the distribution). Meanwhile, the concentration of the bias distribution of CNRM-CM6-1, CNRM-ESM2-1 exhibits more positive bias values (Nearly 75% of the distribution). GFDL-CM4 and the ensemble show the best performance scoring a median value close to 0 mm/month, and their boxplot is comparatively minimal.
Figure A3 shows the spatial coefficient of determination between CMIP6 models and CRU over Northern Africa. Remarkably, most CMIP6 models depict low spatial correlation across the entire study domain. CMIP6 models display some weakness in reproducing the observed rainfall variability over North Africa. This could be attributed to the steady moisture outflow due to amplified evapotranspiration, increased radiation, and minimal cloud cover [55]. Across the northern part of the study area along the Mediterranean coast, the ensemble depicts an enhanced R2 values with the observed data reaching (0.6) in some grids. This could be associated with the presence of a large coastline that results in more convective activities leading to more rainfall. It is evident from Table 2 that the ensemble demonstrates the most satisfactory R2 value (0.66), followed by EC-Earth3-Veg (0.58), GFDL-CM4 (0.49), GFDL-ESM4 (0.45), and IPSL-CM6A-LR (0.44). Conversely, SAMO-UNICON scores the lowest (0.04). A similar low correlation of SAMO-UNICON was also found over the Yangtze River in China [56], and over Uganda, situated in the East Africa region [45].
Figure 7 displays the boxplot of the coefficient of determination of CMIP6 models data with respect to CRU observed data. In general, CMIP6 models exhibit a low correlation. Most CMIP6 models depict low R2 ratio resulting in low median values. Interestingly, 75% of R2 distribution of 14 CMIP6 models were below 0.1 ratio. Meanwhile, the ensemble and IPSL-CM6A-LR model showed enhanced results. IPSL-CM6A-LR performance was comparatively better than the other individual CMIP6 models scoring higher correlation values. This performance is agreeing with the spatial R2 distribution (Figure A3), where IPSL-CM6A-LR showed a moderate correlation over the southern of the study domain. However, its median remained low (<0.1). The ensemble mean appears to show the most enhanced performance scoring the highest median (0.04) despite depicting comparatively a large spread in its distribution. The highest R2 value was scored by the mean ensemble (0.66). The ensemble good performance was also found in Table 2 scoring the highest temporal correlation of determination ratio (R2 = 0.66). Consistent with other studies, the mean ensemble shows better performance due to the cancellation of systematic errors in the individual models.
The spatial RMSE of mean monthly rainfall relative to CRU data over North Africa from 1951 to 2014 is presented in Figure A4. The overall RMSE values results show higher values (30 < RMSE < 80 mm/month) over the northwest of the study domain featuring higher altitude topography. However, low values of RMSE of <10 mm/month are noted over the low-lying areas characterized by arid and semi-arid land (ASAL). CESM2-WACCM, CESM2, and SAMO-UNICON exhibit RMSE values between 10 and30 mm/month, which is considered higher compared to the monthly rainfall average observed in this particular region. From Figure A4, the ensemble performs well, followed by IPSL-CM6A-LR, NorESM2-LM, ECEarth3-veg, and UKESM1-0-LL. The results show that the RMSE of most CMIP6 models varies in performance with variations to different climatic features and topography. High RMSE is observed in high altitude with wet climate regions, while low RSME is recorded in low altitude with dry climate anomaly.
Temporal patterns based on the boxplot of the RMSE distribution of CMIP6 data akin CRU observed data are shown Figure 8. The general distribution of RMSE exhibits different variation from one model to another. However, the concentration of RMSE distribution for all GCMs is below 35 mm/month. Clearly, SAMO-UNICON shows the weakest performance resulting in the high RMSE values and lengthiest spread of the RMSE distribution. In addition, it results in the highest median value, followed by CNRM-CM6-1 and CNRM-ESM2-1. On the other hand, the ensemble shows the most acceptable performance among the models followed by NorESM2-LM, IPSL-CM6A-LR, and EC-Earth3-veg. The enhanced performance of the ensemble was also found in Table 2 scoring the lowest RMSE value (4.36 mm/month).

3.3.2. Cumulative Density Function (ECDF) Analysis

The ECDF of mean monthly rainfall for GCMs obtained from CMIP6 models and their ensemble average against two observational datasets of CRU and GPCC are shown in Figure A5. The ECDFs depict the frequency of occurrence of anomalous rainfall on a monthly distribution (mm/month). Most CMIP6 models overestimate the monthly rainfall (Figure A5). The ensemble displayed similarity with the observed rainfall distribution from 22 to 41 mm with slight over/underestimation. CNRM-CM6-1, CNRM-ESM2-1, NorESM2-LM, IPSL-CM6A-LR, and UKESM1-0-LL show large wet bias of rainfall between 27 mm to 54 mm/month. On the other hand, SAM0-UNICON, CanESM1 EC-Earth3-Veg, BCC-ESM1, and MRI-ESM2-0 show dry bias ranging between 16 mm/month and 31 mm/month.
During DJF season (Figure A6), the ensemble underestimates rainfall when rainfall amounts < 52 mm/season, while it shows more agreement when rainfall surpasses 52 mm/season. Similarly, in the annual distribution, CNRM-CM6-1, CNRM-ESM2-1, NorESM2-LM, IPSL-CM6A-LR, and GFDL-ESM4 overestimate the rainfall but with higher amounts (27 to 58 mm/month). Furthermore, CanESM1, BCC-ESM1, SAM0-UNICON, MRI-ESM2-0, BCC-CSM2-MR, and EC-Earth3-Veg depict underestimation. Contrary to the monthly distribution, UKESM1-0-LL underestimates the observed rainfall. In contrast with the monthly distribution, the DJF distribution shows more models underestimating the rainfall. The ensemble performed the best from Figure A5 and Figure A6, followed by CESM2 and CESM2-WACCM.

3.3.3. Taylor Score and Ranking

Taylor diagram and skill score are employed to evaluate the general skill performance of CMIP6 models reproducing the spatial rainfall pattern. Figure 9 displays the Taylor diagram for annual rainfall climatology over North Africa based on CMIP6 models and observations. The radial coordinate represents the magnitude of the standard deviation, while the root mean square difference is illustrated using the concentric semi-cycle. The angular coordinate shows the correlation coefficient between models and the observed dataset; CRU.
The analyses demonstrate that SAMO-UNICON, CanESM5, and BCC-ESM1 models score low variability against CRU data. In contrast, CESM2-WACCM, UKESM1-0-LL, GFDL-CM4, GFDL-ESM4, MRI-ESM2-0, and CNRM-CM6-1 exhibit high variability compared to CRU observation. IPSL-CM6A-LR, NorESM2-LM, BCC-CSM2-MR, CESM2, and EC-Earth3-Veg exhibit a close agreement in terms of rainfall variability relative to CRU. SAMO-UNICON scored the weakest correlation (r = 0.2), and ensemble scored the highest (r = 0.81). The remaining models reveal a correlation ratio between 0.4 and 0.76. In terms of the centered RMSE, ensemble indicates a good performance resulting in a low centered RMSE value (0.6). On the other hand, the highest value was scored by SAMO-UNICON, which results in the most inferior performance compared to the other models.
Finally, model overall ranking is established using the Taylor skill score (TSS) metrics. The TSS for the 15 CMIP6 models and their mean ensemble over North Africa are shown in Figure 10. Principally, the TSS values closer to 1 depict better performance. The values of the TSS for all the models are listed in Table 2. The ensemble outperforms the other individual model recording the finest TSS score (0.79). Outstandingly, EC-Earth3-veg exhibited a robust performance (0.78). Other models that performed better include UKESM1-0-LL (0.72), GFDL-CM4 (0.70), NorESM2-LM (0.69), GFDL-ESM4 (0.68), IPSL-CM6A-LR (0.68), BCC-CM2-MR (0.67), CESM2 (0.64), CESM2-WACCM (0.62), MRI-ESM2-0 (0.61), BCC-ESM1 (0.58), CNRM-ESM2-1 (0.58), CNRM-CM6-1 (0.58), and CanESM5 (0.43), respectively. The lowest TSS ratio was scored by SAMO-UNICON (0.36). The best performing models will thus, be used to build an ensemble for future projection of the region’s possible climate change scenario.

4. Summary and Conclusions

In this study, 15 CMIP6 models were investigated over North Africa for their performance in replicating rainfall. Their performance in reproducing the spatial and temporal distribution of rainfall over the region was investigated against two observational datasets of CRU and GPCC. In addition, prominent statistical metrics such as bias, RMSE, R2, ECDF and Taylor skill score (TSS) are utilized to assess model performance in reproducing monthly and seasonal rainfall over North Africa domain. Results show that CMIP6 models satisfactorily reproduced mean annual climatology of dry/wet months. However, some models showed a slight over/underestimation across dry/wet months. The mean ensemble showed relatively good performance from the wet season.
In terms of the spatial distribution of rainfall, CMIP6 models captured both the generally wet and dry regions. However, they fail to reproduce the observed amounts well. It was found that GFDL-CM4, GFDL-ESM4, IPSL-CM6A-LR, and ensemble showed a better agreement with the observation reproducing the spatial rainfall variability. The trend test results indicated that most CMIP6 models could reproduce the observed downward trend of rainfall over the study region. However, few models showed an opposite. Due to the diverse performance of CMIP6 models, the mean ensemble could not reproduce the accurate observed spatial trend. Most CMIP6 models showed a dry bias over North Africa (from 0 to 32 mm/month). Nevertheless, only CNRM-CM6-1 and CNRM-ESM2-1 depict wet bias in the same region, reaching 32 mm/month. GFDL-CM4 and the ensemble revealed the lowest values in terms of spatial spread-out of bias ratios across the study domain.
The spatial correlation between CMIP6 models and CRU indicates that the ensemble outperformed the other models resulting in a high correlation (0.66), followed by EC-Earth3-Veg with R2 of 0.58. The model’s overall ranking from all the analyses ranging from mean cycle simulation, trend analysis, inter-annual variability, ECDFs, spatial patterns variability based on RMSE, bias, and R2 are as follows: EC-Earth3-Veg, UKESM1-0-LL, GFDL-CM4, NorESM2-LM, IPSL-CM6A-LR, and GFDL-ESM4. The mean model ensemble outperforms the other CMIP6 models resulting in a TSS ratio (0.79). On the contrary, the lowest score was recorded by SAMO-UNICON (0.36). Following [57] recommendations, the six-top ranked GCMs will be used to build an ensemble for impact analysis and future projections of North Africa climate.

Author Contributions

All authors made an equal contribution to the manuscript’s development and consented to the submission for publication in the esteemed journal. The following are individual contributions: H.B. and B.A.: conceptualization, formal writing, Funding, original draft preparation. H.B.: Data curation, methodology, visualization. M.O., H.N., and R.K.: writing-review and editing, investigation. B.A. and V.O.: Validation, writing-review, and editing. A.R.: Funding, writing-review. R.H.: Supervision. All authors have read and agreed to the published version of the manuscript.

Funding

This research received no external funding.

Institutional Review Board Statement

Not applicable.

Informed Consent Statement

Not applicable.

Conflicts of Interest

No competing interest in the present study among the authors or any other body.

Appendix A. List of Selected CMIP6 Models

Table A1. Description of the 15 CMIP6 models used in the current study over North Africa.
NoNamesInstitutionResolution
1BCC-CSM2-MRBeijing Climate Center (BCC) and China Meteorological Administration (CMA), China1.13° × 1.13°
2BCC-EM1Beijing Climate Center (BCC) and China
Meteorological Administration
(CMA), China
2.81° × 2.81°
3CanESM5Canadian Centre for Climate Modelling and Analysis, Environment and Climate Change Canada, Victoria, Canada2.81° × 2.81°
4CESM2National Center for Atmospheric Research, USA1.25° × 0.94°
5CESM2-WACCMNational Center for Atmospheric Research, USA1.25° × 0.94°
6CNRM-CM6-1Centre National de Recherches Météorologiques (CNRM); Centre Européen de Recherches et de Formation Avancéeen Calcul Scientifique, France1.41°×1.41°
7CNRM-ESM2-1Centre National de Recherches Meteorologiques, Toulouse, France1.41° × 1.41°
8EC-EARTH3-VegConsortium of European research institution and researchers, Europe0.70° × 0.70°
9GFDL-ESM4Geophysical Fluid Dynamics Laboratory (GFDL), USA1.25° × 1.00°
10GFDL-CM4Geophysical Fluid Dynamics Laboratory (GFDL), USA2.50° × 2.00°
11IPSL-CM6A-LRInstitut Pierre Simon Laplace, Paris, France2.50° × 1.26°
12MRI-ESM2-0Meteorological Research Institute (MRI), Japan1.13° × 1.13°
13NorESM2-LMNorwegian Climate Centre/Norway1.875° × 2.5
14SAM0-UNICONSeoul National University, Seoul 08826, Republic of Korea1.25° × 0.94°
15UKESM1-0-LLUK Met Office Hadley Center, UK 1.88° × 1.25°

Appendix B. Supplementary Figures

Figure A1. Spatial distribution of monthly mean rainfall for observations (CRU and GPCC), CMIP6 models, and mean ensemble over North Africa for 1951–2014.
Atmosphere 12 00475 g0a1
Figure A2. Monthly spatial bias of mean ensemble and CMIP6 models against CRU data over North Africa for 1951–2014.
Atmosphere 12 00475 g0a2
Figure A3. Spatial coefficient of determination (R2) of ensemble and CMIP6 models with CRU data over North Africa for the mean monthly rainfall for the period 1951–2014.
Atmosphere 12 00475 g0a3
Figure A4. Spatial RMSE (mm/month) of ensemble and CMIP6 models against CRU data over North Africa for the mean monthly rainfall for 1951–2014.
Atmosphere 12 00475 g0a4
Figure A5. Comparisons of the empirical cumulative distribution function (ECDF) of mean monthly rainfall from observations of CRU and GPCC against 15 CMIP6 models over North Africa for 1951–2014.
Atmosphere 12 00475 g0a5
Figure A6. Same as Figure A5 but for DJF season.
Atmosphere 12 00475 g0a6

References

  1. Hochman, A.; Bucchignani, E.; Gershtein, G.; Krichak, S.O.; Alpert, P.; Levi, Y.; Yosef, Y.; Carmona, Y.; Breitgand, J.; Mercogliano, P.; et al. Evaluation of regional COSMO-CLM climate simulations over the eastern Mediterranean for the period 1979–2011. Int. J. Climatol. 2018, 38, 1161–1176. [Google Scholar] [CrossRef]
  2. Giorgi, F.; Lionello, P. Climate change projections for the Mediterranean region. Glob. Planet. Chang. 2008, 63, 90–104. [Google Scholar] [CrossRef]
  3. Diffenbaugh, N.S.; Giorgi, F. Climate change hotspots in the CMIP5 global climate model ensemble. Clim. Chang. 2012, 114, 813–822. [Google Scholar] [CrossRef] [PubMed] [Green Version]
  4. Almazroui, M.; Rashid, I.U.; Saeed, S.; Islam, M.N. ENSO influence on summer temperature over Arabian Peninsula: Role of mid-latitude circulation. Clim. Dyn. 2019, 53, 5047–5062. [Google Scholar] [CrossRef]
  5. Eyring, V.; Bony, S.; Meehl, G.A.; Senior, C.A.; Stevens, B.; Stouffer, R.J.; Taylor, K.E. Overview of the Coupled Model Intercomparison Project Phase 6 (CMIP6) experimental design and organization. Geosci. Model Dev. 2016, 9, 1937–1958. [Google Scholar] [CrossRef] [Green Version]
  6. Gidden, M.J.; Riahi, K.; Smith, S.J.; Fujimori, S.; Luderer, G.; Kriegler, E.; Van Vuuren, D.P.; Van Den Berg, M.; Feng, L.; Klein, D.; et al. Global emissions pathways under different socioeconomic scenarios for use in CMIP6: A dataset of harmonized emissions trajectories through the end of the century. Geosci. Model Dev. 2019, 12, 1443–1475. [Google Scholar] [CrossRef] [Green Version]
  7. Philandras, C.M.; Nastos, P.T.; Kapsomenakis, J.; Douvis, K.C.; Tselioudis, G.; Zerefos, C.S. Long term precipitation trends and variability within the Mediterranean region. Nat. Hazards Earth Syst. Sci. 2011, 11, 3235–3250. [Google Scholar] [CrossRef] [Green Version]
  8. Cook, B.I.; Anchukaitis, K.J.; Touchan, R.; Meko, D.M.; Cook, E.R. Spatiotemporal drought variability in the mediterranean over the last 900 years. J. Geophys. Res. 2016, 121, 2060–2074. [Google Scholar] [CrossRef]
  9. Lelieveld, J.; Proestos, Y.; Hadjinicolaou, P.; Tanarhte, M.; Tyrlis, E.; Zittis, G. Strongly increasing heat extremes in the Middle East and North Africa (MENA) in the 21st century. Clim. Chang. 2016, 137, 245–260. [Google Scholar] [CrossRef] [Green Version]
  10. Schilling, J.; Hertig, E.; Tramblay, Y.; Scheffran, J. Climate change vulnerability, water resources and social implications in North Africa. Reg. Environ. Chang. 2020, 20, 15. [Google Scholar] [CrossRef] [Green Version]
  11. Taylor, K.E.; Stouffer, R.J.; Meehl, G.A. An overview of CMIP5 and the experiment design. Bull. Am. Meteorol. Soc. 2012, 93, 485–498. [Google Scholar] [CrossRef] [Green Version]
  12. Schmitz, C.; Lotze-Campen, H.; Gerten, D.; Dietrich, J.P.; Bodirsky, B.; Biewald, A.; Popp, A. Blue water scarcity and the economic impacts of future agricultural trade and demand. Water Resour. Res. 2013, 49, 3601–3617. [Google Scholar] [CrossRef]
  13. Bucchignani, E.; Cattaneo, L.; Panitz, H.J.; Mercogliano, P. Sensitivity analysis with the regional climate model COSMO-CLM over the CORDEX-MENA domain. Meteorol. Atmos. Phys. 2016, 128, 73–95. [Google Scholar] [CrossRef]
  14. IPCC. Climate Change 2014: Synthesis Report. Contribution of Working Groups I, II and III to the Fifth Assessment Report of the Intergovernmental Panel on Climate Change; Pachauri, R.K., Meyer, L.A., Eds.; IPCC: Geneva, Switzerland, 2014; p. 151. [Google Scholar]
  15. Liebmann, B.; Bladé, I.; Kiladis, G.N.; Carvalho, L.M.V.; Senay, G.B.; Allured, D.; Leroux, S.; Funk, C. Seasonality of African precipitation from 1996 to 2009. J. Clim. 2012, 25, 4304–4322. [Google Scholar] [CrossRef]
  16. Massoud, E.; Massoud, T.; Guan, B.; Sengupta, A.; Espinoza, V.; Luna, M.D.; Raymond, C.; Waliser, D. Atmospheric rivers and precipitation in the middle east and north africa (Mena). Water 2020, 12, 2863. [Google Scholar] [CrossRef]
  17. Almazroui, M.; Saeed, F.; Saeed, S.; Nazrul Islam, M.; Ismail, M.; Klutse, N.A.B.; Siddiqui, M.H. Projected Change in Temperature and Precipitation Over Africa from CMIP6. Earth Syst. Environ. 2020, 4, 455–475. [Google Scholar] [CrossRef]
  18. Nouaceur, Z. Essor économique et crise environnementale d’une capitale sahélienne: Nouakchott. Sécheresse 2010, 21, 63–70. [Google Scholar] [CrossRef]
  19. Sebbar, A.; Wadi, B.; Fougrach, H.; Mohammed, H.; Abdelmalik, S. Etude de la variabilite du regime pluviometrique au Maroc septentrional (1935–2004). Secheresse 2011, 22, 139–148. [Google Scholar] [CrossRef]
  20. Kortli, M. Changement Climatique, Eau et Sante en Tunisie. Master’s Thesis, Institut National Agronomique de Tunisie, INRGREF, Tunis, Tunisia, 2012. [Google Scholar]
  21. Lionello, P.; Malanotte-Rizzoli, P.; Boscolo, R. Mediterranean Climate Variability; Elsevier Science: Amsterdam, The Netherlands, 2006; ISBN 9780080460796. [Google Scholar]
  22. Nouaceur, Z.; Murărescu, O. Rainfall Variability and Trend Analysis of Annual Rainfall in North Africa. Int. J. Atmos. Sci. 2016, 2016, 1–12. [Google Scholar] [CrossRef]
  23. Xoplaki, E. Climate Variability over the Mediterranean. Ph.D. Thesis, University of Bern, Bern, Switzerland, 2002. Available online: http://sinus.unibe.ch/klimet/docs/phd_xoplaki.pdf (accessed on 15 September 2020).
  24. Norrant, C.; Douguédroit, A. Monthly and daily precipitation trends in the Mediterranean (1950–2000). Theor. Appl. Climatol. 2006, 83, 89–106. [Google Scholar] [CrossRef]
  25. Barkhordarian, A.; Von Storch, H.; Zorita, E. Anthropogenic forcing is a plausible explanation for the observed surface specific humidity trends over the Mediterranean area. Geophys. Res. Lett. 2012, 39, L19706. [Google Scholar] [CrossRef] [Green Version]
  26. Lelieveld, J.; Hadjinicolaou, P.; Kostopoulou, E.; Chenoweth, J.; El Maayar, M.; Giannakopoulos, C.; Hannides, C.; Lange, M.A.; Tanarhte, M.; Tyrlis, E.; et al. Climate change and impacts in the Eastern Mediterranean and the Middle East. Clim. Chang. 2012, 114, 667–687. [Google Scholar] [CrossRef] [Green Version]
  27. Harris, I.; Osborn, T.J.; Jones, P.; Lister, D. Version 4 of the CRU TS monthly high-resolution gridded multivariate climate dataset. Sci. Data 2020, 7, 1–18. [Google Scholar] [CrossRef] [Green Version]
  28. Schneider, U.; Finger, P.; Meyer-Christoffer, A.; Rustemeier, E.; Ziese, M.; Becker, A. Evaluating the hydrological cycle over land using the newly-corrected precipitation climatology from the Global Precipitation Climatology Centre (GPCC). Atmosphere 2017, 8, 52. [Google Scholar] [CrossRef] [Green Version]
  29. Taylor, K.E. Summarizing multiple aspects of model performance in a single diagram. J. Geophys. Res. 2001, 106, 7183–7192. [Google Scholar] [CrossRef]
  30. Wang, B.; Zheng, L.; Liu, D.L.; Ji, F.; Clark, A.; Yu, Q. Using multi-model ensembles of CMIP5 global climate models to reproduce observed monthly rainfall and temperature with machine learning methods in Australia. Int. J. Climatol. 2018, 38, 4891–4902. [Google Scholar] [CrossRef]
  31. Kusunoki, S.; Yoshimura, J.; Yoshimura, H.; Noda, A.; Oouchi, K.; Mizuta, R. Change of Baiu rain band in global warming projection by an atmospheric general circulation model with a 20-km grid size. J. Meteorol. Soc. Jpn. 2006, 84, 581–611. [Google Scholar] [CrossRef] [Green Version]
  32. Chen, W.; Jiang, Z.; Li, L. Probabilistic projections of climate change over China under the SRES A1B scenario using 28 AOGCMs. J. Clim. 2011, 24, 4741–4756. [Google Scholar] [CrossRef] [Green Version]
  33. Zhu, H.; Jiang, Z.; Li, J.; Li, W.; Sun, C.; Li, L. Does CMIP6 Inspire More Confidence in Simulating Climate Extremes over China? Adv. Atmos. Sci. 2020, 37, 1119–1132. [Google Scholar] [CrossRef]
  34. Ngoma, H.; Wen, W.; Ayugi, B.; Babaousmail, H.; Karim, R.; Ongoma, V. Evaluation of the Global Climate Models in CMIP6 in simulating mean precipitation over Uganda. Int. J. Climatol. 2021, 1–26. [Google Scholar] [CrossRef]
  35. Ayugi, B.; Dike, V.; Ngoma, H.N.; Babaousmail, H.; Ongoma, V. Future Changes in Precipitation Extrems over East Africa based on CMIP6 Projections. Preprints 2021, 2021010112. [Google Scholar] [CrossRef]
  36. Mann, H.B. Non-Parametric Test Against Trend. Econometrica 1945, 13, 245–259. [Google Scholar] [CrossRef]
  37. Kendall, M.G. Appendix: Mann-Kendall Trend Tests; Oxford University Press: Oxford, UK, 1975; p. 202. [Google Scholar]
  38. Hamed, K.H.; Ramachandra Rao, A. A modified Mann-Kendall trend test for autocorrelated data. J. Hydrol. 1998, 204, 182–196. [Google Scholar] [CrossRef]
  39. Partal, T.; Kahya, E. Trend analysis in Turkish precipitation data. Hydrol. Process. 2006, 20, 2011–2026. [Google Scholar] [CrossRef]
  40. Gajbhiye, S.; Meshram, C.; Mirabbasi, R.; Sharma, S.K. Trend analysis of rainfall time series for Sindh river basin in India. Theor. Appl. Climatol. 2016, 125, 593–608. [Google Scholar] [CrossRef]
  41. Liuzzo, L.; Bono, E.; Sammartano, V.; Freni, G. Analysis of spatial and temporal rainfall trends in Sicily during the 1921–2012 period. Theor. Appl. Climatol. 2016, 126, 113–129. [Google Scholar] [CrossRef]
  42. Ongoma, V.; Chen, H.; Gao, C.; Nyongesa, A.M.; Polong, F. Future changes in climate extremes over Equatorial East Africa based on CMIP5 multimodel ensemble. Nat. Hazards 2018, 90, 901–920. [Google Scholar] [CrossRef]
  43. Ayugi, B.O.; Tan, G. Recent trends of surface air temperatures over Kenya from 1971 to 2010. Meteorol. Atmos. Phys. 2019, 131, 1401–1413. [Google Scholar] [CrossRef]
  44. Mumo, L.; Yu, J.; Ayugi, B. Evaluation of spatiotemporal variability of rainfall over Kenya from 1979 to 2017. J. Atmos. Solar Terr. Phys. 2019, 194, 105097. [Google Scholar] [CrossRef]
  45. Karim, R.; Tan, G.; Ayugi, B.; Babaousmail, H.; Liu, F. Evaluation of historical CMIP6 model simulations of seasonal mean temperature over Pakistan during 1970-2014. Atmosphere 2020, 11, 1005. [Google Scholar] [CrossRef]
  46. Sen, P.K. Estimates of the Regression Coefficient Based on Kendall’s Tau. Am. Stat. Assoc. 1968, 63, 1379–1389. [Google Scholar] [CrossRef]
  47. Eyring, V.; Bock, L.; Lauer, A.; Righi, M.; Schlund, M.; Andela, B.; Arnone, E.; Bellprat, O.; Carvalhais, N.; Cionni, I.; et al. Earth System Model Evaluation Tool (ESMValTool) v2.0—An extended set of large-scale diagnostics for quasi-operational and comprehensive evaluation of Earth system models in CMIP. Geosci. Model Dev. 2020, 13, 3383–3438. [Google Scholar] [CrossRef]
  48. Ngoma, H.; Wen, W.; Ojara, M.; Ayugi, B. Assessing current and future spatiotemporal precipitation variability and trends over Uganda, East Africa based on CHIRPS and Regional Climate Models Datasets. Meteorol. Atmos. Phys. 2021. [Google Scholar] [CrossRef]
  49. IPCC. Summary for Policymakers. In Global Warming of 1.5°C. An IPCC Special Report on the Impacts of Global Warming of 1.5°C above Pre-Industrial Levels and Related Global Greenhouse Gas Emission Pathways, in the Context of Strengthening the Global Response to the Threat of Climate Change, Sustainable Development, and Efforts to Eradicate Poverty; Masson-Delmotte, V., Zhai, P., Pörtner, H.-O., Roberts, D., Skea, J., Shukla, P.R., Pirani, A., Moufouma-Okia, W., Péan, C., Pidcock, R., Eds.; IPCC: Geneva, Switzerland, 2018; in press; Available online: https://www.ipcc.ch/site/assets/uploads/sites/2/2019/05/SR15_SPM_version_report_LR.pdf (accessed on 15 December 2020).
  50. Giannakopoulos, C.; Hadjinicolaou, P.; Zerefos, C.; Demosthenous, G. Changing energy requirements in the Mediterranean under changing climatic conditions. Energies 2009, 2, 805–815. [Google Scholar] [CrossRef] [Green Version]
  51. Mathbout, S.; Lopez-Bustins, J.A.; Royé, D.; Martin-Vide, J.; Bech, J.; Rodrigo, F.S. Observed Changes in Daily Precipitation Extremes at Annual Timescale Over the Eastern Mediterranean During 1961–2012. Pure Appl. Geophys. 2018, 175, 3875–3890. [Google Scholar] [CrossRef]
  52. Trigo, R.M.; Vaquero, J.M.; Stothers, R.B. Witnessing the impact of the 1783–1784 Laki eruption in the Southern Hemisphere. Clim. Chang. 2010, 99, 535–546. [Google Scholar] [CrossRef]
  53. Kelley, C.P.; Mohtadi, S.; Cane, M.A.; Seager, R.; Kushnir, Y. Climate change in the Fertile Crescent and implications of the recent Syrian drought. Proc. Natl. Acad. Sci. USA 2015, 112, 3241–3246. [Google Scholar] [CrossRef] [Green Version]
  54. Khomsi, K.; Mahe, G.; Tramblay, Y.; Sinan, M.; Snoussi, M. Trends in rainfall and temperature extremes in Morocco. Nat. Hazards Earth Syst. Sci. Discuss. 2015, 3, 1175–1201. [Google Scholar] [CrossRef] [Green Version]
  55. Tan, G.; Ayugi, B.; Ngoma, H.; Ongoma, V. Projections of future meteorological drought events under representative concentration pathways (RCPs) of CMIP5 over Kenya, East Africa. Atmos. Res. 2020, 246, 105112. [Google Scholar] [CrossRef]
  56. Li, Y.; Yan, D.; Peng, H.; Xiao, S. Evaluation of precipitation in CMIP6 over the Yangtze River Basin. Atmos. Res. 2020, 253, 105406. [Google Scholar] [CrossRef]
  57. Ahmed, K.; Sachindra, D.A.; Shahid, S.; Demirel, M.C.; Chung, E.S. Selection of multi-model ensemble of general circulation models for the simulation of precipitation and maximum and minimum temperature based on spatial assessment metrics. Hydrol. Earth Syst. Sci. 2019, 23, 4803–4824. [Google Scholar] [CrossRef] [Green Version]
Figure 1. Geographical map of the study domain (North Africa), the division between the countries is outlined by the black line.
Atmosphere 12 00475 g001
Figure 2. Annual cycle of mean monthly rainfall (mm/month) over North Africa for the period 1951–2014, of ensemble mean and Coupled Model Intercomparison Project phase 6 (CMIP6) models alongside Climatic Research Unit (CRU) and Global Precipitation Climatology Centre (GPCC) datasets. CRU is represented by thick black dots, GPCC by the thick green and ensemble by the thick blue line. The highlighted rainfall rate in purple corresponds to the mean ± standard deviation of the 15 Global Circulation Models (GCMs). The gray highlighted section represents the peak rainfall season.
Atmosphere 12 00475 g002
Figure 3. Spatial distribution of December–February (DJF) mean rainfall for observations (CRU and GPCC), CMIP6 models, and mean ensemble over North Africa during 1951–2014.
Atmosphere 12 00475 g003
Figure 4. Spatial difference of linear trends of annual rainfall of CMIP6 models and the ensemble mean over North Africa during 1951–2014 alongside observation datasets (CRU and GPCC). Observations and mean ensemble are marked with red color.
Atmosphere 12 00475 g004
Figure 5. Same as Figure 4 but for DJF season.
Atmosphere 12 00475 g005
Figure 6. Rainfall bias between CMIP6 models and CRU dataset over North Africa, 1951–2014.
Atmosphere 12 00475 g006
Figure 7. Rainfall coefficient of determination between 15 CMIP6 models and CRU rainfall dataset over North Africa for the period 1951–2014.
Atmosphere 12 00475 g007
Figure 8. Temporal RMSE (mm/year) of ensemble and CMIP6 models against CRU data over North Africa for the mean monthly annual rainfall for the period 1951–2014.
Atmosphere 12 00475 g008
Figure 9. Taylor diagram of fifteen CMIP6 models and CRU dataset over North Africa for the 1951 to 2014.
Atmosphere 12 00475 g009
Figure 10. Taylor skill score (TSS) and ranking of fifteen CMIP6 models and CRU dataset over North Africa for 1951 to 2014.
Atmosphere 12 00475 g010
Table 1. Mean value, Modified Mann-Kendall trends, and Sen Slope values of Annual and DJF season over North African during 1951–2014 using CRU and GPCC against CMIP6 models. * indicates significant trend at 5% significance level.
Model Annual DJF
MeanZ-Score Slope (mm/yr)MeanZ-ScoreSlope (mm/yr)
CRU147.73−2.03 *−0.2260.20−2.32 *−0.12
GPCC154.50−1.80 *−0.2162.44−2.06 *−0.13
BCC-CSM2-MR166.760.420.0447.150.60.04
BCC-ESM1145.4−2.1 *−0.2343.9−1.2−0.07
CanESM5156.45−0.19−0.0237.230.110.01
CESM2-WACCM122.35−0.97−0.1239.52−0.7−0.06
CESM2155.710.890.1155.110.740.05
CNRM-CM6-1185.380.940.1864.37−0.05−0.01
CNRM-ESM2-1172.550.380.0680.92−1.19−0.11
EC-Earth3-Veg122.780.460.0351.260.90.05
GFDL-CM4164.98−1.01−0.1461.82−0.82−0.05
GFDL-ESM4151.87−0.83−0.1175.09−2.35 *−0.17
IPSL-CM6A-LR136.960.770.1147.29−0.23−0.02
MRI-ESM2-0173.540.330.0860.170.60.04
NorESM2-LM134.730.570.0646.06−0.61−0.05
SAMO-UNICON151.96−0.76−0.1248.9−0.41−0.03
UKESM1-0-LL151.41−0.12−0.0259.120.180.01
Ensemble154.95−1.05−0.0455.59−1.16−0.02
Table 2. Summary statistical indices and skill score of CMIP6 model performance for monthly temporal scale against CRU data over North Africa during 1951–2014, * represents significance at 0.05.
ModelR2RMSE(mm)Bias (mm)T StatTSS
BCC-CSM2-MR0.415.780.561.620.67
BCC-ESM10.296.55−0.98−2.86 *0.58
CanESM50.147.31−1.96−6.13 *0.43
CESM2-WACCM0.356.920.952.47 *0.62
CESM20.366.690.82.11 *0.64
CNRM-CM6-10.379.65.2911.9 *0.58
CNRM-ESM2-10.379.284.7910.86 *0.58
EC-Earth3-Veg0.585.22−1.26−3.35 *0.78
GFDL-CM40.496.441.854.6 *0.70
GFDL-ESM40.457.082.877.16 *0.68
IPSL-CM6A-LR0.445.73−0.97−2.82 *0.68
MRI-ESM2-00.367.953.217.83 *0.61
NorESM2-LM0.436.2−2.05−5.68 *0.69
SAM0-UNICON0.048.621.143.29 *0.36
UKESM1-0-LL0.525.960.230.580.72
Ensemble0.664.361.233.69 *0.79
Publisher’s Note: MDPI stays neutral with regard to jurisdictional claims in published maps and institutional affiliations.

