Article

Limitations of GC-QTOF-MS Technique in Identification of Odorous Compounds from Wastewater: The Application of GC-IMS as Supplement for Odor Profiling

1
State Key Laboratory of Environmental Aquatic Chemistry, Research Center for Eco-Environmental Sciences, Chinese Academy of Sciences, Beijing 100085, China
2
University of Chinese Academy of Sciences, Beijing 100049, China
3
Research and Development Center, Beijing Drainage Group Co., Ltd., Beijing 100124, China
4
School of Environmental Studies, China University of Geosciences, Wuhan 430074, China
*
Authors to whom correspondence should be addressed.
Atmosphere 2021, 12(2), 265; https://doi.org/10.3390/atmos12020265
Submission received: 25 January 2021 / Revised: 9 February 2021 / Accepted: 10 February 2021 / Published: 17 February 2021
(This article belongs to the Special Issue Environmental Odour)

Abstract

:
Odorous emissions from wastewater treatment plants (WWTPs) cause negative impacts on the surrounding areas and possible health risks on nearby residents. However, the efficient and reliable identification of WWTPs’ odorants is still challenging. In this study, odorous volatile organic compounds (VOCs) from domestic wastewater at different processing units were profiled and identified using gas chromatography-ion mobility spectrometry (GC-IMS) and gas chromatography quadrupole-time-of-flight mass spectrometry (GC-QTOF-MS). The GC-QTOF-MS results confirmed the odor contribution of sulfur organic compounds in wastewater before primary sedimentation and ruled out the significance of most of the hydrocarbons in wastewater odor. The problems in odorous compounds analysis using GC-QTOF-MS were discussed. GC-IMS was developed for visualized analysis on composition characteristics of odorants. Varied volatile compounds were detected by GC-IMS, mainly oxygen-containing VOCs including alcohols, fatty acids, aldehydes and ketones with low odor threshold values. The fingerprint plot of IMS spectra showed the variation in VOCs’ composition, indicating the changes of wastewater quality during treatment process. The GC-IMS technique may provide an efficient profiling method for the changes of inlet water and performance of treatment process at WWTPs.

1. Introduction

In 2019, air pollution accounted for the largest proportion of environmental complaints in China (50.8%), of which malodor problems were up to 41%. Wastewater treatment plants (WWTPs) often received severe reprimand for the sensory nuisances and physiological risks [1,2]. Moreover, it was found that the odor of wastewater effluent may impact the quality of drinking water when released to waters that served as drinking water source [3]. Compared with the industrial odor, the odor of domestic wastewater during treatment in WWTPs is complex and variable, due to its wide sources and various biochemical reactions. As known, odorous emissions from WWTPs are made up of inorganic compound (hydrogen sulfide, ammonia) and organic compound (sulfur organic compounds, nitrogenous organic compounds, alcohols, aldehydes, terpenes, carbonyls, aromatics, fatty acids, alkanes, alkenes, ketones, esters and halogenated hydrocarbons) [4,5,6,7,8,9,10,11,12]. Among them, volatile sulfur organic compounds (VSOCs) are principal odorants except hydrogen sulfide, and non-sulfur volatile organic compounds (VOCs) are increasingly important to contribute to odorous emission [13]. It is worth noting that, besides the complexity of odor emissions in composition, the concentration difference of compounds is significant. In addition, there are apparent diversities of VOCs emitted from different WWTPs or treatment processes. Thus, in order to assess the pollution impact and develop odor control techniques, it is imperative to obtain the information of compounds contributing to odor and establish the odor emission profile of WWTPs.
Nowadays, odor measurement is usually carried out using sensorial analysis and chemical analysis methods [2,14]. Sensory methods [1] provide information for odor description, odor concentration [4,15,16], odor intensity [3], odor wheels [17,18,19,20] and hedonic tones [21]. Chemical analysis can provide accurately and objectively determining information of the chemical composition of odors which mainly apply gas chromatography-mass spectrometry (GC-MS) with different pre-concentration methods. Over the last decade, portable GC-MS instruments have been more widely applied in situ analysis of odor emissions. The development of this technology benefits from the invention of ambient ionization techniques, such as desorption electrospray ionization (DESI) and desorption atmospheric pressure chemical ionization (DAPCI) [22,23,24]. The portable instruments are especially useful for measuring parameters for mapping of air pollutants. However, the application of laboratory instruments is more widespread due to their advantages in identification ability of analytes. For instance, closed-loop stripping analysis (CLSA) combined with GC-MS has been used for investigating the time and space patterns of VOCs from wastewater treatment plants based on the list of EPA Method [25]. Headspace-solid phase microextraction (HS-SPME) combined with GC-MS has been applied to identify a wide spectrum of VOCs [26]. Meanwhile, the endeavor [27] have been done through combining GC-MS and gas chromatography-flame ionization detection and olfactometry (GC-FID/O) to characterize odorous emissions, and other studies [28,29,30,31] have also applied various modalities of GC-MS to characterize odor problems. The summary of methods used for odor determination is listed in Table 1. Most analytic modes of VOCs are using a nontargeted screening approach before determining concentration of selected compounds. In other words, scan mode is used to detect all possible compounds within sample through acquiring total ion chromatogram, then selected ion monitoring (SIM) mode is utilized as a quantitative method for targeted analysis. Although the selectivity and sensitivity of GC-MS applied in organic analysis is excellent and undisputed, there is a shortage of approach for simultaneous target quantification and nontarget screening for VOCs basing on the reported literature data. The ion separation mode of time-of-flight mass spectrometer (TOF-MS) is differed from quadrupole mass spectrometry. The fragments of all ions are pulsed into the flight tube and separated according to their different flight times. Consequently, high-sensitivity and full-spectrum acquisition data are simultaneously obtained in gas chromatography quadrupole-time-of-flight mass spectrometry (GC-QTOF-MS). It is possible to carry out target and nontarget analysis which can acquire more information in one time. Using narrow mass windows to decrease the background noise, the selectivity of QTOF-MS was highly improved and met requirements for detection. However, there is always detection scope restricting the application of analytical method. Thus, a supplementary approach should be considered, and comprehensive detection of VOCs requires multiple methods.
Gas chromatography-ion mobility spectrometry (GC-IMS) is extensively applied to investigate odor measurement/characterization. Generally, GC-IMS spectrum is presented in a three-dimensional form: first dimension is gas chromatography retention time of analytes, second dimension is the ions’ drift time, and the third dimension is the signal intensity. Thus, highly resolved fingerprints of VOCs from liquid or solid samples can be obtained through GC-IMS which operated at atmospheric pressure and employed no sample pretreatment [32,33,34]. GC-IMS analysis has been extensively used in food and environment areas [35,36,37,38,39]. Attributed to its high sensitivity of small molecule compounds, application of GC-IMS may serve as a complement to GC-MS analysis.
In this study, we expect to design an approach base on a different analytical platform for wide screening and characterization of odorous VOCs emitted from wastewaters. The significant differences in VOCs among different wastewater processes were obtained using GC-IMS tool. In view of the advantages of two chromatographic methods, headspace-solid phase microextraction-gas chromatography quadrupole-time-of-flight mass spectrometry (HS-SPME-GC-QTOF-MS) and headspace-gas chromatography-ion mobility spectrometry (HS-GC-IMS) are utilized and combined to provide the comprehensive information of VOCs of wastewater samples. In order to find the optimal way to analyze wastewater odorous VOCs, the experimental design has been previously done and is shown in Figure S1. A subset of VOCs included in the list of EPA Method 524.2 are selected as target compounds. These compounds are hazardous air pollutants (HAPs) that can cause environmental and human health concerns. Among them, some compounds can be perceived as odorants when they reach a certain concentration. In addition, the common odorants appeared in WWTPs are listed in Table 2 referring to the classification of literature [17]. The methodological strategy is validated and then the results are expected to provide information of potential odorants.

2. Materials and Methods

2.1. Chemicals and Materials

The mixing standard substances and the internal standard (IS) (1,2-dichlorobenzene-d4, 98.5% purity) were purchased from o2si (South Carolina, USA). Dimethyl disulfide (DMDS, 99%) and dimethyl trisulfide (DMTS, 99%) were obtained from J&K Scientific Co., Ltd. (Beijing, China), HPLC-gradient grade methanol and dichloromethane were from Merck (Darmstadt, Germany). Ultrapure deionized water (R ≥ 18.2 MΩ cm−1) was produced with a Milli-Q purification system. Standard stock solutions were diluted by methanol or dichloromethane from the pure compounds in different concentrations between 1 and 10 mg/L, and stored at −20 °C. The external calibration solutions were made daily by diluting the standard solutions to the required concentration with ultrapure deionized water.

2.2. Sampling

The samples were taken from a wastewater treatment plant of Beijing (China). The background information of the WWTP was descripted in Supplementary Material and Figure S2. Wastewater samples were collected at nine sampling sites along the treatment process on 2 September 2019, including influent wastewater (IW), rotational flow grit basin inlet (GBI), rotational flow grit basin outlet (GBO), primary sedimentation tank outlet (PSO), anaerobic tank outlet (ANO), aerobic tank outlet (AO), secondary sedimentation tank outlet (SSO), nitrification outlet (NO) and denitrification outlet (DNO). Compared to odor detection on site, the application of solid phase microextraction (SPME) in laboratory was simple and convenient for identifying potential odorants emitted from wastewaters. This approach was considered to determine the odor emission capacity of wastewater, and then to predict the major odor sources in WWTPs. The samples were collected using 25 mL brown glass bottles with minimal headspace and delivered to the laboratory on the day of collection, and stored at 4 °C prior to analysis.

2.3. GC-QTOF-MS Analysis

2.3.1. SPME Conditions

The wastewater samples were subjected to SPME pre-concentration and analyzed by GC-QTOF-MS. The extraction method was carried out using SPME fibers with dual coating of divinylbenzene and carboxene (50/30 μm) suspended in polidimethylsiloxane (DVB/CAR/PDMS) made by Supelco (Bellefonte, PA, USA). First, sample bottles were filled with 10 mL samples. The pre-extraction incubation of the sample was performed in the agitation unit at 500 rpm and at 40 °C for 5 min. Then the SPME device fibers which previously had been conditioned according to manufacturer’s recommendations were inserted into the headspace above the sample bottle. The extraction conditions were: stirring at 500 rpm, extraction time 20 min and extraction temperature 40 °C. Final SPME device fibers were instantly desorbed thermally for 5 min at 260 °C in an injector of gas chromatograph.

2.3.2. Chromatographic Conditions

The GC-QTOF-MS instrument comprised of 7890A gas chromatograph and 7200 QTOF mass spectrometer, equipped with an electron ionization (EI) source, obtained from Agilent (Wilmington, DE, USA). Automated recalibration of the mass axis was carried out every 6 injections. Two same columns used for compound separation were DB-5MS capillary columns (15 m × 0.25 mm × 0.25 μm), which were also acquired from Agilent. Helium was used as carrier gas at a constant flow of 1.2 mL min−1 and the column temperature was programed as follows: 30 °C (4 min), rated at 3 °C min−1 to 110 °C (2 min), and finally at 20 °C min−1 to 260 °C with a hold time of 1 min. Injections were made in the splitless mode. The transfer line and the EI source were set at 280 and 230 °C, respectively. The solvent delay was fixed at 3 min. The mass range was 40–350 m/z. Perfluorotributylamine was used for the daily mass calibration and as lock mass, and the m/z ion monitored was 218.9856. The TOF mass analyzer was operated in the 2 GHz mode. TOF-MS resolution was approximately 7000 (FWHM). Library search was performed using the commercial NIST library.

2.3.3. Qualitative Screening Protocol

The investigation of nontarget compounds in wastewater, a complex matrix, was hard work because there were huge amounts of peaks which interfered in identification. GC-QTOF-MS always works under full-spectrum acquisition mode at accurate mass, which could obtain more precise m/z information of sample. The potential compounds could be easily identified by using nontarget analysis. The acquired data were processed and carried out by applying the unknown analysis, a module of Agilent MassHunter software, which automatically investigated the presence of nontarget compounds in samples. The identification criterion was the presence of five m/z ions at the expected retention time and at accurate mass (five peaks could be observed in the extracted ion chromatograms). Additionally, contrast mass spectrum between standard and sample were obtained by searching in the library which further confirmed the presence of potential compounds. Next step, the compounds considered as relevant odorant could be added to the list of target analytes, and then these would be quantified by using quantitative method.

2.3.4. Quantitative Method Performance

The presence of nontarget compounds was investigated prior to target method, then the target analysis was subsequently performed, which did not require reanalyzing the samples. The calibration standards of 50, 100, 200, 500 and 1000 ng/L were prepared by dilutions of the mixing standard with ultrapure deionized water and added internal standards (IS) (500 ng/L) to generate the calibration curve. The quantification was based on five-point external calibration curve obtained by plotting the peak areas against the concentration of the corresponding standards. The MassHunter software (Agilent Technologies Inc., Wilmington, DE, USA ) automatically processed data and reported quantitative results. The developed method was validated using standard solutions and real samples to evaluate the precision, accuracy, linearity, selectivity, limits of detection (LODs) and limits of quantification (LOQs).

2.4. GC-IMS Analysis

2.4.1. Instrument Parameters

Analyses of GC-IMS were performed on a FlavourSpec GC-IMS from Gesellschaft für Analytische Sensorysteme mbH (G.A.S., Dortmund, Germany). A gas chromatographic column was FS-SE-54-CB-1(5% phenyl, 1%vinyl, 94% methyl polysiloxane) capillary column (15 m × 0.53 mm, 1 μm film thickness). Nitrogen of 99.99% purity was used as a carrier gas at a programmed flow as follows: 2 mL min−1 for 2 min, 20 mL min−1 for 8 min, 100 mL min−1 for 10 min, 150 mL min−1 for 5 min. After injection, the carrier gas was passed through the injector in order to drive the sample into the column, which was kept at 60 °C for timely separation. The total GC runtime was 30 min. Data were acquired in the positive ion mode. Data were viewed and processed by using the software LAV (version 2.2.1) from G.A.S. The identification of VOCs was based on comparing RI and the drift time with the GC-IMS library. For analysis, 2 g of sample was placed in a 20 mL vial that was then closed with magnetic caps. After 20 min incubation at 65 °C, 500 μL of sample headspace was automatically injected into the heated injector (85 °C) of the device by means of a headspace autosampler from CTC Analytics (Zwingen, Switzerland). In order to exclude random errors of the system, each sample was determined twice in parallel.

2.4.2. Data Analysis

Contrary to targeted analysis of GC-QTOF-MS, GC-IMS analysis was similar to nontarget analysis according to plots which represented signal peaks and signal peak intensities of VOCs. Then identification of VOCs was processed by searching in the GC-IMS library. There are two factors influencing the identification in GC-IMS. Firstly, pressure and temperature in the drift tube were mainly factors that could influence the drift time of analyzed ions. In order to avoid deviations between measurements, the drift time of sample spectra was normalized relative to RIP drift time, which proceed automatically in the LAV software. Secondly, due to the difference of measurement conditions, the GC-IMS spectra need be calibrated by the standard substances before library searching. All standard compounds listed in Table S1, and the GC-IMS chromatogram of mixing standard were presented in Figure S3. For each standard, a monomer and a dimer signal (even a trimer) could be observed due to the relatively high concentration. As shown in Figure S3, each component could be detected more than one signal. The strongest signal (rightmost one) was used for calibration.

3. Results and Discussion

3.1. GC-QTOF-MS

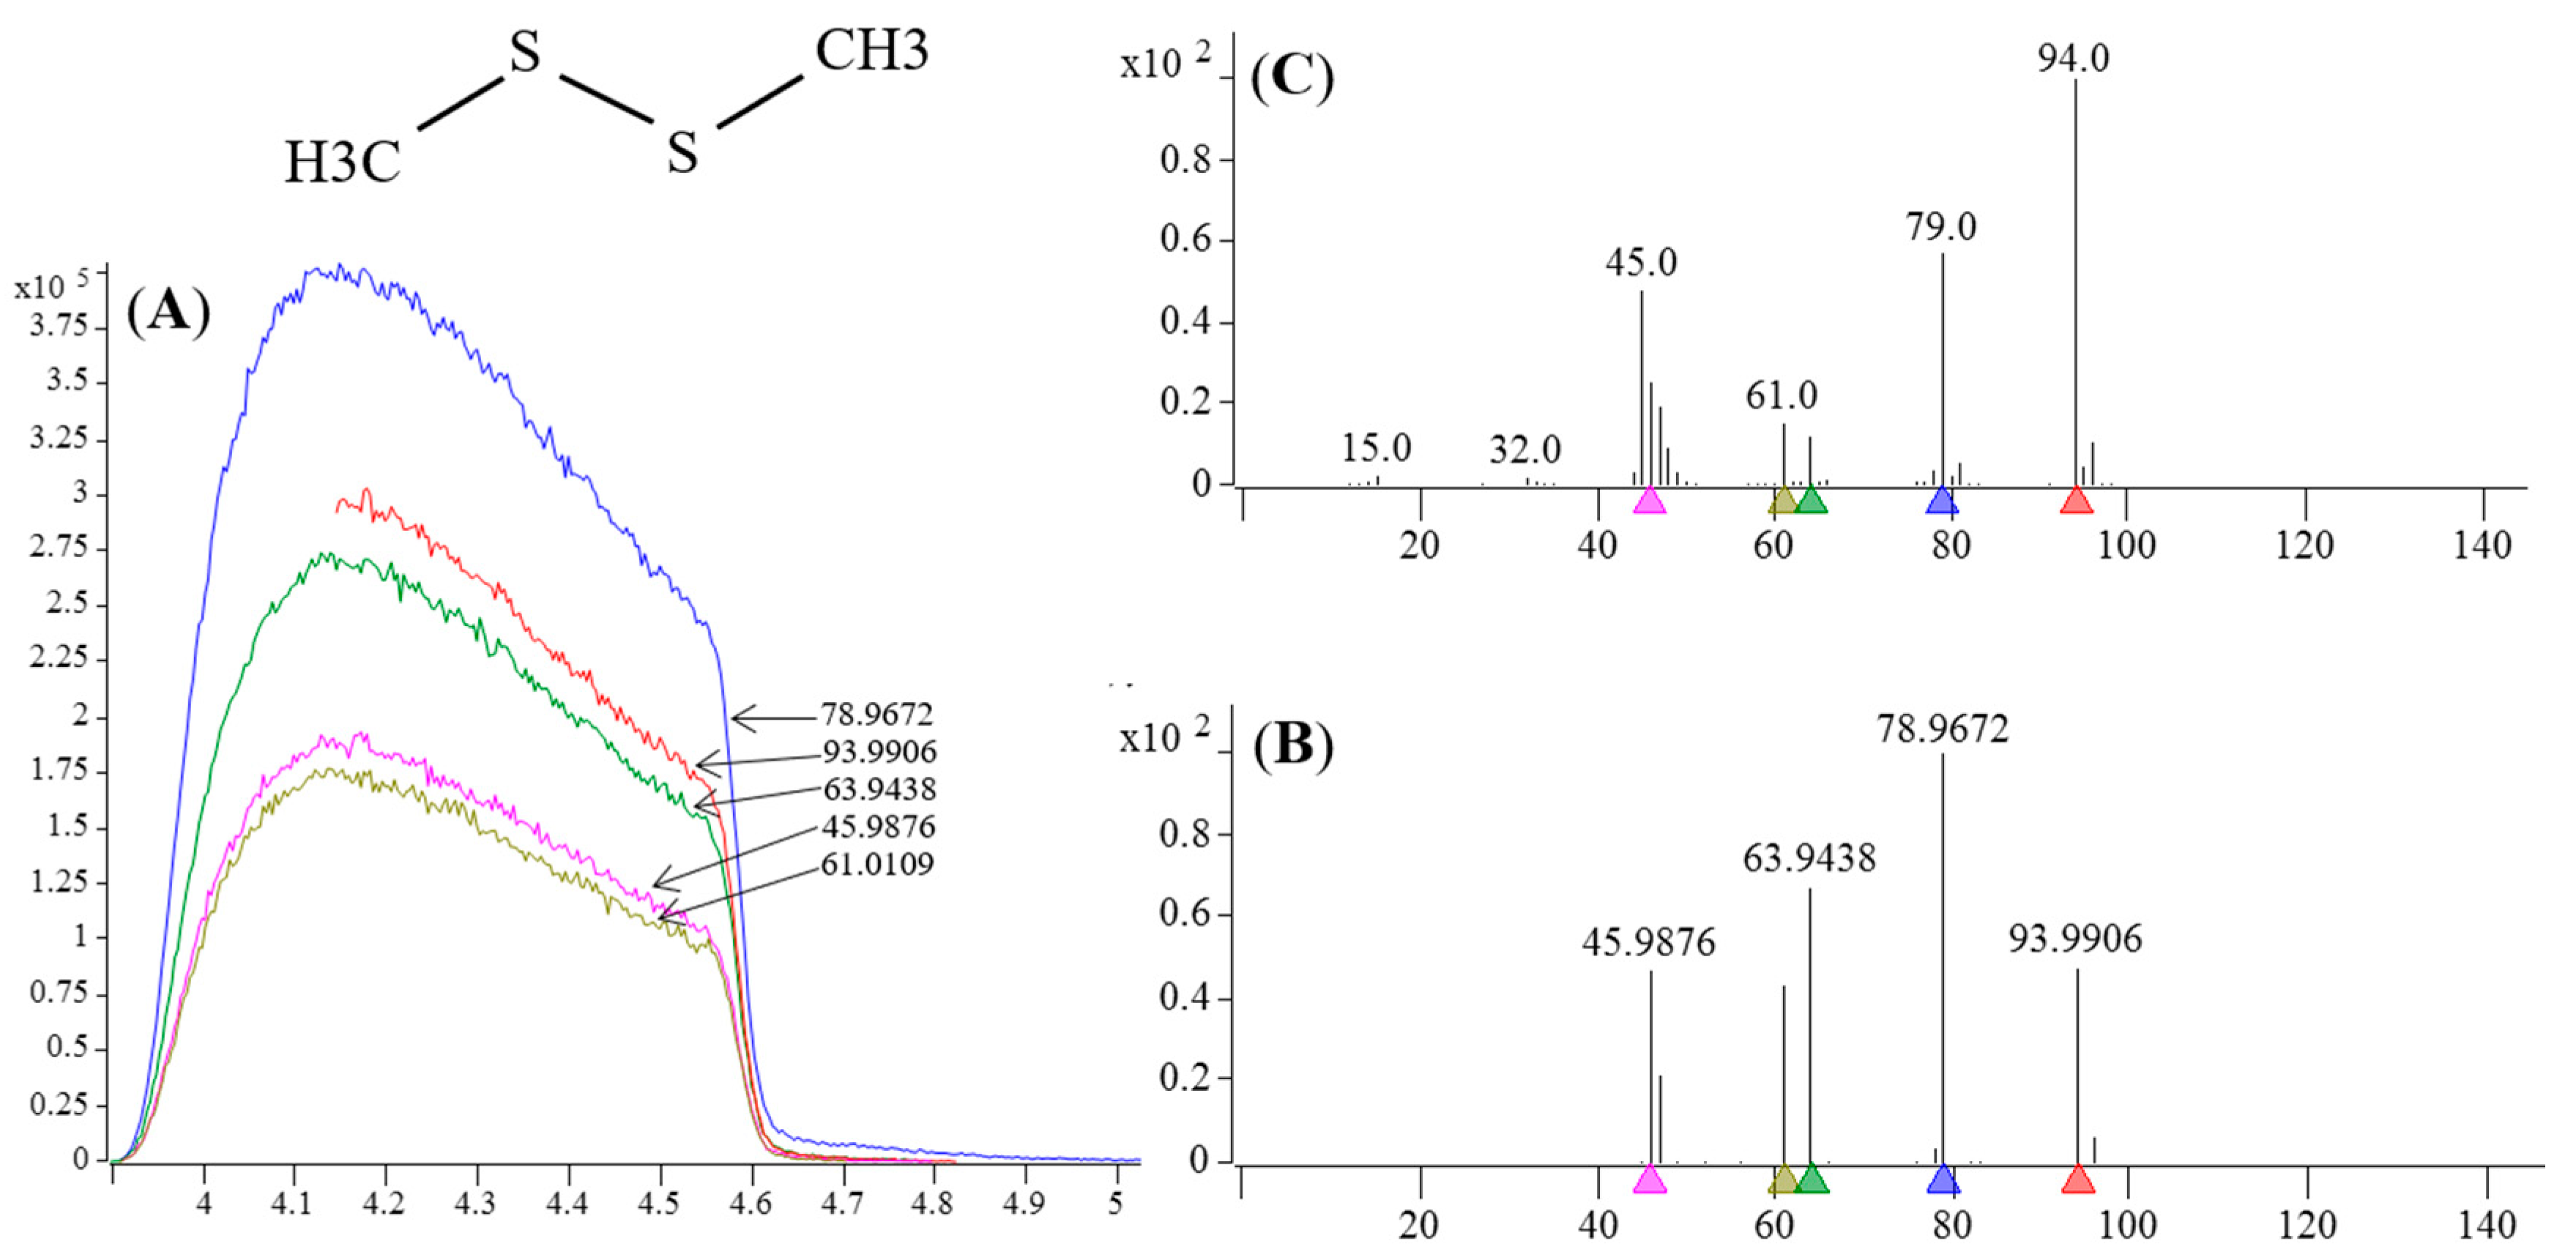
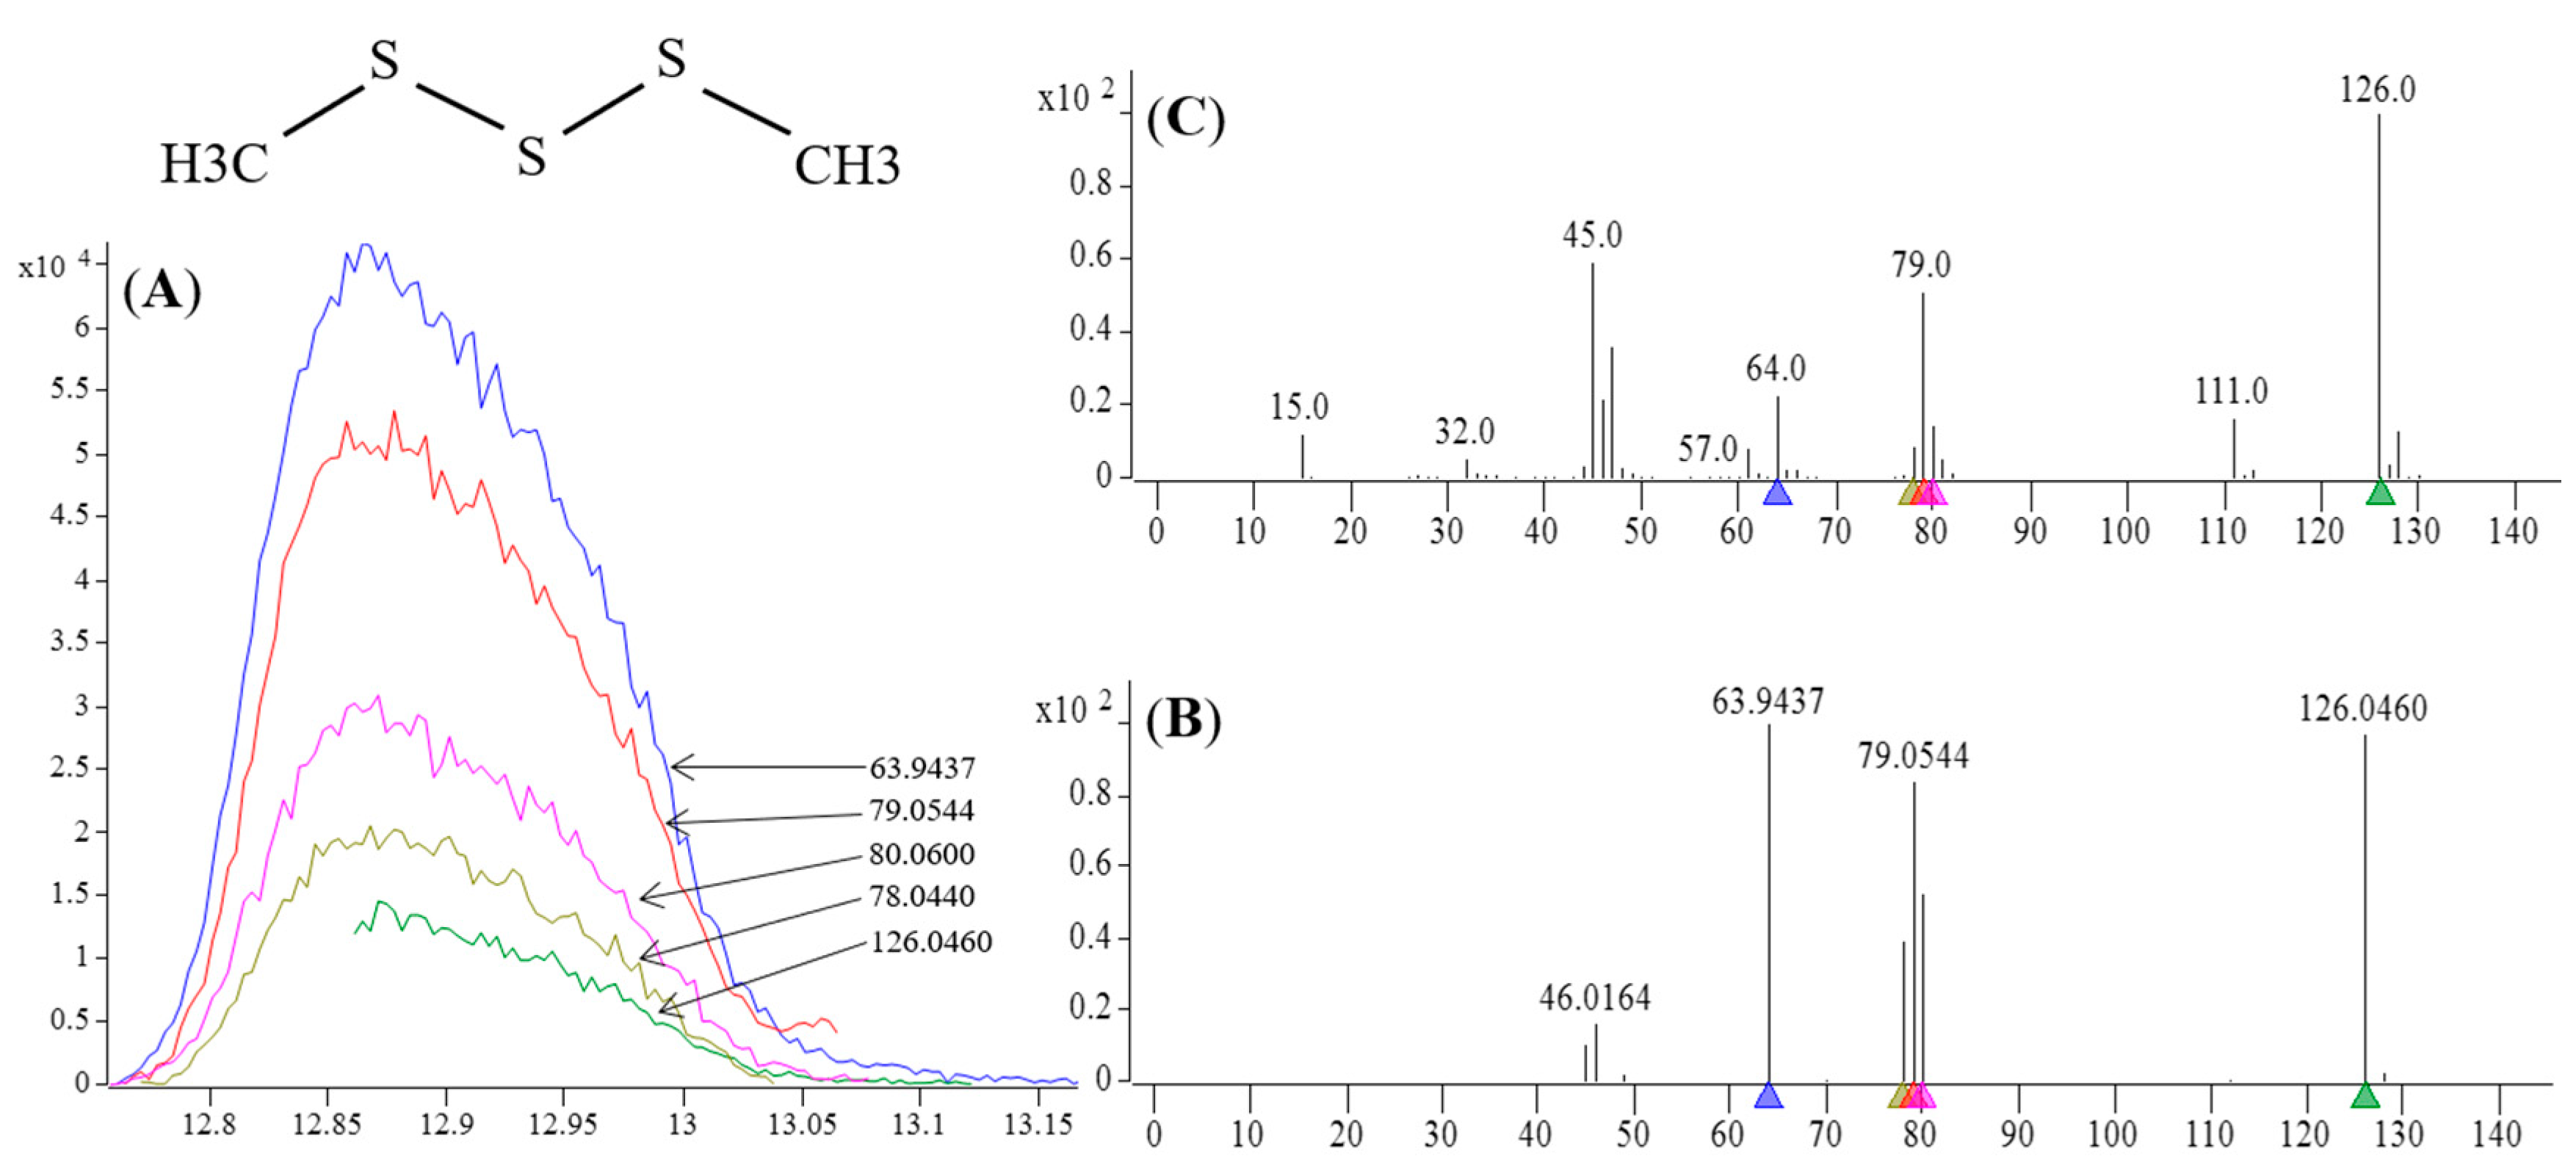
3.1.1. Nontarget Analysis

In total, approximately 40 kinds of VOCs were identified using screening protocol, all of which had match factor (MF) greater than 70 (Table S2). It can be seen that the identified compounds mainly included sulfur organic compounds, nitrogenous organic compounds, benzenes, terpenes, carbonyls, aromatics, and halogenated compounds. Some (toluene, chlorobenzene, 1,4-dichlorobenzene, p-cymene, and naphthalene) were assessed as health indicators and already included in list of target compounds. Due to the unpleasant odor description and low odor threshold concentrations (OTCs), VSOCs have previously reported and demonstrated as significant contributor to sewer [40] and sewage sludge composting plants [41]. There were two identified VSOCs (dimethyl disulfide and dimethyl trisulfide) to be selected as target compounds. Figure 1 showed an example of dimethyl disulfide (DMDS) emitted from influent wastewater (IW) detected using the nontarget analysis. At the expected retention time, five representative m/z ions were automatically used. Figure 2 showed another example, the identification of dimethyl trisulfide (DMTS) was confirmed by the presence of 5 m/z ions also in IW sample. Subsequently, each standard was used to confirm their existence. Then quantitative method of single-point calibration was applied to determine the concentrations of the analytes. DMDS and DMTS were only detected in wastewater samples before PSO with the concentrations ranged from 205.21 ng/L to 689.89 ng/L and from 20.57 ng/L to 70.35 ng/L, respectively. The maximum detected concentrations of DMDS and DMTS were higher than their OTCs, which are 0.0003 mg/kg and 0.00001 mg/kg [42]. DMDS has been recognized as key odorants [43], and it is also found to be the primary odorant in another study [31]. Thus, the presence of DMDS and DMTS in the wastewater during pre-treatment could be smelled by humans and caused odor problems.
The mass accuracy and the ratios between the most abundant ion (Q) and every one of the other measured ions (qi) (Q/qi ratios) are the common problems in nontarget analysis. For example, Q/qi ratios did not accord with that of library mass spectrum, which might be ascribed to the complexity of wastewater matrix. The matrix complexity of environmental samples often leads to the determination errors, thus certain deviations in mass accuracy should be allowed for environmental samples [44].

3.1.2. Target Analysis

The quantitative curve used for target analysis was established using the Agilent MassHunter (QQQ) software. The identification of target analytes in standard substances was carried out by obtaining up to two micro-window extracted ion chromatograms (quantitative and qualitative ions) at selected m/z ions for every compound. Thirty-two VOCs were selected as target compounds in this study, including halogenated hydrocarbons and aromatic hydrocarbons. The accurate m/z of the quantitative and qualitative ions utilized in the method was determined by analyzing the standard substances. The most abundant fragment ion for each compound was selected as the quantitative ion, and typically the second most abundant ion was chosen as the qualitative ion. All the target analytes had unique quantitative and qualitative ions, and all of them were separated during chromatography except for trans- and cis-1,3-dichloropropylene, which co-eluted at 4.024 min, o-, m- and p-xylene, which co-eluted at 8.35 min, and 1,3,5- and 1,2,4-trimethylbenzene, which co-eluted at 12.946 min. These co-eluted compounds were, respectively, constitutional isomers and analyzed together in this method. The information of the target analytes was summarized in Table S3. The results of precision, accuracy, linearity, selectivity, limits of detection (LODs) and limits of quantification (LOQs) are shown in Table S4.

Precision

Intra-day repeatability of the method was assessed using mixing standard at two different levels (n = 5, each level) on the same day. Precision was calculated using the mean, standard deviation, and relative standard deviation (RSD, %). The results, expressed as relative standard deviations (RSD, %), were <15%, while RSD values were below 10% for all target VOCs at 50 ng/L level. The method displayed RSDs between 0.81% and 11.11%, confirming its excellent precision.

Accuracy

The accuracy was the percentage recovery of a known amount of target analyte added to the sample, which was presented as the mean recovery of the analyte from the spiked matrix. Both spiked and non-spiked samples were further subjected to the sample preparation procedure described above, and spiked sample was spiked with two different concentrations (50 ng/L and 500 ng/L). The peak areas of the analyte from the spiked and non-spiked samples were used to calculate the concentration of each analyte. Influent wastewater was used in recovery test, in which spiked and non-spiked samples were measured five times in parallel to calculate the recovery rates and RSDs. The results of recovery test were shown in Table S4. The results (recovery rates of 70.11–115.05% and RSDs of 1.08–17.71%) showed accuracy was found to be satisfactory with quantitative requirements.

Selectivity and Linearity

In this study, selectivity was assessed by injecting five blank samples into GC-QTOF-MS by the above SPME procedure. No compound was detectable that could interfere in the identification and quantitation of the target analytes. Due to excellent mass identification power (narrow mass windows) in QTOF-MS, it was possible to identify in case of co-elution and operate trace-level target analysis. Calibration standards (standard concentrations of 50, 100, 200, 500 and 1000 ng/L in triplicate) were prepared to set up calibration equation and evaluate the linearity of the present method. The present method displayed good linearity (r2 > 0.99) over the concentration range of 50–1000 ng/L for each analyte. The linear range of the proposed method was investigated for 32 target VOCs. As seen in Table S4, the linear range was not the same for all VOCs. The reason could be the competition between target compounds in the SPME equilibrium process and the adsorption saturation of SPME.

Limits of Detection (LODs) and Limits of Quantification (LOQs)
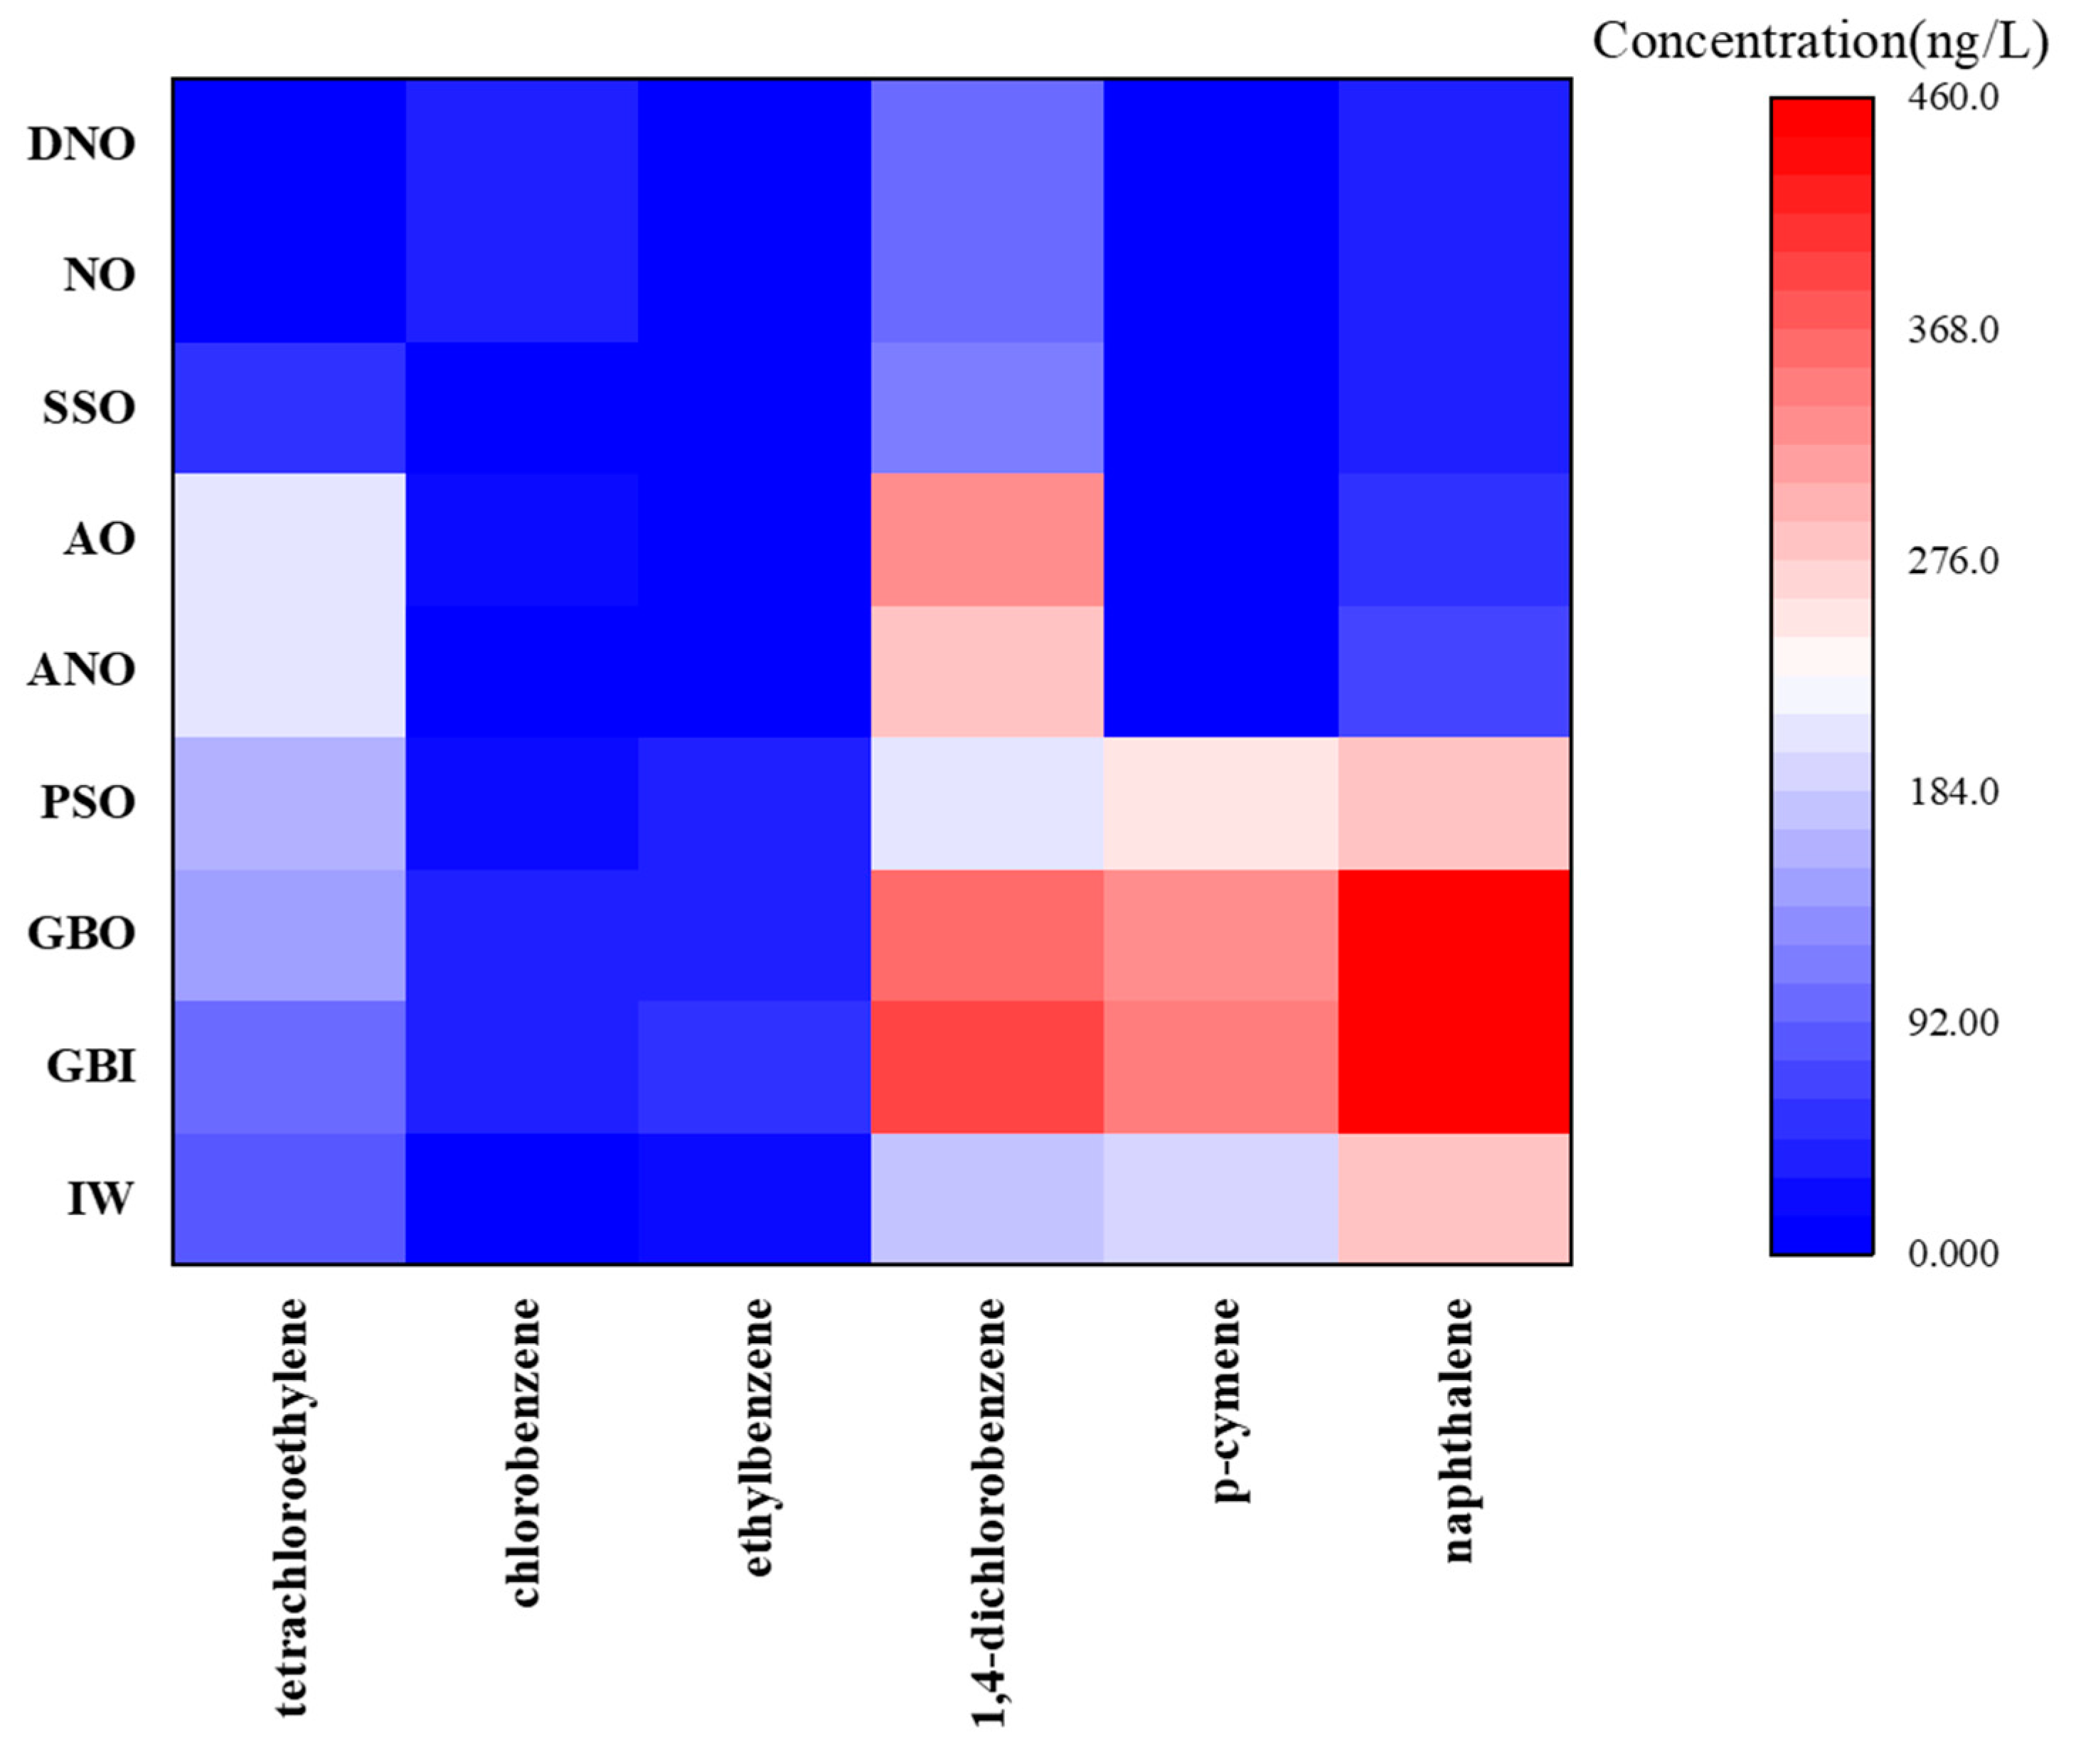
The limit of detection (LOD) was estimated by evaluating the signal-to-noise (S/N) ratio for low concentration (50 ng/L) standards injected into the instrument (n = 5), and 3 times the baseline noise was used as signal for LOD calculation. The LOD values ranged from 0.2 ng/L to 50 ng/L. The LOQ was calculated by 10 times the baseline noise.

Analysis of Samples

The quantitative method was applied to the wastewater samples which were collected from nine sampling sites of WWTP. There was probability that identified compounds were not detected in target analysis due to their concentrations being lower than the method detection limits. The analytical results are listed in Table S5 in Supplementary Information. Many of the compounds detected in this study have previously been reported in other works [13,29]. The frequently detected compounds included tetrachloroethylene, chlorobenzene, ethylbenzene, 1,4-dichlorobenzene, p-cymene, naphthalene. The most abundant component was naphthalene, and it was present in each wastewater sample with concentrations ranging from 31.16 to 468.16 ng/L. The integral characteristic distribution (quantitative results) of detected compounds had been displayed in heat-map (Figure 3). Other compounds with similar concentration were 1,4-dichlorobenzene and p-cymene. However, the results indicated that tetrachloroethylene, chlorobenzene and ethylbenzene were present only in trace amounts, far lower than the above compounds. The OTCs of tetrachloroethylene (0.24 mg/kg), chlorobenzene (0.08 mg/kg), ethylbenzene (2.21 mg/kg), 1,4-dichlorobenzene (0.018 mg/kg), p-cymene (1 mg/kg), naphthalene (0.006 mg/kg) had been reported [42]. Although the concentration of these frequently detected aromatics in the emission from wastewater treatment were lower than their OTCs and could not cause odor problems, their presence has important influence on the overall odor characteristics due to the synergistic effect [13]. In addition, aromatics such as benzene, m-xylene, p-xylene, dimethylbenzene, dichloromethane, toluene, chlorobenzene, and ethylbenzene are selected as health indicators according to Directory of National Environmental Health Risks of China [29]. Thus, the contribution of these compounds to the odor and health risks should not be ignored. In addition, some common potential odorous compounds, such as aldehydes, ketones and fatty acids were not detected. Given the deficiency of GC-QTOF-MS system, we cannot confirm whether there were other substances that contributed to the wastewater odor in this study. Furthermore, the GC-QTOF-MS analysis was rather time consuming to obtain comprehensive information on odorants, especially for diverse wastewaters. Therefore, to further understand the profiles of wastewater odorous compounds, we performed GC-IMS to qualitatively analyze the wastewater samples.

3.2. GC-IMS

The GC-IMS analysis is an analytical method based on the fingerprint in which each composition was represented by a point described by the retention time (measured in seconds, on the y axis), the drift time (measured in milliseconds, on the x axis) and the current signal (measured in millivolts). The signal peaks were represented by colored spots against the blue background in which yellow color to red color represented low intensity peaks to high intensity peaks.

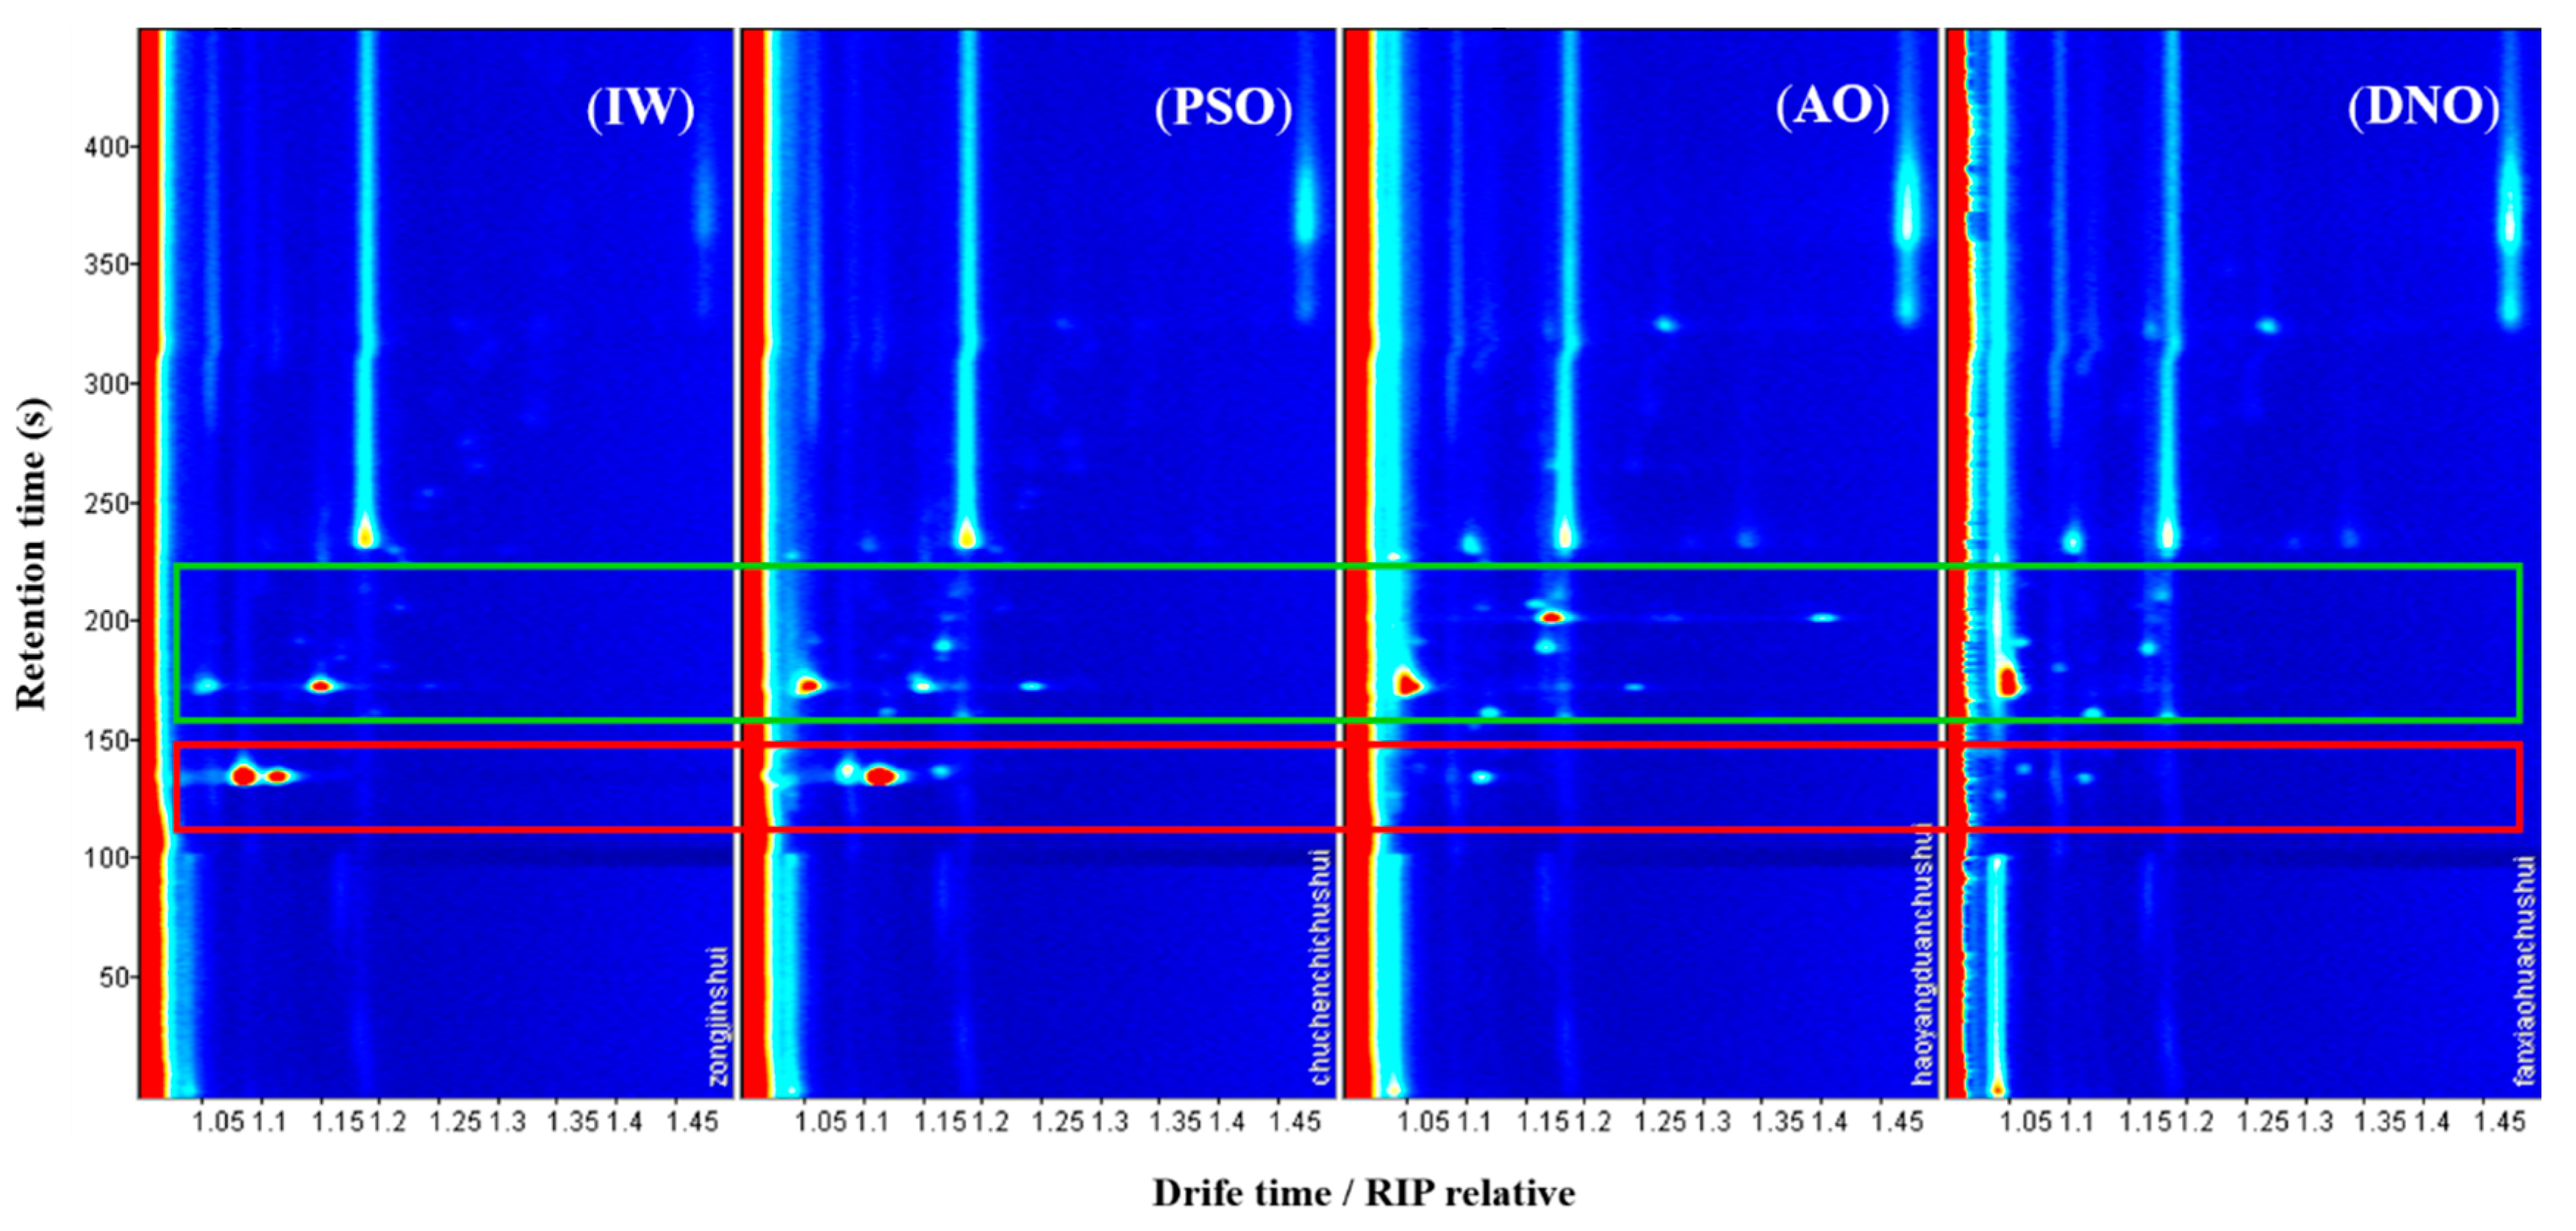
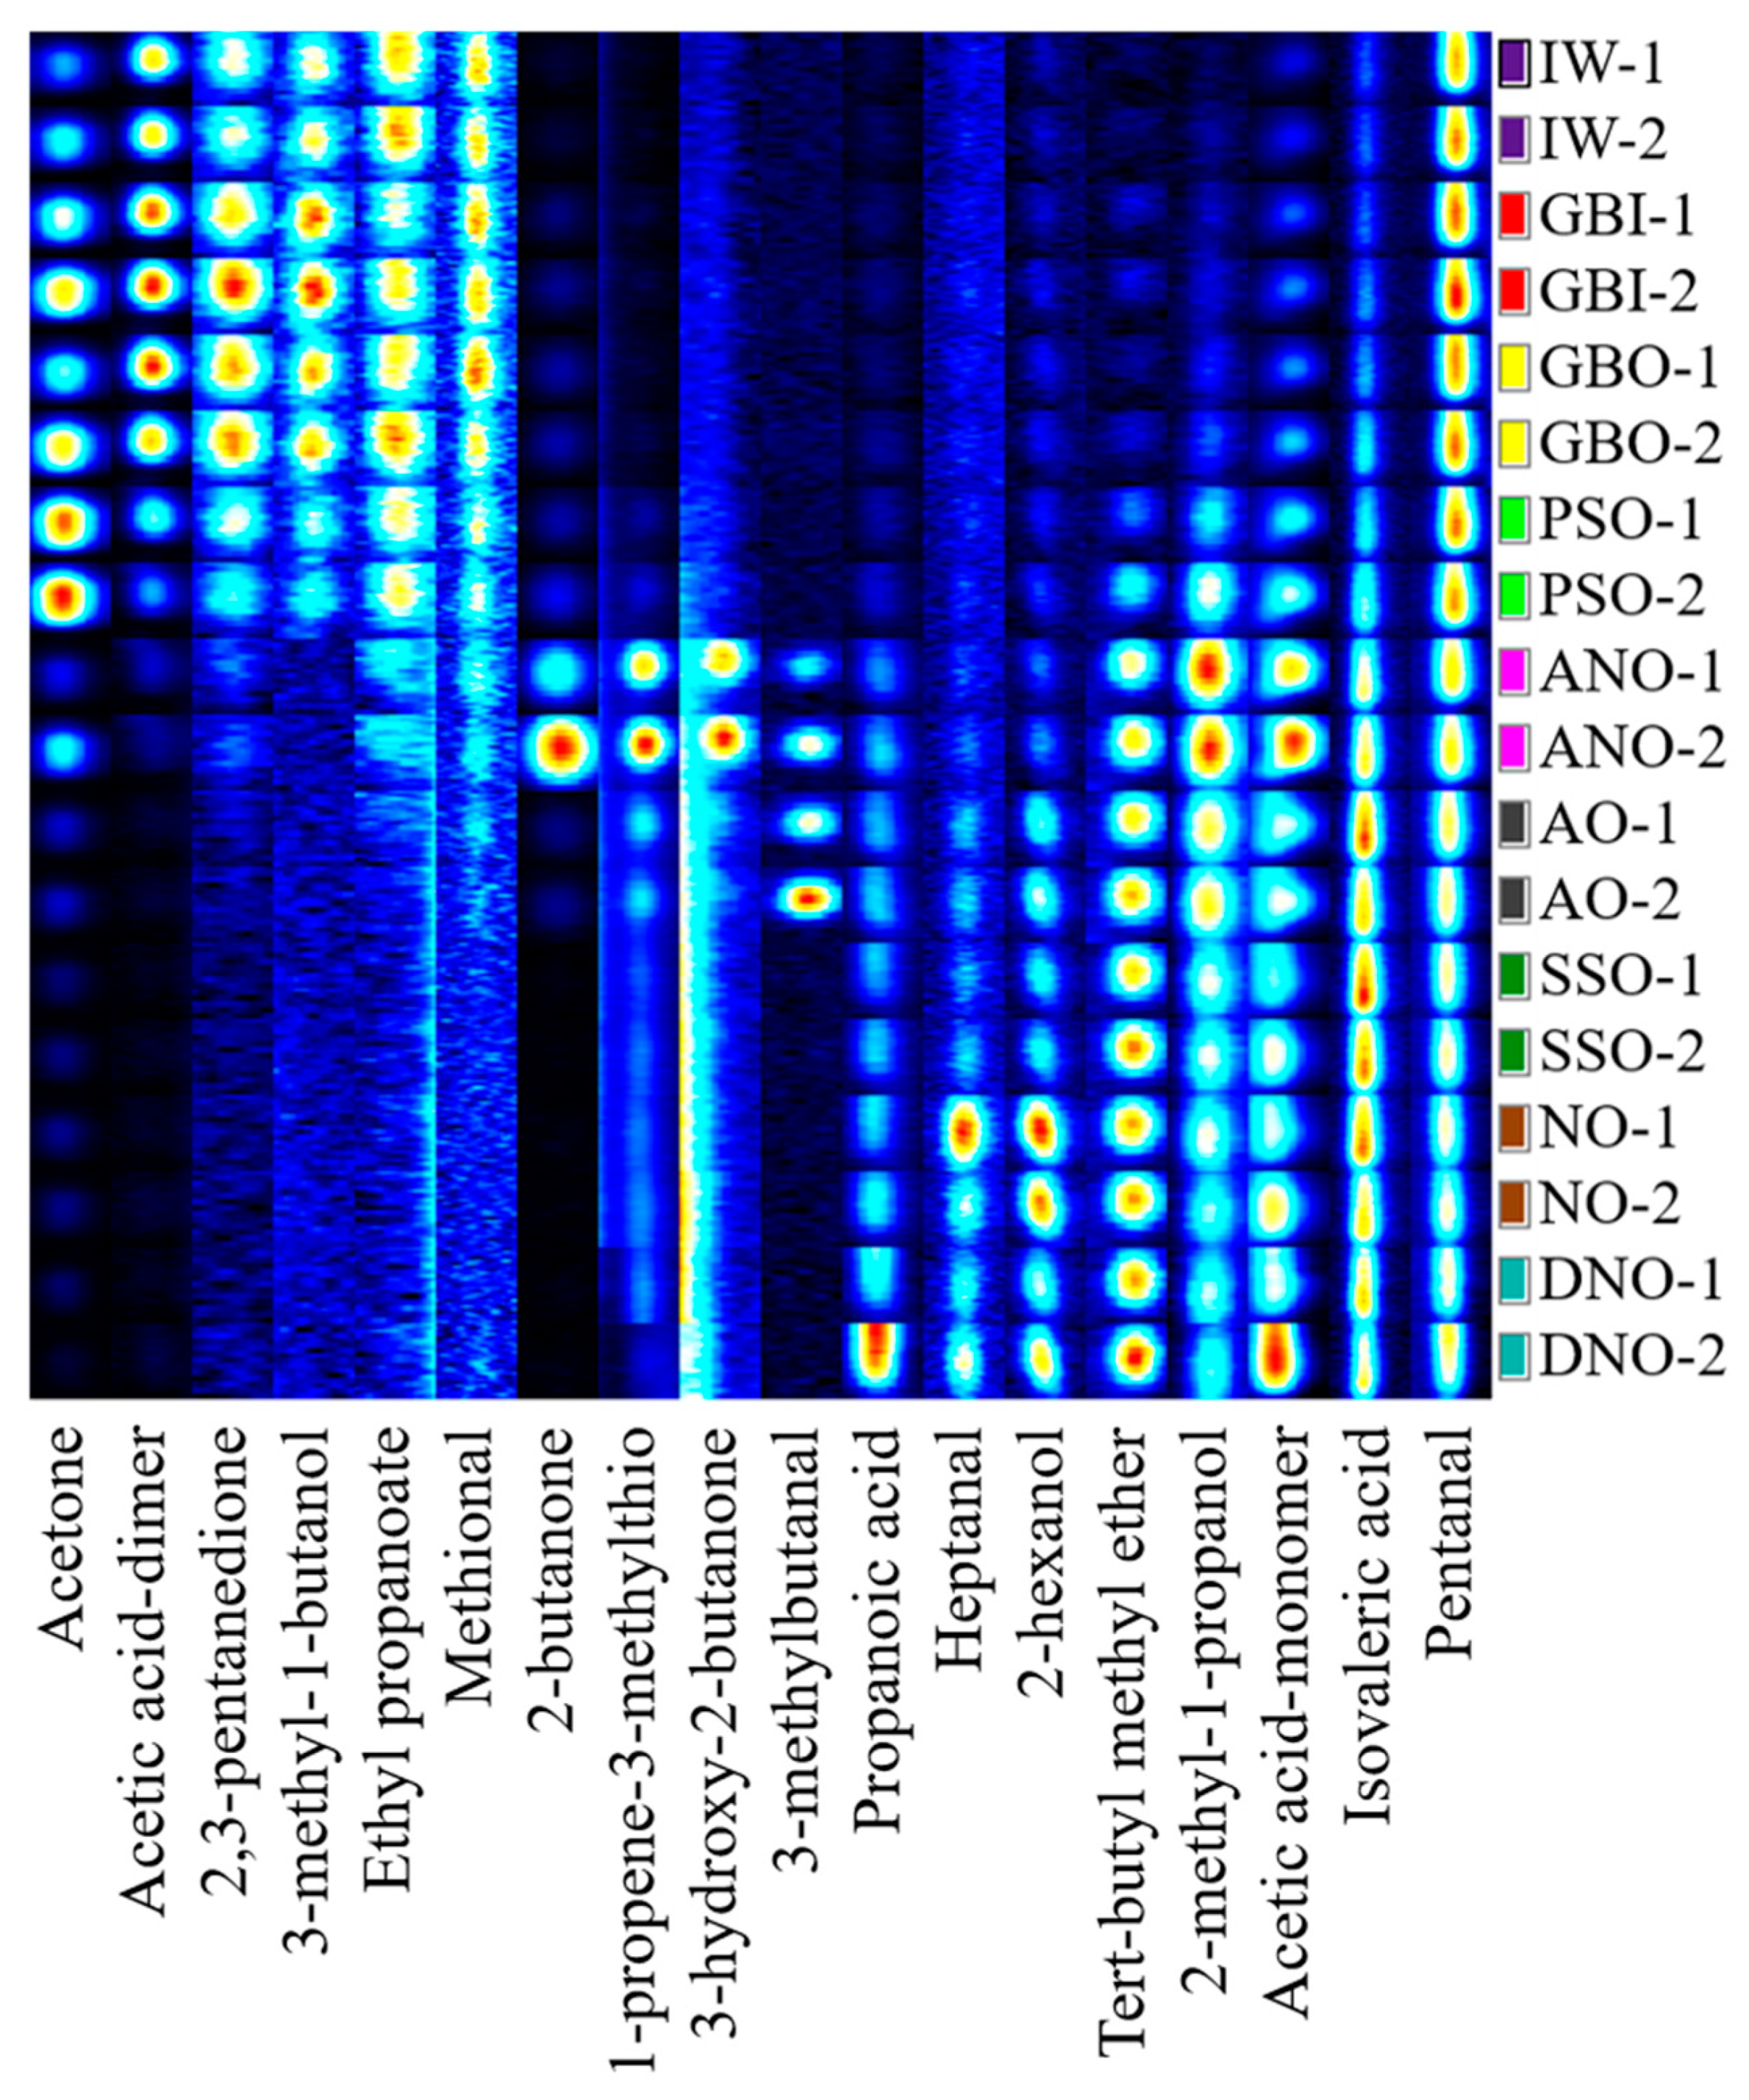
3.2.1. Profile Analysis

As in previous papers, the GC-IMS analysis was generally developed as the fingerprint-based, nontargeted analytical approach for discriminating samples. Therefore, the whole fingerprints were applied to compare the differences in VOCs between samples. The variations of VOCs along wastewater treatment process were assessed by comparing topographic plots of the four groups (IW, PSO, AO and DNO). The profile information was obtained from the peak intensity for all compounds (Figure 4). As seen from Figure 4, the majority of signals located at the zone from the retention time of 100 s–400 s and the drift times of 1 ms–1.5 ms. The retention behavior of analytes was related to boiling point and polarity, so the compounds at the retention time from 100 s to 400 s were considered to be the polar compounds with lower boiling point. In view of signal nature and quantities, the overall VOC’s profile of each process stage was different, and the removal efficiency of VOCs was significantly obtained. Comparing two stages (IW and PSO), it was seen that only differences of VOCs in signal intensities were observed. In fact, it was understandable that the stages before PSO were physical processes and would be insufficient to cause distinct transformation of compounds. After PSO, some signals at retention times around 140 s disappeared or the signal intensities were weakened (the area was marked in the red box, Figure 4), which demonstrated those compounds were absorbed or degraded by microorganisms during anaerobic and aerobic conditions in the bioreactors. On the contrary, some signal intensities were enhanced (the area was marked in the green box, Figure 4) which were attributed to the chemical reactions during biochemical process.

3.2.2. Identification Analysis

GC-IMS has already been used for visualizing the composition of odor emissions from wastewater treatment plants, however, the identification and quantification of the compounds have not been carried out [45]. In this work, about 30 signals were found for total samples and identification analysis of odorants was operated. The identification was achieved using IMS library of the LAV software by comparison of corresponding drift time and retention time of the analytes. The results showed that there were substances which could not be identified by IMS library. It was necessary to enrich the GC-IMS database so as to expand qualitative scope. Even so, we could use GC-IMS library to accurately identify 17 substances which were listed in Table S6. The major odorants identified by GC-IMS are alcohols, organic acids, aldehydes and ketones which have been identified in previous study [26]. Some of the compounds such as acetone, acetic acid, butanone, butanol, pentanal, heptanal, and isovaleric acid have also been presented in an odor wheel which is compiled based on characteristics of the odorants and detection reported in the literatures [17,20]. All of them were selected to develop the gallery plot for characterizing odorous profile. Obvious discrepancy among the wastewater samples was clearly observed (Figure 5). Among the identified compounds, five compounds including acetone, 2,3-pentanedione, 3-methyl-1-butanol, ethyl propanoate and methional were not detectable in the samples after PSO treatment unit. Compounds including 2-butanone, 1-propene-3-methylthio, 3-hydroxy-2-butanone and 3-methylbutanal only appeared in the aerobic biological treatment units (ANO and AO). Isovaleric acid and pentanal were present in all the samples, and pentanal showed stronger signal intensity before PSO than after PSO while the case of isovaleric acid was inverse. According to the gallery plot and odor description of compounds, the odor characteristics of the samples at different treatment stages might be inferred. The OTCs of acetone (0.83 mg/kg), 3-methyl-1-butanol (0.004 mg/kg) and isovaleric acid (0.49 mg/kg) had been reported [42], and they were often associated with odor contribution. Acetone (pungent) and 3-methyl-1-butanol (pungent) were only detected in samples before PSO treatment, and isovaleric acid (rancid/acid) was present at higher level after PSO. Thus, their presence might explain the odor character of the corresponding wastewaters. It is worth mentioning that the formation of dimers or trimers of compound occurred in IMS and related to the compounds with high proton affinity or higher concentration. The variation in the signal intensity of acetic acid confirmed the conversion between monomers and dimers. The presence of acetic acid-dimer before PSO manifested that its concentration was probably higher than that after PSO, thus acetic acid was detected as monomer after PSO.
For general domestic WWTPs, the treatment processes mainly include mechanical pre-treatment and biological treatments. The mechanical pre-treatment such as bar screens, grit chamber and primary sedimentation tanks, are typically identified as locations of intense odor emissions. In contrast, the odor concentrations in biological treatments (anaerobic, aerobic tanks and secondary sedimentation) are much lower normally [46,47]. Mechanical treatment will promote the emission of odors by virtue of water flow turbulence at each unit. This is consistent with the analytical results that 1,4-dichlorobenzene, p-cymene, naphthalene, acetone, 2,3-pentanedione, 3-methyl-1-butanol, ethyl propanoate and methional are present at higher concentrations before anaerobic tank. New compounds are emitted during the process of biological treatment mostly by means of decomposition of the original components of the sewage or microbial metabolism, such as 2-butanone, 1-propene-3-methylthio, 3-hydroxy-2-butanone and 3-methylbutanal. The above results reinforce the general opinion that the discrepancies of odor emissions are associated with water quality and different treatment units [1].

4. Conclusions

A method for wide-scope screening of VOCs in wastewater has been developed, which combine GC-QTOF-MS and GC-IMS. GC-QTOF-MS analysis includes qualitative screening of nontarget compounds and quantitative determination of target compounds, while GC-IMS provides visualized profile information and nontarget identification results. Method validation has been made through analyzing wastewater from nine process units in a municipal wastewater treatment plant. Our results show that 56 substances are identified, which mainly include aromatics (chlorobenzene, toluene, phenol, 2-chloro-phenol, and p-cymene), sulfur organic compounds (DMDS and DMTS), and oxygenated VOCs (alcohols, aldehydes, ketones, and fatty acids). The developed method enables quantification of target compounds in different wastewater samples and recoveries within the range of 70.11–115.05% are obtained with RSDs below or equal to 20%. The determined compounds include tetrachloroethylene, chlorobenzene, ethylbenzene, 1,4-dichlorobenzene, p-cymene, naphthalene, DMDS and DMTS. The presence of these compounds is in various concentration levels. The odorants emitted from wastewater mainly release before primary sedimentation tank and sulfur organic compounds are identified as major odorants. Due to the different response ranges of GC-QTOF-MS and GC-IMS, the results of two methods are not comparable to each other. Instead, GC-IMS can be used as a complementary method for GC-QTOF-MS to achieve more comprehensive analysis. In conclusion, multiple analytical methods should be used for determining odor characteristics in order to assess odor impact and choose odor control techniques.

Supplementary Materials

The following are available online at https://www.mdpi.com/2073-4433/12/2/265/s1, Figure S1: The experimental design of analytical method applied for wastewater samples, Figure S2: Sample sites at municipal wastewater treatment plants, Figure S3: The GC-IMS chromatogram of mixing standards, Table S1: The information of standard compounds used for GC-IMS calibration, Table S2: Information of identified compounds in GC-QTOF-MS, Table S3: Target compounds, CAS number, boiling point, retention index (RI), retention time (RT), quantitative ion (Ti) and qualitative ion (Qi) used for detection of targeted compounds, Table S4: Precision (intra-day) expressed as RSD (%), and accuracy expressed as recovery (%), for the target VOCs. The correlation coefficient, linear range, LOD (ng/L) and LOQ (ng/L) of the method for determining the concentration of VOCs, Table S5: The quantitative results of wastewater samples (ng/L), Table S6: Information of identified compounds in GC-IMS.

Author Contributions

Conceptualization, W.G. and X.Y.; methodology, W.G.; validation, W.G. and X.Z.; resources, R.J. and S.Z.; writing—original draft preparation, W.G.; writing—review and editing, W.G. and X.Y.; supervision, J.Y. and D.W. All authors have read and agreed to the published version of the manuscript.

Funding

This research was funded by the special fund from the State Key Joint Laboratory of Environment Simulation and Pollution Control (Research Center for Eco-environmental Sciences, Chinese Academy of Sciences), project number 19Z01ESPCR and the National Natural Science Foundation of China, grant number 52070186.

Institutional Review Board Statement

Not applicable.

Informed Consent Statement

Not applicable.

Data Availability Statement

Data is contained within the article.

Conflicts of Interest

The authors declare no conflict of interest.

References

  1. Gostelow, P.; Parsons, S.A.; Stuetz, R.M. Odour Measurements for Sewage Treatment Works. Water Res. 2001, 35, 579–597. [Google Scholar] [CrossRef]
  2. Lebrero, R.; Bouchy, L.; Stuetz, R.; Muñoz, R. Odor Assessment and Management in Wastewater Treatment Plants: A Review. Crit. Rev. Environ. Sci. Technol. 2011, 41, 915–950. [Google Scholar] [CrossRef]
  3. Agus, E.; Zhang, L.; Sedlak, D.L. A framework for identifying characteristic odor compounds in municipal wastewater effluent. Water Res. 2012, 46, 5970–5980. [Google Scholar] [CrossRef]
  4. Dincer, F.; Muezzinoglu, A. Odor-causing volatile organic compounds in wastewater treatment plant units and sludge management areas. J. Environ. Sci. Health Part A 2008, 43, 1569–1574. [Google Scholar] [CrossRef]
  5. Hudson, N.; Ayoko, G.A. Odour sampling. 2. Comparison of physical and aerodynamic characteristics of sampling devices: A review. Bioresour. Technol. 2008, 99, 3993–4007. [Google Scholar] [CrossRef] [Green Version]
  6. Sekyiamah, K.; Kim, H.; McConnell, L.L.; Torrents, A.; Ramirez, M. Identification of Seasonal Variations in Volatile Sulfur Compound Formation and Release from the Secondary Treatment System at a Large Wastewater Treatment Plant. Water Environ. Res. 2008, 80, 2261–2267. [Google Scholar] [CrossRef] [PubMed] [Green Version]
  7. Zarra, T.; Naddeo, V.; Belgiorno, V.; Reiser, M.; Kranert, M. Odour monitoring of small wastewater treatment plant located in sensitive environment. Water Sci. Technol.-Wst 2008, 58, 89–94. [Google Scholar] [CrossRef] [PubMed]
  8. Karageorgos, P.; Latos, M.; Kotsifaki, C.; Lazaridis, M.; Kalogerakis, N. Treatment of unpleasant odors in municipal wastewater treatment plants. Water Sci. Technol.-Wst 2010, 61, 2635–2644. [Google Scholar] [CrossRef]
  9. Lehtinen, J.; Veijanen, A. Odour Monitoring by Combined TD–GC–MS–Sniff Technique and Dynamic Olfactometry at the Wastewater Treatment Plant of Low H2S Concentration. Water Air Soil Pollut. 2010, 218, 185–196. [Google Scholar] [CrossRef]
  10. Olujimi, O.O.; Fatoki, O.S.; Odendaal, J.P.; Daso, A.P. Chemical monitoring and temporal variation in levels of endocrine disrupting chemicals (priority phenols and phthalate esters) from selected wastewater treatment plant and freshwater systems in Republic of South Africa. Microchem. J. 2012, 101, 11–23. [Google Scholar] [CrossRef]
  11. Skoczko, I.; Struk-Sokolowska, J.; Ofman, P. Seasonal Changes in Nirtogen, Phosphorus, BOD AND COD Removal in Bystre Wastewater Treatment Plant. J. Ecol. Eng. 2017, 18, 185–191. [Google Scholar] [CrossRef]
  12. Skoczko, I.; Struk-Sokolowska, J.; Ofman, P. Modelling Changes in the Parameters of Treated Sewage Using Artificial Neural Networks. Rocz. Ochr. Srodowiska 2017, 19, 633–650. [Google Scholar]
  13. Fisher, R.M.; Le-Minh, N.; Sivret, E.C.; Alvarez-Gaitan, J.P.; Moore, S.J.; Stuetz, R.M. Distribution and sensorial relevance of volatile organic compounds emitted throughout wastewater biosolids processing. Sci. Total Environ. 2017, 599–600, 663–670. [Google Scholar] [CrossRef]
  14. Jiang, G.M.; Melder, D.; Keller, J.; Yuan, Z.G. Odor emissions from domestic wastewater: A review. Crit. Rev. Environ. Sci. Technol. 2017, 47, 1581–1611. [Google Scholar] [CrossRef]
  15. Lambert, S.D.; Beaman, A.L.; Winter, P. Olfactometric characterisation of sludge odours. Water Sci. Technol. 2000, 41, 49–55. [Google Scholar] [CrossRef]
  16. Dincer, F.; Muezzinoglu, A. Odor Determination at Wastewater Collection Systems: Olfactometry versus H2S Analyses. Clean-Soil Air Water 2007, 35, 565–570. [Google Scholar] [CrossRef]
  17. Burlingame, G.A.; Suffet, I.H.; Khiari, D.; Bruchet, A.L. Development of an odor wheel classification scheme for wastewater. Water Sci. Technol. 2004, 49, 201–209. [Google Scholar] [CrossRef] [PubMed]
  18. Suffet, I.H.; Burlingame, G.A.; Rosenfeld, P.E.; Bruchet, A. The value of an odor-quality-wheel classification scheme for wastewater treatment plants. Water Sci. Technol. 2004, 50, 25–32. [Google Scholar] [CrossRef]
  19. Decottignies, V.; Huyard, A.; Kelly, R.F.; Barillon, B. Development of a diagnostic tool: The wastewater collection network odour wheel. Water Sci. Technol. 2013, 68, 839–847. [Google Scholar] [CrossRef] [PubMed]
  20. Fisher, R.M.; Barczak, R.J.; Suffet, I.H.M.; Hayes, J.E.; Stuetz, R.M. Framework for the use of odour wheels to manage odours throughout wastewater biosolids processing. Sci. Total Environ. 2018, 634, 214–223. [Google Scholar] [CrossRef]
  21. Koch, E.; Winneke, G.; Sucker, K.; Both, R. Odour intensity and hedonic tone - important parameters to describe odour annoyance to residents? Water Sci. Technol. 2004, 50, 83–92. [Google Scholar] [CrossRef] [Green Version]
  22. Jarmusch, A.K.; Kerian, K.S.; Pirro, V.; Peat, T.; Thompson, C.A.; Ramos-Vara, J.A.; Childress, M.O.; Cooks, R.G. Characteristic lipid profiles of canine non-Hodgkin’s lymphoma from surgical biopsy tissue sections and fine needle aspirate smears by desorption electrospray ionization-mass spectrometry. Analyst 2015, 140, 6321–6329. [Google Scholar] [CrossRef]
  23. Jjunju, F.P.M.; Maher, S.; Li, A.; Badu-Tawiah, A.K.; Taylor, S.; Cooks, R.G. Analysis of Polycyclic Aromatic Hydrocarbons Using Desorption Atmospheric Pressure Chemical Ionization Coupled to a Portable Mass Spectrometer. J. Am. Soc. Mass Spectrom. 2015, 26, 271–280. [Google Scholar] [CrossRef] [Green Version]
  24. Fedick, P.W.; Pu, F.; Morato, N.M.; Cooks, R.G. Identification and Confirmation of Fentanyls on Paper using Portable Surface Enhanced Raman Spectroscopy and Paper Spray Ionization Mass Spectrometry. J. Am. Soc. Mass Spectrom. 2020, 31, 735–741. [Google Scholar] [CrossRef] [PubMed]
  25. Escalas, A.; Guadayol, J.M.; Cortina, M.; Rivera, J.; Caixach, J. Time and space patterns of volatile organic compounds in a sewage treatment plant. Water Res. 2003, 37, 3913–3920. [Google Scholar] [CrossRef]
  26. Kotowska, U.; Zalikowski, M.; Isidorov, V.A. HS-SPME/GC-MS analysis of volatile and semi-volatile organic compounds emitted from municipal sewage sludge. Environ. Monit. Assess. 2012, 184, 2893–2907. [Google Scholar] [CrossRef] [Green Version]
  27. Kleeberg, K.K.; Liu, Y.; Jans, M.; Schlegelmilch, M.; Streese, J.; Stegmann, R. Development of a simple and sensitive method for the characterization of odorous waste gas emissions by means of solid-phase microextraction (SPME) and GC-MS/olfactometry. Waste Manag. 2005, 25, 872–879. [Google Scholar] [CrossRef] [PubMed]
  28. Zhou, Y.; Hallis, S.A.; Vitko, T.; Suffet, I.H. Identification, quantification and treatment of fecal odors released into the air at two wastewater treatment plants. J. Environ. Manag. 2016, 180, 257–263. [Google Scholar] [CrossRef]
  29. Zhu, Y.L.; Zheng, G.D.; Gao, D.; Chen, T.B.; Wu, F.K.; Niu, M.J.; Zou, K.H. Odor composition analysis and odor indicator selection during sewage sludge composting. J. Air Waste Manag. Assoc. 2016, 66, 930–940. [Google Scholar] [CrossRef]
  30. Gonzalez, D.; Colon, J.; Sanchez, A.; Gabriel, D. A systematic study on the VOCs characterization and odour emissions in a full-scale sewage sludge composting plant. J. Hazard. Mater. 2019, 373, 733–740. [Google Scholar] [CrossRef]
  31. Nie, E.; Zheng, G.D.; Gao, D.; Chen, T.B.; Yang, J.X.; Wang, Y.W.; Wang, X.K. Emission characteristics of VOCs and potential ozone formation from a full-scale sewage sludge composting plant. Sci. Total Environ. 2019, 659, 664–672. [Google Scholar] [CrossRef]
  32. Kanu, A.B.; Hill, H.H., Jr. Ion mobility spectrometry detection for gas chromatography. J. Chromatogr. A 2008, 1177, 12–27. [Google Scholar] [CrossRef] [PubMed]
  33. Armenta, S.; Alcala, M.; Blanco, M. A review of recent, unconventional applications of ion mobility spectrometry (IMS). Anal. Chim. Acta 2011, 703, 114–123. [Google Scholar] [CrossRef]
  34. Vautz, W.; Franzke, J.; Zampolli, S.; Elmi, I.; Liedtke, S. On the potential of ion mobility spectrometry coupled to GC pre-separation-A tutorial. Anal. Chim. Acta 2018, 1024, 52–64. [Google Scholar] [CrossRef] [PubMed]
  35. Garrido-Delgado, R.; Mercader-Trejo, F.; Sielemann, S.; de Bruyn, W.; Arce, L.; Valcarcel, M. Direct classification of olive oils by using two types of ion mobility spectrometers. Anal. Chim. Acta 2011, 696, 108–115. [Google Scholar] [CrossRef] [PubMed]
  36. Garrido-Delgado, R.; Arce, L.; Valcarcel, M. Multi-capillary column-ion mobility spectrometry: A potential screening system to differentiate virgin olive oils. Anal. Bioanal. Chem. 2012, 402, 489–498. [Google Scholar] [CrossRef]
  37. Garrido-Delgado, R.; Dobao-Prieto Mdel, M.; Arce, L.; Valcarcel, M. Determination of volatile compounds by GC-IMS to assign the quality of virgin olive oil. Food Chem. 2015, 187, 572–579. [Google Scholar] [CrossRef]
  38. Junger, M.; Bodeker, B.; Baumbach, J.I. Peak assignment in multi-capillary column-ion mobility spectrometry using comparative studies with gas chromatography-mass spectrometry for VOC analysis. Anal. Bioanal. Chem. 2010, 396, 471–482. [Google Scholar] [CrossRef] [PubMed]
  39. Vautz, W.; Hariharan, C.; Weigend, M. Smell the change: On the potential of gas-chromatographic ion mobility spectrometry in ecosystem monitoring. Ecol. Evol. 2018, 8, 4370–4377. [Google Scholar] [CrossRef]
  40. Sivret, E.C.; Wang, B.; Parcsi, G.; Stuetz, R.M. Prioritisation of odorants emitted from sewers using odour activity values. Water Res. 2016, 88, 308–321. [Google Scholar] [CrossRef]
  41. Fisher, R.M.; Le-Minh, N.; Alvarez-Gaitan, J.P.; Moore, S.J.; Stuetz, R.M. Emissions of volatile sulfur compounds (VSCs) throughout wastewater biosolids processing. Sci. Total Environ. 2018, 616–617, 622–631. [Google Scholar] [CrossRef]
  42. Van Gemert, L.J. Odour Thresholds: Compilations of Odour Threshold Values in Air, Water and Other Media; Oliemans Punter & Partners BV: Utrecht, The Netherlands, 2011. [Google Scholar]
  43. Han, Z.L.; Qi, F.; Li, R.Y.; Wang, H.; Sun, D.Z. Health impact of odor from on-situ sewage sludge aerobic composting throughout different seasons and during anaerobic digestion with hydrolysis pretreatment. Chemosphere 2020, 249, 1–10. [Google Scholar] [CrossRef]
  44. Portoles, T.; Pitarch, E.; Lopez, F.J.; Hernandez, F. Development and validation of a rapid and wide-scope qualitative screening method for detection and identification of organic pollutants in natural water and wastewater by gas chromatography time-of-flight mass spectrometry. J. Chromatogr. A 2011, 1218, 303–315. [Google Scholar] [CrossRef] [PubMed]
  45. Vera, L.; Companioni, E.; Meacham, A.; Gygax, H. Real Time Monitoring of VOC and Odours Based on GC-IMS at Wastewater Treatment Plants. Chem. Eng. Trans. 2016, 54, 79–84. [Google Scholar] [CrossRef]
  46. Lewkowska, P.; Cieslik, B.; Dymerski, T.; Konieczka, P.; Namiesnik, J. Characteristics of odors emitted from municipal wastewater treatment plant and methods for their identification and deodorization techniques. Environ. Res. 2016, 151, 573–586. [Google Scholar] [CrossRef] [PubMed]
  47. Fan, F.; Xu, R.; Wang, D.; Meng, F. Application of activated sludge for odor control in wastewater treatment plants: Approaches, advances and outlooks. Water Res. 2020, 181, 115915. [Google Scholar] [CrossRef]
Figure 1. Identification of nontarget DMDS (dimethyl disulfide) by GC-QTOF-MS (gas chromatography quadrupole-time-of-flight mass spectrometry): (A) Extracted-ion chromatograms for five m/z ions; (B) Deconvoluted accurate mass spectrum in the sample; (C) Commercial library mass spectrum of DMDS at nominal mass.
Atmosphere 12 00265 g001
Figure 2. Identification of nontarget DMTS (dimethyl trisulfide) by GC-QTOF-MS: (A) Extracted-ion chromatograms for five m/z ions; (B) Deconvoluted accurate mass spectrum in the sample; (C) Commercial library mass spectrum of DMTS at nominal mass.
Atmosphere 12 00265 g002
Figure 3. Heat-map visualization of the concentrations for the detected VOCs in each process. (Note: IW: influent wastewater, GBI: rotational flow grit basin inlet, GBO: rotational flow grit basin outlet, PSO: primary sedimentation tank outlet, ANO: anaerobic tank outlet, AO: aerobic tank outlet, SSO: secondary sedimentation tank outlet, NO: nitrification outlet, DNO: denitrification outlet.).
Atmosphere 12 00265 g003
Figure 4. Topographic plots of GC-IMS (gas chromatography-ion mobility spectrometry) spectra of IW (influent wastewater), PSO (primary sedimentation tank outlet), AO (aerobic tank outlet) and DNO (denitrification outlet).
Atmosphere 12 00265 g004
Figure 5. Gallery plot of GC-IMS for VOCs identified in the wastewater samples.
Atmosphere 12 00265 g005
Table 1. The number of VOCs (volatile organic compounds) detected using different methods.
References[25][26][27][28][29][30][31]
MethodsCLSA/
GC-MS
HS-SPME/
GC-MS
SPME/
GC-MS
SPME/
GC-FID/O
LGIS/
GC-MS
TSPS/
GC-MS
TD/
GC-MS
Portable GC-MS
Numbers47164562833533
Note: CLSA: Closed-loop stripping analysis, HS-SPME: Headspace-solid phase microextraction, LGIS: Liquid-gas impinger system, TSPS: Three-stage preconcentration system, TD: Thermal desorption, GC-MS: Gas chromatography-mass spectrometry, GC-FID/O: Gas chromatography-flame ionization detection and olfactometry.
Table 2. Main odor substances appeared in WWTPs (wastewater treatment plants) and their descriptors.
Odor CategoriesOdor DescriptorChemical CompoundsReferences
Earthy/MustyEarthy/Musty/MoldyGeosmin
2-Methylisoborneol
Trichloro anisole
Oxidant/ChlorinousChlorinousMonochloramine
Dichloramine
Grassy/WoodyGreen/Grassy/ Haycis-3-Hexen-1-ol[27]
Formaldehyde
Sulfide/Cabbage/GarlicRotten Eggs/Hydrogen sulfide[29]
Decaying VegetationDimethyl trisulfide[25,26]
Dimethyl sulfide[26,29,30,31]
Thiophene
Methyl mercaptan[29]
Dimethyl disulfide[25,26,29,30,31]
Rancid/PutridSour Milk/Methyl thiobutyrate
Putrid/Valeric acid
RancidIsovaleric acid
Butyric acid
Heptanal[26]
Amyl mercaptan
Fragrant/FruitySoapy/1-Dodecanal
Fruity/Acetaldehyde[27]
CitrusyEthyl acetate[26]
d-Limonene[25,26,27,31]
Ammonia/FishyAmmonia/Ammonia[29]
Cat Urine/Pyridine[26]
FishyButylamine
Triethylamine
Solventy/HydrocarbonSolventy/ GasolineBenzene[25,26,29,31]
Toluene[25,26,27,29,31]
m-Xylene[25,26,27,29,31]
Styrene[25,26,27,29]
Heptane[25,26]
Medicinal/AlcoholMedicinal/Alcohol1-Hexanol[26]
Phenol[26,30,31]
1-Butanol[26]
Fecal/SeweryFecalIndole[26,28,30]
Skatole[28,30]
Nose feelPungent/Ammonia
Irritating/Ozone
SharpChlorine dioxide
Publisher’s Note: MDPI stays neutral with regard to jurisdictional claims in published maps and institutional affiliations.

