
Summary and Overview of the Odour Regulations Worldwide


 ,
,  ,
,  ,
,  ,
, 
Abstract
1. Introduction
2. Europe—A Common Approach
2.1. France
2.1.1. Animal by-Product Processing Plants
2.1.2. Composting Plants
2.1.3. Food and Beverage Industries
2.2. Germany
2.3. Austria
- An exceedance probability of pT = 8% for a “weak” odour intensity;
- An exceedance probability of pT = 3% for a “strong” odour intensity.
2.4. Hungary
2.5. United Kingdom
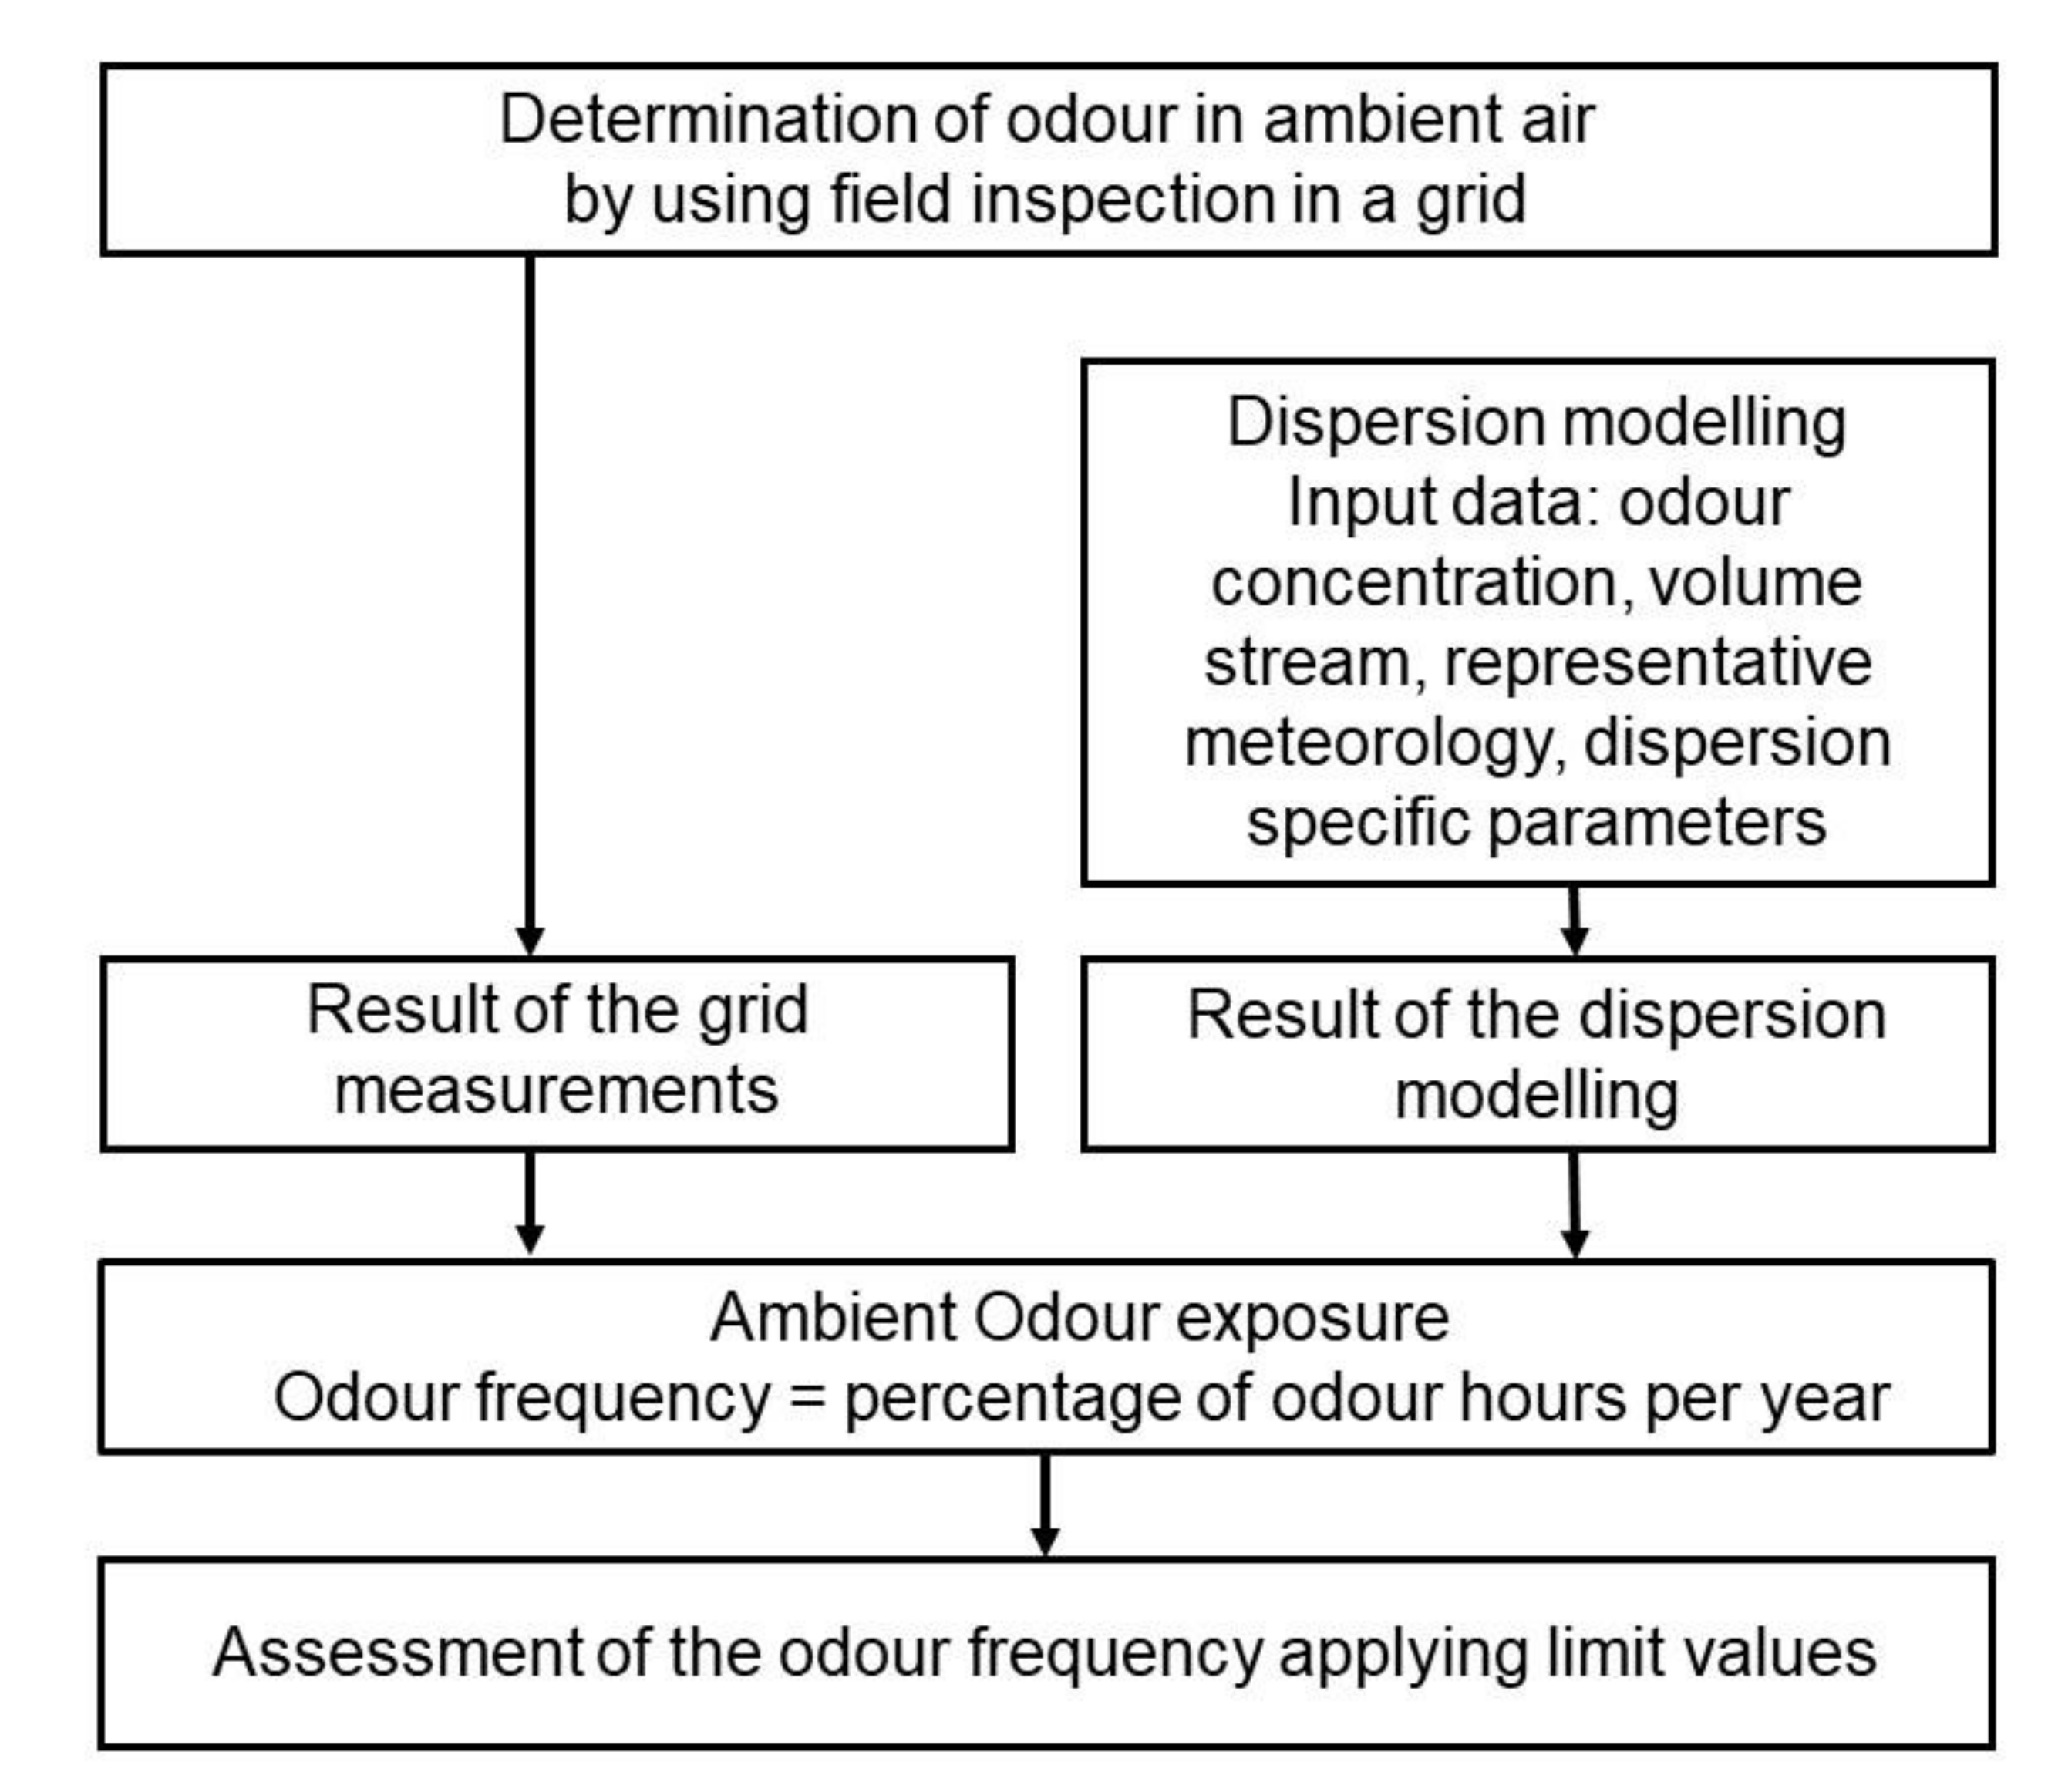
2.5.1. Assessing Odour Impacts for Planning Purposes
2.5.2. How Odours Are Assessed to Be Qualified as a Nuisance
2.5.3. Processes and Premises Regulated by the Environment Agencies under the EPR
- Where no odour is detectable or likely to be detectable, there will be no pollution beyond the boundary of the site concerning odour pollution.
- Where odour is detectable, it may or may not cause offence, and the agency response will depend upon the degree of pollution and the cost and practicability of any remedial measures.
- Where all appropriate measures are being used but are not completely preventing odour pollution, a level of residual odour will have to be accepted.
- Where the odour is serious, even if all efforts have been made to apply BAT/appropriate measures, it may be necessary to suspend or revoke the permit in full or in part.
2.6. Spain
- The facility/activity (new or existing) applies to obtain a permit.
- The environmental administration evaluates if there is an odour concern and, if necessary, an odour assessment is requested.
- There is no guideline for decision making on odour assessments results. The outcome completely depends on the environmental officer assigned to the case.
- Upon completion of an odour assessment (if performed), the individual OIC are set by the environmental officer, which are typically based on the assessment results.
2.7. The Netherlands
2.8. Italy
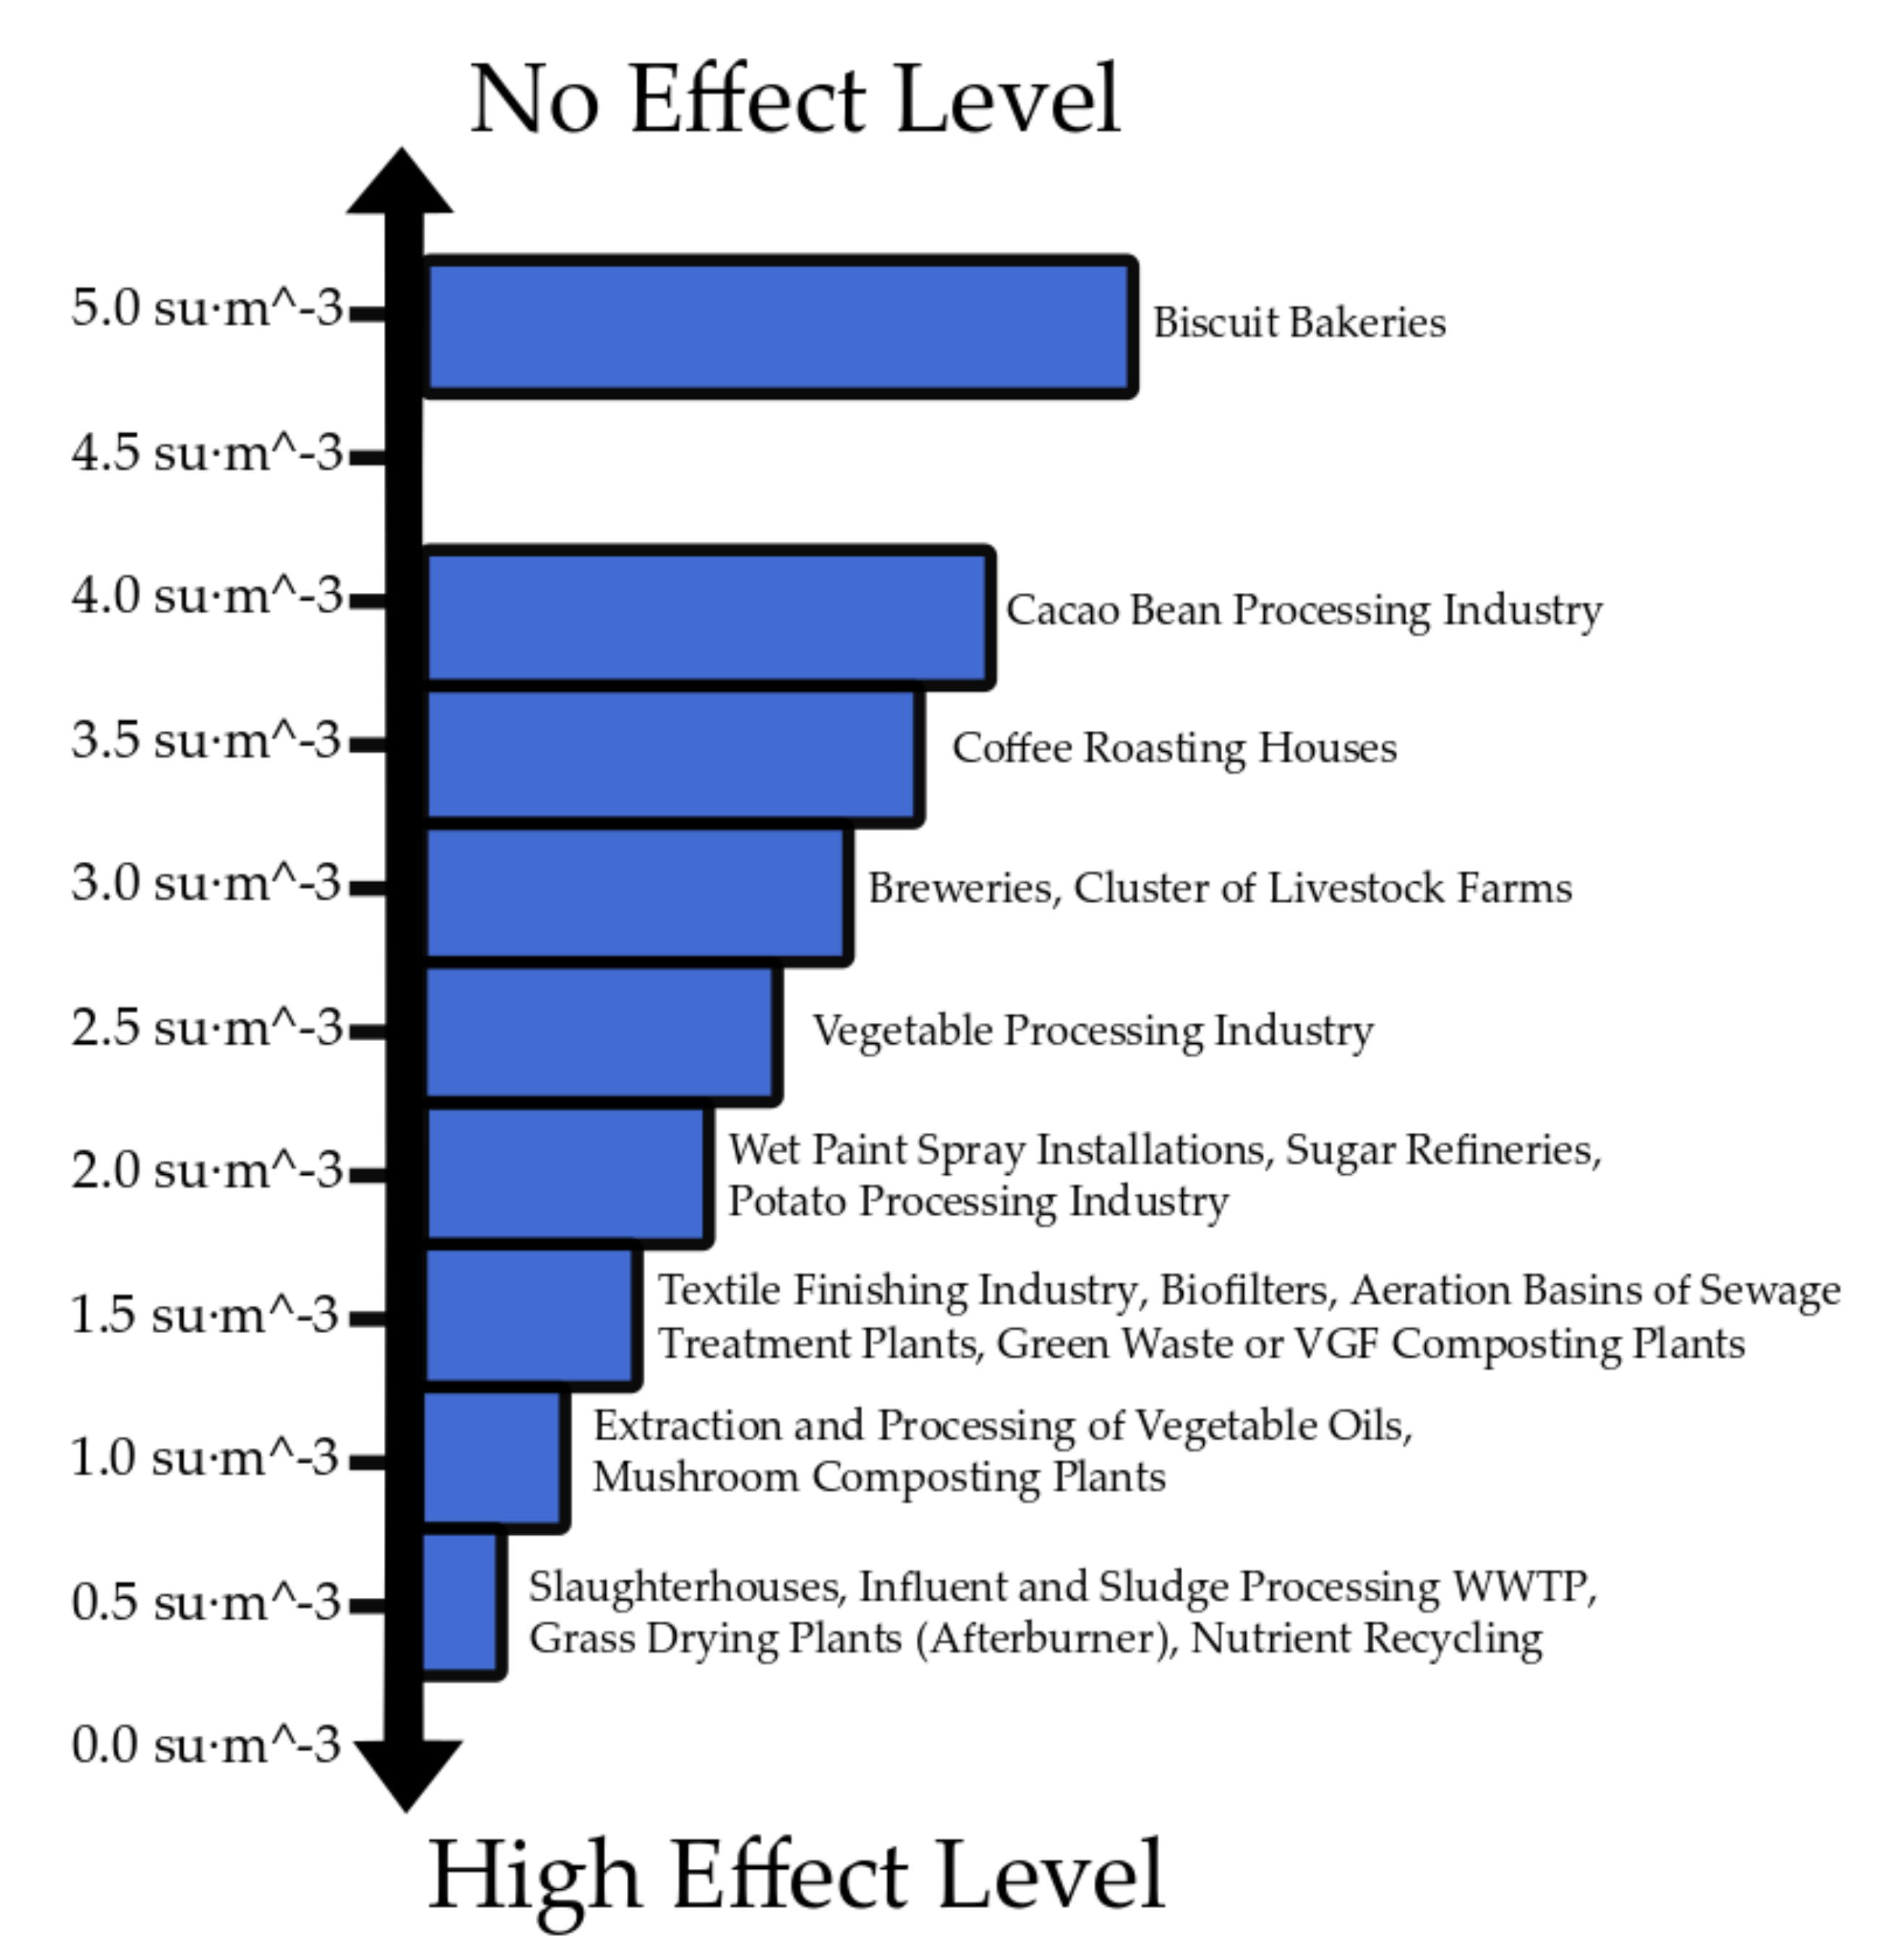
2.9. Belgium
2.9.1. Walloon Region
2.9.2. Flemish Region
3. Australia and New Zealand
4. China
4.1. Background and Overview
4.2. Odour Impact Assessment in the People’s Republic of China (PRC)
4.3. Odour Impact Assessment in Hong Kong
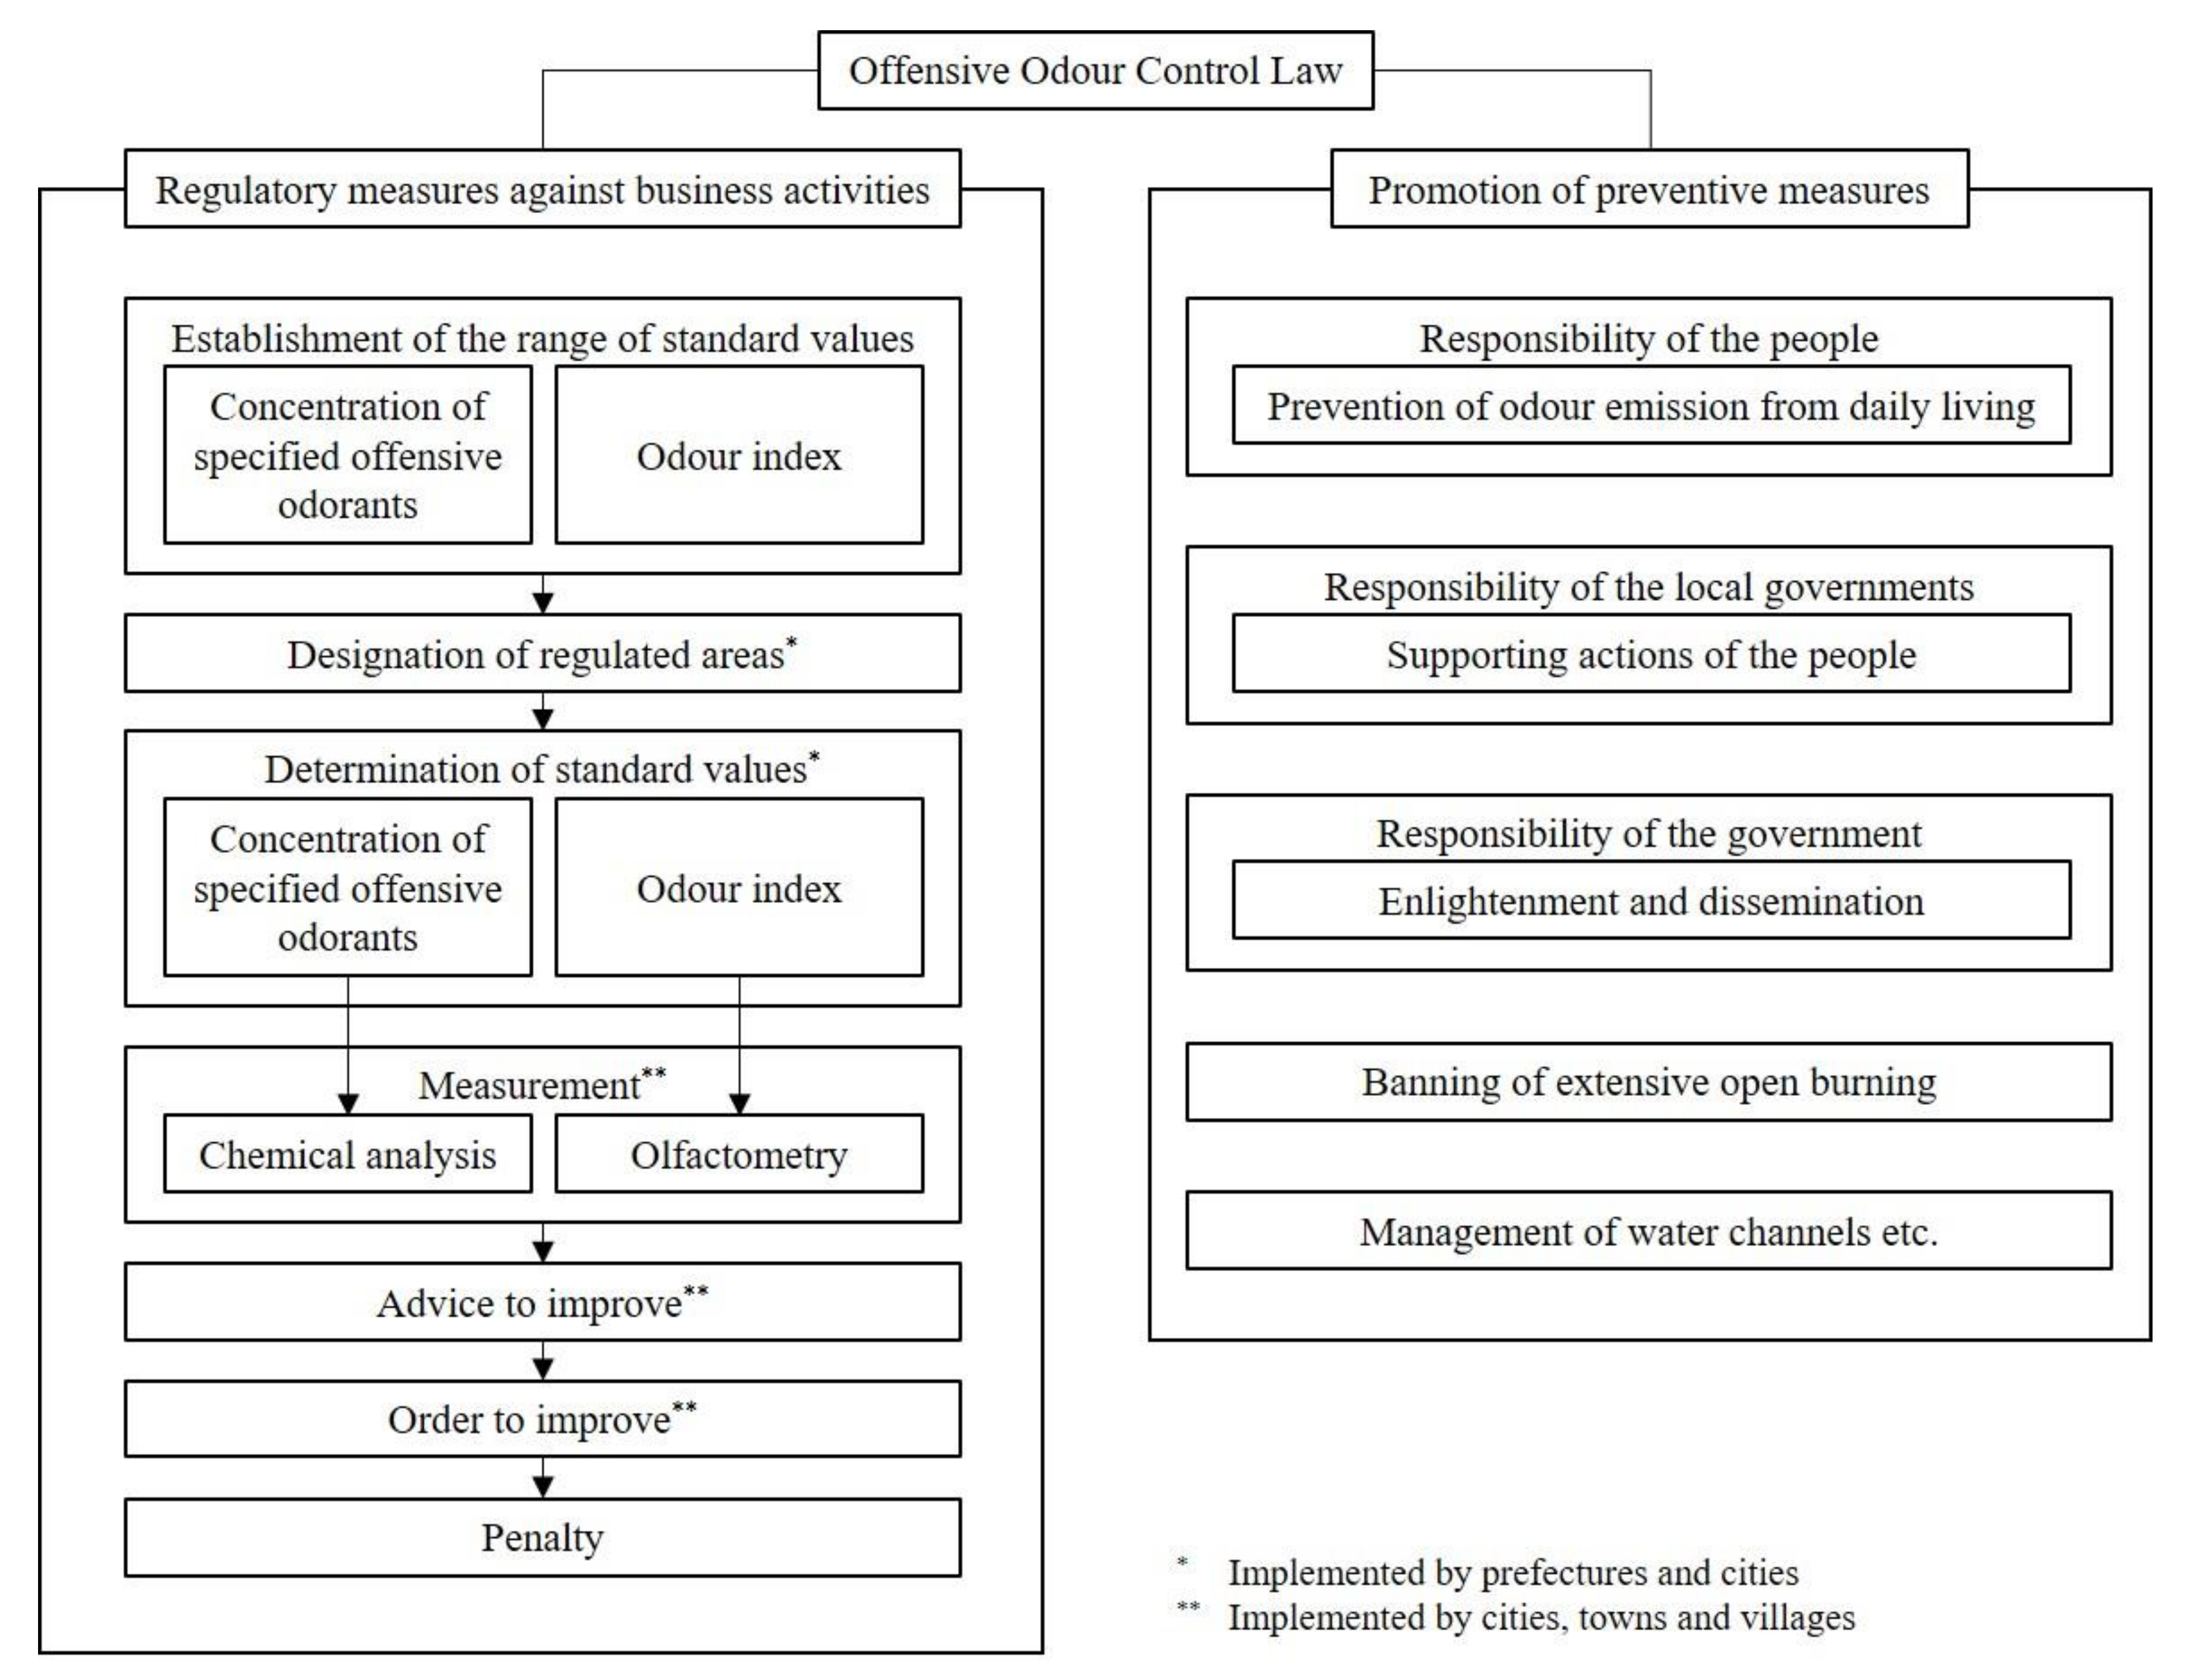
5. Japan
6. United States of America
6.1. State Regulations
6.2. Municipalities
6.3. Odour and Agriculture in the USA
- Odour—Is there direct regulation of odour emissions?
- Setbacks—Are there setbacks (i.e., mandatory distances to neighbours)?
- Permits—Are permits required?
- Public—Is there public involvement in the permitting process?
- Training—Is some form of training required?
- LA—Are there land application [of manure] restrictions?
- Other—Any other approach to regulating odour from CAFOs or related
- information.
7. Canada
7.1. Alberta
7.2. British Columbia
7.3. Newfoundland and Labrador, Northwest Territories, Prince Edward Island
7.4. Nova Scotia and Saskatchewan
7.5. Manitoba
7.6. Ontario
7.7. Quebec
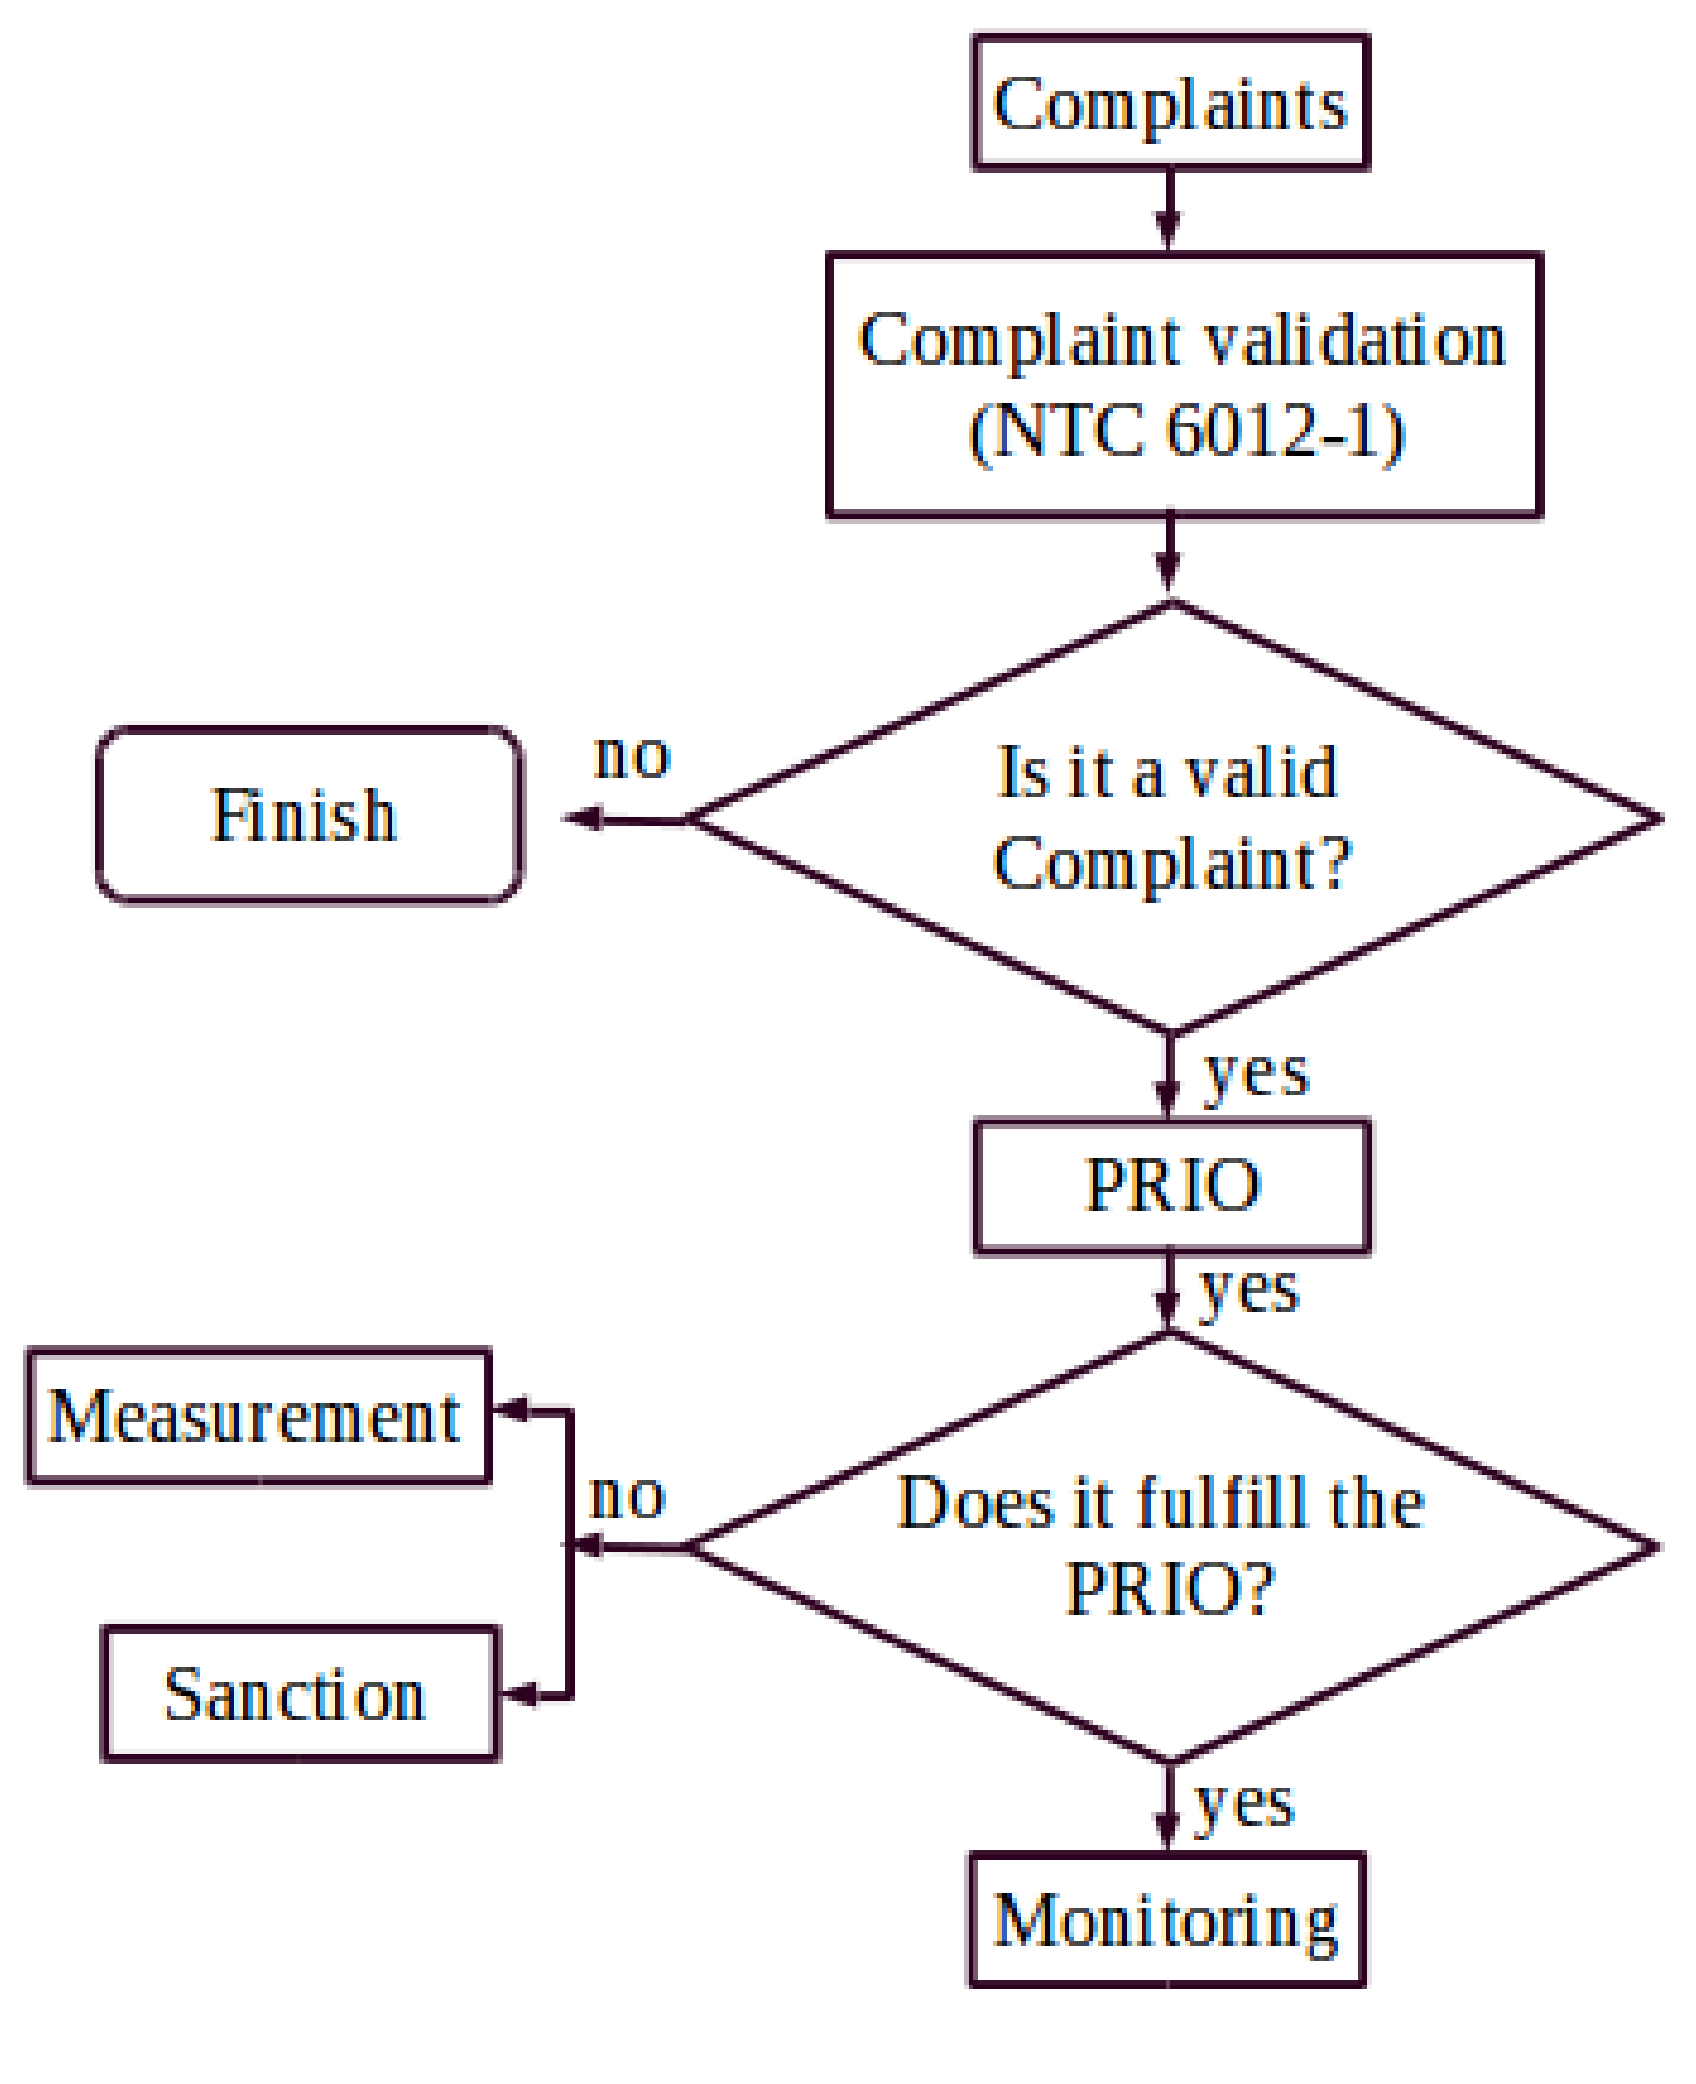
7.8. Examples on How to Deal with Odour Complaints
7.9. Odour Assessments
8. South America
8.1. Chile
- (1)
- Activities with a greater number of complaints.
- (2)
- Activities with a greater number of facilities.
- (3)
- Activities involved in socio-environmental conflicts due to odours.
8.2. Colombia
9. Discussion
- How do the existing local planning and zoning policies impact the proposed regulation and its implementation?
- Who should be the stakeholders involved in drafting an odour regulation?
- What are the costs of regulation (to the facility and the community/agency)?
- What are the costs of no regulation (to the facility and the community/agency)?
- Choice of regulatory criteria:
- In which cases is an air quality regulation suggested, and in which cases is an emission regulation better?
- Why are only some industries regulated and not necessarily all types of emissions in a region or country?
- Which level of graduality has been reached by countries with a history of odour regulations, and what were the results?
- Metrics:
- What are the indicators of a successful odour regulation?
- How have various methods of current and past regulation been successful?
- Is there a link between regulation and accreditation (operating permit, obligatory periodic audit)?
- Is there a list of common recommendations to countries/stakeholders that are considering an odour regulation?
- Is there a need for a “clearinghouse” of best practices that document country-level experiences?
- It is a challenge to answer these questions, and could the answers be different depending on the local/state situation.
10. Conclusions
Supplementary Materials
Author Contributions
Funding
Institutional Review Board Statement
Informed Consent Statement
Data Availability Statement
Conflicts of Interest
Glossary
| ADMS | Atmospheric Dispersion Modelling System developed by Cambridge Environmental Research Consultants. |
| AERMOD | American Meteorological Society/Environmental Protection Agency Regulatory Model |
| AMPAT | Air Management Practices Assessment Tool |
| AUSTAL2000G | Lagrangian odour dispersion model used in Germany |
| AWAC | Walloon Agency for Air and Climate |
| BAT | best available technology |
| BER | built, extended, rebuilt |
| BPM | best practicable means |
| CAFOs | confined animal feeding operations |
| CALPUFF | atmospheric pollution dispersion modelling system |
| DEFRA | Department for Environment, Food and Rural Affairs (United Kingdom) |
| DEQ | Department of Environmental Quality (Oregon) |
| D/T | detection/threshold |
| EA | Environment Agency (England) |
| ELV | emission limit value |
| EN | European Standard identified by a unique reference code “EN” |
| EPA | Environmental Protection Agency |
| EPEA | Environmental Protection and Enhancement Act (Alberta) |
| GRAL | Lagrangian dispersion model. |
| IMPACT | an odour dispersion model used in Flanders |
| IOMS | instrumental odour monitoring systems |
| INN | National Institute of Normalization |
| LASAT | Lagrangian dispersion model. |
| MMA | Ministry of the Environment (Chile) |
| MECP | Ministry of the Environment, Conservation and Parks (Ontario) |
| NAEMS | National Air Emissions Monitoring Study |
| NeR | Dutch Emission Guidelines |
| NIEA | Northern Ireland Environment Agency |
| NRW | Natural Resource Wales |
| NTC | Colombian Technical Norm (Colombian Institute of Technical Standards and Certification) |
| OAV | odour activity value |
| OIC | odour impact criteria |
| OOCL | Offensive Odour Control Law (Japan) |
| ou | American and Australian odour unit |
| ouE∙m−3 | odour concentration, European odour unit per cubic metre |
| PRIO | Plan for the reduction of the offensive odours (Spanish) |
| SEPA | Scottish Environmental Protection Agency |
| Su | sniffing unit |
| TOBM | triangle odour bag method |
| TOFM | triangle odour flask method |
| TRS | total reduced sulfur |
| VDI | Verein Deutscher Ingenieure (VDI) (English: Association of German Engineers) |
| VOC | volatile organic compound |
| WWTPS | wastewater treatment plants |
References
- European Committee for Standardization CEN. Air Quality—Determination of Odour Concentration by Dynamic Olfactometry; EN 13725:2003; CEN: Brussels, Belgium, 2003. [Google Scholar]
- The Association of German Engineers. VDI. Olfactometry—Static Sampling; VDI 3880; Beuth Verlag GmbH: Berlin, Germany, 2011. [Google Scholar]
- European Committee for Standardization CEN. Ambient Air—Determination of Odour in Ambient Air by Using Field Inspection—Part 1: Grid Method; EN 16841–1:2016; CEN: Brussels, Belgium, 2016. [Google Scholar]
- European Committee for Standardization CEN. Ambient Air—Determination of Odour in Ambient Air by Using Field Inspection—Part 2: Plume Method; EN 16841–2:2016I; CEN: Brussels, Belgium, 2016. [Google Scholar]
- Watts, P.J.; Sweeten, J.M. Toward a better regulatory model for odour. In Ch. 15. In Proceedings of the Feedlot Waste Management Conference, Toowoomba, Queensland, Australia, 3–9 May 1995; Queensland Department of Primary Industries: Toowoomba, Queensland, Australia, 1995. [Google Scholar]
- Good Practice Guide for Assessing and Managing Odour. Ministry for the Environment, New Zealand. 2016. Available online: https://www.mfe.govt.nz/sites/default/files/media/Air/good-practice-guide-odour.pdf (accessed on 6 October 2020).
- The Association of German Engineers. VDI. Olfactometry—Determination of Odour Intensity Part 1; VDI 3882; Beuth Verlag GmbH: Berlin, Germany, 1992. [Google Scholar]
- ASTM International. Standard Practice for Referencing Suprathreshold Odor Intensity; ASTM E544–10; ASTM International: West Conshohocken, PA, USA, 2010. [Google Scholar]
- The Association of German Engineers. VDI. Olfactometry: Determination of Hedonic Odour Tone Part 2; VDI 3882; Beuth Verlag GmbH: Berlin, Germany, 1994. [Google Scholar]
- Loriato, A.G.; Salvador, N.; Santos, J.M.; Moreira, D.M.; Reis, N.C., Jr. Odour—A vision on the existing regulation. Chem. Eng. Trans. 2012, 30, 25–30. [Google Scholar]
- Giner, S.G.; Georgitzikis, K.; Scarlet, B.M.; Montobbio, P.; Roudier, S.; Delgado, L.S. Best available techniques (BAT) reference document for the intensive rearing of poultry and pigs. In Industrial Emissions Directive 2010/75/EU (Integrated Pollution Prevention and Control); Publications Office of the European Union: Luxembourg, 2017; Available online: https://ec.europa.eu/jrc/en/publication/eur-scientific-and-technical-research-reports/best-available-techniques-bat-reference-document-intensive-rearing-poultry-or-pigs (accessed on 6 October 2020). [CrossRef]
- European Environmental Bureau. EEB Position on the Relationship Between BAT AELs and ELVs. Available online: http://www.eeb.org/?LinkServID=F69A6726–9BBD-097A-F6825498E2D0618F&showMeta=0 (accessed on 26 July 2016).
- Order of 12 February 2003 relating to the requirements applicable to classified installations subject to authorization under section 2730 treatment of by-products of animal origin, including debris, issues and corpses, excluding activities covered by other sections of the nomenclature, diagnostic, research and teaching establishments (Arrêté du 12 février 2003 relatif aux prescriptions applicables aux installations classées soumises à autorisation sous la rubrique 2730 traitement de sous-produits d’origine animale, y compris débris, issues et cadavres, à l’exclusion des activités visées par d’autres rubriques de la nomenclature, des établissements de diagnostic, de recherche et d’enseignement). JORF 2003, 89, 6654.
- Order of 22 April 2008 setting the technical rules that must be met by composting facilities subject to authorization in application of Title I of Book V of the Environment Code (Arrêté du 22 avril 2008 fixant les règles techniques auxquelles doivent satisfaire les installations de compostage soumises à autorisation en application du titre Ier du livre V du code de l’environnement). JORF 2008, 0114, 8058.
- Order of 20 April 2012 relating to the general requirements applicable to classified composting installations subject to registration under the heading nº 2780 (Arrêté du 20 avril 2012 relatif aux prescriptions générales applicables aux installations classées de compostage soumises à enregistrement sous la rubrique nº 2780). JORF 2012, 0104, 7794.
- Order of 25 May 2012 relating to the general requirements applicable to classified installations subject to declaration under heading No. 2250 (production by distillation of alcoholic beverages of agricultural origin) (Arrêté du 25 mai 2012 relatif aux prescriptions générales applicables aux installations classées soumises à déclaration sous la rubrique no 2250 (production par distillation d’alcools de bouche d’origine agricole)). JORF 2012, 0155, 11055.
- Order of 26 November 2012 relating to the general requirements applicable to installations falling under the registration regime under heading No. 2251 (preparation, packaging of wines) of the nomenclature of installations classified for environmental protection(Arrêté du 26 novembre 2012 relatif aux prescriptions générales applicables aux installations relevant du régime de l’enregistrement au titre de la rubrique n 2251 (préparation, conditionnement de vins) de la nomenclature des installations classées pour la protection de l’environnement). JORF 2012, 0277, 18660.
- Order of 18 December 2014 relating to the general requirements applicable to installations covered by the declaration regime under heading No 2253 of the nomenclature of installations classified for the protection of the nomenclature of installations classified for environmental protection(Arrêté du 18 décembre 2014 relatif aux prescriptions générales applicables aux installations relevant du régime de la déclaration au titre de la rubrique n 2253 de la nomenclature des installations classées pour la protection de of the nomenclature of installations classified for environmental protection). JORF 2014. Available online: https://www.legifrance.gouv.fr/loda/id/JORFTEXT000030426541/ (accessed on 29 January 2021).
- Federal Immission Control Act (Act on the Prevention of Harmful Effects on the Environment Caused by Air Pollution, Noise, Vibration and Similar Phenomena). Federal Ministry for Environment, Nature Conservation and Reactor Safety BImSchG. 2015. Available online: https://germanlawarchive.iuscomp.org/?p=315 (accessed on 28 December 2020).
- Administrative regulation. Determination and Evaluation of Odour Immissions—Guideline on Odour in Ambient Air GOAA (1994/1999/2004/2008). Länderausschuss für Immissionsschutz GOAA 2008. Available online: https://ec.europa.eu/research/participants/documents/downloadPublic?documentIds=080166e5c7d98d4b&appId=PPGMS (accessed on 29 January 2021).
- Both, R.; Sucker, K.; Winneke, G.; Koch, E. Odour intensity and hedonic tone—important parameters to describe odour annoyance of residents. Water Sci. Technol. 2004, 50, 83–92. [Google Scholar] [CrossRef]
- The Association of German Engineers. VDI. Measurement of Odour Impact by Field Inspection—Measurement of the Impact Frequency of Recognizable Odours—Grid Measurement; VDI 3940 Part 1; Beuth Verlag GmbH: Berlin, Germany, 2006. [Google Scholar]
- Janicke, L.; Janicke, U.; Ahrens, D.; Hartmann, U.; M&üller, W. Development of the Odour Dispersion Model AUSTAL2000-G in Germany; VDI-Berichte: Cologne, Germany, 2004; pp. 411–417. [Google Scholar]
- The Association of German Engineers. VDI. Olfactometry—Determination of Odour Concentration by Dynamic Olfactometry—Supplementary Instructions for Application of DIN EN 13725; VDI 3884 Part 1; Beuth Verlag GmbH: Berlin, Germany, 2015. [Google Scholar]
- Both, R. Directive on odour in ambient air: An established system of odour measurement and odour regulation in Germany. Water Sci. Technol. 2001, 44, 119–129. [Google Scholar] [CrossRef]
- Sucker, K.; Both, R.; Bischoff, M.; Guski, R.; Winneke, G. Odor frequency and odor annoyance. Part I: Assessment of frequency, intensity and hedonic tone of environmental odors in the field. Int. Arch. Occup. Environ. Health 2008, 671–682. [Google Scholar] [CrossRef]
- Sucker, K.; Both, R.; Biscoff, M.; Guski, R.; Winneke, G. Odor frequency and odor annoyance Part II: Dose-response associations and their modification by hedonic tone. Int. Arch. Occup. Environ. Health. 2008, 683–694. [Google Scholar] [CrossRef]
- Both, R. Odour regulation in Germany—A new directive on odour in ambient air. Proceedings of an International Speciality Conference Sponsored by the A&WMA, Bloomington, MN, USA, 13–15 September 1995. [Google Scholar]
- The Association of German Engineers. VDI. Determination of the Hedonic Odour Tone—Polarity Profiles; VDI 3940 Part 4; Beuth Verlag GmbH: Berlin, Germany, 2010. [Google Scholar]
- State Agency for the Environment of Baden Württemberg LUBW. Creation of Polarity Profiles for the Concept of Smell and Scent for the Animal Species Fattening Bulls, Horses and Dairy Cows (In German). 2017. Available online: https://pudi.lubw.de/detailseite/-/publication/72525-Bericht.pdf (accessed on 24 August 2020).
- The Association of German Engineers. VDI. Measurement of Odour Impact by Field Inspection—Measurement of the Impact Frequency of Recognizable Odours Plume Measurement; VDI 3940 Part 2; Beuth Verlag GmbH: Berlin, Germany, 2006. [Google Scholar]
- State Agency for the Environment of Baden Württemberg LUBW. Creation of Polarity Profiles for the Concept of Smell and Scent for the Animal Species Goats and Sheep (In German). 2019. Available online: https://pudi.lubw.de/detailseite/-/publication/10083-Polarit%C3%A4tenprofile_Ziegen_Schafe.pdf (accessed on 24 August 2020).
- TA Luft. Technical Instruction on Air Quality Control (Erste Allgemeine Verwaltungsvorschrift zum Bundes-Immissionsschutzgesetz—Technische Anleitung zur Reinhaltung der Luft); Federal Ministry for Environment, Nature Conservation and Reactor Safety: Bonn, Germany, 2002. [Google Scholar]
- Baumann, R.; Brandstätter, M.; Heimburger, G.; Kranabetter, A.; Moshammer, H.; Oitzl, S.; Rau, G.; Schauberger, G.; Schauer, U.; Scheicher, E.; et al. Guideline for recording and evaluating air quality in health resorts (Richtlinie zur erfassung und bewertung der luftqualität in kurorten). In Commission for Climate and Air Quality (Kommission für Klima und Luftqualität); ÖAW: Vienna, Austria, 2013; p. 63. [Google Scholar]
- ÖAW. Umweltwissenschaftliche Grundlagen und Zielsetzungen im Rahmen des Nationalen Umweltplans für die Bereiche Klima, Luft, Geruch und Lärm; Schriftenreihe der Sektion I. Band, 17; Kommissionfür Reinhaltung der Luft der Österreichische Akademie der Wissenschaften, Ed.; Bundesministeriums für Umwelt, Jugend und Familie: Vienna, Austria, 1994; Volume 17. [Google Scholar]
- Oettl, D.; Moshammer, H.; Mandl, M.; Weitensfelder, L. Guideline for the Assessment of Odor Immissions (Richtlinie zur Beurteilung von Geruchsimmissionen); Amt der Steiermärkischen Landesregierung Abteilung 15 Energie Wohnbau Technik: Graz, Austria, 2018. [Google Scholar]
- Mainland, J.; Sobel, N. The sniff is part of the olfactory percept. Chem. Senses 2006, 31, 181–196. [Google Scholar] [CrossRef] [PubMed]
- Schauberger, G.; Piringer, M.; Petz, E. Diurnal and annual variation of the sensation distance of odour emitted by livestock buildings calculated by the Austrian odour dispersion model (AODM). Atmos. Environ. 2000, 34, 4839–4851. [Google Scholar] [CrossRef]
- Schauberger, G.; Piringer, M.; Petz, E. Corrigendum to “Diurnal and annual variation of the sensation distance of odour emitted by livestock buildings calculated by the Austrian odour dispersion model (AODM)”. Atmos. Environ. 2013, 67, 459–462. [Google Scholar] [CrossRef]
- Schauberger, G.; Piringer, M.; Schmitzer, R.; Kamp, M.; Sowa, A.; Koch, R.; Eckhof, W.; Grimm, E.; Kypke, J.; Hartung, E. Concept to assess the human perception of odour by estimating short-time peak concentrations from one-hour mean values. Atmos. Environ. 2012, 54, 624–628. [Google Scholar] [CrossRef]
- Oettl, D.; Ferrero, E. A simple model to assess odour hours for regulatory purposes. Atmos. Env. 2017, 155, 162–173. [Google Scholar] [CrossRef]
- Brancher, M.; Hieden, A.; Baumann-Stanzer, K.; Schauberger, G.; Piringer, M. Performance evaluation of approaches to predict sub-hourly peak odour concentrations. Atmos. Env. 2020, 7, 100076. [Google Scholar] [CrossRef]
- Ferrero, E.; Oettl, D. An evaluation of a Lagrangian stochastic model for the assessment of odours. Atmos. Env. 2019, 206, 237–246. [Google Scholar] [CrossRef]
- Bundesministerium fur Landwirtschaft, Forst, Umwelt und Waser BMLFUW. Guideline for the Evaluation of Ambient Odour Emitted by Livestock Buildings; Bundesministerium fur Landwirtschaft, Forst, Umwelt und Waser (Federal Ministry for Agriculture, Forestry, Environment, and Water): Vienna, Austria, 2017. [Google Scholar]
- Schauberger, G.; Piringer, M.; Jovanic, O.; Petz, E. A new empirical model to calculate separation distances between livestock buildings and residential areas applied to the austrian guideline to avoid odor nuisance. Atmos. Environ. 2012, 47, 341–1347. [Google Scholar] [CrossRef]
- Cseh, M.; Nárai, K.F.; Barcs, E.; Szepesi, D.B.; Szepesi, D.J.; Dicke, J.L. Odor setback distance calculations around animal farms and solid waste landfills. Idojaras 2010, 114, 303–318. [Google Scholar]
- DEFRA UK 2010, Ref: PB13554. Odour Guidance for Local Authorities. Available online: https://www.gov.uk/government/uploads/system/uploads/attachment_data/file/69305/pb13554-local-auth-guidance-100326.pdf (accessed on 29 July 2020).
- Environment Agency UK 2011, Ref: LIT 5419. Environmental Permitting: H4 Odour Management. Available online: https://www.gov.uk/government/uploads/system/uploads/attachment_data/file/296737/geho0411btqm-e-e.pdf (accessed on 28 July 2020).
- Bull, M.; McIntyre, A.; Hall, D.; Allison, G.; Redmore, J.; Pullen, J.; Caird, L.; Stoaling, M.; Fain, R. IAQM Guidance on the Assessment of Odour for Planning—Version 1.1; Institute of Air Quality Management: London, UK, 2018. [Google Scholar]
- DEFRA. Code of Practice on Odour Nuisance from Sewage Treatment Works; Department for Environment, Food, and Rural Affairs, DEFRA: London, UK, 2006. [Google Scholar]
- Northern Ireland Environment Agency. Odour Impact Assessment Guidance for Permitted and Licensed Sites; Northern Ireland Environment Agency: Belfast, UK, 2012. [Google Scholar]
- Guidance for Operators on Odour Management at Intensive Livestock IPPC Installations Version 3. Pollution Prevention and Control Northern Ireland. 2009. Available online: http://www.sepa.org.uk/media/60931/ippc_srg6_02_odour-management-at-intensive-livestock-installations-may-2005.pdf (accessed on 29 July 2020).
- SEPA. Odour Guidance; Scottish Environment Protection Agency, SEPA, Scottish Government: Glasgow, UK, 2010. [Google Scholar]
- Town and Country Planning (Scotland) Act. 1997. Available online: https://www.legislation.gov.uk/ukpga/1997/8/contents (accessed on 26 August 2020).
- Pollution Prevention and Control (Scotland) Regulations. 2012. Available online: https://www.legislation.gov.uk/ssi/2012/360/contents/made (accessed on 28 July 2020).
- Environmental Protection Act. 1990. Available online: http://www.legislation.gov.uk/ukpga/1990/43/part/III/crossheading/statutory-nuisances-england-and-wales (accessed on 28 July 2020).
- Standard rules SR2009 No2—Low Impact Part A Installation, Environment Agency. Available online: https://assets.publishing.service.gov.uk/government/uploads/system/uploads/attachment_data/file/790718/SR2009_No2_Low_Impact_Part_A_Installation.pdf (accessed on 18 August 2020).
- Spanish State Government. Law 5/2013, of 11 June, which Modifies Law 16/2002, of 1 July, on Prevention and Integrated Control of Pollution and Law 22/2011, of 28 July, on Waste and Soil Contaminated (Ley 5/2013, de 11 de Junio, por la que se Modifican la Ley 16/2002, de 1 de Julio, de Prevención y Control Integrados de la Contaminación y la Ley 22/2011, de 28 de Julio, de Residuos y Suelos Contaminados); Spanish Official Gazette: Madrid, Spain, 2013. Available online: https://www.boe.es/eli/es/l/2013/06/11/5/con (accessed on 11 December 2018).
- Spanish Ministry of Agriculture, Food and Environment. Royal Decree 8/15/2013, of October 18, which Approves the Regulation of Industrial Emissions and the Development of Law 16/2002, of 1 July, on the Prevention and Integrated Control of Pollution (Real Decreto 8/15/2013, de 18 de Octubre, por el que se Aprueba el Reglamento de Emisiones Industriales y de Desarrollo de la Ley 16/2002, de 1 de Julio, de Prevención y Control Integrados de la Contaminación); Spanish Official Gazette: Madrid, Spain, 2013. Available online: https://www.boe.es/eli/es/rd/2013/10/18/815 (accessed on 11 December 2018).
- Government of Catalonia. Draft of the Law against Odor Pollution, General Directorate of Environmental Quality. Government of Catalonia, Department of the Environment and Housing. General Directorate of Environmental Quality 2011. Barcelona, Spain. Available online: https://www.olores.org/images/pdfs/borrador_anteproyecto_ley_contaminacion_odorifera.pdf (accessed on 21 September 2020).
- City Council Plenary of Lliçà del Val. Ordinance Regulating the Release of Odors into the Atmosphere. Lliçà de Vall Town Hall, n.192 (Ordenanza de Regulación de la Liberación de Olores a la Atmósfera. Ayuntamiento de Lliçà de Vall, n.192); Official Gazette of the Province of Barcelona: Barcelona, Spain, 2007; Available online: https://dibaaps.diba.cat/vnis/temp/CIDO_bopb_2007_08_20070811_BOPB_20070811_027_029.pdf (accessed on 11 November 2020).
- City Council of Banyoles. Odor Ordinance of Banyoles City Council. City Council of Banyoles (Girona) (Ordenança d’Olors de l’Ajuntament de Banyoles. City Council of Banyoles (Girona), n. 120); Official Gazette of the Province of Girona: Banyoles Girona, Spain, 2008; Available online: https://seu.banyoles.cat/Portals/0/ORDENANA_A_OLORS.pdf (accessed on 28 July 2019).
- City Council of Riudellots de la Selva. Municipal Ordinance of Olors of Riudellots de la Selva. City Council of Riudellots de la Selva, n. 26 (Ordenança Municipal d’Olors de Riudellots de la Selva. City Council of Riudellots de la Selva, n. 26); Official Gazette of the Province of Girona: Banyoles Girona, Spain, 2009; Available online: https://dibaaps.diba.cat/vnis/temp/CIDO_bopg_2009_02_20090209_BOPG_20090209_027_036.pdf (accessed on 28 July 2019).
- City Council of Sarrià de Ter. Sarrià de Ter City Council Odor Ordinance. City Council of Sarrià de Ter. (Girona), n. 152 (Ordenança d’olors de l’Ajuntament de Sarrià de Ter. City Council of Sarrià de Ter. (Girona), n. 152); Official Gazette of the Province of Girona: Sarria de Ter Girona, Spain, 2018; Available online: https://ssl4.ddgi.cat/bopV1/pdf/2018/152/201815207044.pdf (accessed on 28 July 2019).
- City Council of Sant Vicent del Raspeig. Ordinance for the Protection of the Atmosphere (Ordenanza de Protección de la Atmósfera); City Council of Sant Vicent del Raspeig: Alicante, Spain, 1994; Available online: https://www.raspeig.es/uploads/ficheros/arbolficheros/descargas/201105/descargas-proteccion-de-la-atmosfera-es.pdf (accessed on 28 July 2019).
- City Council of Alcantarilla. Ordinance Regulating the Emission of Odors into the Atmosphere, Alcantarilla City Council (Ordenanza de Regulación de Emisión de Olores a la Atmósfera, Ayuntamiento de Alcantarilla); Boletín Oficial de la Región de Murcia: Murcia, Spain, 2016; Available online: https://www.alcantarilla.es/wp-content/uploads/2015/10/Ordenanza-Municipal-de-Calidad-Odor%C3%ADfera-del-Aire-1.pdf (accessed on 11 November 2020).
- City Council of San Pedro del Pinatar. Municipal Ordinance of Odoriferous Air Quality, San Pedro del Pinatar City Council (Ordenanza Municipal de Calidad Odorífera del Aire, Ayuntamiento de San Pedro del Pinatar); Boletín Oficial de la Región de Murcia: Murcia, Spain, 2011; Available online: https://www.sanpedrodelpinatar.es/wp-content/uploads/2019/09/ORDENANZA-DE-REGULACION-DE-EMISION-DE-OLORES-A-LA-ATMOSFERA.pdf (accessed on 11 November 2020).
- City Council of Las Palmas de Gran Canaria. Municipal Ordinance for the Protection of the Atmosphere Against Pollution by Forms of Matter, Las Palmas de Gran Canaria, Department of the Environment (Ordenanza Municipal de Protección de la Atmósfera Frente a la Contaminación por Formas de la Materia, Las Palmas de Gran Canaria, Concejalía de Medio Ambiente); Boletín Oficial de Las Palmas: Las Palmas, Spain, 1999; Available online: https://www.laspalmasgc.es/export/sites/laspalmasgc/.galleries/documentos-medio-ambiente/ONF_CONTAMINACIONFORMASMATERIA_17.pdf (accessed on 11 November 2020).
- Decree on General Rules for Environmental Management Establishments (Besluit Algemene Regels voor Inrichtingen Milieubeheer). 2007. Available online: https://wetten.overheid.nl/BWBR0022762/2010–07–04/ (accessed on 28 July 2020).
- Lagas, P. Odour policy in the Netherlands and consequences for spatial planning. Chem. Eng. Trans. 2010, 23, 7–12. Available online: http://www.aidic.it/cet/10/23/002.pdf (accessed on 28 July 2020).
- NEN Royal Netherlands Standardization Institute. Odour Quality—Sensory Determination of the Hedonic Tone of an Odour Using and Olfactometer; NVN 2818; NEN Netherlands Standards Institute: Delft, The Netherlands, 2019. [Google Scholar]
- Archives of the Dutch Air Emissions Directive (NeR). Available online: https://www.infomil.nl/onderwerpen/lucht-water/lucht/ner-archief/ (accessed on 29 December 2020).
- The Law of 5 of October 2006 on Livestock Odour Impact Control. Ministry of Housing, Spatial Planning and the Environment: The Hague, The Netherlands. 2006. Available online: https://wetten.overheid.nl/BWBR0020396/ (accessed on 1 February 2021).
- Noordegraaf, D.; Bongers, M. Relationship between Odour Exposure and Odour Nuisance in the Neighbourhood of Livestock Farms; PRA Odournet: Amsterdam, The Netherlands, 2007. [Google Scholar]
- Ministry of Housing, Spatial Planning and the Environment. Regulation on the Determination of Odour Emission Factors, Minimum Distances for Fur-Bearing Animals, the Method of Calculating Odour Exposure and Determining Setback Distances; Ministry of Housing, Spatial Planning and the Environment: The Hague, The Netherlands, 2006; Available online: https://wetten.overheid.nl/BWBR0020711/.
- Nijdam, R.; Dusseldorp, A.; Elders-Meijerink, M.; Jacobs, P.; Maassen, C.B.M.; van der Lelie, S.; Pasnagel, M.; van Strien, R.; van de Waal, N.; van de Weerdt, R.; et al. Guidelines on Livestock Farming and Health; Publication 2020–0092; National Institute on Public Health and Environment RIVM: Bilthoven, The Netherlands, 2020. [Google Scholar]
- Boers, D.; Geelen, L.; Erbrink, H.; Smit, L.A.M.; Heederik, D.; Hooiveld, M.; Yzermans, C.J.; Huijbregts, M.; Wouters, I.M. The relation between modeled odor exposure from livestock farming and odor annoyance among neighboring residents. Int Arch. Occup Environ. Health 2016, 89, 521–530. [Google Scholar] [CrossRef] [PubMed]
- Geelen, L.; Boers, D.; Brunekreef, B.; Wouters, I.M. Geurhinder van Veehouderij Nader Onderzocht: Meer Hinder dan Handreiking Wgv Doet Vermoeden?—Actualisatie Blootstellingresponsrelatie Tussen Gemodelleerde Cumulatieve Geurbelasting en Geurhinder in Noord-Brabant en Limburg-Noord. Odor Nuisance from Livestock Farming Further Studied: More Nuisance than the Wgv Guide Suggests?—Update of Exposure-Response Relationship between Modeled Cumulative Odor Exposure and Odor Nuisance in Noord-Brabant and Limburg-Noord; Public Health Services (GGD) of Brabant and the Institute for Risk Assessment Sciences (IRAS): Utrecht, The Netherlands, 2015; Available online: http://www.academischewerkplaatsmmk.nl/ufc/file2/hgm_internet_sites/graskl/fb5d0198ad97606c2afcff6d278343b8/pu/Eindrapport_GEUR_Loes_Geelen_23_3_2015.pdf (accessed on 14 January 2021).
- Guidelines for the Construction and Operation of Compost Production Plants. Revocation of the d.g.r 2003, n. 7/12764 (Linee Guida Relative alla Costruzione e All’esercizio Degli Impianti di Produzione di Compost. Revoca della d.g.r 2003, n. 7/12764). Regione Lombardia, Bollettino Ufficiale. Available online: https://www.territorioambiente.com/wp-content/uploads/2014/07/dgr_7_12764_esercizio_impianti_produzione_compost.pdf (accessed on 26 August 2020).
- General Determinations Regarding the Characterization of Gaseous Emissions into the Atmosphere Deriving from Activities with a Strong Odoric Impact D.G.R. 15 (Determinazioni Generali in Merito alla Caratterizzazione delle Emissioni Gassose in Atmosfera Derivanti da Attività a Forte Impatto Odorigeno D.G.R. 15). 2012. n. IX/3018.. Available online: http://www.olfattometria.com/download/dgr-lomb.pdf (accessed on 28 July 2020).
- Guidelines for the Characterization, Analysis and Definition of Technical and Managerial Criteria for the Mitigation of Emissions from Odor Impact Activities. Autonomous Province of Trento (Linee Guida per la Caratterizzazione, L’analisi e la Definizione dei Criteri Tecnici e Gestionali per la Mitigazione delle Emissioni delle Attività ad Impatto Odorigeno. Provincia autonoma di Trento). 2012. Available online: https://www.ufficiostampa.provincia.tn.it/content/download/38536/643559/file/Linee%20guida%20odori.pdf (accessed on 28 July 2020).
- Bollettino Ufficiale della Regione Puglia. Discipline of Company Odor Emissions. Emissions Deriving from Pomace Plants. Emissions in Areas at High Risk of Environmental Crisis (Disciplina delle Emissioni Odorifere Delle Aziende. Emissioni Derivanti da Sansifici. Emissioni Nelle Aree a Elevato Rischio di Crisi Ambientale); Bollettino Ufficiale della Regione Puglia: Bari, Italy, 2015. [Google Scholar]
- Decree of the Walloon Government Determining the Sectoral Conditions Relating to Composting Facilities When the Quantityg of Material Stored is Greater than or Equal to 500 m3 (Arrêté du Gouvernement Wallon Déterminant les Conditions Sectorielles Relatives aux Installations de Compostage Lorsque la quantitég de Matière Entreposée est Supérieure ou Égale à 500 m3); AGW, Walloon Government: Namur, Belgium. 2009. Available online: http://environnement.wallonie.be/data/dechets/cet/20CBD/20_2Compostage.htm (accessed on 28 July 2020).
- Nicolas, J.; Delva, J.; Cobut, P.; Romain, A.C. Development and validating procedure of a formula to calculate a minimum separation distance from piggeries and poultry facilities to sensitive receptors. Atmos. Environ. 2008, 42, 7087–7095. [Google Scholar] [CrossRef]
- Collart, C.; Lebrun, V.; Fays, S.; Salpeteur, V.; Nicolas, J.; Romain, A.C. Air survey around MSW landfills in Wallonia: Feedback of 8 years field measurements. In Proceedings of the ORBIT 2008, 6th Biomass and Organic Waste as Sustainable, Wageningen, The Netherlands, 13–15 October 2008; Available online: https://orbi.uliege.be/handle/2268/12829 (accessed on 28 July 2020).
- Romain, A.C. Landfill of solid waste. In Odour Impact Assessment Handbook; Belgiorno, V., Ed.; Wiley: Hoboken, NJ, USA, 2013; pp. 232–250. [Google Scholar]
- Romain, A.C.; Molitor, N. Rapport D’étude pour la Convention ISSEP-ULg Estimation des Nuisances Olfactives; CET Champ de Beaumont: Charleroi, Belgium, 2015. [Google Scholar]
- Nicolas, J.; Cors, M.; Romain, A.C.; Delva, J. Identification of odour sources in an industrial park from resident diaries statistics. Atmos. Environ. 2010, 44, 1623–1631. [Google Scholar] [CrossRef]
- Vision Document “The Road to a Sustainable Odor Policy” LNE Memorandum (Visiedocument ‘De weg naar een duurzaam geurbeleid’ LNE nota). Directieraad van Het Departement Leefmilieu, Natuur en Energie. 2008. Available online: www.lne.be/visie_duurzaam_geurbeleid_v6.7.doc (accessed on 29 January 2021).
- Van Broeck, G.; van Langenhove, H. Odour Standardization Research: Development of a Methodology for Setting Odour Standards for Homogeneous Industrial Sectors—Evaluation of the Applied Methodology. Ministry of the Flemish Community—Environment and Infrastructure Department—Environment, Nature, Land and Water Management Administration 2000. (Onderzoek Geurnormering: Ontwikkelen van een Methodologie voor het Opstellen van Geurnormering voor Homogene Sectoren—Evaluatie van de Toegepaste Methodologie. Ministerie van de Vlaamse Gemeenschap—Departement Leefmilieu en Infrastructuur—Administratie Milieu-, Natuur-, Land- en Waterbeheer 2000.). Available online: https://www.un.org/esa/agenda21/natlinfo/countr/belgium/natur.htm (accessed on 29 January 2021).
- University of Ghent; PRG; PRA Odournet; Eco2. Drafting of a Method to Translate No-Effect Levels into Odour Standards and Application ro 5 Pilot Sectors—Part III: Proposal of Standards for 5 Sectors—Voorstellen van een Geschikte Methode om Nuleffect Niveaus van Geurhinder te Vertalen naar Normen en Toepassing op 5 Pilootsectoren—Deel III: Formulering Voorstel Voor de 5 Pilootsectoren Ministerie van de Vlaamse Gemeenschap—Departement Leefmilieu en Infrastructuur—Administratie Milieu-, Natuur-, Land- en Waterbeheer 2002. Available online: https://omgeving.vlaanderen.be/sites/default/files/atoms/files/richtlijnenboek%2520lucht.pdf (accessed on 29 January 2021).
- Van Broeck, G.; van Langenhove, H.; Nieuwejaers, B. Recent odour regulation developments in Flanders: Ambient odour quality standards based on dose-response relationships. Water Sci. Technol. 2001, 44, 103–110. [Google Scholar] [CrossRef]
- Dermaux, D.; Vervaet, C.; Arts, P.; Lefebre, F.; van Broeck, G.; Knight, D.; Wouters, J.; van Mierlo, T.; Wackenier, L. Richtlijnenboek Air—Updated Version January 2012 (Lucht—Geactualiseerde Versie Januari 2012). Antea Group & VITO i.s.m. LNE. 2012. Available online: https://omgeving.vlaanderen.be/sites/default/files/atoms/files/richtlijnenboek%20lucht.pdf (accessed on 28 July 2020).
- Government of Flanders. Sectoral Code of Good Odor Practice—Preventing, Assessing and Controlling Odor Nuisance Caused by an Asphalt Plant (Sectorale Code van Goede Geurpraktijk—Voorkomen, Beoordelen en Beheersen van Geurhinder Veroorzaakt Door een Asfaltcentrale); Department Omgeving: Brussels, Belgium, 2015; Available online: https://omgeving.vlaanderen.be/sites/default/files/atoms/files/cvggp-asfaltcentrales-v1.pdf (accessed on 2 February 2021).
- Sectoral Code Of Good Odor Practice Preventing, Assessing And Controlling Odor Nuisance Caused By A Sewage Treatment Plant (Sectorale Code Van Goede Geurpraktijk Voorkomen, Beoordelen En Beheersen Van Geurhinder Veroorzaakt Door Een Rioolwaterzuiveringsinstallatie). Departement Omgeving LNE and Aquafin. 2018. Available online: https://omgeving.vlaanderen.be/sites/default/files/atoms/files/Sectorale_Code_van_Goede_geurpraktijk%20_RWZI_RWZI_versie_sept2018_0.pdf (accessed on 28 July 2020).
- Willems, E.; Monseré, T.; Dierckx, J. Updated Guidelines Book Environmental Impact Assessment “Basic Guidelines per Activity Group—Agricultural Animals”. ABO i.c.w. (Geactualiseerd Richtlijnenboek Milieueffectrapportage ‘Basisrichtlijnen per Activiteitengroep—Landbouwdieren’. ABO i.s.m); Departement Omgeving: Brussels, Belgium, 2019; Available online: https://omgeving.vlaanderen.be/sites/default/files/atoms/files/Richtlijnenboek%20landbouwdieren%20%28mei%202019%29.pdf (accessed on 28 July 2020).
- Environment Protection Policy (Air Quality). Environment Division, Department of Tourism, Arts and Environment. 2004. Available online: http://epa.tas.gov.au/documents/epp_air_quality_2004.pdf (accessed on 28 July 2020).
- New South Wales Environmental Protection Authority. Technical Framework: Assessment and Management of Odour from Stationary Sources in NSW; New South Wales Environmental Protection Authority: Parramatta, Australia, 2006. [Google Scholar]
- Department of Water and Environmental Regulation, Western Australia. Odour Emissions Guideline; Department of Water and Environmental Regulation, Western Australia: Joondalup, Perth, Australia, 2019. [Google Scholar]
- Methodology for Impact Assessment of Nuisance Odours in ACT. ACTEW Odour Assessment Guidelines 2007; ActAGL: Canberra, Australia, 2007. Available online: https://environment.des.qld.gov.au/__data/assets/pdf_file/0021/90246/guide-odour-impact-assess-developments.pdf (accessed on 29 January 2021).
- South Australia EPA. Odour Assessment Using Odour Source Modelling. South Australia EPA Guidelines; EPA 373/07; South Australia EPA: Adelaide, Australia, 2007. [Google Scholar]
- Department of Environment and Heritage Protection, Queensland Government. Odour Impact Assessment from Developments; Department of Environment and Heritage Protection, Queensland Government: Brisbane, Queensland, Australia, 2012. Available online: https://www.ehp.qld.gov.au/licences-permits/business-industry/pdf/guide-odour-impact-assess-developments.pdf (accessed on 27 July 2020).
- Odour and EPA’s Role. Available online: https://www.epa.vic.gov.au/for-community/environmental-information/odour/odour-epa-role (accessed on 10 November 2020).
- New Zealand Ministry for the Environment. Good Practice Guide for Assessing and Managing Odour; New Zealand Ministry for the Environment: Wellington, New Zealand, 2016. [Google Scholar]
- Katestone Scientific. Peak-to-mean ratios for odour assessments. In Report to the Environment Protection Authority of New South Wales; Katestone Scientific: Brisbane, Australia, 1995. [Google Scholar]
- Katestone Scientific. Peak-to-mean ratios for odour assessments. In Report to Environmental Protection Agency New South Wales; Katestone Scientific: Brisbane, Australia, 1998. [Google Scholar]
- New Zealand Ministry for the Environment. Microbiological Water Quality Guidelines for Marine and Freshwater Recreational Areas; New Zealand Ministry for the Environment: Wellington, New Zealand, 2003. [Google Scholar]
- Emission Standards for Odor Pollutants; GB 14554–93; Beijing, China Environmental Protection Agency and China Technical Supervision Bureau, China Standard Press: Beijing, China, 1993.
- Discharge Standard of Pollutants for Livestock and Poultry Breeding; GB 18596–2001; Beijing, China Environmental Protection Agency and China General Administration of Quality Supervision, Inspection and Quarantine, China Standard Press: Beijing, China, 2001.
- Air Quality-Determination of Odor-Triangle Odor Bag Method; GB/T 14675–93; China Environmental Protection Agency, China Standard Press: Beijing, China, 1994.
- Harrop, D.O. Air Quality Assessment and Management A Practical Guide; CRC Press: Boca Raton, FL, USA, 2002. [Google Scholar]
- Ambient Air Quality Standard; GB3095–1996; Beijing, China Environmental Protection Agency and China Technical Supervision Bureau, China Standard Press: Beijing, China, 1996.
- Ambient Air Quality Standard; GB3095–2012; Beijing, China Environmental Protection Agency and China Technical Supervision Bureau, China Standard Press: Beijing, China, 2012.
- Wang, G.; Wang, Z.S.; Li, Y.M.; Geng, J. Odor standard progress in abroad. In Proceedings of the 4th National Symposium on Odor Pollution Monitoring and Control, Zibo, China, 10–12 October 2012. [Google Scholar]
- Emission Standards for Odor Pollutants; DB31/1025–2016; Shanghai Environmental Protection Agency and Shanghai Quality and Technical Supervision Bureau, Shanghai, China. 2016. Available online: https://sthj.sh.gov.cn/ (accessed on 30 January 2021).
- Technical Specification for Environmental Monitoring of Odor; HJ 905–2017; China Environmental Protection Agency: Beijing, China 2017. Available online: http://www.mep.gov.cn/ (accessed on 11 January 2018).
- Technical Specification for Olfactory Laboratory Construction; HJ 865–2017; China Environmental Protection Agency, China Environmental Science Press: Beijing, China, 2017.
- Long, Y.; Tin, K. Sewerage and Sewage Disposal Stage 2. Environmental Impact Assessment Ordinance. Hong Kong Drainage Services and Environmental Protection Departments 2001, Environmental Impact Assessment Study Brief No. ESB-082/2001. Available online: https://www.epd.gov.hk/eia/register/study/latest/esb-082.htm (accessed on 28 July 2020).
- Japan Ministry of the Environment. The Offensive Odor Control Law; Japan Ministry of the Environment: Tokyo, Japan, 2003. Available online: http://www.env.go.jp/en/laws/air/offensive_odor/ (accessed on 1 November 2020).
- Segawa, T. Odor Regulation in Japan. East Asia Workshop on Odor Measurement and Control Review; Japan Ministry of the Environment: Tokyo, Japan, 2004; pp. 36–41. Available online: http://www.env.go.jp/en/air/odor/eastasia_ws/2–1-3.pdf (accessed on 1 November 2020).
- Japan Ministry of the Environment. Odor Index Regulation and Triangular Odor Bag Method; Japan Ministry of the Environment: Tokyo, Japan, 2003. Available online: http://www.env.go.jp/en/air/odor/regulation/ (accessed on 1 November 2020).
- Iwasaki, Y.; Ishiguro, T.; Koyama, I.; Fukushima, H.; Kobayashi, A.; Ohira, T. On the new method of determination of odor unit. In Proceedings of the 13th Annual Meeting of the Japan Society of Air Pollution, Oita, Japan, 7–9 November 1972. [Google Scholar]
- Iwasaki, Y.; Fukushima, H.; Nakaura, H.; Yajima, T.; Ishiguro, T. A new method for measuring odors by triangle odor bag method (I)—Measurement at the source. J. Jpn. Soc. Air Pollut. 1978, 13, 246–251. [Google Scholar]
- Japan Ministry of the Environment. Olfactory Measurement Method Quality Control Manual; Japan Ministry of the Environment: Tokyo, Japan, 2002. Available online: http://www.env.go.jp/en/air/odor/olfactory_mm/02quality.pdf (accessed on 1 November 2020).
- Higuchi, T.; Ukita, M.; Sekine, M.; Imai, T. A case study and recent improvements in odor management in Japan. Water Pract. 2007, 1, 1–7. [Google Scholar] [CrossRef]
- Copley International Corporation. National Survey of the Odor Problem—Study of Social and Economic Impact of Odors—Phase I; U.S. Department of Commerce—National Technical Information Services: Alexandria, VA, USA, 1970. [Google Scholar]
- Copley International Corporation. National Survey of the Odor Problem—Study of Social and Economic Impact of Odors—Phase II; U.S. Department of Commerce—National Technical Information Services: Alexandria, VA, USA, 1971. [Google Scholar]
- Copley International Corporation. National Survey of the Odor Problem—Study of Social and Economic Impact of Odors—Phase III: Development and Evaluation of a Model. Odor Control. Ordinance; U.S. Department of Commerce—National Technical Information Services: Alexandria, VA, USA, 1973. [Google Scholar]
- Huey, N.A.; Broering, L.C.; Jutze, G.A.; Gruber, C.W. Objective odor pollution control investigations. Air Pollut. Control Assoc. 1960, 10, 441–444. [Google Scholar] [CrossRef]
- Department of Public Health and Environment, State of Colorado. 5 CCR 1001–4: Regulation No. 2 Odor Emissions; 24–4-103 C.R.S; Department of Public Health and Environment, State of Colorado: Denver, CO, USA, 2013. Available online: https://www.colorado.gov/pacific/sites/default/files/5-CCR-1001–4.pdf (accessed on 27 July 2020).
- Department of Energy & Environmental Protection, State of Connecticut. Control of Odors; Department of Energy & Environmental Protection, State of Connecticut: Hartford, CT, USA, 2022. Available online: http://eregulations.ct.gov/eRegsPortal/Browse/RCSA?id=Title%2022a|22a-174|22a-174|23|22a-174|23 (accessed on 27 July 2020).
- Department of Natural Resources and Environmental Control. Control of Odorous Air Contaminants; Sections 1100 and 1119; Department of Natural Resources and Environmental Control, State of Delaware: Dover, DE, USA, 1982. Available online: http://regulations.delaware.gov/AdminCode/title7/1000/1100/1119.shtml (accessed on 27 July 2020).
- Environmental Protection Agency of Illinois. Title 35: Environmental Protection, Subtitle B: Air Pollution, Chapter I: Pollution Control Board, Subchapter 1: Air Quality Standards and Episodes, Part 245 Odors; Environmental Protection Agency of Illinois: Springfield, IL, USA, 2019. Available online: http://air.ky.gov/Pages/DAQ-Regulations.aspx (accessed on 27 July 2020).
- Department of Environmental Protection, Division of Air Quality. Ambient Air Quality; Department of Environmental Protection, Division of Air Quality, State of Kentucky: Lexington, KY, USA, 2007. Available online: http://air.ky.gov/Pages/DAQ-Regulations.aspx (accessed on 27 July 2020).
- Department of Natural Resources State of Missouri Division 10—Air Conservation. Air Quality Standards, Definitions, Sampling and Reference Methods and Air Pollution Control Regulations for the Entire State of Missouri; Department of Natural Resources State of Missouri Division 10—Air Conservation Commission: Jefferson City, MO, USA, 2013. Available online: https://www.sos.mo.gov/adrules/csr/current/10csr/10csr (accessed on 27 July 2020).
- Division of Environmental Protection, State of Nevada. Odors; Division of Environmental Protection, State of Nevada: Carson City, NV, USA, 2016; Available online: https://www.leg.state.nv.us/nac/NAC-445B.html#NAC445BSec22087 (accessed on 27 July 2020).
- Department of Health, State of North Dakota. Restriction of Odorous Air Contaminants; Department of Health, State of North Dakota EPA Administrative Code: Bismarck, ND, USA, 2007; Chapters 33, 15, 16. Available online: http://www.legis.nd.gov/information/acdata/pdf/33–15–16.pdf (accessed on 27 July 2020).
- Department of Environmental Protection. To Prevent and Control the Discharge of Air Pollutants into the Open Air Which Causes or Contributes to an Objectionable Odor or Odors; Department of Environmental Protection, State of West Virginia: Charleston, WV, USA, 1967; p. 45. [Google Scholar]
- Department of Environmental Quality State of Wyoming. Ambient Standards for Odors; Department of Environmental Quality State of Wyoming: Cheyenne, WY, USA, 2016; Chapter 2, Section 11. Available online: https://eqc.wyo.gov/Public/ViewPublicDocument.aspx?DocumentId=12592 (accessed on 27 July 2020).
- State of Oregon Department of Environmental Quality. Nuisance Odor Strategy; State of Oregon Department of Environmental Quality: Portland, OR, USA, 2014. [Google Scholar]
- Oregon Administrative Rule: Chapter 340: Environmental Quality, Division 208: Visible Emissions and Nuisance Requirements; Chapter 340, Division 208; State of Oregon: Salem, OR, USA, 2016.
- Chapter 42 Environment: Article V—Odor Control. In City of Des Moines, Iowa—Code of Ordinances; Sections 301–317. 2020. Available online: https://www.municode.com/library/ia/des_moines/codes/code_of_ordinances?nodeId=MUCO_CH42EN_ARTVODCO (accessed on 27 July 2020).
- Jacobson, L.D.; Auverman, B.W.; Massey, R.; Mitloehner, F.M.; Sutton, A.L.; Xin, H. Air issues associated with animal agriculture: A North American perspective, CAST. Issue Paper-Counc. Agric. Sci. Technol. 2011, 47, 1–24. Available online: https://www.cast-science.org/publication/air-issues-associated-with-animal-agriculture-a-north-american-perspective/ (accessed on 31 August 2020).
- U.S. Environmental Protection Agency. National Air Emissions Monitoring Study. Available online: https://www.epa.gov/afos-air/national-air-emissions-monitoring-study (accessed on 31 August 2020).
- Air Management Practices Assessment Tool (AMPAT). Iowa State University Extension and Outreach. Available online: http://www.agronext.iastate.edu/ampat/ (accessed on 31 August 2020).
- Koziel, J.A.; Andersen, D.; Harmon, J.; Hoff, S.; Maurer, D.; Rieck-Hinz, A. Improvement to air management practices assessment tool (AMPAT): Scientific literature database. In Proceedings of the ASABE Annual International Meeting, New Orleans, LA, USA, 29 July 2015. Paper No. 152190993. [Google Scholar]
- Maurer, D.L.; Koziel, J.A.; Harmon, J.D.; Hoff, S.J.; Rieck-Hinz, A.M.; Andersen, D.S. Summary of performance data for technologies to control gaseous, odor, and particulate emissions from livestock operations: Air management practices assessment tool (AMPAT). Data Brief 2016, 7, 1413–1429. [Google Scholar] [CrossRef]
- EPA national ambient air quality standards for particulate matter; Final rule. In Fed. Regist.; 2013; 78, pp. 3086–3287. Available online: https://www.federalregister.gov/documents/2013/01/15/2012-30946/national-ambient-air-quality-standards-for-particulate-matter (accessed on 30 January 2021).
- Redwine, J.S.; Lacey, R.E. A summary of state odor regulation pertaining to confined animal feeding operations. In Proceedings of the Second International Conference, Des Moines, IA, USA, 9–11 October 2000; pp. 33–41. [Google Scholar]
- Bokowa, A.H. Review of odour legislation. Chem. Eng. Trans. 2011, 23, 32. Available online: https://www.cetjournal.it/index.php/cet/issue/view/vol23 (accessed on 5 October 2020). [CrossRef]
- Government of New Brunswick. Clean Air Act; Government of New Brunswick: Fredericton, NB, Canada, 2013; Available online: https://www2.gnb.ca/content/gnb/en/departments/elg/environment/content/air_quality/clean_air.html (accessed on 1 February 2021).
- Furberg, M.; Preston, K.; Smith, B. Final Report, Odour Management in British Columbia: Review and Recommendations; RWDI AIR Inc.: Vancouver, BC, Canada, 2005; pp. 830–999. [Google Scholar]
- Government of Newfoundland and Labrador. Environmental Protection Act; Government of Newfoundland and Labrador: St John’s, NL, Canada, 2013; Chapter E-14.2; Available online: https://www.assembly.nl.ca/legislation/sr/statutes/e14-2.htm (accessed on 1 February 2021).
- Government of Northwest Territories and Nunavut. Environmental Rights Act RSNWT; Government of Northwest Territories and Nunavut: Iqaluit, NT, Canada, 1988; Volume C83, pp. 1–8. Available online: http://www.canlii.org/en/nu/laws/stat/rsnwt-nu-1988-c-83-supp/latest/rsnwt-nu-1988-c-83-supp.html (accessed on 5 October 2020).
- Government of Nova Scotia. Environment Act Chapter 1 of the Acts of 1994–95; Government of Nova Scotia: Halifax, NS, Canada, 2014; Available online: https://www.nslegislature.ca/sites/default/files/legc/statutes/environment.pdf (accessed on 1 February 2021).
- Government of Manitoba. The Environment Act. C.C.S.M. c. E125; Government of Manitoba: Winnipeg, MB, Canada, 2014. Available online: https://web2.gov.mb.ca/laws/statutes/ccsm/e125e.php (accessed on 1 February 2021).
- Standards Development Branch. Ontario’s Ambient Air Quality Criteria; (MOE) Standards Development Branch: Toronto, ON, Canada, 2012. [Google Scholar]
- Ontario Ministry of Agriculture, Food and Rural Affairs. Minimum Distance Separation (MDS) Formulae: Implementation Guidelines; Publication 707; Ontario Ministry of Agriculture, Food and Rural Affairs (OMAFRA): Guelph, ON, Canada, 2006. [Google Scholar]
- Environmental Protection Act Ontario Regulation 419/05: Air—Local Air Quality. Government of Ontario. 2013. Available online: http://www.e-laws.gov.on.ca/html/regs/english/elaws_regs_050419 (accessed on 5 October 2020).
- Nutrient Management Act. 2002. Available online: http://www.omafra.gov.on.ca/english/engineer/facts/06–073.htm (accessed on 5 October 2020).
- Ontario Municipal Act. 2001. Available online: https://www.ontario.ca/laws/statute/01m25 (accessed on 5 October 2020).
- Environmental Quality Act. Government of Quebec. Available online: http://legisquebec.gouv.qc.ca/en/ShowDoc/cs/Q-2 (accessed on 19 October 2020).
- Odours in Our Environment. Ontario Ministry of the Environment, Conservation and Parks. Available online: https://www.ontario.ca/page/odours-our-environment (accessed on 5 October 2020).
- Guo, H.; Yu, Z. Supporting Information for the Development of an Odour Guideline for Saskatchewan. Ph.D. Thesis, University of Saskatchewan, Saskatoon, SK, Canada, 2011. Available online: https://harvest.usask.ca/bitstream/handle/10388/8629/HUANG-DISSERTATION-2018.pdf?sequence=1&isAllowed=y (accessed on 5 October 2020).
- Ontario Ministry of Environment (MOE). Ontario Source Testing Code, Part G, Method ON-6: Determination of Odour Emissions from Stationary Sources; Ontario Ministry of Environment (MOE): Toronto, ON, Canada, 2010. [Google Scholar]
- Ministry of the Environment, Chile. Law N°37 2012. Standard for the Emission of Total Reduced Sulfur Compounds, Odors Generators Associated with the Manufacturing of Sulfated Pulp; Ministry of the Environment: Santiago, Chile, 2012. Available online: http://www.leychile.cl/Navegar?idNorma=1049596 (accessed on 29 July 2020).
- Ministerio Secretaría General de la Presidencia. Law N° 19.300: Law of General Basis on the Environment; Ministerio Secretaría General de la Presidencia: Santiago, Chile, 1994. Available online: http://www.leychile.cl/Navegar?idNorma=30667 (accessed on 29 July 2020).
- ECOTEC Engineering Ltd. Background for Regulation of Odors in Chile; ECOTEC Engineering Ltd.: Santiago, Chile, 2013. Available online: https://olores.mma.gob.cl/wp-content/uploads/2019/03/ECOTEC-Ingenieria.pdf (accessed on 2 February 2021).
- Ministry of the Environment Chile. Strategy for The Management of Odors in Chile; Ministry of the Environment Chile: Santiago, Chile, 2017. Available online: https://olores.mma.gob.cl/wp-content/uploads/2019/03/Estrategia_Olores_Actualizacion2017.pdf (accessed on 2 February 2021).
- Instituto Nacional de Normalización. NCh3387:2015: Air Quality and Assessment of Odour Annoyance Survey; Instituto Nacional de Normalización: Santiago, Chile, 2015. [Google Scholar]
- Instituto Nacional de Normalización. NCh3386:2015: Air Quality—Static Sampling for Olfactometry; Instituto Nacional de Normalización: Santiago, Chile, 2015. [Google Scholar]
- VDI 3883 Part 1: Effects and Assessments of Odours—Assessment of odor Annoyance. VDI 3883 Part 1. 2015. Available online: https://www.vdi.de/en/home/vdi-standards/details/vdi-3883-blatt-1-effects-and-assessment-of-odours-assessment-of-odour-annoyance-questionnaires (accessed on 29 January 2021).
- Instituto Nacional de Normalización. NCh3190:2010: Air Quality—Determination of Odour Concentration by Dynamic Olfactometry; Instituto Nacional de Normalización: Santiago, Chile, 2010. [Google Scholar]
- ICONTEC. Calidad Del Aire. Determinación de la Concentración de Olor por Olfatometría Dinámica; NTC 5880; ICONTEC: Bogota, Colombia, 2011. [Google Scholar]
- ICONTEC. Static Sampling Olfactometry; NTC 6011; ICONTEC: Bogota, Colombia, 2013. [Google Scholar]
- ICONTEC. Effects and Evaluation of Odors Psychometric Evaluation of Odor Discomfort Questionnaires; NTC 6012—1; ICONTEC: Bogota, Colombia, 2013. [Google Scholar]
- ICONTEC. Effects and Evaluation of Odors Determination of Nuisance Parameters by Repeated Short Questions, to Panelists from a Neighborhood; NTC 6012—2; ICONTEC: Bogota, Colombia, 2013. [Google Scholar]
- Ministerio de Ambiente y Desarrollo Sostenible. Resolution 1541 by which the Permissible Levels of Air Quality or Immission are Established, the Procedure for the Evaluation of Activities that Generate Offensive Odors and other Provisions are Dictated(Resolución 1541 por la cual se Establecen los Niveles Permisibles de Calidad del Aire o de Inmisión, el Procedimiento para la Evaluación de Actividades que Generan Olores Ofensivos y se Dictan otras Disposiciones); Ministerio de Ambiente y Desarrollo Sostenible: Bogota, Colombia, 2013.
- ICONTEC. Measurement of Odor Impact by Field Inspection. Measurement of the Impact Frequency of Recognizable Odors. Mesh Measurement; NTC 6049—1; ICONTEC: Bogota, Colombia, 2014. [Google Scholar]
- ICONTEC. Measurement of Odor Impact by Field Inspection. Measurement of the Impact Frequency of Recognizable Odors. Pen Measurement; NTC 6049—2; ICONTEC: Bogota, Colombia, 2014. [Google Scholar]
- ICONTEC. Measurement of Odor Impact by Field Inspection. Determination of Odor Intensity and Hedonic Odor Tone; NTC 6049—3; ICONTEC: Bogota, Colombia, 2014. [Google Scholar]
- ICONTEC. Measurement of Odor Impact by Determining Hedonic Tone of Odor Polarity Profiles; NTC 6049—4; ICONTEC: Bogota, Colombia, 2014. [Google Scholar]
- Ministerio de Ambiente y Desarrollo Sostenible. Resolution 2087: Protocol for the Monitoring, Control and Surveillance of Offensive Odors(Resolución 2087: Protocolo para el Monitoreo, Control y Vigilancia de Olores Ofensivos); Ministerio Ambiente y Desarrollo Sostenible: Bogota, Colombia, 2014.
- Japan Environment Agency. Calculation Method of Odor Index and Odor Intensity; No. 63; Japan Environment Agency: Tokyo, Japan, 1995. Available online: https://www.env.go.jp/en/laws/air/odor/cm.html (accessed on 12 October 2020).
- Joint Standards Australia/Standards New Zealand Committee EV-007, Methods for Examination of Air. Stationary Source Emissions Part 3: Determination of Odour Concentration by Dynamic Olfactometry. Aust. New Zealand Stand. 2001, 4323, 1–56. Available online: https://www.saiglobal.com/PDFTemp/Previews/OSH/as/as4000/4300/43233.pdf (accessed on 12 October 2020).
- ASTM International. Standard Practice for Determination of Odor and Taste Thresholds by a Forced-Choice Ascending Concentration Series Method of Limits; ASTM E679–19; ASTM International: West Conshohocken, PA, USA, 2019. [Google Scholar]
- Japan Environment Agency. Measurement Method of Specified Offensive Odor Substances; Japan Environment Agency: Tokyo, Japan, 1972. Available online: https://www.env.go.jp/en/laws/air/odor/mm.html (accessed on 12 October 2020).
- Brancher, M.; Griffiths, K.D.; Franco, D.; de Melo Lisboa, H. A review of odour impact criteria in selected countries around the world. Chemosphere 2017, 168, 1531–1570. [Google Scholar] [CrossRef] [PubMed]
- Hayes, J.E.; Stevenson, R.J.; Stuetz, R.M. The impact of malodour on communities: A review of assessment techniques. Sci. Total Environ. 2014, 500–501, 395–407. [Google Scholar] [CrossRef] [PubMed]
- Braithwaite, S. Sensory Analysis and Health Risk Assessment of Environmental Odors. Ph.D. Thesis, UCLA, Los Angeles, CA, USA, 2019. Available online: https://escholarship.org/uc/item/21g660d3 (accessed on 28 December 2020).


| Odour Concentration (ouE∙m−3) | Frequency of Odour Concentration Checks | Frequency of Odour Concentration Checks (with an Electronic-Sensor) |
|---|---|---|
| >100,000 | quarterly | annual |
| 5000–100,000 | biannual | biennial |
| <5000 | annual | triennial |
| Height of Point Source Emission (m) | Odour Emission Limit (ouE∙h−1) |
|---|---|
| 0 | 1000 × 103 |
| 5 | 3600 × 103 |
| 10 | 21,000 × 103 |
| 20 | 180,000 × 103 |
| 30 | 720,000 × 103 |
| 50 | 3600 × 106 |
| 80 | 18,000 × 106 |
| 100 | 36,000 × 106 |
| Annoyance Potential | Exceedance Probability pT (%) | Exceedance Probability pT (%) |
|---|---|---|
| Non-Livestock Sources | Livestock Sources (Pure Residential Areas/Agricultural Dominated Villages/Other Utilization) | |
| Small | 40 | 40/50/- |
| Medium | 15 | 15/20/30 |
| High | 10 | 10/15/20 |
| Very high | 2 | -/-/- |
| Annoyance Potential | Threshold Concentration CT (ouE∙m−3) | Threshold Concentration CT (ouE∙m−3) |
|---|---|---|
| Non-Livestock Sources | Livestock Sources (Pure Residential Areas/Agricultural Dominated Villages/Other Utilization) | |
| Small | 15 | 15/20/- |
| Medium | 5 | 5/7/10 |
| High | 4 | 4/5/7 |
| Very high | 1 | -/-/- |
| Offensiveness Scale | OIC | Example of Odour Sources |
|---|---|---|
| Most offensive odours | 1.5 ouE∙m−3 | Decaying animal or fish remains, septic effluent or sludge, biological landfill odours |
| Moderately offensive odours | 3 ouE∙m−3 | Intensive livestock rearing, fat frying (food processing), sugar beet processing, well-aerated green waste composting |
| Less offensive odours | 6 ouE∙m−3 | Brewery, confectionery, coffee roasting, bakery |
| Receptors in Residential Areas | |
|---|---|
| OIC (98th Percentile) | Distance from the Source |
| 1 ouE∙m−3 | >500 m |
| 2 ouE∙m−3 | 200–500 m |
| 3 ouE∙m−3 | <200 m |
| 2 ouE∙m−3 | >500 m |
| 3 ouE∙m−3 | 200–500 m |
| 4 ouE∙m−3 | <200 m |
| Area of the Sector Plan | OIC (98th Percentile) | |
|---|---|---|
| Existing Farm | New Farm | |
| Habitat area | 3 ouE∙m−3 | 1 ouE∙m−3 |
| Recreation area | 3 ouE∙m−3 | 1 ouE∙m−3 |
| Public service area | 3 ouE∙m−3 | 1 ouE∙m−3 |
| Cultivated area | 10 ouE∙m−3 | 6 ouE∙m−3 |
| Other areas | 6 ouE∙m−3 | 3 ouE∙m−3 |
| Sources | Target Value (No-Effect Value) [su∙m−3 as 98th Percentile] | Limit Value [su∙m−3 as 98th Percentile] |
|---|---|---|
| Slaughterhouses | 0.5 | 1.5 |
| WWTPs | 0.5 | 2.0 |
| Hedonic Tone | Target Value [su∙m−3 as 98th Percentile] |
|---|---|
| strongly unpleasant | 0.5 |
| unpleasant | 1.0–1.5 |
| neutral | 2.0 |
| pleasant | 2.5–3.0 |
| strongly pleasant | 3.5–5.0 |
| Odour Sensitivity of the Area | Target Value [su∙m−3 as 98th Percentile] | Limit Value [su∙m−3 as 98th Percentile] |
|---|---|---|
| Highly odour-sensitive locations | 0.5 | 2.0 |
| Moderate odour-sensitive locations | 2.0 | 5.0 |
| Low odour-sensitive locations | 3.0 | 10 |
| 98th Percentile-Concentration. [su∙m−3] | Low Odour-Sensitive Places | Moderate Odour-Sensitive Places | Highly Odour-Sensitive Places |
|---|---|---|---|
| >10 | Significantly negative impact | Significantly negative impact | Significantly negative impact |
| 5–10 | N negative impact | Significantly negative impact | Significantly negative impact |
| 3–5 | Negative impact | Negative impact | Significantly negative impact |
| 2–3 | Negligible impact | Negative impact | Significantly negative impact |
| 0.5–2 | Negligible impact | Negligible impact | Negative impact |
| <0.5 | Negligible impact | Negligible impact | Negligible impact |
| Concentration as 98% [ouE∙m−3] | Scattered Houses in Agricultural Area | Residential Area with Rural Character | Residential Area |
|---|---|---|---|
| >10 | Significantly negative impact | Significantly negative impact | Significantly negative impact |
| 3–10 | Negative impact | Significantly negative impact | Significantly negative impact |
| 1.5–3 | Small negative impact | Negative impact | Significantly negative impact |
| 1–1.5 | Negligible impact | Small negative impact | Negative impact |
| 0.5–1 | Negligible impact | Negligible impact | Small negative impact |
| <0.5 | Negligible impact | Negligible impact | Negligible impact |
| Concentration as 98th Percentile [ouE∙m−3] | Scattered Houses in Agricultural Area | Residential Area with Rural Character | Residential Area |
|---|---|---|---|
| >10 | Significantly negative impact | Significantly negative impact | Significantly negative impact |
| 5–10 | Negative impact | Significantly negative impact | Significantly negative impact |
| 3–5 | Small negative impact | Negative impact | Significantly negative impact |
| <3 | Negligible impact | Negligible impact | Negligible impact |
| Odour Assessment Criteria | New South Wales Australia | Western Australia | ACTEW and South Australia | Queensland Australia | Victoria Australia | Tasmania Australia | New Zealand |
|---|---|---|---|---|---|---|---|
| Impact assessment criteria | 2.0–7.0 ou Log scale based on population density | WA prefers a risk-based approach | 2.0–7.0 ou ACT 2.0–10.0 SA Log scale based on population density | 5 ou | Varies 5.0 ou Broiler farms 1.0 New Developments | 2.0 | 1.0–10.0 ou Depends on the sensitivity of the receiving environment |
| Percentile value | 99th or 100th Depends on the quality of Met and Emission Data | Dispersion modelling is no longer the first response | 99.9 | 99.5 | 99.9 | 99.5 or 99.9 For an unknown and known mixture, respectively. Or, 100 if good-quality Met and Emissions | 99.5 and 99.9 |
| Averaging period | 1 h but criteria are equivalent to 1 s | 1 h | 3 min | 1 h | 3 min | 1 h | 1 h |
| Peak-to-mean ratio | Peak-to-mean ratio applied by user to 1-h averaged conc. See Table 15. | Modelling is not used to compare against ou criteria | No peak-to-mean value applied but conc. must be scaled to 3 min using power law equation | Peak-to-mean ratio of 10:1 and 2:1 for wake-free and wake-affected + ground sources | No peak-to-mean applied but conc. must be scaled to 3 min using the power law equation | Peak-to-mean ratio is included in odour assessment criteria | Peak-to-mean ratio is included in odour assessment criteria |
| Source Type | Stability Class (Unstable and Neutral) A, B, C, D | Stability Class (Stable) E, F |
|---|---|---|
| Area | 2.5 | 2.3 |
| Wake-affected point | 2.3 | 2.3 |
| Wake-free point | 12 | 25 |
| Volume | 2.3 | 2.3 |
| Source Type | Peak-to-Mean Value |
|---|---|
| Wake-affected point and all ground-based sources | 2.0 |
| Wake-free point | 10.0 |
| South Australia (3-min Average 99.9 Percentile) | New South Wales (1-s *1 Average 99.9 Percentile) | ||
|---|---|---|---|
| Number of People | ou | Number of People | ou |
| 2000 or more | 2 | 2000 or more | 2 |
| 350 or more | 4 | Approx. 500 | 3 |
| 60 or more | 6 | Approx. 125 | 4 |
| Approx. 30 | 5 | ||
| 12 or more | 8 | Approx. 10 | 6 |
| Single Residence | 10 | Single Residence | 7 |
| High Density | 2 | 1 person or 2000 persons | 1–10 |
| 300 or more | 3 | ||
| 50 or more | 5 | ||
| 10 or more | 6 | ||
| Less than 10 | 7 | ||
| Sensitivity of the Receiving Environment | Concentration | Percentile |
|---|---|---|
| High *1 (worst-case impacts during unstable to semi-unstable conditions) | 1 ou∙m−3 | 0.1 and 0.5 |
| High *1 (worst-case impacts during neutral to stable conditions) | 2 ou∙m−3 | 0.1 and 0.5 |
| Moderate *2 (all conditions) | 5 ou∙m−3 | 0.1 and 0.5 |
| Low *3 (all conditions) | 5–10 ou∙m−3 | 0.5 |
| Pollutant | Class 1 *1 | Class 2 BER a *2 | Existing | Class 3 BER a *3 | Existing |
|---|---|---|---|---|---|
| Azane (ammonia) | 1.0 | 1.5 | 2.0 | 4.0 | 5.0 |
| N,N-dimethylmethanamine (trimethylamine) | 0.05 | 0.08 | 0.15 | 0.45 | 0.8 |
| Sulfane (hydrogen sulfide) | 0.03 | 0.06 | 0.10 | 0.32 | 0.6 |
| Methanethiol (methyl mercaptan) | 0.004 | 0.007 | 0.010 | 0.020 | 0.035 |
| Methylsulfanylmethane (dimethyl sulfide) | 0.03 | 0.07 | 0.15 | 0.55 | 1.1 |
| (Methyldisulfanyl)methane (dimethyl disulfide) | 0.03 | 0.06 | 0.13 | 0.42 | 0.71 |
| Carbon disulfide | 2.0 | 3.0 | 5.0 | 8.0 | 19 |
| Styrene (vinyl benzene) | 3.0 | 5.0 | 7.0 | 14.0 | 19 |
| Odour concentration b | 10 | 20 | 30 | 60 | 70 |
| Stack Height (m) | Discharge Limit of Emission Rate (kg∙h−1) | |||||||
|---|---|---|---|---|---|---|---|---|
| O1 | O2 | O3 | O4 | O5 | O6 | O7 | O8 | |
| 15 | 0.33 | 0.04 | 0.33 | 0.43 | 1.5 | 4.9 | 0.54 | 6.5 |
| 20 | 0.58 | 0.08 | 0.58 | 0.77 | 2.7 | 8.7 | 0.97 | 12 |
| 25 | 0.90 | 0.12 | 0.90 | 1.2 | 4.2 | 14 | 1.5 | 18 |
| 30 | 1.3 | 0.17 | 1.3 | 1.7 | 6.1 | 20 | 2.2 | 26 |
| 35 | 1.8 | 0.24 | 1.8 | 2.4 | 8.3 | 27 | 3.0 | 35 |
| 40 | 2.3 | 0.31 | 2.3 | 3.1 | 11 | 35 | 3.9 | 46 |
| 60 | 5.2 | 0.69 | 5.2 | 7.0 | 24 | 75 | 8.7 | 104 |
| 80 | 9.3 | 43 | 15 | |||||
| 100 | 14 | 68 | 24 | |||||
| 120 | 21 | 97 | 35 | |||||
| Stack Height (m) | Standard for Odour Concentration (Dilutions) |
|---|---|
| 10 | 2000 |
| 20 | 6000 |
| 30 | 15,000 |
| 40 | 20,000 |
| 50 | 40,000 |
| ≥60 | 60,000 |
| Pollutant | Stack Height (H; m) | Industrial Source | Non-Industrial Source |
|---|---|---|---|
| Odour Concentration | H < 15 | 500 | 800 |
| 15 ≤ H < 30 | 1000 | 1000 | |
| 30 ≤ H < 50 | 1500 | 1500 | |
| H ≥ 50 | 3000 | 3000 | |
| Odour Pollutants | H ≥ 15 | See Table 21 | |
| Number | Pollutant | Maximum Acceptable Emission Concentration (mg∙m−3) | Maximum Acceptable Emission Rate * (kg∙h−1) |
|---|---|---|---|
| 1 | Azane (Ammonia) | 30 | 1 |
| 2 | Sulfane (Hydrogen sulfide) | 5 | 0.1 |
| 3 | Methanethiol (Methyl mercaptan) | 0.5 | 0.01 |
| 4 | Methylsulfanylmethane (Dimethyl sulfide) | 5 | 0.1 |
| 5 | (Methyldisulfanyl)methane (Dimethyl disulfide) | 5 | 0.26 |
| 6 | Carbon disulfide | 5 | 1 |
| 7 | Styrene (Vinyl benzene) | 15 | 1 |
| 8 | Ethylbenzene | 40 | 1.5 |
| 9 | Propanal (Propionic aldehyde) # | 20 | 0.3 |
| 10 | Butanal (Butyraldehyde) # | 20 | 0.2 |
| 11 | Pentanal (Valeraldehyde) # | 20 | 0.2 |
| 12 | Butan-2-one (Methyl ethyl ketone) # | 50 | 5 |
| 13 | 4-methylpentan-2-one (Methyl isobutyl ketone) # | 80 | 3 |
| 14 | Prop-2-enoic acid (Acrylic acid) # | 20 | 0.5 |
| 15 | Methyl prop-2-enoate (Methyl acrylate) # | 20 | 1 |
| 16 | ethyl prop-2-enoate (Ethyl acrylate) # | 20 | 1 |
| 17 | Methyl 2-methylprop-2-enoate (Methyl methacrylate) # | 20 | 0.6 |
| 18 | Methanamine (Methylamine) # | 5 | 0.11 |
| 19 | N-methylmethanamine (Dimethylamine) # | 5 | 0.15 |
| 20 | N,N-dimethylmethanamine (Trimethylamine) | 5 | 0.2 |
| 21 | Ethyl acetate | 50 | 1 |
| 22 | Butyl acetate | 50 | 1 |
| Number | Pollutant | Industry Area (mg∙m−3) | Non-Industry Area (mg∙m−3) |
|---|---|---|---|
| 1 | Azane (Ammonia) | 1.0 | 0.2 |
| 2 | Sulfane (Hydrogen sulfide) | 0.06 | 0.03 |
| 3 | Methanethiol (Methyl mercaptan) | 0.004 | 0.002 |
| 4 | Methylsulfanylmethane (Dimethyl sulfide) | 0.06 | 0.02 |
| 5 | (Methyldisulfanyl)methane (Dimethyl disulfide) | 0.06 | 0.04 |
| 6 | Carbon disulfide | 2.0 | 0.3 |
| 7 | Styrene (Vinyl benzene) | 1.9 | 0.7 |
| 8 | Ethylbenzene | 0.6 | 0.4 |
| 9 | Propanal (Propionic aldehyde) | 0.26 | 0.08 |
| 10 | Butanal (Butyraldehyde) | 0.14 | 0.06 |
| 11 | Pentanal (Valeraldehyde) | 0.11 | 0.04 |
| 12 | Butan-2-one (Methyl ethyl ketone) | 2.0 | 1.0 |
| 13 | 4-methylpentan-2-one (Methyl isobutyl ketone) | 1.2 | 0.7 |
| 14 | Prop-2-enoic acid (Acrylic acid) # | 0.6 | 0.11 |
| 15 | Methyl prop-2-enoate (Methyl acrylate) # | 0.7 | 0.4 |
| 16 | ethyl prop-2-enoate (Ethyl acrylate) # | 0.4 | 0.4 |
| 17 | Methyl 2-methylprop-2-enoate (Methyl methacrylate) # | 0.4 | 0.2 |
| 18 | Methanamine (Methylamine) # | 0.05 | 0.03 |
| 19 | N-methylmethanamine (Dimethylamine) # | 0.06 | 0.04 |
| 20 | N,N-dimethylmethanamine (Trimethylamine) | 0.07 | 0.05 |
| 21 | Ethyl acetate | 1.0 | 1.0 |
| 22 | Butyl acetate # | 0.9 | 0.4 |
| 23 | Odour concentration | 20 * | 10 * |
| Stability Category | 1-h to 5-s Conversion Factor |
|---|---|
| A and B | 45 |
| C | 27 |
| D | 9 |
| Specified Offensive Odourant | Range of Standard Value at the Property Line (ppm) |
|---|---|
| Azane (Ammonia) | 1–5 |
| Methanethiol (Methyl mercaptan) | 0.002–0.01 |
| Sulfane (Hydrogen sulfide) | 0.02–0.2 |
| Methylsulfanylmethane (Dimethyl sulfide) | 0.01–0.2 |
| (Methyldisulfanyl) methane (Dimethyl disulfide) | 0.009–0.1 |
| N,N-dimethylmethanamine (Trimethylamine) | 0.005–0.07 |
| Acetaldehyde | 0.05–0.5 |
| Propanal (Propionaldehyde) | 0.05–0.5 |
| Butanal (Butyraldehyde) | 0.009–0.08 |
| 2-methylpropanal (Isobutyraldehyde) | 0.02–0.2 |
| Pentanal (Valeraldehyde) | 0.009–0.05 |
| 3-methylbutanal (Isovaleraldehyde) | 0.003–0.01 |
| 2-methylpropan-1-ol (Isobutyl alcohol) | 0.9–20 |
| Ethyl acetate | 3–20 |
| 4-methylpentan-2-one (Methyl isobutyl ketone) | 1–6 |
| Toluene | 10–60 |
| Styrene | 0.4–2 |
| Xylene | 1–5 |
| Propionic acid | 0.03–0.2 |
| Butanoic acid (Butyric acid) | 0.001–0.006 |
| Pentanoic acid (Valeric acid) | 0.0009–0.004 |
| 3-methylbutanoic acid (Isovaleric acid) | 0.001–0.01 |
| Scale | Odour Intensity |
|---|---|
| 0 | No odour |
| 1 | Barely perceivable (Detection threshold) |
| 2 | Faint but identifiable (Recognition threshold) |
| 3 | Easily perceivable |
| 4 | Strong |
| 5 | Extremely strong |
| Regulation Type | Regulation Standard of the Concentration of Specified Offensive Odourants | Regulation Standard of Odour Index |
|---|---|---|
| Odours at the property line of the site | (Enforced in 1972) Determined by the local authority within a range shown in Table 26. | (Enforced in 1996) Determined by the local authority within a range from 10 to 21. |
| (2) Odours discharged from smokestacks or other gas emission facilities | (Enforced in 1972) Given as a flow rate calculated by the following equation: q = 0.108 He2 Cm where q: flow rate of specified offensive odourant (Nm3/h), He: effective stack height (m), Cm: standard regulation value of specified offensive odourant at the property line (ppm). Applicable to the following 13 specified offensive odourants. Ammonia Hydrogen sulfide Trimethylamine Propionaldehyde Butyraldehyde Isobutyraldehyde Valeraldehyde Isovaleraldehyde Isobutyl alcohol Ethyl acetate Methyl isobutyl ketone Toluene Xylene | (Enforced in 1999) In the case the stack height (Ho) is 15 m or more Given as an odour emission rate (OER) calculated by the following equation: qt = (60 × 10A)/Fmax A = (L/10) − 0.2255 where qt: OER of discharged gas (Nm3∙min−1), Fmax: calculated value using the dispersion modelling in consideration of the building height in the vicinity (s∙Nm−3), L: standard regulation value of odour index at the property line. (2) In the case Ho is less than 15 m Given as an odour index calculated by the following equation: I = 10 log C C = K Hb2 × 10B B = L/10 where I: odour index of discharged gas, K: coefficient determined depending on the stack diameter, Hb: maximum building height in the vicinity (m). |
| (3) Odours included in wastewater | (Enforced in 1995) Given as a concentration in the wastewater calculated by the following equation: CLm = k Cm where CLm: concentration of specified offensive odourant in wastewater (mg∙L−1), k: coefficient shown in Table 29 (mg∙L−1). Applicable to the following four specified offensive odourants. Methyl mercaptan Hydrogen sulfide Dimethyl sulfide Dimethyl disulfide | (Enforced in 2001) Given as an odour index calculated by the following equation: IW = L + 16 where IW: odour index of wastewater. |
| Flow Rate of Wastewater: Q (m3∙s−1) | Q ≤ 0.001 | 0.001 < Q ≤ 0.1 | Q > 0.1 |
|---|---|---|---|
| Methanethiol (Methyl mercaptan) | 16 | 3.4 | 0.71 |
| Sulfane (Hydrogen sulfide) | 5.6 | 1.2 | 0.26 |
| Methylsulfanylmethane (Dimethyl sulfide) | 32 | 6.9 | 1.4 |
| (Methyldisulfanyl)methane (Dimethyl disulfide) | 63 | 14 | 2.9 |
| Activity | Admissible Level |
|---|---|
| Meat, fish, mollusc, and crustacean processing and preservation Oil refinery processes Paper pulp, paper, and cardboard manufacture Leathery and tanning of skins Nonhazardous waste collection, transport, transference, processing, or disposal WWTP Activities that collect water from water bodies receptors of wastewater discharges Manufacture of substances and basic chemical products Thermal destruction of animal by-products | 3 ouE∙m−3 |
| Farms Manufacture of vegetable oils and fats | 5 ouE∙m−3 |
| Decaffeination, roasting and grinding of coffee Other activities | 7 ouE∙m−3 |
| General Approach | Methods | Country | Pros | Cons |
|---|---|---|---|---|
| (1) Emission measurement | (a) Measurement of odour concentration at the source of emissions | Japan (Measurement of odour index), China, Colombia, Canada (Quebec), Germany, UK | Standardised methodology (1) | No direct relationship with odour perception by citizens |
| (b) Measurement of odour emission rate (at the source of emissions) | Japan, Canada, Germany, UK | Standardised methodology (1) for point sources and active area sources; More related to odour perception than just odour concentration measurement | Not standardised for passive area sources (except for Germany) Hardly achievable in the case of diffuse sources Not applicable to sources with variable emissions over time No direct relationship with odour perception by citizens (meteorological conditions and distance to receptors not considered) | |
| (c) Measurement of the concentration of specific odourants (chemical concentrations, mass/volume, volumetric mixing ratios) | USA (e.g., H2S), Spain, Canada, Australia, New Zealand | High confidence level in the technique | Not representative of the odour of mixture. No direct relationship with odour perception by citizens | |
| (d) Measurement of the emission rate of specific odourants (chemical mass/time) | Japan, Canada, China | Standardised methodology | Not representative of the odour of mixture. No direct relationship with odour perception by citizens | |
| (2) Fenceline measurement | (a) Measurement of odour index at the property line | Japan, China | Standardised methodology (Japan Environment Agency Notification No.63: 1995) Direct relationship with odour perception by citizens | |
| (b) Measurement of the concentration of specific odourants at the property line | Japan, Canada, China | Standardised methodology (2) | Not representative of the odour of mixture. No direct relationship with odour perception by citizens | |
| (3) Limitation of Impact | (a) Separation distances defined based on dispersion modelling | Only applicable to new installations. No direct relationship with odour perception by citizens | ||
| (b) Separation distances defined based on empirical equations | USA, Canada (animal agriculture) Australia and New Zealand separation distances are defined by modelling and empirical equations | Ease of application (Less complex than dispersion models) | Only applicable to new installations. No direct relationship with odour perception by citizens | |
| (4) Exposure assessment (OIC and complementary approaches (e.g., FIDOR factors)) | (a) Dispersion modelling | Italy (Lombardy, Piemonte, Trento), Canada (Ontario), France (applicable for solvent industries), Germany | Applicability for predictive purposes | No standardisation. Different models and settings can be used leading to different results Hardly applicable to complex sources (diffuse or variable over time) |
| (b) Field inspection | Germany (growing in AU and NZ), UK | Standardised methodology (European standard EN16841) Direct relationship with odour perception by humans | Long duration, limitations in extreme weather conditions, in not accessible areas, unsafe spots | |
| (c) Field olfactometry | USA (States and Municipalities) | |||
| (d) Citizen science | In general, less expensive than other techniques (no sophisticated equipment nor trained assessors needed). Not standardised. Bias can be reduced, and the technique can be very effective if relying on a large number of citizens and if observations are validated | Risk of bias due to the prejudice of involved citizens Might be ineffective in very conflictual situations (e.g., lawsuits) Challenging to verify each specific complaint | ||
| (e) Collection of complaints (free-form or structured) | USA (municipalities), Colombia, New Zealand, Australia, UK | Easy to implement | Risk of bias due to the prejudice of involved citizens Might be ineffective in very conflictual situations (e.g., lawsuits) Challenging to verify each specific complaint | |
| (f) Regulator determination following complaints. | UK, Colombia | No measurements are needed. Regulators need to show permit or consent conditions are not being met | It can end in a court judgment | |
| (g) IOMS (instrumental odour monitoring systems) | France | Continuous measurement Possibility to discriminate odour/odourant sources | Not standardised technique It should be connected to odour measurements |
Publisher’s Note: MDPI stays neutral with regard to jurisdictional claims in published maps and institutional affiliations. |
© 2021 by the authors. Licensee MDPI, Basel, Switzerland. This article is an open access article distributed under the terms and conditions of the Creative Commons Attribution (CC BY) license (http://creativecommons.org/licenses/by/4.0/).
Share and Cite
Bokowa, A.; Diaz, C.; Koziel, J.A.; McGinley, M.; Barclay, J.; Schauberger, G.; Guillot, J.-M.; Sneath, R.; Capelli, L.; Zorich, V.; et al. Summary and Overview of the Odour Regulations Worldwide. Atmosphere 2021, 12, 206. https://doi.org/10.3390/atmos12020206
Bokowa A, Diaz C, Koziel JA, McGinley M, Barclay J, Schauberger G, Guillot J-M, Sneath R, Capelli L, Zorich V, et al. Summary and Overview of the Odour Regulations Worldwide. Atmosphere. 2021; 12(2):206. https://doi.org/10.3390/atmos12020206
Chicago/Turabian StyleBokowa, Anna, Carlos Diaz, Jacek A. Koziel, Michael McGinley, Jennifer Barclay, Günther Schauberger, Jean-Michel Guillot, Robert Sneath, Laura Capelli, Vania Zorich, and et al. 2021. "Summary and Overview of the Odour Regulations Worldwide" Atmosphere 12, no. 2: 206. https://doi.org/10.3390/atmos12020206
APA StyleBokowa, A., Diaz, C., Koziel, J. A., McGinley, M., Barclay, J., Schauberger, G., Guillot, J.-M., Sneath, R., Capelli, L., Zorich, V., Izquierdo, C., Bilsen, I., Romain, A.-C., del Carmen Cabeza, M., Liu, D., Both, R., Van Belois, H., Higuchi, T., & Wahe, L. (2021). Summary and Overview of the Odour Regulations Worldwide. Atmosphere, 12(2), 206. https://doi.org/10.3390/atmos12020206