Characterization of Urban Greening in a District of Lecce (Southern Italy) for the Analysis of CO2 Storage and Air Pollutant Dispersion

 ,
,  ,
,  and
and
Abstract
:1. Introduction
2. A Brief Overview of Recent Microclimate and Air Quality Studies in Lecce
3. Methodology
3.1. The Investigated District
3.2. i-Tree Canopy
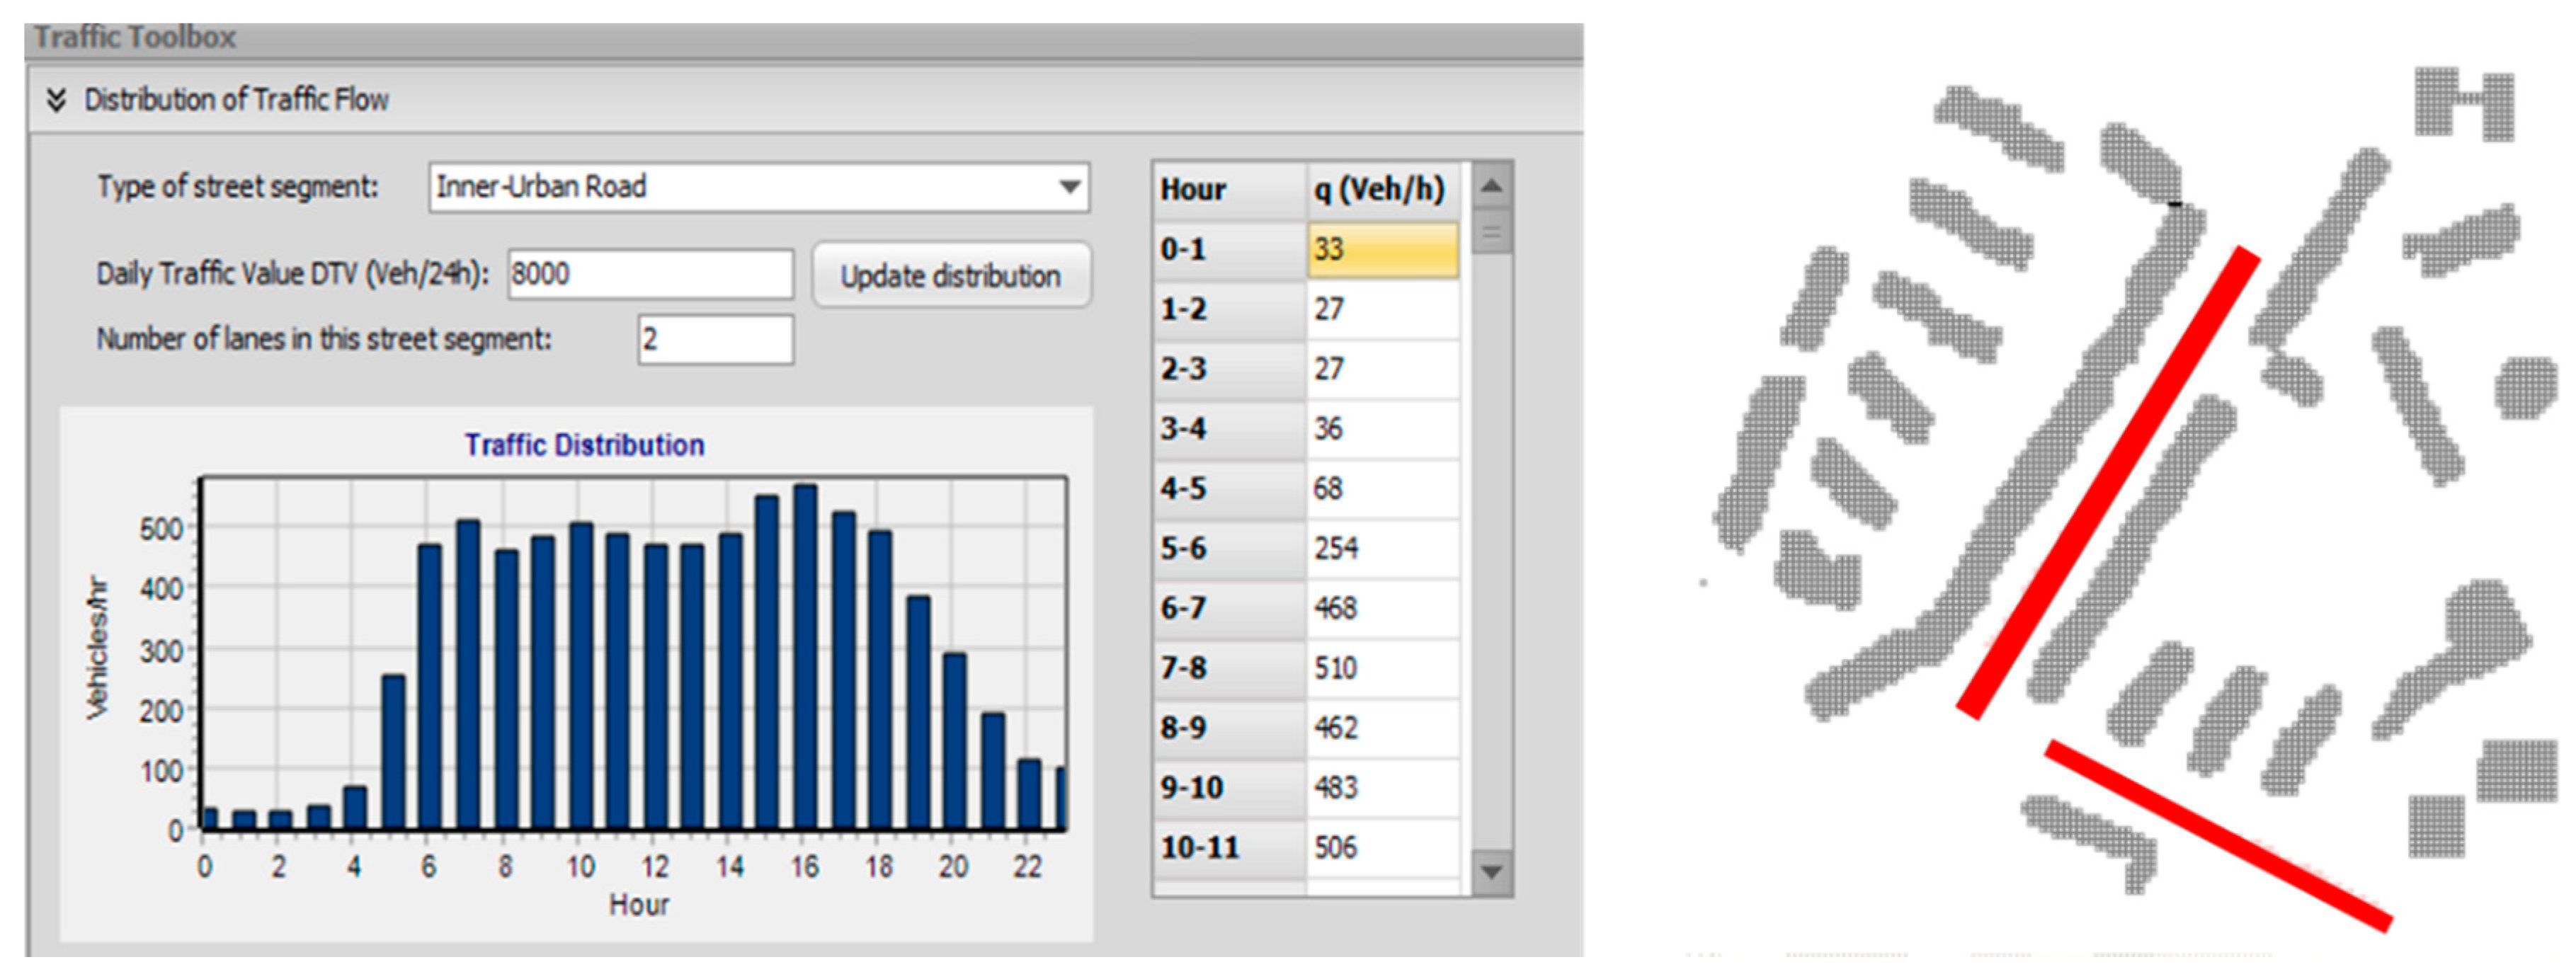
3.3. ENVI-Met
4. Results
4.1. Morphological and Vegetational Characterization of the District
Air Pollution Reduction Potential of the Identified Species
4.2. i-Tree Canopy: Cover Classes, Potential Air Pollutant Removal, and Economic Benefits
4.3. ENVI-Met: Flow and Dispersion of Air Pollutants
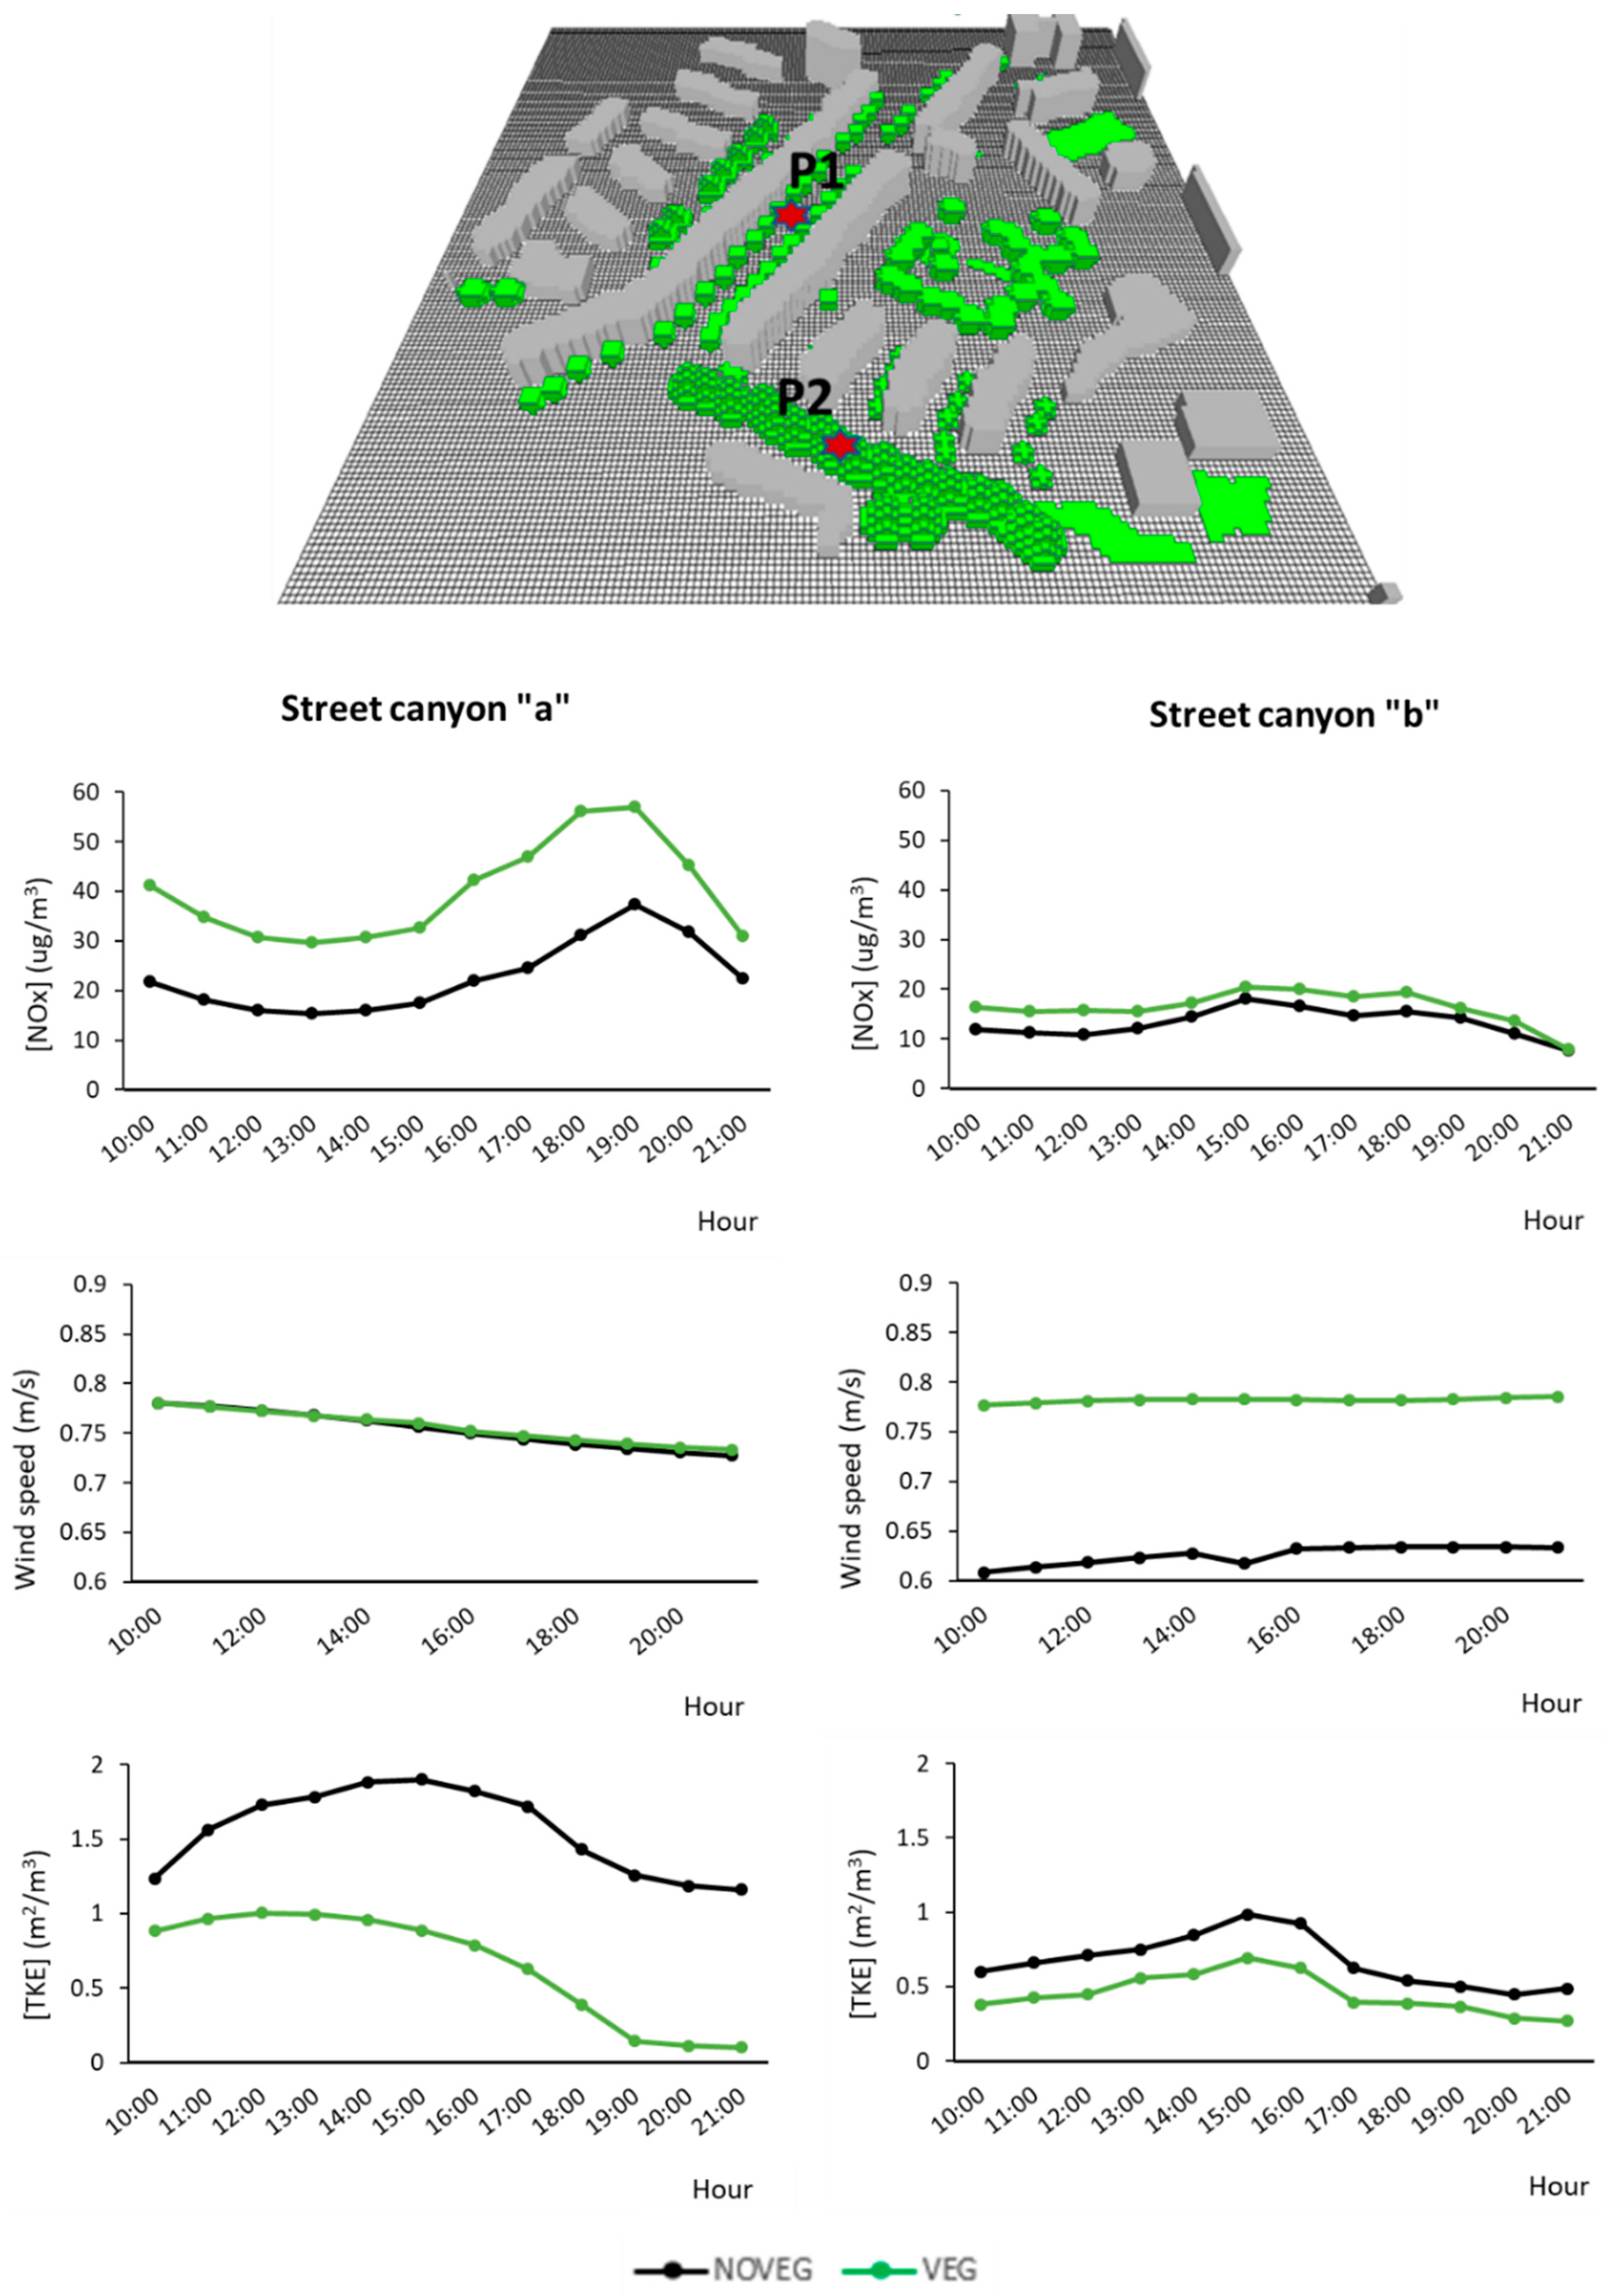
4.3.1. Profiles
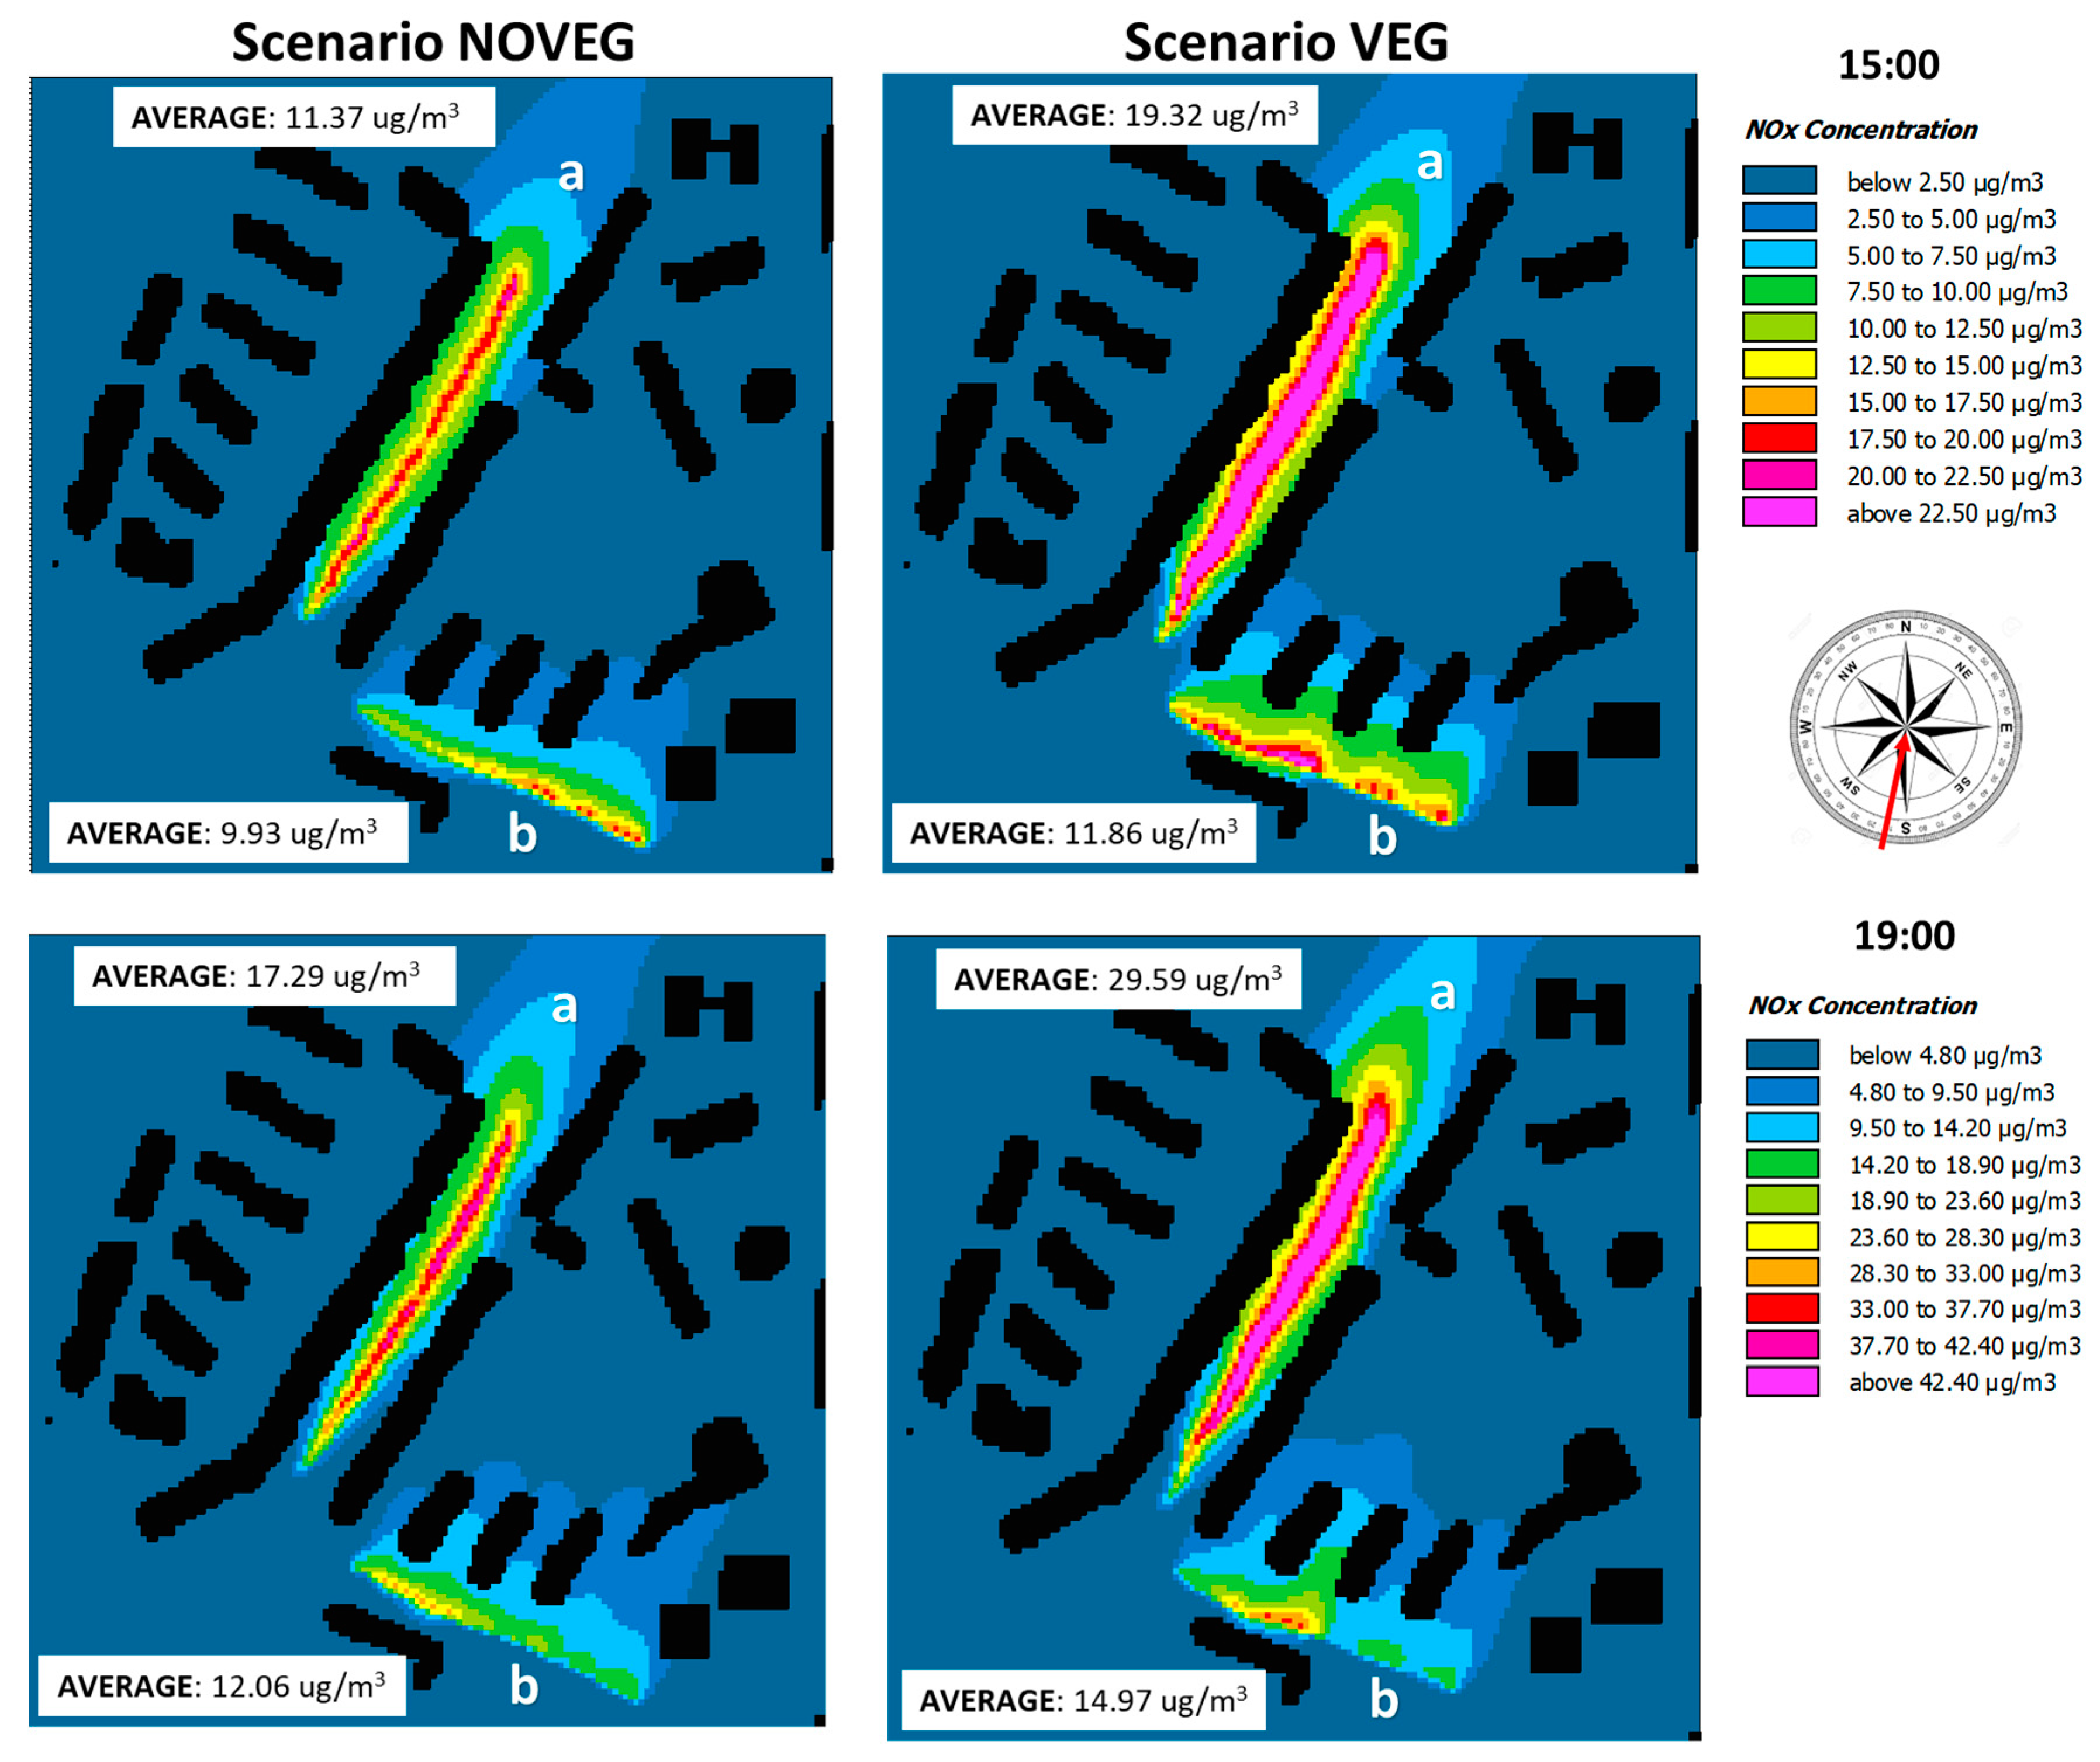
4.3.2. Maps
5. Discussion and Conclusions
5.1. Integrated Analysis of Results
- Species and their arrangement: two rows of Quercus ilex L. subsp. ilex in street canyon “a” and one row of Tilia sp. in street canyon “b”;
- Geometry of the canyon: street canyon “a” is delimited by buildings on both the right and the left sides, while street canyon “b” is more open;
- Wind direction: parallel to street canyon “a” axis and perpendicular to street canyon “b” axis.
- A lower absorption effect of the species Quercus ilex L. subsp. ilex in canyon “a” due to a lower LAD (0.71 m2/m3) than Tilia sp. (1.00 m2/m3);
- Larger aerodynamic effects, i.e., a relatively higher “blockage” effect, caused by two rows of Quercus ilex L. subsp. ilex in street canyon “a” compared to one row of Tilia sp. in the more open street canyon “b”. This was mainly confirmed by the larger decrease in turbulent kinetic energy. This larger aerodynamic effect in street canyon “a” occurred even though the wind was parallel to the street axis, while, in street canyon “b”, it was perpendicular (the latter is usually considered the worst scenario with respect to air pollutant dispersion [76]).
5.2. Future Perspectives
Author Contributions
Funding
Conflicts of Interest
References
- Karagulian, F.; Belis, C.A.; Dora, C.F.C.; Prüss-Ustün, A.M.; Bonjour, S.; Adair-Rohani, H.; Amann, M. Contributions to cities’ ambient particulate matter (PM): A systematic review of local source contributions at global level. Atmos. Environ. 2015, 120, 475–483. [Google Scholar] [CrossRef]
- Livesley, S.J.; McPherson, E.G.; Calfapietra, C. The urban forest and ecosystem services: Impacts on urban water, heat, and pollution cycles at the tree, street, and city scale. J. Environ. Qual. 2016, 45, 119–124. [Google Scholar] [CrossRef] [PubMed]
- Salmond, J.; Tadaki, M.; Vardoulakis, S.; Arbuthnott, K.G.; Coutts, A.M.; Demuzere, M.; Dirks, K.N.; Heaviside, C.; Lim, S.; MacIntyre, H.L.; et al. Health and climate related ecosystem services provided by street trees in the urban environment. Environ. Health 2016, 15, 36. [Google Scholar] [CrossRef] [PubMed] [Green Version]
- Santamouris, M.; Ban-Weiss, G.; Osmond, P.; Paolini, R.; Synnefa, A.; Cartalis, C.; Muscio, A.; Zinzi, M.; Morakinyo, T.E.; Ng, E.; et al. Progress in urban greenery mitigation science–assessment methodologies advanced technologies and impact on cities. J. Civil. Eng. Manag. 2018, 24, 638–671. [Google Scholar] [CrossRef] [Green Version]
- Abhijith, K.V.; Kumar, P.; Gallagher, J.; McNabola, A.; Baldauf, R.; Pilla, F.; Broderick, B.; Sabatino, S.D.; Pulvirenti, B. Air pollution abatement performances of green infrastructure in open road and built-up street canyon environments—A review. Atmos. Environ. 2017, 162, 71–86. [Google Scholar] [CrossRef]
- Barwise, Y.; Kumar, P. Designing vegetation barriers for urban air pollution abatement: A practical review for appropriate plant species selection. NPJ Clim. Atmos. Sci. 2020, 3, 12. [Google Scholar] [CrossRef] [Green Version]
- Santamouris, M.; Ding, L.; Fiorito, F.; Oldfield, P.; Osmond, P.; Paolini, R.; Prasad, D.; Synnefa, A. Passive and active cooling for the built environment—Analysis and assessment of the cooling potential of mitigation technologies using performance data form 220 large scale projects. Sol. Energy 2017, 154, 14–33. [Google Scholar] [CrossRef]
- Oijstaeijen, W.V.; Van Passel, S.; Cools, J. Urban green infrastructure: A review on valuation toolkits from an urban planning perspective. J. Environ. Manag. 2019, 267, 110603. [Google Scholar] [CrossRef]
- Janhäll, S. Review on urban vegetation and particle air pollution—Deposition and dispersion. Atmos. Environ. 2015, 105, 130–137. [Google Scholar] [CrossRef]
- Grote, R.; Samson, R.; Alonso, R.; Amorim, J.H.; Cariñanos, P.; Churkina, G.; Fares, S.; Le Thiec, D.; Niinemets, Ü.; Mikkelsen, T.N. Functional traits of urban trees in relation to their air pollution mitigation potential: A holistic discussion. Front. Ecol. Environ. 2016, 14, 543–550. [Google Scholar] [CrossRef]
- Xing, Y.; Brimblecombe, P. Role of vegetation in deposition and dispersion of air pollution in urban parks. Atmos. Environ. 2019, 201, 73–83. [Google Scholar] [CrossRef]
- Xing, Y.; Brimblecombe, P. Trees and parks as the lungs of cities. Urban. For. Urban. Green. 2020, 48, 126552. [Google Scholar] [CrossRef]
- Morakinyo, T.E.; Lam, Y.F.; Hao, S. Evaluating the role of green infrastructures on near-road pollutant dispersion and removal: Modelling and measurement. J. Environ. Manag. 2016, 182, 595–605. [Google Scholar] [CrossRef] [PubMed]
- Jeanjean, A.; Buccolieri, R.; Eddy, J.; Monks, P.; Leigh, R. Air quality affected by trees in real street canyons: The case of Marylebone neighbourhood in central London. Urban. For. Urban. Green. 2017, 22, 41–53. [Google Scholar] [CrossRef]
- Santiago, J.-L.; Rivas, E.; Sanchez, B.; Buccolieri, R.; Martin, F. The Impact of Planting Trees on NOx Concentrations: The Case of the Plaza de la Cruz Neighborhood in Pamplona (Spain). Atmosphere 2017, 8, 131. [Google Scholar] [CrossRef] [Green Version]
- Buccolieri, R.; Jeanjean, A.P.R.; Gatto, E.; Leigh, R.J. The impact of trees on street ventilation, NOx and PM2.5 concentrations across heights in Marylebone Rd street canyon, central London. Sustain. Cities Soc. 2018, 41, 227–241. [Google Scholar] [CrossRef]
- Buccolieri, R.; Santiago, J.L.; Rivas, E.; Sanchez, B. Review on urban tree modelling in CFD simulations: Aerodynamic, deposition and thermal effects. Urban. For. Urban. Green. 2018, 31, 212–220. [Google Scholar] [CrossRef]
- Rui, L.; Buccolieri, R.; Gao, Z.; Ding, W.; Shen, J. The Impact of Green Space Layouts on Microclimate and Air Quality in Residential Districts of Nanjing, China. Forests 2018, 9, 224. [Google Scholar] [CrossRef] [Green Version]
- Viippola, V.; Whitlow, T.H.; Zhao, W.; Yli-Pelkonen, V.; Mikola, J.; Pouyat, R.; Setälä, H. The effects of trees on air pollutant levels in peri-urban near-road environments. Urban. For. Urban. Green. 2018, 30, 62–71. [Google Scholar] [CrossRef]
- Santiago, J.L.; Buccolieri, R.; Rivas, E.; Calvete-Sogo, H.; Sanchez, B.; Martilli, A.; Alonso, R.; Elustondo, D.; Santamaría, J.M.; Martin, F. CFD modelling of vegetation barrier effects on the reduction of traffic-related pollutant concentration in an avenue of Pamplona, Spain. Sustain. Cities Soc. 2019, 48, 101559. [Google Scholar] [CrossRef]
- Yli-Pelkonen, V.; Viippola, V.; Kotze, D.J.; Setälä, H. Impacts of urban roadside forest patches on NO2 concentrations. Atmos. Environ. 2020, 232, 117584. [Google Scholar] [CrossRef]
- Haaland, C.; van den Bosch, C.K. Challenges and strategies for urban green-space planning in cities undergoing densification: A review. Urban. For. Urban. Green. 2015, 14, 760–771. [Google Scholar] [CrossRef]
- Gallagher, J.; Baldauf, R.; Fuller, C.H.; Kumar, P.; Gill, L.W.; McNabola, A. Passive methods for improving air quality in the built environment: A review of porous and solid barriers. Atmos. Environ. 2015, 120, 61–70. [Google Scholar] [CrossRef]
- Hewitt, C.N.; Ashworth, K.; MacKenzie, A.R. Using green infrastructure to improve urban air quality (GI4AQ). Ambio 2020, 49, 62–73. [Google Scholar] [CrossRef] [PubMed] [Green Version]
- I-Tree. Available online: www.itreetools.org (accessed on 4 August 2020).
- Klimas, C.; Williams, A.; Hoff, M.; Lawrence, B.; Thompson, J.; Montgomery, J. Valuing Ecosystem Services and Disservices across Heterogeneous Green Spaces. Sustainability 2016, 8, 853. [Google Scholar] [CrossRef] [Green Version]
- Kaspar, J.; Kendal, D.; Sore, R.; Livesley, S.J. Random point sampling to detect gain and loss in tree canopy cover in response to urban densification. Urban. For. Urban. Green. 2017, 24, 26–34. [Google Scholar] [CrossRef]
- Arboit, N.; Betman, E. Evaluation of the Energy Impact of Green Area Surfaces and Vegetation Cover in Forested Urban Environments with Dry Climates. Case: Mendoza Metropolitan Area, Argentina. Procedia Environ. Sci. 2017, 37, 112–130. [Google Scholar] [CrossRef]
- Del Moretto, D.; Branca, T.A.; Colla, V. Energy efficiency and reduction of CO2 emissions from campsites management in a protected area. J. Environ. Manag. 2018, 222, 368–377. [Google Scholar] [CrossRef]
- Nero, B.F.; Kwapong, N.A.; Jatta, R.; Fatunbi, O. Tree Species Diversity and Socioeconomic Perspectives of the Urban (Food) Forest of Accra, Ghana. Sustainability 2018, 10, 3417. [Google Scholar] [CrossRef] [Green Version]
- Schebella, M.F.; Weber, D.; Schultz, L.; Weinstein, P. The Wellbeing Benefits Associated with Perceived and Measured Biodiversity in Australian Urban Green Spaces. Sustainability 2019, 11, 802. [Google Scholar] [CrossRef] [Green Version]
- Xu, C.; Rahman, N.; Haase, D.; Wu, Y.; Su, M.; Pauleit, S. Surface runoff in urban areas: The role of residential cover and urban growth form. J. Clean. Prod. 2020, 262, 121421. [Google Scholar] [CrossRef]
- Namin, S.; Xu, W.; Zhou, Y.; Beyer, K. The legacy of the Home Owners’ Loan Corporation and the political ecology of urban trees and air pollution in the United States. Soc. Sci. Med. 2020, 246, 112758. [Google Scholar] [CrossRef] [PubMed]
- ENVI-Met. Available online: www.envi-met.com (accessed on 4 August 2020).
- Antonini, E.; Vodola, V.; Gaspari, J.; De Giglio, M. Outdoor Wellbeing and Quality of Life: A Scientific Literature Review on Thermal Comfort. Energies 2020, 13, 2079. [Google Scholar] [CrossRef] [Green Version]
- Lyu, T.; Buccolieri, R.; Gao, Z. A Numerical Study on the Correlation between Sky View Factor and Summer Microclimate of Local Climate Zones. Atmosphere 2019, 10, 438. [Google Scholar] [CrossRef] [Green Version]
- Rui, L.; Buccolieri, R.; Gao, Z.; Gatto, E.; Ding, W. Study of the effect of green quantity and structure on thermal comfort and air quality in an urban-like residential district by ENVI-met modelling. Build. Simul. 2019, 12, 183–194. [Google Scholar] [CrossRef]
- Tsoka, S.; Tsikaloudaki, A.; Theodosiou, T. Analyzing the ENVI-met microclimate model’s performance and assessing cool materials and urban vegetation applications—A review. Sustain. Cities Soc. 2018, 43, 55–76. [Google Scholar] [CrossRef]
- Tsoka, S.; Tsikaloudaki, K.; Theodosiou, T.; Bikas, D. Urban Warming and Cities’ Microclimates: Investigation Methods and Mitigation Strategies—A Review. Energies 2020, 13, 1414. [Google Scholar] [CrossRef] [Green Version]
- Yang, Y.; Gatto, E.; Gao, Z.; Buccolieri, R.; Morakinyo, T.E.; Lan, H. The “plant evaluation model” for the assessment of the impact of vegetation on outdoor microclimate in the urban environment. Build. Environ. 2019, 159, 106151. [Google Scholar] [CrossRef]
- Nikolova, I.; Janssen, S.; Vos, P.; Vrancken, K.; Mishra, V.; Berghmans, P. Dispersion modelling of traffic induced ultrafine particles in a street canyon in Antwerp, Belgium and comparison with observations. Sci. Total Environ. 2011, 412-413, 336–343. [Google Scholar] [CrossRef]
- Wania, A.; Bruse, M.; Blond, N.; Weber, C. Analysing the influence of different street vegetation on traffic-induced particle dispersion using microscale simulations. J. Environ. Manag. 2012, 94, 91–101. [Google Scholar] [CrossRef]
- Vos, P.E.; Maiheu, B.; Vankerkom, J.; Janssen, S. Improving local air quality in cities: To tree or not to tree? Environ. Pollut. 2013, 183, 113–122. [Google Scholar] [CrossRef] [PubMed]
- Morakinyo, T.E.; Lam, Y.F. Simulation study of dispersion and removal of particulate matter from traffic by road-side vegetation barrier. Environ. Sci. Pollut. Res. 2016, 23, 6709–6722. [Google Scholar] [CrossRef] [PubMed]
- Mahdavinejad, M.; Salehnejad, H.; Moradi, N. An ENVI-met Simulation Study on Influence of Urban Vegetation Congestion on Pollution Dispersion. Asian J. Water Environ. Pollut. 2018, 15, 187–194. [Google Scholar] [CrossRef]
- Paas, B.; Schneider, C. A comparison of model performance between ENVI-met and Austal2000 for particulate matter. Atmos. Environ. 2016, 145, 392–404. [Google Scholar] [CrossRef]
- Deng, S.; Ma, J.; Zhang, L.; Jia, Z.; Ma, L. Microclimate simulation and model optimization of the effect of roadway green space on atmospheric particulate matter. Environ. Pollut. 2019, 246, 932–944. [Google Scholar] [CrossRef]
- Simon, H.; Fallmann, J.; Kropp, T.; Tost, H.; Bruse, M. Urban Trees and Their Impact on Local Ozone Concentration—A Microclimate Modeling Study. Atmosphere 2019, 10, 154. [Google Scholar] [CrossRef] [Green Version]
- Xing, Y.; Brimblecombe, P. Urban park layout and exposure to traffic-derived air pollutants. Landsc. Urban. Plan. 2020, 194, 103682. [Google Scholar] [CrossRef]
- Maggiotto, G.; Buccolieri, R.; Santo, M.A.; Leo, L.S.; Di Sabatino, S. Validation of temperature-perturbation and CFD-based modelling for the prediction of the thermal urban environment: The Lecce (IT) case study. Environ. Model. Softw. 2014, 60, 69–83. [Google Scholar] [CrossRef]
- Maggiotto, G.; Buccolieri, R.; Santo, M.A.; Di Sabatino, S.; Leo, L.S. Study of the urban heat island in Lecce (Italy) by means of ADMS and ENVI-MET. Int. J. Environ. Pollut. 2014, 55, 41–49. [Google Scholar] [CrossRef]
- Gatto, E.; Buccolieri, R.; Aarrevaara, E.; Ippolito, F.; Emmanuel, R.; Perronace, L.; Santiago, J.L. Impact of Urban Vegetation on Outdoor Thermal Comfort: Comparison between a Mediterranean City (Lecce, Italy) and a Northern European City (Lahti, Finland). Forests 2020, 11, 228. [Google Scholar] [CrossRef] [Green Version]
- Murena, F.; Salizzoni, P. Special Issue Air Quality and Sustainable Development of Urban Agglomerations in the Mediterranean Area: Science, Technology and Policies. Available online: www.mdpi.com/journal/atmosphere/special_issues/Air_Mediterranean (accessed on 30 August 2020).
- Geo Demo Istat.It. Available online: Demo.istat.it/pop2020/index.html (accessed on 4 August 2020).
- Giorgi, F.; Lionello, P. Climate change projections for the Mediterranean region. Glob. Planet. Chang. 2008, 63, 90–104. [Google Scholar] [CrossRef]
- Di Sabatino, S.; Leo, L.S.; Cataldo, R.; Ratti, C.; Britter, R.E. Construction of Digital Elevation Models for a Southern European City and a Comparative Morphological Analysis with Respect to Northern European and North American Cities. J. Appl. Meteorol. Climatol. 2010, 49, 1377–1396. [Google Scholar] [CrossRef]
- Di Sabatino, S.; Buccolieri, R.; Pappaccogli, G.; Leo, L.S. The effects of trees on micrometeorology in a real street canyon: Consequences for local air quality. Int. J. Environ. Pollut. 2015, 58, 100–111. [Google Scholar] [CrossRef]
- Dinoi, A.; Perrone, M.R.; Burlizzi, P. Application of MODIS Products for Air Quality Studies over Southeastern Italy. Remote Sens. 2010, 2, 1767–1796. [Google Scholar] [CrossRef] [Green Version]
- Cesari, D.; Merico, E.; Dinoi, A.; Marinoni, A.; Bonasoni, P.; Contini, D. Seasonal variability of carbonaceous aerosols in an urban background area in Southern Italy. Atmos. Res. 2018, 200, 97–108. [Google Scholar] [CrossRef]
- Cesari, D.; De Benedetto, G.E.; Bonasoni, P.; Busetto, M.; Dinoi, A.; Merico, E.; Chirizzi, D.; Cristofanelli, P.; Donateo, A.; Grasso, F.M.; et al. Seasonal variability of PM2.5 and PM10 composition and sources in an urban background site in Southern Italy. Sci. Total. Environ. 2018, 612, 202–213. [Google Scholar] [CrossRef]
- Donateo, A.; Conte, M.; Grasso, F.M.; Contini, D. Seasonal and diurnal behaviour of size segregated particles fluxes in a suburban area. Atmos. Environ. 2019, 219, 117052. [Google Scholar] [CrossRef]
- Conte, M.; Merico, E.; Cesari, D.; Dinoi, A.; Grasso, F.M.; Donateo, A.; Guascito, M.R.; Contini, D. Long-term characterisation of African dust advection in south-eastern Italy: Influence on fine and coarse particle concentrations, size distributions, and carbon content. Atmos. Res. 2020, 233, 104690. [Google Scholar] [CrossRef]
- Dinoi, A.; Conte, M.; Grasso, F.M.; Contini, D. Long-Term Characterization of Submicron Atmospheric Particles in an Urban Background Site in Southern Italy. Atmosphere 2020, 11, 334. [Google Scholar] [CrossRef] [Green Version]
- Bruse, M.; Fleer, H. Simulating surface–plant–air interactions inside urban environments with a three dimensional numerical model. Environ. Model. Softw. 1998, 13, 373–384. [Google Scholar] [CrossRef]
- Bruse, M. Particle filtering capacity of urban vegetation: A microscale numerical approach. Berl. Geogr. Arb. 2007, 109, 61–70. [Google Scholar]
- Sicard, P.; Agathokleous, E.; Araminiene, V.; Carrari, E.; Hoshika, Y.; De Marco, A.; Paoletti, E. Should we see urban trees as effective solutions to reduce increasing ozone levels in cities? Environ. Pollut. 2018, 243, 163–176. [Google Scholar] [CrossRef]
- Street, R.A.; Owen, S.; Duckham, S.C.; Boissard, C.; Hewitt, C.N. Effect of habitat and age on variations in volatile organic compound (VOC) emissions from Quercus ilex and Pinus pinea. Atmos. Environ. 1997, 31, 89–100. [Google Scholar] [CrossRef]
- Paoletti, E.; Bardelli, T.; Giovannini, G.; Pecchioli, L. Air quality impact of an urban park over time. Procedia Environ. Sci. 2011, 4, 10–16. [Google Scholar] [CrossRef] [Green Version]
- Jato, V.; Rajo, F.J.; Méndez, J.A.M. Phenological behaviour of Quercus in Ourense (NW Spain) and its relationship with the atmospheric pollen season. Int. J. Biometeorol. 2002, 46, 176–184. [Google Scholar] [PubMed]
- Sgrigna, G.; Sæbø, A.; Gawronski, S.; Popek, R.; Calfapietra, C. Particulate Matter deposition on Quercus ilex leaves in an industrial city of central Italy. Environ. Pollut. 2015, 197, 187–194. [Google Scholar] [CrossRef] [PubMed]
- Colter, K.R.; Middel, C.A.; Martin, C.A. Effects of natural and artificial shade on human thermal comfort in residential neighborhood parks of Phoenix, Arizona, USA. Urban. For. Urban. Green. 2019, 44, 126429. [Google Scholar] [CrossRef]
- Rahman, M.A.; Hartmann, C.; Moser-Reischl, A.; von Strachwitz, M.F.; Paeth, H.; Pretzsch, H.; Pauleit, S.; Rötzer, T. Tree cooling ects and human thermal comfort under contrasting species and sites. Agric. For. Meteorol. 2020, 287, 107947. [Google Scholar] [CrossRef]
- Blair, J.; Roldan, C.; Ghosh, S.; Yung, S.-H. Greening Rail Infrastructure for Carbon Benefits. Procedia Eng. 2017, 180, 1716–1724. [Google Scholar] [CrossRef]
- Gratani, L.; Varone, L. Plant crown traits and carbon sequestration capability by Platanus hybrida Brot. in Rome. Landsc. Urban. Plan. 2007, 81, 282–286. [Google Scholar] [CrossRef]
- ISPRA, Linee Guida Di Forestazione Urbana Sostenibile Per Roma Capitale. Available online: www.isprambiente.gov.it/files/pubblicazioni/manuali-lineeguida/MANUALE1292015.pdf (accessed on 4 August 2020).
- Di Sabatino, S.; Buccolieri, R.; Kumar, P. Spatial Distribution of Air Pollutants in Cities. In Clinical Handbook of Air Pollution-Related Diseases; Capello, F., Gaddi, A., Eds.; Springer: Cham, Switzerland, 2018. [Google Scholar]
- Badach, J.; Dymnicka, M.; Baranowski, A. Urban Vegetation in Air Quality Management: A Review and Policy Framework. Sustainability 2020, 12, 1258. [Google Scholar] [CrossRef] [Green Version]
- Life GAIA Project. Available online: Lifegaia.eu (accessed on 4 August 2020).
- Yang, J.; Chang, Y.M.; Yan, P.B. Ranking the suitability of common urban tree species for controlling PM2.5 pollution. Atmos. Pollut. Res. 2015, 6, 267–277. [Google Scholar] [CrossRef] [Green Version]
- Abbey, T.; Rathier, T. Effects of Mycorrhizal Fungi, Biostimulants and Water Absorbing Polymers on the Growth and Survival of Four Landscape Plant Species. J. Environ. Hortic. 2005, 23, 108–111. [Google Scholar]


| Parameter | Definition | Value |
|---|---|---|
| Simulation Time | Start date | 7 July 2019 |
| Start of simulation (h) | 5:00 a.m. | |
| Total simulation time | 16 h (4 h spin-up + 12 h) | |
| Meteorological conditions | Wind speed | 0.9 m/s |
| Wind direction | 210 ° | |
| Temperature of atmosphere (forced) | Daily profile | |
| Relative humidity (%) (forced) | Daily profile | |
| Roughness, solar radiation, and clouds | Roughness length | 0.1 (urban area) |
| Cover of low clouds (octas) | 1.00 (clear sky) | |
| Cover of medium clouds | 0.00 (clear sky) | |
| Cover of high clouds | 0.00 (clear sky) | |
| Soil | Initial temperature (K) and relative humidity (%) of upper layer 0–0.2 m | 293–50 (default values) |
| Initial temperature (K) and relative humidity (%) of middle layer 0.2–0.5 m | 293–60 (default values) | |
| Initial temperature (K) and relative humidity (%) of deep layer below 0.5 m | 293–60 (default values) | |
| Computational domain and grid | Grid cells (x, y, z) | 150 × 150 × 30 |
| δx × δy × δz | 2 m × 2 m × 2 m (equidistant: 5 cells close to the ground) | |
| Nesting grids | 5 | |
| Boundary conditions | Cyclic |
| Tree Benefit Estimates: Carbon (English Units) | ||||||
|---|---|---|---|---|---|---|
| Description | Carbon (t) | ±SE | CO2 Equivalent (t) | ±SE | Value (EUR) | ±SE |
| Sequestered annually in trees | 10.05 | ±0.60 | 36.86 | ±2.19 | 1586 | ±94 |
| Stored in trees (Note: this benefit is not an annual rate) | 252.48 | ±14.97 | 925.75 | ±54.88 | 39,822 | ±2361 |
| Tree Benefit Estimates: Air Pollution (English Units) | ||||||
| Abbreviation | Description | Amount (lb) | ±SE | Value (EUR) | ±SE | |
| CO | Caron monoxide removed annually | 8.32 | ±0.49 | 5 | ±0 | |
| NO2 | Nitrogen dioxide removed annually | 45.97 | ±2.72 | 9 | ±1 | |
| O3 | Ozone removed annually | 355.07 | ±21.05 | 427 | ±25 | |
| PM10 | Inhalable particles, with diameters that are generally 10 µm and smaller, removed annually | 100.78 | ±5.97 | 292 | ±17 | |
| PM2.5 | Fine inhalable particles, with diameters that are generally 2.5 µm and smaller, removed annually | 18.14 | ±1.08 | 893 | ±53 | |
| SO2 | Sulfur dioxide removed annually | 22.60 | ±1.34 | 1 | ±0 | |
| Total | 550.87 | ±32.66 | 1,627 | ±96 | ||
© 2020 by the authors. Licensee MDPI, Basel, Switzerland. This article is an open access article distributed under the terms and conditions of the Creative Commons Attribution (CC BY) license (http://creativecommons.org/licenses/by/4.0/).
Share and Cite
Buccolieri, R.; Gatto, E.; Manisco, M.; Ippolito, F.; Santiago, J.L.; Gao, Z. Characterization of Urban Greening in a District of Lecce (Southern Italy) for the Analysis of CO2 Storage and Air Pollutant Dispersion. Atmosphere 2020, 11, 967. https://doi.org/10.3390/atmos11090967
Buccolieri R, Gatto E, Manisco M, Ippolito F, Santiago JL, Gao Z. Characterization of Urban Greening in a District of Lecce (Southern Italy) for the Analysis of CO2 Storage and Air Pollutant Dispersion. Atmosphere. 2020; 11(9):967. https://doi.org/10.3390/atmos11090967
Chicago/Turabian StyleBuccolieri, Riccardo, Elisa Gatto, Michela Manisco, Fabio Ippolito, Jose Luis Santiago, and Zhi Gao. 2020. "Characterization of Urban Greening in a District of Lecce (Southern Italy) for the Analysis of CO2 Storage and Air Pollutant Dispersion" Atmosphere 11, no. 9: 967. https://doi.org/10.3390/atmos11090967