The Multiple-Scale Nature of Urban Heat Island and Its Footprint on Air Quality in Real Urban Environment


1
Department of Physics and Astronomy DIFA, Alma Mater Studiorum University of Bologna, via Irnerio 46, 40126 Bologna (BO), Italy
2
Department of Industrial Engineering, Alma Mater Studiorum University of Bologna, viale del Risorgimento, 2, 40136 Bologna (BO), Italy
*
Author to whom correspondence should be addressed.
Atmosphere 2020, 11(11), 1186; https://doi.org/10.3390/atmos11111186
Submission received: 14 October 2020
/
Revised: 27 October 2020
/
Accepted: 29 October 2020
/
Published: 2 November 2020
(This article belongs to the Special Issue Air Quality and Sustainable Development of Urban Agglomerations in the Mediterranean Area: Science, Technology and Policies)
Abstract
:The complex interaction between the Urban Heat Island (UHI), local circulation, and air quality requires new methods of analysis. To this end, this study investigates the multiple scale nature of the UHI and its relationship with flow and pollutant dispersion in urban street canyons with and without the presence of vegetation. Two field experimental campaigns, one in summer and one in winter, were carefully designed in two parallel urban street canyons in the city of Bologna (44°29′ N, 11°20′ E; Italy) characterized by a similar orientation with respect to the impinging background flow but with a different aspect ratio and a different presence of vegetation. In addition to standard meteorological variables, the dataset collected included high-resolution flow data at three levels and concentration data of several pollutants. The UHI has been evaluated by combining surface temperature of building facades and ground surfaces acquired during two intensive thermographic campaigns with air temperature from several stations in order to verify the presence of intra-city neighborhood scale UHIs additional to the more classical urban–rural temperature differences. The presence of trees together with the different morphologies was shown to mitigate the UHI intensity of around 40% by comparing its value in the center of the city free of vegetation and the residential area. To capture the multiple-scale nature of UHI development, a simple relationship for the UHI convergence velocity, used as a surrogate for UHI strength, is proposed and used to establish the relationship with pollutant concentrations. The reliability of the proposed relationship has been verified using a Computational Fluid Dynamics (CFD) approach. The existence of a robust relationship between UHI strength and pollutant concentration may indicate that the positive effect of mitigation solutions in improving urban thermal comfort likely will also positively impact on air pollution. These results may be useful for a quick assessment of the pollutant accumulation potential in urban street canyons.
1. Introduction
More than half of the world’s population live in urban areas, and especially in highly-dense cities, a proportion that is expected to increase to 68% by 2050 [1]. Long term projections indicate that urbanization together with the overall growth of the world’s population could add further 2.5 billion people to urban areas by 2050, with percentages reaching 90% in Asia and Africa [1].
Increasing urbanization and associated change in land surface physical properties such as roughness, thermal inertia, and albedo [2] and land surface processes can deeply affect regional and local scale meteorology and air quality, through alteration of the surface–atmosphere coupling such as exchange of momentum, water, and energy [3]. In particular, urbanization modifies local meteorological variables such as wind speed, air temperature, and also influences the planetary boundary layer (PBL) height, which in turn results in urban–rural air temperature and dispersal potential differences. Among these, the Urban Heat Island (UHI) effect, defined as the phenomenon of enhanced temperatures in urban areas compared to the surrounding countryside, is currently recognized as one of the most evident characteristics of urban climate [4]. UHI has been recognized as one of the most prominent issues of the 21st century in relation to urbanization and industrialization [5] and to global climate and environmental change [6], which is likely to exacerbate the frequency and duration of extreme heat events e.g., [7,8]. The UHI results from the reduction in vegetation and evapotranspiration, the prevalence of dark surfaces with reduced albedo, and increased anthropogenic heat production in cities [9], which together contribute to increase the temperatures of urban areas as compared to their surroundings. Besides triggering heat related diseases and premature deaths in cities [10,11], the elevated air and surface temperatures during UHI events increase the city-scale mean and peak cooling energy demand and associated greenhouse gas emissions [12] due to lower efficiency in Heating, Ventilation and Air Conditioning (HVAC systems and significant drops in urban thermal comfort [13].
Other less studied changes induced by urbanization are the variations in wind speed and direction caused by the spatial variations in surface roughness or by the modifications in land-sea temperature contrast [14]. In addition, changes in temperature and surface roughness can modify the PBL height during daytime and nighttime through modifications of the buoyancy production by sensible heat flux and variance in wind speed, ultimately changing the magnitude of turbulent kinetic energy [15]. All these changes in meteorological variables, modifying emissions, chemical reaction rates, gas-particle phase partitioning of semi-volatile species, pollutant dispersion, pollutant deposition, and vertical mixing can drive changes in the concentrations of airborne pollutants [16]. In addition, the rapid development of urbanization leads to increased emissions of air pollutants [17], which together with other factors including climate, meteorology, physiography, and social conditions lead to severe air quality problems [18]. Indeed, the urban atmosphere is generally characterized by higher levels of pollution particles with respect to the rural atmosphere, a phenomenon called the Urban Pollution Island (UPI) [19]. Altogether, therefore, although urbanization leads to a positive series of human welfare outcomes, its effects on human health are controversial [20].
While mitigation measures to counteract the UHI phenomenon, including the design of cool pavements by increasing the albedo of surfaces and making them more porous, permeable, and water retentive, the increased utilization of green spaces within the urban landscape e.g., [21], and the exploitation of the cooling effects of wind and water [22], are well studied and documented, less so is the superposition of other changes, such as the increased exposure to air pollutants, likely exacerbated by the simultaneous increased heat stress. Thus, the identification of mitigation measures capable simultaneously to improve thermal comfort and air quality is currently needed.
In this framework, urban street trees have been recognized to provide many environmental, social, and economic benefits for our cities [23], among them the reduction of building energy use [24], reduction in high urban temperatures, mitigation of the UHI [25], mitigation of climate change [26], and improvement in thermal comfort [27] as linked to the enhanced shading and conversion of radiation into latent heat and evapotranspiration [28,29].
The intensification of trees and more in general of green infrastructure has also been considered as a solution to reduce air and noise pollution and enhance sustainability of cities [30] providing better storm-water management [31]. However, while the benefits derived from green infrastructure on thermal comfort and urban heat island mitigation are undoubted, the impacts on air quality at street levels, including both positive and negative effects depending on different factors such as meteorology, climatology, height, shape, and density of the tree species, are still a matter of investigation [32]. It is understood that an improved knowledge of the interaction between UHI and air quality will be useful to target mitigation actions.
As discussed above, several methods of investigations have been used in the literature to study the UHI, the UPI, and their inter-linkages with urban flow and dispersion. As far as the numerical approaches are concerned, methods rely on both atmospheric models such as WRF (Weather Research and Forecasting), e.g., [33,34,35] and Computational Fluid Dynamics (CFD) approaches, e.g., [36,37,38]. While the first category is able to capture the large-scale interaction with the local features by solving the complete set of equations that capture the full relationship between surface and a rotating atmosphere, the latter uses generic thermo-fluid dynamics equations having the advantage of characterizing individual obstacles effects on flow and dispersion. Specifically, CFD approaches have been used to evaluate the role of canyon related features, such as the effect of aspect ratio and wind/ventilation characteristics on the urban thermal microclimate, UHI, heat, and mass transport, e.g., [39,40,41,42,43,44]. Within the present study, CFD simulations are complementary to the data analyses and used only for the purpose of assessing the robustness of a simple relationship between temperature gradients and flow and concentration field. To our knowledge this is the first study of this kind relating the multiple scale-nature of the UHI with the flow dynamics, providing a relationship between UHI and UPI in urban street canyons, and using CFD simulations to strengthen the validity of such a relationship. Following the above, this paper investigates the link between UHI and pollutant concentration in urban street canyons, assessed with and without vegetation. To evaluate how the two effects are linked, two experimental field campaigns were carried out in the city of Bologna (Figure 1) in Italy (44°29′ N, 11°20′ E) within the “iSCAPE” (“Improving the Smart Control of Air Pollution in Europe”) H2020 research and innovation project. Specifically, we try to respond to the following questions:
- Could the UHI phenomenon be a multiple-scale phenomenon? What is the impact of the UHI at different scales on the flow dynamics? Are there any differences in behavior?
- As UHI and UPI are commonly linked, is it possible to determine a relationship linking these two aspects at a very local scale? How the associated circulation would develop and how can relate to local pollutant concentrations?
With the intent to respond to the previous questions, the paper is structured as follows. After the Introduction section, Section 2 describes the two field campaigns, detailing the characteristics of the two urban street canyons where the two campaigns were carried out and the instrumentation therein deployed. Section 3.1 focuses on the evaluation of the multiscale nature of the UHI effect at urban and neighborhood levels. Section 3.2 then derives a relationship between UHI and pollutant concentrations in urban street canyons, verified by means of high-resolution CFD simulations adequately setup. Finally, Section 4 draws the main conclusions of this work.
2. Field Campaigns in Bologna
2.1. Rationale for the Study and Site Description
Because of the inherent complexity and multiple interactions between physical processes at different spatial and temporal scales, the study of the urban environment requires a multiapproach investigation. Indeed, flow dynamics and turbulence structures are well known to depend on spatial and temporal scales within the city [45,46], time of the day and insolation [47], and even traffic regimes [48,49]. Atmospheric processes such as ventilation, diffusion or flow circulation can affect or be affected by vegetation and urban heat island effects. With the aim to disentangle the contribution of UHI and pollutant concentration, in this study the analysis of field data collected during two experimental field campaigns was complemented with numerical simulations.
In particular, two intensive experimental field campaigns were carried out respectively during summer (10 August 2017–24 September 2017) and winter (16 January 2018–14 February 2018) to measure atmospheric flows and turbulence, air temperature and air quality within two different street canyons embedded in the city of Bologna. The city is located at the southern end of the Po Valley at the foothill of the Apennines chain, a region considered a hotspot for climate change and air pollution [50]. The city morphology can be considered as typical for European cities [51,52], characterized by a densely built historical center surrounded by residential suburbs and a small industrial area.
The center is characterized by a dense network of narrow street canyons occasionally interrupted by small parks or squares, while the residential suburb streets retain the canyon-like shape but diminishing the building packaging. Two parallel street canyons running north to south, Marconi St. and Laura Bassi St., were chosen as experimental sites for the campaigns, being the first representative of the historical area, and the second of the suburbs (Figure 2). Laura Bassi St. is a 700 m long street surrounded by both small private houses (2–3 floors) and higher buildings (4–5 floors), accounting for a mean building height H of 17 m. The street is composed of two lanes surrounded by an almost regular deployment of deciduous trees, for a mean street width W of 25 m. Marconi St., about 600 m long, is surrounded by buildings with at least 4–5 floors up to 9–10 floors (H = 33 m). The street is composed of four lanes, two for private and two reserved for public transport (W = 20 m). Along the carriageway, there are porticos, covered pathways with sideways. No vegetative element is planted along this road, except for the last 50 m approaching one street end, where there is a single lane of deciduous trees placed on one side of the road. Top views of both canyons are pictured in Figure 2. The majority of the vegetative elements in Laura Bassi St. neighborhood belongs to the Platanus Acerifolia Mill family, a hybrid of Platanus Orientalis, and Platanus Occidentalis, widely spread in European urban habitats. The average height of the branch-free trunk is about 5 m and the crown extends up to 15 m in height. Along the street, tree trunks are regularly spaced at approximately 8 m distance, allowing different crowns superimposition.
2.2. Instrumentation Setup
As previously described, the main scope of this work is to investigate the analysis of the UHI at different spatial scales, and to address the interaction between UHI and UPI effects. As such, and according to the indications of [53] describing the need for urban-specific measurement techniques to provide guidance to policy and decision makers for the design of sustainable cities, we utilized observations from a network of meteorological and air quality monitoring stations covering the various spatial scales involved in the investigations (see Figure 3).
As previously described in Section 2.1, the main investigation sites are the street canyons of Marconi St. and Laura Bassi St., where a full set of instrumentations was deployed to measure both meteorological and air quality quantities. Supporting measurements of ancillary variables are retrieved from the local environmental protection agency ARPAE (Agenzia Regionale per la Prevenzione, l’Ambiente e l’Energia dell’Emilia-Romagna) network of monitoring stations inside the city. In particular, Asinelli Tower (site AS, 44°29′39.2″ N, 11°20′48.2″ E) is a synoptic meteorological station (100 m AGL -above ground level-), while Silvani St. (site SI, 44°30′03.9″ N, 11°19′42.6″ E) is an urban meteorological station in the city center (35 m AGL), necessary to downscale the synoptic conditions to the urban background (city-scale) meteorological characteristics. Porta San Felice (site PSF, 44°29′56.8″ N, 11°19′38.2″ E) and Giardini Margherita (site GM, 44°28′57.6″ N, 11°21′14.9″ E) are two air quality monitoring stations, characterized as urban traffic and urban background respectively, which allow evaluation of traffic-related air pollutant characteristics at city and in-canyon scales. Finally, at Irnerio St., on the roof of the Department of Physics and Astronomy of the University of Bologna (site CL, 44°29′58.1″ N, 11°21′14.4″ E), additional supporting measurements of boundary layer height were carried out using a Vaisala CL31 ceilometer. In addition to the urban network, the rural meteorological station of Mezzolara (site MZ; 44°35′ N, 11°33′ E, within the Po Valley about 7 km to the north of Bologna) is used as a representative extra-urban site for the investigation.
The main sites of the campaigns were extensively instrumented to cover a large variety of the local-scale dynamics and thermodynamics of vegetated and non-vegetated urban canopies, and to explore the links with air quality. Three sites were deployed at three different heights within and above each canyon, named ground, mid-canyon, and rooftop levels. The instrumentation deployed in each canyon is specular, but the installation heights are different due to the difference in the identified buildings where the instruments were deployed. In Marconi St., ground level (site MA1, 44°29′55.4″ N, 11°20′18.0″ E) instrumentations are set at 4 m (AGL), mid-canyon level (site MA2, 44°30′04.4″ N, 11°20′22.2″ E) is set at 7 m (AGL) and the rooftop (site MA3, 44°30′04.4″ N, 11°20′22.2″ E) is located at 33 m (AGL). In Laura Bassi St., the respective heights are 3 m, 9 m (AGL) inside the canyon (sites LB1 and LB2, 44°29′02.4″ N, 11°22′05.3″ E and 44°28′54.6″ N, 11°22′00.4″ E), while the rooftop-level (site LB3, 44°28′59.9″ N, 11°22′01.2″ E) height had to change from the 18 m of the summer campaign to the 15 m of the winter one according to site availability (the locations of each site is displayed in Figure 4).
Two mobile laboratories, i.e., vans equipped for air quality and meteorological measurements, were deployed by ARPAE at MA1 and LB1 locations. Mobile laboratories were equipped for continuous measurements of air quality pollutants such as nitrogen dioxides (NOx-NO2-NO), carbon monoxide (CO), sulphur dioxide (SO2), ozone (O3), and particulate matter (PM10 and PM2.5), together with cup anemometer and wind vane for wind speed and direction measurements and thermohygrometers for temperature and relative humidity measurements, all at a sampling rate of 1 min except for particulate matter (1 day sampling rate). High-frequency meteorological instrumentation was installed at each level in and above the canyons to enhance the temporal resolution of the meteorological data and to enable the investigation of turbulent processes. The 3D-wind field was sampled at a 20 Hz with GILL Windmaster sonic anemometers (Gill Instruments Limited, Hampshire, UK), while air temperature, relative humidity and pressure were gathered at sampling rate of 1 Hz respectively by HCS2S3 Rotronic thermohygrometers (Rotronic Instruments Ltd., Crawley, UK) and Vaisala PTB110 barometers (Vaisala, Helsinki, Finland). Additional measurements of the energy balance between short-wave and long-wave far-infrared radiation versus surface-reflected short-wave and outgoing long-wave radiation were performed at sampling rate of 1 min at both MA3 and LB3 locations with CNR4 radiometers (Kipp & Zonen B.V., Delft, The Netherlands). A summary of the experimental setup at each location site is presented in Table 1.
Within the experimental campaigns, two intensive operational periods (one per campaign) were devoted to collecting extra measurements to investigate the UHI phenomenon. Specifically, the temperature distribution of building façades and ground surfaces in the two streets was analyzed collecting simultaneously images in the two canyons with two high-performance thermal cameras FLIR T620 ThermalCAMs (FLIR Systems Inc., Wilsonville, OR, USA) with uncooled microbolometer, 640 × 480 pixels resolution and an image acquisition frequency of 50–60 Hz, selecting two appropriate periods characterized by clear sky and calm winds, i.e., during synoptic conditions particularly favorable to the onset of UHI, i.e., characterized by weak synoptic forcing [54] (22–23 August 2017 during the summer campaign, and 8–9 February 2018 during the winter campaign). Specifically, we selected days for which the weather forecasts indicated wind speed below 5 m s−1 at 700 hPa and characterized by clear-sky conditions (see Appendix B). During the experiments, images were collected simultaneously by standing operators during a 24 h acquisition with regular intervals of 2 h (total of 12 acquisitions in 24 h at each site). This choice allowed the collection of images at 12:00 (close to the maximum surface temperature), 14:00, 16:00 (close to the maximum air temperature), 18:00, 20:00, 22:00 (close to maximum UHI intensity), 24:00, 02:00, 04:00, 06:00, 08:00, 10:00, and 12:00 (UTC + 2). Note that during the summer campaign a technical issue occurred to the thermal camera in Laura Bassi St., so measurements in that canyon from midnight to the end of the experiment were performed with a delay of 1 h with respect to Marconi St. Analyzed buildings were selected on the basis of the homogeneity of construction material and the absence of obstacles (balconies, eave, etc.), metal or glass. Several shots or portions of the same building façade at several different heights were taken in order to maintain a similar resolution for all images. Finally, measurements of ground surfaces were also collected. The precise positioning of the selected buildings is provided in Figure 4. In particular, in Marconi St. the buildings 1, 2, and 8 are located on the east side, while buildings number 4, 5, and 6 are located on the west side; finally, the positions 3 and 7 indicate the sites where the temperature of the asphalt surface was measured. Similarly, in Laura Bassi St., buildings 5, 7, and 8 are located on the east side, while buildings number 1, 2, and 3 are located on the west side, and finally numbers 4 and 6 indicate the positions of the measurements of the ground surface.
3. Results and Discussion
3.1. Urban Heat Island
To address the urban heat island development at neighborhood and city scale levels we used the data collected within the two intensive thermographic campaigns performed in the two street canyon areas described previously.
Figure 5 presents and compares the diurnal evolution of the air temperature measured within and above the two street canyons of Marconi and Laura Bassi (sites 1 and 2 respectively) and at the rural meteorological station of Mezzolara (MZ in Figure 5), during the summer and winter experimental campaigns. Besides the evolution of air temperature measured with the thermohygrometers, the Figure also presents the pattern of temperature of the building façades, considering one reference building located on the west side and one located on the east side in both canyons (respectively, MA P1 E and MA P5W i.e., position 1 and 5 in Marconi St. in Figure 4a, LB P1W and LB P8E, i.e., positions 1 and 8 in Laura Bassi St. in Figure 4b).
Figure 5 shows very clearly the UHI phenomenon, i.e., the effect of overheating of cities with respect to the countryside during the summer season. The effect is reduced at Laura Bassi St. with respect to Marconi St., both due to the presence of vegetation as well as being located further from the city center in a residential area in the outskirts of Bologna where the presence of small houses and apartments favor heat exchange and urban thermal comfort with respect to the highly packaged buildings typical of the historical city center where Marconi St. lies. This also indicates the positive role of trees in improving thermal comfort and reducing the urban heat island phenomenon. In addition, the plots also show that during the night both street canyons are isothermal, i.e., there is no temperature difference between the building façades on the two sides of the streets nor with the temperature of the air in the street canyon, while during the day, depending on the position of the Sun, one side is hotter than the other one: this effect is visible at both street canyons but is more evident at Marconi St. During winter (Figure 5b), similar UHI effects are observed at both sites, with urban–rural differences of about 6 °C but with a nighttime increase in both air and buildings’ temperatures observed during the night of 8 February 2018. This effect was partially attributed to the presence of a cloud cover limiting the nighttime radiative cooling, as indicated during night both by local observations and by thermal composite satellite images. In addition, the nighttime increase can be tentatively attributed to the on and off switching of residential heating: in this case, the difference between the patterns observed in the two street canyons might be due to the different kinds of buildings in the two street canyons, where Marconi St. is characterized by block of flats with central heating whereas Laura Bassi St. is instead characterized by small residential houses with independent heating. Considering the similar urban–rural temperature differences in the two seasons and the reduced differences at neighborhood scales observed in the winter season, in addition to the limited impact of vegetation during this season, on the following we chose to focus just on the summer observations.
3.1.1. City (Urban–Rural) and Neighborhood (Canyon–Canyon) Scales
The UHI is generally attributed to the differential heat release in the atmosphere between urban and rural environment, causing a horizontal temperature difference between them. However, the heterogeneous morphology of a city allows the development of horizontal temperature differences within the urban environment (for example between two neighborhoods characterized by different morphology and vegetation amounts). In the current study, we will address the classical urban–rural temperature difference as a city-scale UHI, while the intra-city (canyon–canyon) temperature difference will be interpreted as neighborhood-scale UHI. Figure 6a shows the evolution of the normalized UHI intensities satisfying this classification. By “normalized” we intend the measured value of the temperature difference divided by its maximum in the analyzed period. We use the normalized values to enhance the shape of the quantity’s evolution, highlighting the analogous evolution of the signals notwithstanding the different spatial scales involved in the computation. It is also worth noticing that while an inversion in the UHI intensity is observed computing the temperature difference with above-canopy urban temperatures, this behavior almost disappears with the in-canyons and between-canyons temperatures, highlighting again the high impact of the morphology and heat release from urban surfaces (buildings and street).
Refs. [55,56,57] have derived and proven a simple relation between the urban wind speed and the UHI intensity directly from the temperature equation
The advection term (first term of the right-hand side of the equation, hereafter RHS) is expressed with its scale values, where is the urban wind speed, is the urban temperature, is the rural temperature and 13,400 m is the city diameter. This term is responsible for the dissipation of the UHI due to the temperature advection and so can be interpreted as a cooling factor. The last term of the RHS of Equation (1) accounts for the divergence of the heat flux , and sustains the UHI slowing the cooling. As this last term is not always measured, ref. [56] parametrized its contribution in a simple attenuation factor K of the cooling term. Therefore, integrating Equation (1) considering only the first term of the RHS multiplied by K and using , we get
where is the initial temperature difference before the onset of the cooling, i.e., is the maximum temperature difference. The factor K ranges between 0 and 1. When K = 1 we are in the limiting case of = 0, while for K < 1 the diffusive heat flux retarding the night cooling process is taken into account. Figure 6b shows the dependency of the city and neighborhood-scales UHI intensity on velocity, with the solid lines retrieved using Equation (2). and K are extrapolated at = 0.5 ms−1 (activation threshold for cup and vane anemometers) fitting Equation (2) on the measured data for a fixed time = 6 h identified as the time of cooling between sunset and the nocturnal equilibrium (see Table 2).
Figure 6b clearly shows the UHI-intensity dependency on the urban wind speed, as suggested by Equation (2). Moreover, it highlights the similar behavior of the city and neighborhood-scale UHI. The different degree of dependency observed between the two scales of UHI can attributed to the smaller initial (and maximum) temperature difference measured at the neighborhood scale. Indeed, this evidence is quite expected as the temperature gradients within the same city should be constrained by the temperature diffusion within the urban environment. Conversely, the largely different land use of the countryside is expected to enlarge the temperature difference with the city, explaining the larger initial temperature observed in Figure 6b. The values of K also highlight the larger contribution of the heat flux divergence in the canyon-rural temperature cooling process, as the canopy environment tends to preserve the diurnal temperature more easily than the atmosphere above (leading to a smaller contribution of the heat flux divergence in the urban-rural temperature cooling process) due to the vicinity of multiple heat sources. The presence of vegetation in Laura Bassi St. does not impact on the heat fluxes contribution, but together with the larger aspect ratio of the canyon (with respect to Marconi St.), contributes to reduce the UHI intensity. This difference between the business-center canyon of Marconi St. and the vegetated-residential canyon of Laura Bassi St. is certified by the presence of a small UHI phenomenon between the two neighborhoods, due to the different cooling efficacy. The impact of the heat flux divergence is instead small as already observed for the city-scale UHI involving the canyons.
3.1.2. Canyon (Facade-Facade) Scale: The In-Canyon Thermal Circulation
As by the mere definition of temperature difference between two locations, a very local UHI effect can be observed also within an urban canopy, where a horizontal temperature gradient can establish between the opposite sides of the canyon (building façade to building façade). More precisely, this temperature gradient acts as the primary forcing of the in-canyon thermal circulation. As for the large scale UHI phenomenon previously discussed, this local phenomenon establishes a relationship between the in-canyon wind speed and the building façade temperature difference (evaluated using the east and west canyon-side building façades shown in Figure 5). Figure 7a shows the similar behavior of these two quantities, highlighting that a direct proportionality relates the temperature difference and the wind speed (while it was inverse at larger scales). While at larger scales the wind speed was a cooling factor, within the canopy the temperature difference forces the circulation. The following quadratic fit suits this in-canyon dependency between the building façade temperature difference from the thermographic data and the in-canyon wind speed measured at the ground level of each canyon
as displayed in Figure 7b. Fit parameters are reported in Table 3. Despite the clear dependency of the wind speed on the temperature difference, and hereby the importance of the thermal forcing in driving the in-canyon circulation, the presence of a non-negligible ambient wind speed measured above the canopy (as observed at the site SI and AS, Figure 6b) can be responsible to drive an additional inertial component within the canyon. In this scenario, the measured wind speed would be the sum of a thermally driven and an inertially driven component. While the inertial component is typically a fraction of the wind speed above the canopy, the thermal one requires a different parametrization.
As the thermally driven component must be a quadratic function of the temperature difference within the canyon (we must satisfy Equation (3) and the inertial component cannot by definition), we adopt the UHI convergence velocity [58,59] defined as
where is the gravitational acceleration, is the thermal expansion coefficient, is a length scale set equal to the canyon width, and is a constant computed by [58] from laboratory experiments and the similarity theory. Specifically, is given by the independency of of the Reynolds number (where in-canyon ground-level wind speed, is the mean canyon width, and is the kinematic viscosity of the air) evaluated comparing Equation (4) with , as done in Figure 8a. In our case, scaling the measured wind speed and evaluating its independency on the Reynolds number, we obtain different values of , named , equal to 0.13 and 0.32 for Laura Bassi St. and Marconi St., respectively. This discrepancy in the constant between the laboratory and the current investigation is associated with the inertial component of the wind speed, not accounted by Equation (4). To verify this hypothesis, we compute the total parametrized velocity as
where is the wind speed measured in Silvani Street. Equation (5) provides a good approximation of the in-canyon measured velocity, as shown in Figure 8a. The clear difference between the two canyons unveils the total absence of a diurnal evolution of the wind speed within Laura Bassi St., while in Marconi St. the behavior approaches the ambient wind dynamics. It is suggested that the presence of trees is such that the wind in the surface layer of the canopy (below the tree crown) is forced to remain small during the whole day, causing a decrease in the circulation intensity. Moreover, the presence of trees is a larger reduction factor for the inertial wind-speed component than the disadvantageous aspect ratio of Marconi St.
The different behavior of UHIs depending on the horizontal scale suggests a complex interaction between different areas of the same city, where different internal boundary layers (IBLs) may develop and interact with each other. Specifically, [60] proposed a conceptual model where the presence of “overlapping IBLs” is such that nearer the urban canopy there are spatially localized patches of flow in local equilibrium with the surface. This model suggested that atmospheric phenomena may be influenced by being confined in the same IBL or developed between different IBLs. Homogeneous conditions (as an isothermal atmosphere within the canopy, see Figure 5) defines a single IBL, which may develop gradients with the neighboring IBLs, leading to spatial heterogeneities. For this reason, the city and neighborhood scale UHIs are expected to behave similarly as they involve multiple IBLs (in the case of the city-scale UHI, the whole urban and rural boundary layers). Conversely, the façade-to-façade temperature difference occurs within a single IBL and, as such, it presents a different and unique interaction with the local flow field.
3.2. Canyon-Scale UHI and UPI Interaction
It has been documented that UHI and UPI, two major problems of the urban environment which are becoming more serious with rapid urbanization, can interact with each other, through their effect on the intensity of turbulence mixing and on radiation transfer processes [16]. This makes it necessary to study both effects concurrently. To establish a link between the thermal circulation and the pollutant concentrations measured in the Marconi St., we derived a parameterization for both quantities. In particular, the UHI convergence velocity toward an urban area was parameterized following the previously introduced Equation (4) using the value of 0.08 for the empirical constant C = 0.08 previously derived by [58] in laboratory experiments analyzing the horizontal radial convergence flow velocity in the presence of heated elements in a fluid. Implementing this parameterization for a street canyon, we considered the characteristic length scale of the UHI equal to the mean street canyon width, while the temperature difference causing the thermal circulation was considered that between the west and east building façades.
In the case of pollutant concentrations, we derived a normalization considering all the processes impacting on pollutant concentrations in a canyon, clearly depending first of all on the emission source rate but impacted by other atmospheric local processes. To derive a normalization for pollutant concentrations in an urban street canyon, we selected CO as a passive pollutant emitted by vehicle exhausts. As previously presented in [61], we then identified the key influencing factors on pollutant concentrations in an urban street canyon: (1) the source strength; (2) the canyon geometry, related to the dispersion volume and affecting the mass exchange between the canyon and the upper atmosphere; (3) the background wind velocity impinging on the canyon. A detailed explanation of the algorithm will be presented in [62], but briefly in analogy with [63], measured CO concentrations were normalized with a reference concentration CO* defined as
where is the pollutant source rate [g s−1], is the bulk velocity measured above the canyon, is the mean building height, and is the mean street canyon width. In particular, bulk velocity was derived from the measurements of the sonic anemometers placed on the rooftops in the two street canyons, while the mean building height and street canyon width were estimated from detailed digital maps of the two areas. An algorithm was instead developed to estimate the pollutant source rate. To this end, the traffic counts available as number of vehicles travelling in Marconi St. with a 5 min time resolution from inducive loops technology were classified upon fleet composition, i.e., fuel type (gasoline, diesel, LPG -Liquid Petroleum Gas-, CNG -Compressed Natural Gas-), vehicle type (motorcycle, light vehicles, heavy vehicles, buses) and EURO technology. The number of buses passing through Marconi St. was calculated from the bus time schedules in Bologna (Regional transport company TPER (Trasporto Passeggeri Emilia Romagna) [64]). The local fleet composition was then extracted from the regional inventory of circulating vehicles (Italian Car Club company (ACI, Automobile Club d’Italia) [65]) and was used to disaggregate the difference between the total traffic counts and the number of buses derived from bus schedules into traffic counts per vehicle type. Pollutant emission rates [g/km] were then finally estimated using the joint EMEP/EEA (European Monitoring and Evaluation Programme/European Environment Agency) air pollutant emission inventory guidebook for each vehicle category [66]. Finally, the pollutant source rate was estimated from pollutant emissions using a representative vehicle urban speed of 19 km h−1 [66].
Figure 9 presents the diurnal patterns of the thermal velocity and of normalized CO concentrations in Marconi and Laura Bassi St. during the summer UHI experiment.
Figure 9 shows very clearly the existence of a relationship between the UHI velocity and the pattern of normalized concentrations in Marconi St., whereas in Laura Bassi the thermal circulation is not directly related with the pollutant distribution, which is driven by other mechanisms owing to the presence of trees and to the different morphology of the neighborhood. It should be noted that although the good relationship between Ur and the normalized concentration may appear counter intuitive, it is a consequence of the fact that the presence of a temperature gradient between two opposite façades may lead to the establishment of an opposite vortex [67], which confines the primary vortex closest to the ground and diminish the vertical exchange. The establishment of this new vortex depends on the strength of the temperature gradient. If not so strong and of the order of 10 °C as in our case, we will see that the effect of the temperature gradient will be to deform the vortex and finally diminish its ability to remove pollutants from the near surface. Simulations performed in the following section will be used to prove this argument. The rise in normalized concentration observed at Laura Bassi St. at 3:00 (local time) is due to the normalization procedure that uses a reference concentration CO* (Equation (6)). Further, while traffic pollutant concentrations (CO, but also NOx) show generally lower nighttime values and a first peak during the morning rush hours, the normalization procedure involves calculating the ratio with the reference CO* estimated with the pollutant source rate and the bulk velocity (the other values in the equation are linked to geometric factors and as such are constant values). Average conditions at 3:00 were characterized by high bulk velocities and low pollutant source rates (as connected with the reduced transit of vehicles during nighttime), altogether resulting in a very low CO* value and therefore a sharp increase of the normalized CO/CO* concentration. The scatterplot (Figure 10) of normalized CO concentrations vs. UHI velocity in Marconi St. confirms the presence of a linear relationship between the two quantities, suggesting that the thermal circulation inside the street canyon may increase the pollutant concentrations at pedestrian level, a result in agreement with previous modeling studies by [68,69] and with the nighttime negative correlations between UPI and UHI obtained by [16]. Previous literature [70] showed the reverse effect, i.e., that haze pollution may contribute further to the UHI, confirming again the presence of an interaction between air pollution and the UHI phenomenon. The reduced magnitude of normalized concentrations in Marconi St. during the summer thermographic campaign is due to the fact that our normalization procedure successfully removes all other factors driving pollutant concentrations in the street canyon, i.e., the geometry of the canyon, the pollutant emissions and the bulk wind speed above the canyon. Therefore, our results show the existence of a relation between the thermal forcing exerted by UHI and pollutant concentrations in a street canyon. In the following section, the scaling for heat and concentration and the existence of a linear relationship between concentrations and the thermal circulation is verified with CFD simulations adequately set up.
Verification with CFD Simulations
In order to examine the results presented in the previous section, high resolution numerical CFD (Computational Fluid Dynamics) were carried out on an idealized street canyon with the same geometry as Marconi St. and considering the effect of temperature difference between building facades on the two sides of the street canyon.
The CFD code CD-adapco STAR-CCM+ 19.2 has been employed to solve the steady-state Reynolds-averaged Navier–Stokes (RANS) equations with a realizable k-ε turbulence model, similar to [71]. The buoyancy thermal effects have been considered in this work, as generated by the temperature differences between the building facades and air temperature. The effects related to radiation and material properties have been included in the temperature boundary conditions, that in our case were known from measurements. A detailed description of the model is available in the Appendix A.
The inflow wind profile has been calculated solving a two equations system using data from the two previously cited meteorological stations (Asinelli and Silvani), in order to obtain the friction velocity and the roughness length for each wind condition. The displacement height has been set equal to 1/3 of the street canyon medium height, i.e., 11 m for Marconi St. This approach highlights the relationship between wind direction and urban geometry.
The temperature boundary conditions were instead set using the street canyon façade temperatures measured during the summer thermographic campaigns, thoroughly described in the previous section. In particular, the differences between the following two cases are considered:
- 22/08/2018 12:00 (UTC+2)
- 22/08/2018 16:00 (UTC+2)
The velocity and temperature boundary conditions for these two cases are reported in Table 4.
The two cases shown in Table 4 are particularly interesting since the wind velocity magnitude is about the same, the wind direction is perpendicular to the canyon (coming from east) in both cases, but the temperature difference presents the opposite sign. Therefore, these two cases represent two opposite scenarios in terms of thermal boundary conditions. The numerical simulations are aimed to support the analysis and the results about the interaction between the UHI and the UPI obtained at street-canyon from the observations collected in the experimental campaign in Marconi St., presented in the previous section. For this reason, since the simulations refer to Marconi street where no tree is present, the role of trees is not considered in the setup of CFD simulations. Figure 11 and Figure 12 show the velocity vectors and CO concentration obtained in three street canyons with different aspect ratios, with case 1 and case 2 boundary conditions.
Considering a canyon with AR = 1 and comparing the two cases with opposite building temperature differences (Figure 11 and Figure 12a), we observe that the location of the vortex center slightly moves lower on the right. This explains the reduced CO concentration differences obtained in the two scenarios, for both the leeward side and the windward side.
Considering a canyon with AR equal to 1.65 and comparing the results obtained in the two cases with opposite temperature difference (Figure 11 and Figure 12b), we observe that the buoyancy-induced flow breaks the strong recirculating vortex. The wind flow structure within the canyon is very peculiar, still resulting in only one primary vortex but located far away from the ground. Indeed, an upward buoyancy flux opposes the downward airflow along the wall. As a result, the CO pollutant plume increases significantly its shape, above all in lower areas and especially along the windward side: overall, the pollutant dispersion is greatly reduced.
Finally, considering a canyon with AR equal to 2 and observing the results obtained in the two cases with opposite temperature difference (Figure 11 and Figure 12c), we can remark that the combination of thermal effects and buildings’ narrow shape creates a multiple vortex structure. When the windward wall and the ground are warmer than the air and the leeward-side, a weaker ground-level secondary recirculating vortex is easily recognizable near the windward side, right below the primary one. Indeed, the upward buoyancy flux strongly contrasts with the downward airflow along the wall, dividing the wind structure into two counter-rotating vortices, and in particular a clockwise top vortex and a reverse secondary vortex. In this scenario, the pollutant dispersion is enhanced with respect to the preceding scenario considering AR equal to 1.65, but still significantly reduced and worrying if compared to a regular canyon as in the first scenario, especially close to the ground along pedestrians’ walkways.
By considering the whole diurnal cycle for the cases AR equal to 1 and 2, respectively, a similar relation between Ur and CO/CO* as that derived in the previous section for AR equal to 1.65 and illustrated by Figure 9 and Figure 10 is obtained. Figure 13 shows the pattern of normalized CO concentrations obtained in the CFD simulations, as compared to the observed normalized concentrations. Also shown are the plots for the vortices for five times. As such, Equation (4) provides a simple model to describe how the temperature difference between building facades within the street canyon can drive the airflow dynamics and the shape of the vortices within the canyon and therefore the pollutant concentration.
4. Conclusions
In this paper, we have investigated the multiple scale nature of the UHI phenomenon and its impact on flow dynamics, and have derived a relationship between UHI and pollutant concentrations in a real urban environment. To this aim, two intensive experimental field campaigns were carried out in two urban street canyons in the city of Bologna characterized by a different presence of vegetation, i.e., one being a tree-free street canyon and one characterized by the presence of a tree line along both sides of the road.
The comparison of the air temperatures measured in the city within two intensive thermographic campaigns with those measured in the countryside revealed a UHI effect of roughly 6–7 °C; however, the comparison between the temperatures measured in the two canyons indicated on average 2 °C higher temperatures in the tree-free street canyon with respect to the vegetated canyon located in a residential area away from the city center, as an indication of the presence of local UHIs inside the urban texture owing to the different morphologies and presence of vegetation of the neighborhoods. Different UHI scales have been identified and their impact on the flow velocity is quantified. City (urban–rural) and neighborhood (canyon–canyon) scales share the same exponential decrease of the UHI intensity as a function of wind speed, confirming the existence of an internal UHI induced by morphology differences and vegetation presence between different areas of the city. A third local UHI effect (induced by opposite façade temperature difference within the same canyon) is instead identified as direct forcing of a local thermal circulation, quantified as the UHI convergence velocity. The different behaviors of UHIs depending on the horizontal scale is hypothetically attributed to the development of overlapping IBLs within the urban one. As soon as the UHI intensity is associated to different IBLs, their behavior will be similar to the urban–rural UHI where the “IBLs” are the urban and rural. Conversely, within the same IBL, temperature differences will most likely be a forcing for local thermal circulations.
Further, in order to examine the concurrent UHI and UPI phenomena, we derived the UHI convergence velocity resulting from the temperature difference between the west and east building façades in the non-vegetated canyon and a normalization for pollutant concentrations taking into account all key influencing factors, i.e., the emission source rate, canyon geometry, and background wind velocity. The analysis indicated the presence of a relationship between UHI and normalized concentrations, suggesting indeed an interaction between UHI and UPI phenomena, and in particular that the thermal circulation inside street canyons may be responsible of increasing the pollutant concentrations at pedestrian level.
The scaling adopted for the UHI convergence velocity was then verified by high resolution CFD simulations in an idealized street canyon considering two cases characterized by similar wind direction and intensity but opposite building temperature differences. CFD simulations demonstrated that the temperature difference between the building façades on the two sides of the canyons drives the airflow dynamics determining the position and shape of the vortices, definitely governing the pollutant concentrations in the street canyon.
Overall, the results of this work indicate that the positive role of mitigation solutions in reducing UHI effect may further extend to air pollution and therefore may be seen as an effective solution in mitigating two of the more pressing modern issues with important consequences on human health, therefore potentially greatly enhancing the sustainability of modern cities.
Author Contributions
Conceptualization, S.D.S.; methodology, S.D.S., F.B., E.B., B.P.; software, B.P.; validation, E.B., F.B., B.P.; formal analysis, F.B., E.B., B.P., S.D.S.; investigation, S.D.S., F.B., E.B., B.P.; resources, S.D.S.; data curation, F.B., E.B.; writing—original draft preparation, S.D.S., F.B., E.B., B.P.; writing—review and editing, S.D.S., F.B., E.B., B.P.; visualization, F.B., E.B.; supervision, S.D.S.; project administration, S.D.S.; funding acquisition, S.D.S. All authors have read and agreed to the published version of the manuscript.
Funding
This research was funded from the iSCAPE project by the European Union’s H2020 Research and Innovation program (H2020-SC5-04-2015), grant agreement No. 689954.
Acknowledgments
The authors would like to acknowledge Luca Torreggiani, Enrico Minguzzi, and Carla Barbieri from the ARPAE Environmental Protection Agency, Marianna Nardino from IBIMET-CNR, Marco Deserti from Regione Emilia Romagna, and Massimo Bacchetti and Francesca Di Nicola from the Department of Physics and Astronomy of the University of Bologna for their support in the realization of the Bologna experimental field campaigns; the Municipality of Bologna for granting permissions to conduct measurements in public spaces and for the traffic counts in the two urban street canyons; the CGIL (Confederazione Generale Italiana del Lavoro), Thomas Marcacci, Etienne Caldironi, and Vittorio Pulga for their kind license of the sites for the installation of the instrumental setup; TPER (Trasporto Passeggeri Emilia Romagna) and ACI (Automobile Club d’Italia) for data on buses transit and fleet composition available through their websites; and OpenStreet Map and contributors for providing the maps.
Conflicts of Interest
The authors declare no conflict of interest. The funders had no role in the design of the study; in the collection, analyses, or interpretation of data; in the writing of the manuscript, or in the decision to publish the results.
Appendix A
Here we provide the details of the setup of CFD simulations adopted in the present study to verify the scaling derived for the UHI convergence velocity. The transport equations for kinetic energy k and the turbulent dissipation rate ε are:
and
where u is the average velocity, μ is air dynamic viscosity, σk, σε, Cε1, and Cε2 are model coefficients, Pk and Pε are production terms, whose formulation depend on the k-ε model variant, f2 is a damping function that mimics the decrease of turbulent mixing near the walls, enforcing realizability, Sk and Sε are user specific source terms, ε0 is the ambient turbulent dissipation rate value in the source terms, Tε is the large-eddy time scale, and T0 the specific time-scale related to ambient turbulent source term. Mean flow, turbulence, energy, and dispersion equations were discretized using a second order scheme and the Semi-Implicit Method for Pressure Linked Equation (SIMPLE) scheme was used for pressure–velocity coupling.
The buoyancy forces have been considered under the Oberbeck–Boussinesq approximation, i.e., in the Navier–Stokes equation the mass density is constant in all the terms with the exception of the gravitational body force term. The local momentum balance equation then gives:
where the density ρ is assumed to be a function of temperature and pressure in accordance with the ideal gas law:
where R is the specific gas constant, , with R0 = 8314.4621 (J kmol K−1) and M is the gas molecular weight.
In this work, CO has been used as tracer, where the mass diffusion is computed as:
where D is the molecular diffusion coefficient for the pollutant in the mixture, is the turbulent viscosity, Y is the mass fraction of the pollutant, and ρ is the mixture density.
is the turbulent Schmidt number, where Dt is the turbulent diffusivity.
The pollutant sources have been simulated by separating volumes of section 0.5 m × 0.5 m. Four linear sources have been created in Marconi St.: two simulating the car traffic and two simulating the public bus traffic. In the main lateral crosspiece of Marconi St., Riva di Reno St., two linear sources for each canyon have been modelled to represent the car traffic emissions. The emissions rate (ER) was set using emissions previously derived with the methodology outlined in the previous section and by splitting the values equally into the linear sources.
Meteorological observations to set boundary conditions were obtained from two ARPAE meteorological stations on top of Asinelli’s tower and on the roof of ARPAE’s headquarter (Viale Silvani 6) (Figure 4 in the main text).
At the inflow boundary, vertical profiles for mean velocity U, turbulence kinetic energy k and turbulence dissipation rate ε of the neutrally stratified atmospheric boundary layer have been imposed, according to [72]:
where z is the vertical position above the ground [m], z0 the roughness length representative for the terrain windward the computational domain [m], u* the friction velocity [m s−1], k = 0.42 the van Karman constant, Cμ = 0.09, and δ is the height of the computational domain. A set of preliminary sensitivity tests have been performed, both for choosing the dimensions of the boxes used for refinements and for choosing the dimensions of the elements near the building walls. As shown in Figure A1, the mesh is built by three zones, each of which characterized by structured elements with homogeneous dimensions. The first zone is the external domain, with the coarsest elements, containing a box with elements with a medium size and another box surrounding the area and the street canyons, containing the finest elements.
Figure A1.
Example of mesh zones (a) and grid refinement near walls (b).
A geometry with a canyon having the same dimensions of canyon A has been used as a base geometry for the first part of the sensitivity tests. Table A1 shows the dimensions of the box containing the finest elements, the size of the elements, and the total number of N_cells in the computational domain. The numerical results have been shown to verify and to support the analysis and the results about the interaction between UHI and UPI at street canyon scale, obtained from the observations collected in the experimental field campaign previously presented. Since the CFD simulations refer to a street canyon where no tree is present (Marconi St.), the setup does not consider the effect of trees.

Table A1.
Comparison between temperatures measured in Marconi street (Texp) and those obtained by the Computational Fluid Dynamics (CFD) simulations (Tnum).
Table A1.
Comparison between temperatures measured in Marconi street (Texp) and those obtained by the Computational Fluid Dynamics (CFD) simulations (Tnum).
| Time (UTC +2) | Deviation (%) | ||
|---|---|---|---|
| 22/08—12.00 | 27.0 | 25.7 | 5 |
| 22/08—14.00 | 27.6 | 26.9 | 3 |
| 22/08—16.00 | 27.8 | 28.1 | 1 |
| 22/08—18.00 | 26.5 | 26.9 | 2 |
| 22/08—20.00 | 24.6 | 24.6 | 0 |
| 22/08—22.00 | 23.2 | 23.1 | 0 |
| 22/08—24.00 | 22.1 | 21.7 | 2 |
| 23/08—02.00 | 21.6 | 21.1 | 2 |
| 23/08—04.00 | 21.3 | 20.8 | 2 |
| 23/08—06.00 | 20.9 | 19.8 | 5 |
| 23/08—08.00 | 22.6 | 22.2 | 2 |
| 23/08—10.00 | 26.9 | 25.6 | 5 |
Five refinements have been compared, in the range N_cells = [0.250–6.181] millions of elements.
Figure A2 shows the normalized root mean square deviation obtained from a vertical line in the middle of the canyon, defined as
where x is the variable used for the comparison (velocity, CO concentration, or temperature), g1 and g2 are the grid number of two refinements, p is the point along a probe line where the comparison is made, and Np is the number of points in the probe line.
Figure A2.
Convergence tests results.
Figure A2 shows that the convergence is achieved for velocity, CO concentration, and temperature results.
A series of validation test has been performed by comparing the numerical results with experiments performed in Marconi street. Table A1 shows the comparison between experimental measurements and numerical results.
The deviation between the numerical results and measurements is then 1.4 °C, while the norm is 2.5 °C and the standard deviation is 0.7 °C.
Appendix B
This appendix provides a brief overview on the criteria we adopted to identify the atmospheric conditions suitable for the two intensive thermographic campaigns. After the identification of suitable periods from the regional synoptic charts provided from regional weather forecast service of the Regional Environmental Protection Agency (ARPAE), we analyzed the data recorded from the atmospheric soundings launched at San Pietro in Capofiume, located 20 km to the north-north-east of Bologna, to verify the absence of strong synoptic forcing and ensure the minimum criteria for the onset of the UHI with minimum synoptic perturbations. As from the soundings reported below, we were able to verify and check the fulfilment of our criteria in two consecutive days during both the summer and winter experimental campaign: wind speed at 700 hPa lower than 5 m s−1 and clear-sky conditions. The first sounding was meant to identify the day, while the second one to check the persistence of the required conditions within the experiment. Figure A3 and Figure A4 show the soundings for the summer and winter UHI experiment, respectively.
Figure A3.
Atmospheric soundings on skew-T diagram obtained at the 0000 UTC of 22 (a) and 23 (b) August 2017 at San Pietro in Capofiume, 20 km north-north-east from Bologna. Within each plot, the leftish black line represents the dew point, the rightish black line is the temperature while the arrows are the wind speed in knots following the Beaufort scale (Source: http://weather.uwyo.edu/upperair/sounding.html).
Figure A4.
Atmospheric soundings on skew-T diagram obtained at the 0000 UTC of 8 (a) and 9 (b) February 2018 at San Pietro in Capofiume, 20 km north-north-east from Bologna. Within each plot, the leftish black line represents the dew point, the rightish black line is the temperature while the arrows are the wind speed in knots following the Beaufort scale (Source: http://weather.uwyo.edu/upperair/sounding.html).

Within both periods, clear-sky conditions are observed through the absence of convective available potential energy and small amounts of condense and gaseous water, ensuring the absence of both convective and stratus clouds as well as precipitation. Only during the second night of the winter period, the convective available potential energy was not zero but small enough to ensure that no convective events would have developed during the following day. Wind speed in the lower troposphere (below 700 hPa) was always weak, reaching the 5 m s−1 only during the first night of the summer period.
Therefore, both periods satisfied the criteria of weak synoptic forcing suitable for the best characterization of the UHI within the summer and winter intensive thermographic campaigns.
References
- UN DESA (United Nations Department of Economic and Social Affairs). Revision of the World Urbanization Prospects, Population Division of the United Nations Department of Economic and Social Affairs. 2018. Available online: https://population.un.org/wup/ (accessed on 10 August 2020).
- Fan, C.; Myint, S.; Kaplan, S.; Middel, A.; Zheng, B.; Rahman, A.; Huang, H.P.; Brazel, A.; Blumberg, D.G. Understanding the impact of urbanization on surface urban heat islands—A longitudinal analysis of the oasis effect in subtropical desert cities. Remote Sens. 2017, 9, 672. [Google Scholar] [CrossRef] [Green Version]
- Li, Y.; Zhang, J.; Sailor, D.J.; Ban-Weiss, G.A. Effects of urbanization on regional meteorology and air quality in Southern California. Atmos. Chem. Phys. 2019, 19, 4439–4457. [Google Scholar] [CrossRef] [Green Version]
- Yang, L.; Qian, F.; Song, D.-X.; Zheng, J.-J. Research on urban heat island effect. Procedia Eng. 2016, 169, 11–18. [Google Scholar] [CrossRef]
- Mohajerani, A.; Bakaric, J.; Jeffrey-Bailey, T. The urban heat island effect, its causes, and mitigation, with reference to the thermal properties of asphalt concrete. J. Environ. Manag. 2017, 197, 522–538. [Google Scholar] [CrossRef]
- Grimm, N.B.; Faeth, S.H.; Golubieski, N.E.; Redman, C.L.; Wu, J.; Bai, X.; Briggs, J.M. Global change and the ecology of cities. Science 2008, 319, 756–760. [Google Scholar] [CrossRef] [Green Version]
- Meehl, G.A.; Tebaldi, C. More intense, more frequent, and longer lasting heat waves in the 21st century. Science 2004, 305, 994. [Google Scholar] [CrossRef] [Green Version]
- Luber, M.A.; McGeehin, M. Climate change and extreme heat events. Am. J. Prev. Med. 2008, 35, 429–435. [Google Scholar] [CrossRef]
- Stone, B.; Hess, J.J.; Frumkin, H. Urban form and extreme heat events: Are sprawling cities more vulnerable to climate change than compact cities. Environ. Health Perspect. 2010, 118, 1425–1428. [Google Scholar] [CrossRef] [Green Version]
- Basu, R.; Samet, J.M. Relation between elevated ambient temperature and mortality: A review of the epidemiological evidence. Epidemiol. Rev. 2002, 24, 190–202. [Google Scholar] [CrossRef]
- Doyon, B.; Belanger, D.; Gosselin, P. The potential impact of climate change on annual and seasonal mortality for three cities in Quebec, Canada. Int. J. Health Geogr. 2008, 7, 23. [Google Scholar] [CrossRef] [Green Version]
- Zhou, Y.; Gurney, K. A new methodology for quantifying on-site residential and commercial fossil fuel CO2 emissions at the building spatial scale and hourly time scale. Carbon Manag. 2010, 1, 45–56. [Google Scholar] [CrossRef] [Green Version]
- Moonen, P.; Defraeye, T.; Dorer, V.; Blocken, B.; Carmeliet, J. Urban physics: Effect of the micro-climate on comfort, health and energy demand. Front. Archit. Res. 2012, 1, 197–228. [Google Scholar] [CrossRef] [Green Version]
- Vahmani, P.; Sun, F.; Hall, A.; Ban-Weiss, G. Investigating the climate impacts of urbanization and the potential for cool roofs to counter future climate change in Southern California. Environ. Res. Lett. 2016, 11, 124027. [Google Scholar] [CrossRef]
- Garratt, J.R. The Atmospheric Boundary Layer; Houghton, J.T., Rycroft, M.J., Dessler, A.J., Eds.; Cambridge University Press: Cambridge, UK, 1994; pp. 15–38. [Google Scholar]
- Li, H.; Meier, F.; Lee, X.; Chakraborty, T.; Liu, J.; Schaap, M.; Sodoudi, M. Interaction between urban heat island and urban pollution island during summer in Berlin. Sci. Total Environ. 2018, 636, 818–828. [Google Scholar] [CrossRef]
- Morawska, L.; Chen, J.; Wang, T.; Zhu, T. Preface on air quality in China. Sci. Total Environ. 2017, 603–604, 26. [Google Scholar] [CrossRef]
- Qiu, G.; Song, R.; He, S. The aggravation of urban air quality deterioration due to urbanization, transportation and economic development—Panel models with marginal effect analyses across China. Sci. Total Environ. 2019, 651, 1114–1125. [Google Scholar] [CrossRef]
- Crutzen, P. New directions: The growing urban heat and pollution island effect-impact on chemistry and climate. Atmos. Environ. 2004, 38, 3539–3540. [Google Scholar] [CrossRef]
- Eckert, S.; Kohler, S. Urbanization and health in developing countries: A systematic review. World Health Popul. 2014, 15, 7–20. [Google Scholar] [CrossRef]
- Santamouris, M. Using cool pavements as a mitigation strategy to fight urban heat island—A review of the actual developments. Renew. Sustain. Energy Rev. 2013, 26, 224–240. [Google Scholar] [CrossRef]
- Mirzaei, P.A. Recent challenges in modeling of urban heat island. Sustain. Cities Soc. 2015, 19, 200–206. [Google Scholar] [CrossRef] [Green Version]
- Coutts, A.M.; White, E.C.; Tapper, N.J.; Beringer, J.; Livesley, S.J. Temperature and human thermal comfort effects of street. Theor. Appl. Climatol. 2016, 124, 55–68. [Google Scholar] [CrossRef]
- Bowler, D.E.; Buyung-Ali, L.; Knight, T.M.; Pullin, A.S. Urban greening to cool towns and cities: A systematic review of the empirical evidence. Landsc. Urban Plan. 2010, 97, 147–155. [Google Scholar] [CrossRef]
- Loughner, C.P.; Allen, D.J.; Zhang, D.-L.; Pickering, D.E.; Dickerson, R.R.; Landry, L. Roles of urban tree canopy and buildings in urban heat island effects: Parameterization and preliminary results. J. Appl. Meteorol. Clim. 2012, 51, 1775–1793. [Google Scholar] [CrossRef]
- Matthews, T.; Lo, A.Y.; Byrne, J.A. Reconceptualizing green infrastructure for climate change adaptation: Barriers to adoption and drivers for uptake by spatial planners. Landsc. Urban Plan. 2015, 138, 155–163. [Google Scholar] [CrossRef]
- Shashua-Bar, L.; Pealmutter, D.; Erell, E. The influence of trees and grass on outdoor thermal comfort in a hot-arid environment. Int. J. Climatol. 2010, 31, 1498–1506. [Google Scholar] [CrossRef]
- Taleghani, M. Outdoor thermal comfort by different heat mitigation strategies—A review. Renew. Sustain. Energy Rev. 2018, 81, 2011–2018. [Google Scholar] [CrossRef]
- Santamouris, M.; Ding, L.; Fiorito, F.; Oldfield, P.; Osmond, P.; Paolini, R.; Prasad, D.; Synnefa, A. Passive and active cooling for the built environment—Analysis and assessment of the cooling potential of mitigation technologies using performance data from 220 large scale projects. Sol. Energy 2017, 154, 14–33. [Google Scholar] [CrossRef]
- Salmond, J.A.; Williams, D.E.; Laing, G.; Kingham, S.; Dirks, K.; Longley, I.; Henshaw, G.S. The influence of vegetation on the horizontal and vertical distribution of pollutants in a street canyon. Sci. Total Environ. 2013, 443, 287–298. [Google Scholar] [CrossRef]
- Roy, S.; Byrne, J.; Pickering, C. A systematic quantitative review of urban tree benefits, costs, and assessment methods across cities in different climatic zones. Urban For. Urban Green. 2012, 11, 351–363. [Google Scholar] [CrossRef] [Green Version]
- Abhijth, K.V.; Kumar, P.; Gallagher, J.; McNabola, A.; Baldauf, R.; Pilla, F.; Broderick, B.; Di Sabatino, S.; Pulvirenti, B. Air pollution abatement performances of green infrastructure in open road and built-up street canyon environments—A review. Atmos. Environ. 2017, 162, 71–86. [Google Scholar] [CrossRef]
- Molnár, G.; Zénó, A.; Gál, T. Integration of an LCZ-based classification into WRF to assess the intra-urban temperature pattern under a heatwave period in Szeged, Hungary. Theor. Appl. Climatol. 2019, 138, 1139–1158. [Google Scholar] [CrossRef] [Green Version]
- Zonato, A.; Martilli, A.; Di Sabatino, S.; Zardi, D.; Giovannini, L. Evaluating the performance of a novel WUDAPT averaging technique to define urban morphology with mesoscale models. Urban Clim. 2020, 31, 100584. [Google Scholar] [CrossRef]
- Wang, Y.; Li, Y.; Di Sabatino, S.; Martilli, A.; Chan, P.W. Effects of anthropogenic heat due to air-conditioning systems on a extreme high temperature event in Hong Kong. Environ. Res. Lett. 2018, 13, 034015. [Google Scholar] [CrossRef]
- Santiago, J.L.; Krayenhoff, E.S.; Martilli, A. Flow simulations for simplified urban configurations with microscale distributions of surface thermal forcing. Urban Clim. 2014, 9, 285–295. [Google Scholar] [CrossRef]
- Wang, X.; Li, Y. Predicting urban heat island circulation using CFD. Build. Environ. 2016, 99, 82–97. [Google Scholar] [CrossRef]
- Maggiotto, G.; Buccolieri, R.; Santo, M.A.; Leo, L.S.; Di Sabatino, S. Validation of temperature-perturbation and CFD-based modeling for the prediction of the thermal urban environment: The Lecce case study. Environ. Model. Softw. 2014, 60, 223–229. [Google Scholar] [CrossRef]
- Zhao, J.; Liu, J.; Sun, J. Numerical simulation of the thermal environment of urban street canyon and a design strategy. Build. Simul. 2008, 1, 261–269. [Google Scholar] [CrossRef]
- De Lieto Vollaro, A.; De Simone, G.; Romagnoli, R.; Vallati, A.; Botillo, S. Numerical study of urban canyon microclimate related to geometrical parameters. Sustainability 2014, 6, 7894–7905. [Google Scholar] [CrossRef] [Green Version]
- Qaid, A.; Ossen, D.R. Effect of asymmetrical street aspect ratios on microclimates in hot, humid regions. Int. J. Biometeorol. 2015, 59, 657–677. [Google Scholar] [CrossRef]
- Dimitrova, R.; Sini, J.-F.; Richards, K.; Schaatzmann, M.; Weeks, M.; Perez García, E.; Borrego, C. Influence of thermal effects on the wind field within the urban environment. Bound. Layer Meteorol. 2009, 131, 223–243. [Google Scholar] [CrossRef]
- Park, S.-B.; Baik, J.-J.; Raasch, S.; Letzel, M.O. A Large-Eddy simulation study of thermal effects on turbulent flow and dispersion in and above a street canyon. J. Appl. Meteorol. Climatol. 2012, 51, 829–841. [Google Scholar] [CrossRef]
- Yaghoobian, N.; Kleissl, J. An improved three-dimensional simulation of the diurnally varying street-canyon flow. Bound. Layer Meteorol. 2014, 153, 251–276. [Google Scholar] [CrossRef]
- Oke, T.R. Boundary Layer Climates, 2nd ed.; 435 S; Taylor & Francis Ltd.: London, UK, 1987; ISBN 10:0415043190. [Google Scholar]
- Britter, R.E.; Hanna, S.R. Flow and dispersion in urban areas. Annu. Rev. Fluid Mech. 2003, 35, 469–496. [Google Scholar] [CrossRef]
- Grimmond, C.S.B.; Oke, T.R. Turbulent heat fluxes in urban areas: Observations and a local-scale urban meteorological parameterization scheme (LUMPS). J. Appl. Meteorol. 2002, 41, 792–810. [Google Scholar] [CrossRef] [Green Version]
- Di Sabatino, S.; Kastner-Klein, P.; Berkowicz, R.; Britter, R.E.; Fedorovich, E. The modelling of turbulence from traffic in urban dispersion models—Part I: Theoretical considerations. Environ. Fluid Mech. 2003, 3, 129–143. [Google Scholar] [CrossRef]
- Kastner-Klein, P.; Fedorovich, E.; Ketzel, M.; Berkowicz, R.; Britter, R. The modelling of turbulence from traffic in urban dispersion models—Part II: Evaluation against laboratory and full-scale concentration measurements in street canyons. Environ. Fluid Mech. 2003, 3, 145–172. [Google Scholar] [CrossRef]
- Finardi, S.; Silibello, C.; D’Allaura, A.; Radice, P. Analysis of pollutant exchange between the Po Valley and the surrounding European region. Urban Clim. 2014, 10, 682–702. [Google Scholar] [CrossRef]
- Ratti, C.; Di Sabatino, S.; Britter, R.E.; Brown, M.J.; Caton, F.; Burian, S. Analysis of 3-D urban databases with respect to air pollution dispersion for a number of European and American cities. Water Air Soil Pollut. Focus 2002, 2, 459–469. [Google Scholar] [CrossRef]
- Di Sabatino, S.; Leo, L.S.; Cataldo, R.; Ratti, C.; Britter, R.E. Construction of digital elevation models for a Southern European city and a comparative morphological analysis with respect to Northern European and North American cities. J. Appl. Meteorol. Climatol. 2010, 49, 1377–1396. [Google Scholar] [CrossRef]
- Pardyjak, E.R.; Stoll, R. Improving measurement technology for the design of sustainable cities. Meas. Sci. Technol. 2017, 28, 092001. [Google Scholar] [CrossRef]
- He, B.-J. Potentials of meteorological characteristics and synoptic conditions to mitigate urban heat island effects. Urban Clim. 2018, 24, 26–33. [Google Scholar] [CrossRef]
- Lee, T.-W.; Ho, A. Scaling of the urban heat island effect based on the energy balance. Nighttime minimum temperature increase vs urban length scale of Phoenix and Tucson, AZ, USA. Clim. Res. 2010, 42, 209–216. [Google Scholar] [CrossRef] [Green Version]
- Lee, T.-W.; Lee, J.Y.; Wang, Z.-H. Scaling of the urban heat island intensity using time-dependent energy balance. Urban Clim. 2012, 2, 16–24. [Google Scholar] [CrossRef] [Green Version]
- Lee, T.-W.; Choi, H.S.; Lee, J. Generalized scaling of urban heat island effect and its applications for energy consumption and renewable energy. Adv. Meteorol. 2014, 2014, 948306. [Google Scholar] [CrossRef] [Green Version]
- Leo, L.S.; Fernando, H.J.S.; Di Sabatino, S. Near-surface flow in complex terrain with coastal and urban influence. Environ. Fluid Mech. 2015, 15, 349–372. [Google Scholar] [CrossRef]
- Fernando, H.J.S. Fluid mechanics of urban atmospheres in complex terrain. Annu. Rev. Fluid Mech. 2010, 42, 365–389. [Google Scholar] [CrossRef]
- Barlow, J.F. Progress in observing and modelling the urban boundary layer. Urban Clim. 2014, 10, 216–240. [Google Scholar] [CrossRef] [Green Version]
- Barbano, F.; Brattich, E.; Di Sabatino, S. Characteristic length scales for turbulent exchange processes in a real urban canopy. Bound. Layer Meteorol. 2020, 1–24. [Google Scholar] [CrossRef]
- Di Sabatino, S.; Bacchetti, M.; Barbano, F.; Barbieri, C.; Brattich, E.; Cappelletti, D.; Deserti, M.; Drebs, A.; Minguzzi, E.; Nardino, M.; et al. Disentangling the effect of vegetation on ventilation and air quality in urban street canyons: The Bologna iSCAPE experimental campaigns. in preparation.
- Kubilay, A.; Neophytou, M.K.A.; Matsentides, S.; Loizou, M.; Carmeliet, J. The pollutant removal capacity of an urban street canyon and its link to the breathability and exchange velocity. Procedia Eng. 2017, 180, 443–451. [Google Scholar] [CrossRef]
- Bus Time Schedules for the City of Bologna. Available online: https://www.tper.it/orari (accessed on 30 October 2020). (In Italian).
- Regional Inventory of Circulating Vehicles in Italy. Available online: http://www.aci.it/laci/studi-e-ricerche/dati-e-statistiche/open-data.html (accessed on 30 October 2020). (In Italian).
- EEA (European Environment Agency) EMEP/EEA Air Pollutant Emission Inventory Guidebook 2016. 2017. Last Update June 2017. Available online: https://www.eea.europa.eu/themes/air/air-pollution-sources-1/emep-eea-air-pollutant-emission-inventory-guidebook (accessed on 10 August 2020).
- Pulvirenti, B.; Di Sabatino, S. CFD characterization of street canyon heating by solar radiation on building walls. In Proceedings of the HARMO 2017—18th International Conference on Harmonisation within Atmospheric Dispersion Modeling for Regulatory Purposes, Bologna, Italy, 9–12 October 2017; Hungarian Meteorological Service: Budapest, Hungary, 2017; pp. 902–906. [Google Scholar]
- Taha, H. Urban climates and heat islands: Albedo, evapotranspiration, and anthropogenic heat. Energy Build. 1997, 25, 99–103. [Google Scholar] [CrossRef] [Green Version]
- Taha, H. Meso-urban meteorological and photochemical modeling of heat island mitigation. Atmos. Environ. 2008, 42, 8795–8809. [Google Scholar] [CrossRef]
- Cao, C.; Lee, X.; Liu, S.; Schultz, N.; Xiao, W.; Zhang, M.; Zhao, L. Urban heat islands in China enhanced by haze pollution. Nat. Commun. 2016, 7, 1–7. [Google Scholar] [CrossRef] [PubMed]
- Kakoniti, A.; Georgiou, G.; Marakkos, K.; Kumar, P.; Neophytou, M.K.-A. The role of materials selection in the urban heat island effect in dry mid-latitude climates. Environ. Fluid Mech. 2015, 16, 347–371. [Google Scholar] [CrossRef]
- Di Sabatino, S.; Buccolieri, R.; Pulvirenti, B.; Britter, R. Simulations of pollutant dispersion within idealised urban-type geometries with CFD and integral models. Atmos. Environ. 2007, 41, 8316–8329. [Google Scholar] [CrossRef]
Figure 1.
Map showing the location of the city of Bologna in Italy (red dot) (source: Esri, Garmin, USGS -United States Geological Survey-, NPS-National Park Service-).
Figure 1.
Map showing the location of the city of Bologna in Italy (red dot) (source: Esri, Garmin, USGS -United States Geological Survey-, NPS-National Park Service-).
Figure 2.
Street canyons views and details (W = mean street width, H = mean street height, α = orientation angle of the street canyon with respect to the meteorological north, LTZ = Limited Traffic Zone) of the two street canyons in Bologna: (a) Marconi St.; (b) Laura Bassi St. (source: Google Earth).
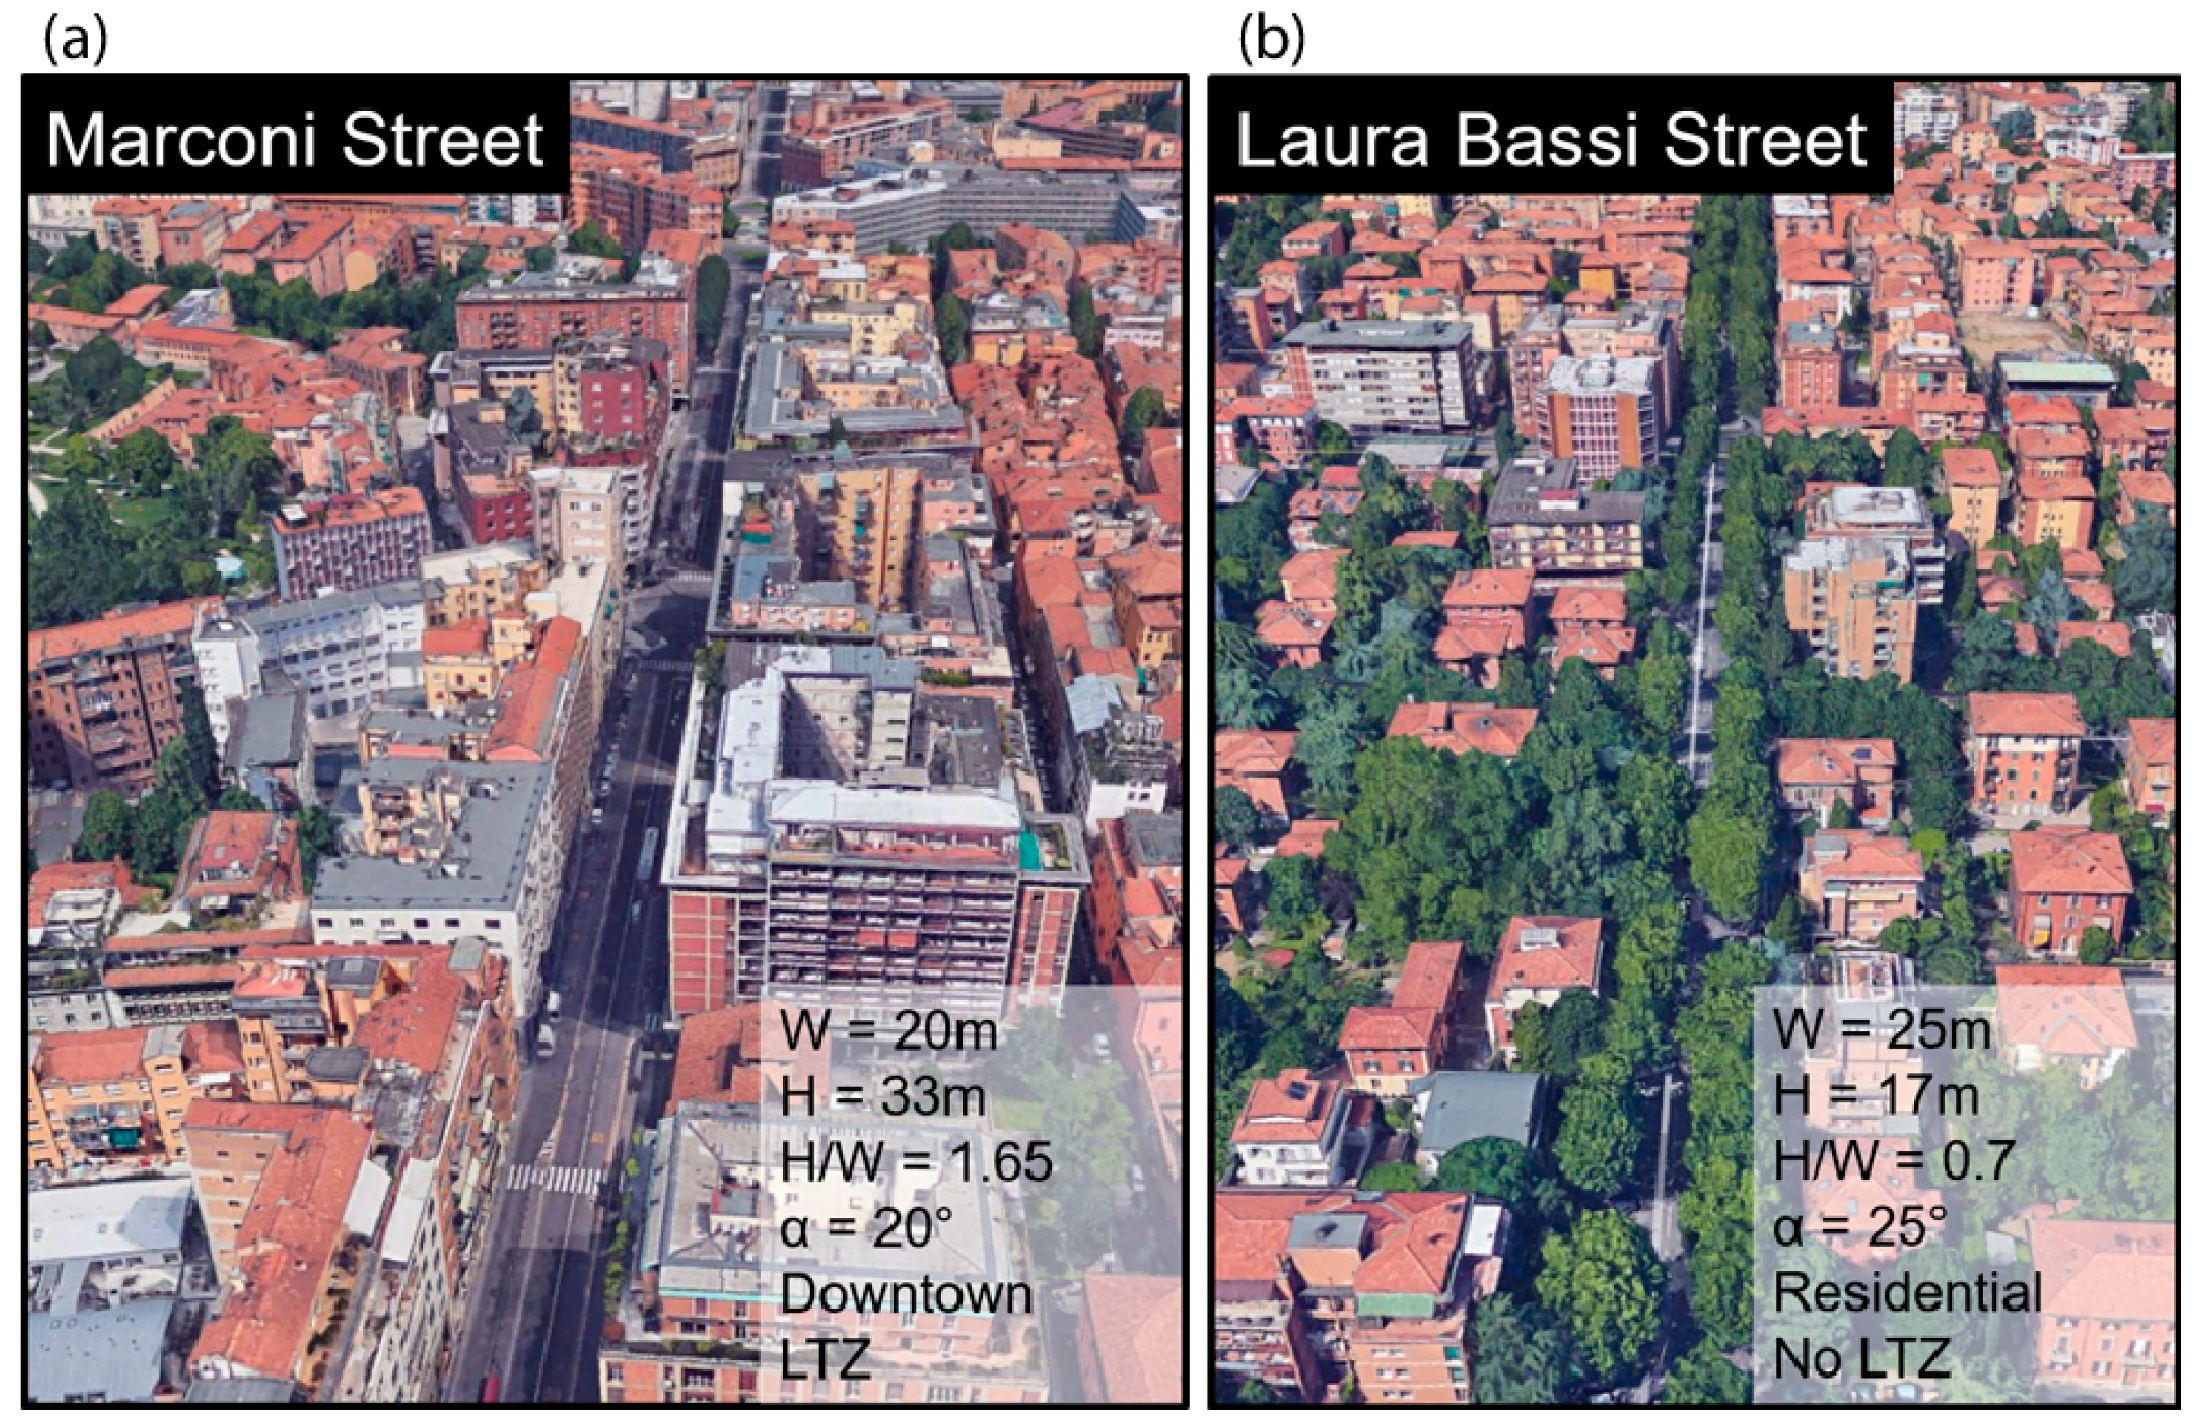
Figure 3.
Monitoring sites network for the Bologna experimental campaigns (source: Google Earth).
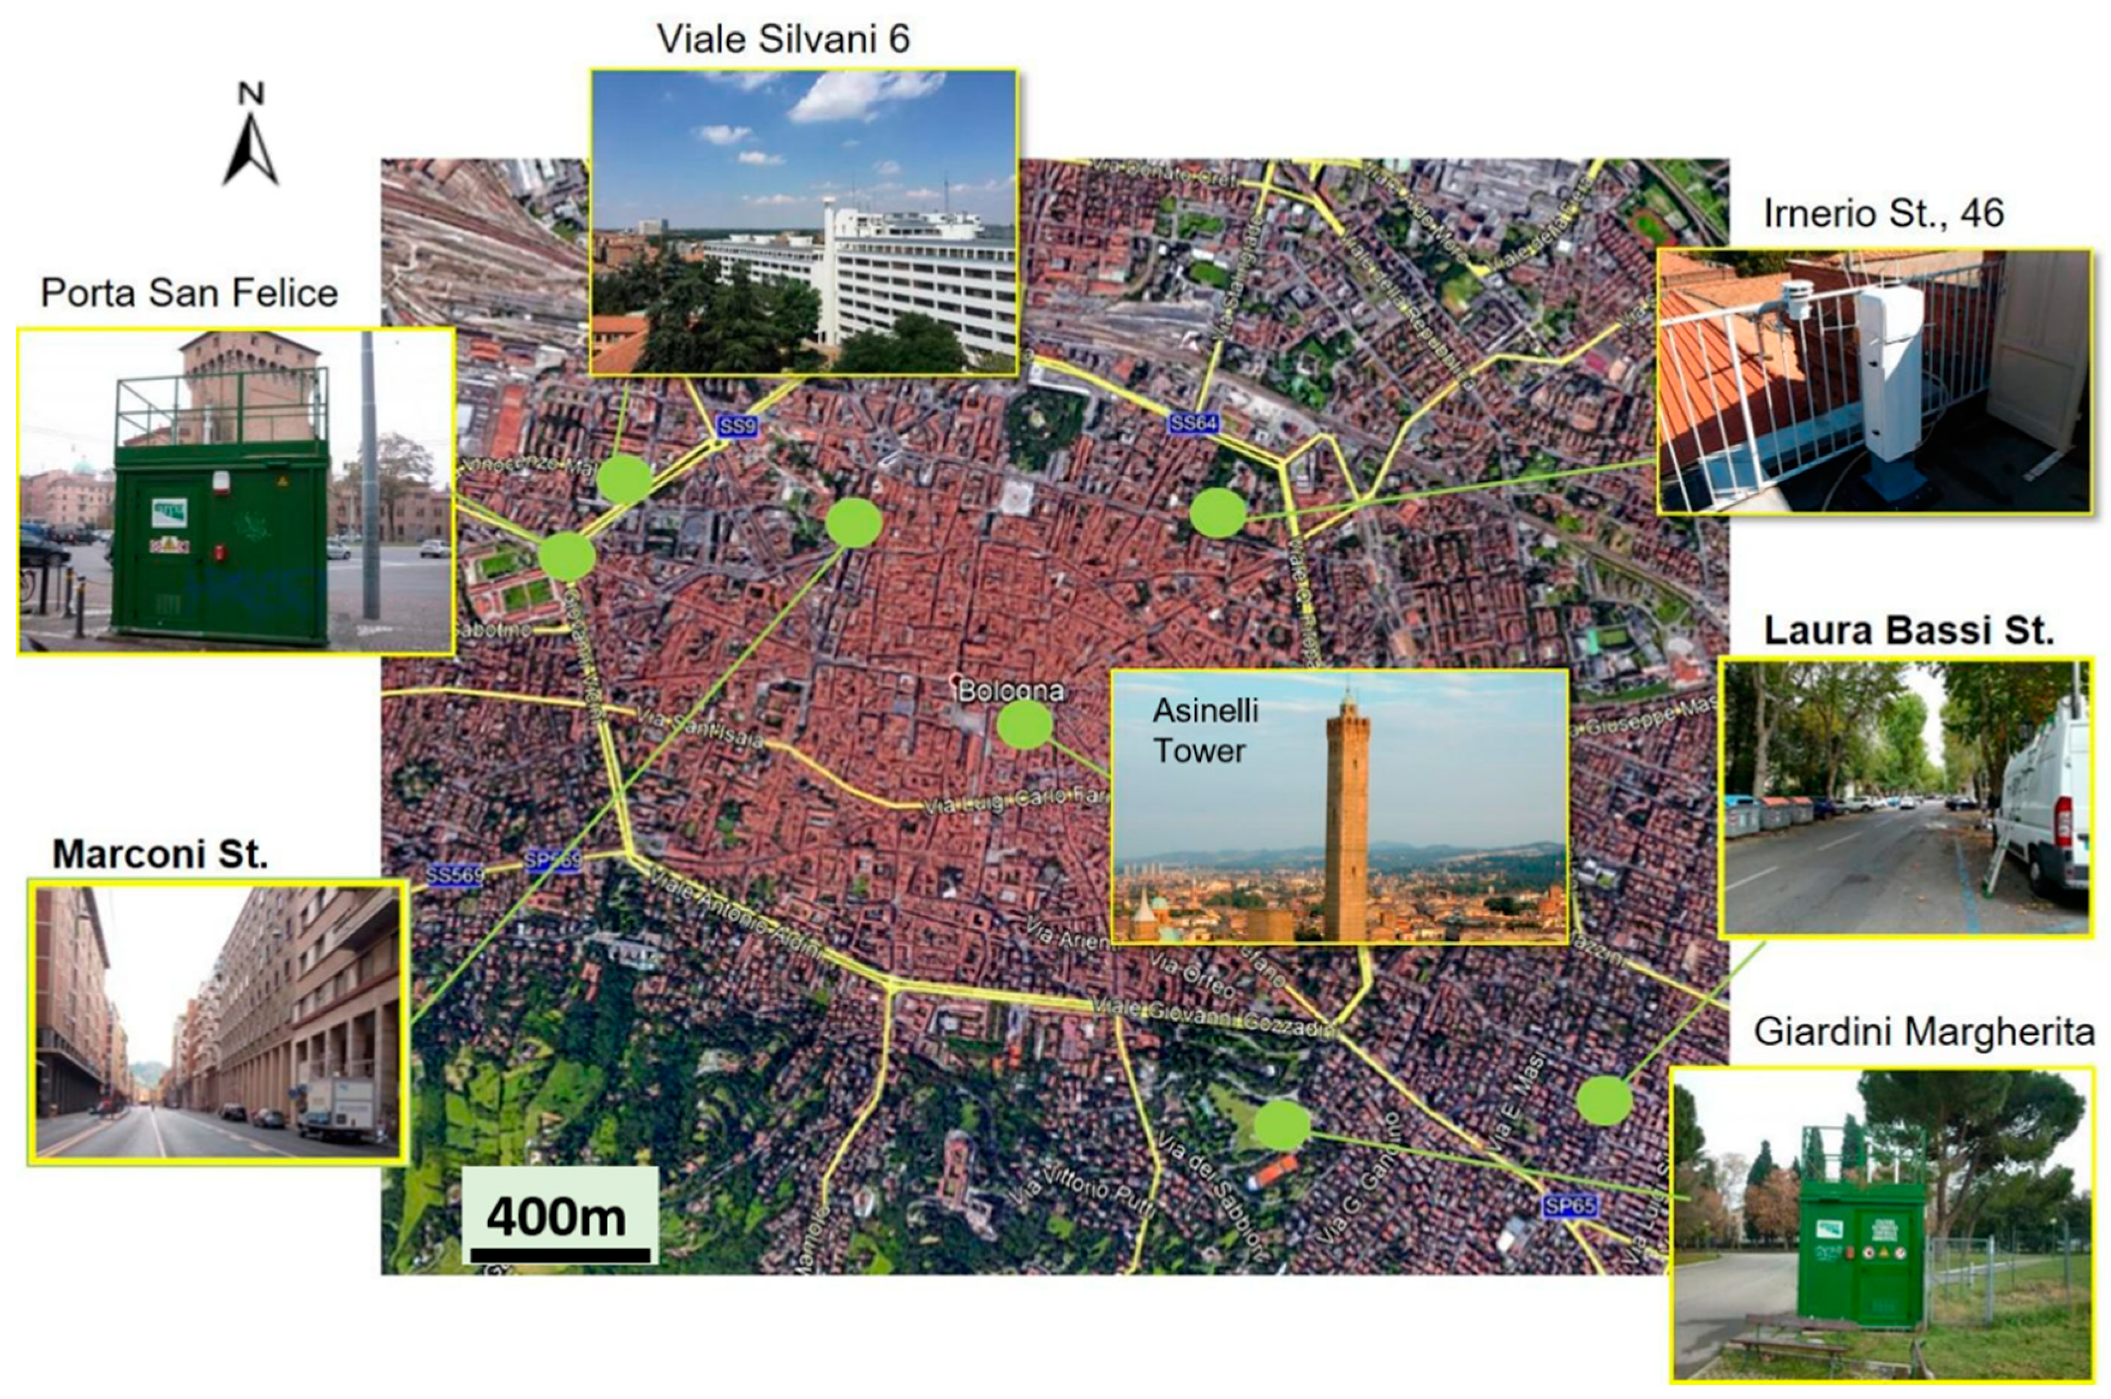
Figure 4.
Positions of the monitoring sites (blue dots) and of the locations chosen for the temperature measurements of the building façades and of the ground surface during the two intensive thermographic campaigns in the two street canyons in Bologna (numbers within the red circles): (a) Marconi St. and (b) Laura Bassi St. (source: OpenStreet Map).
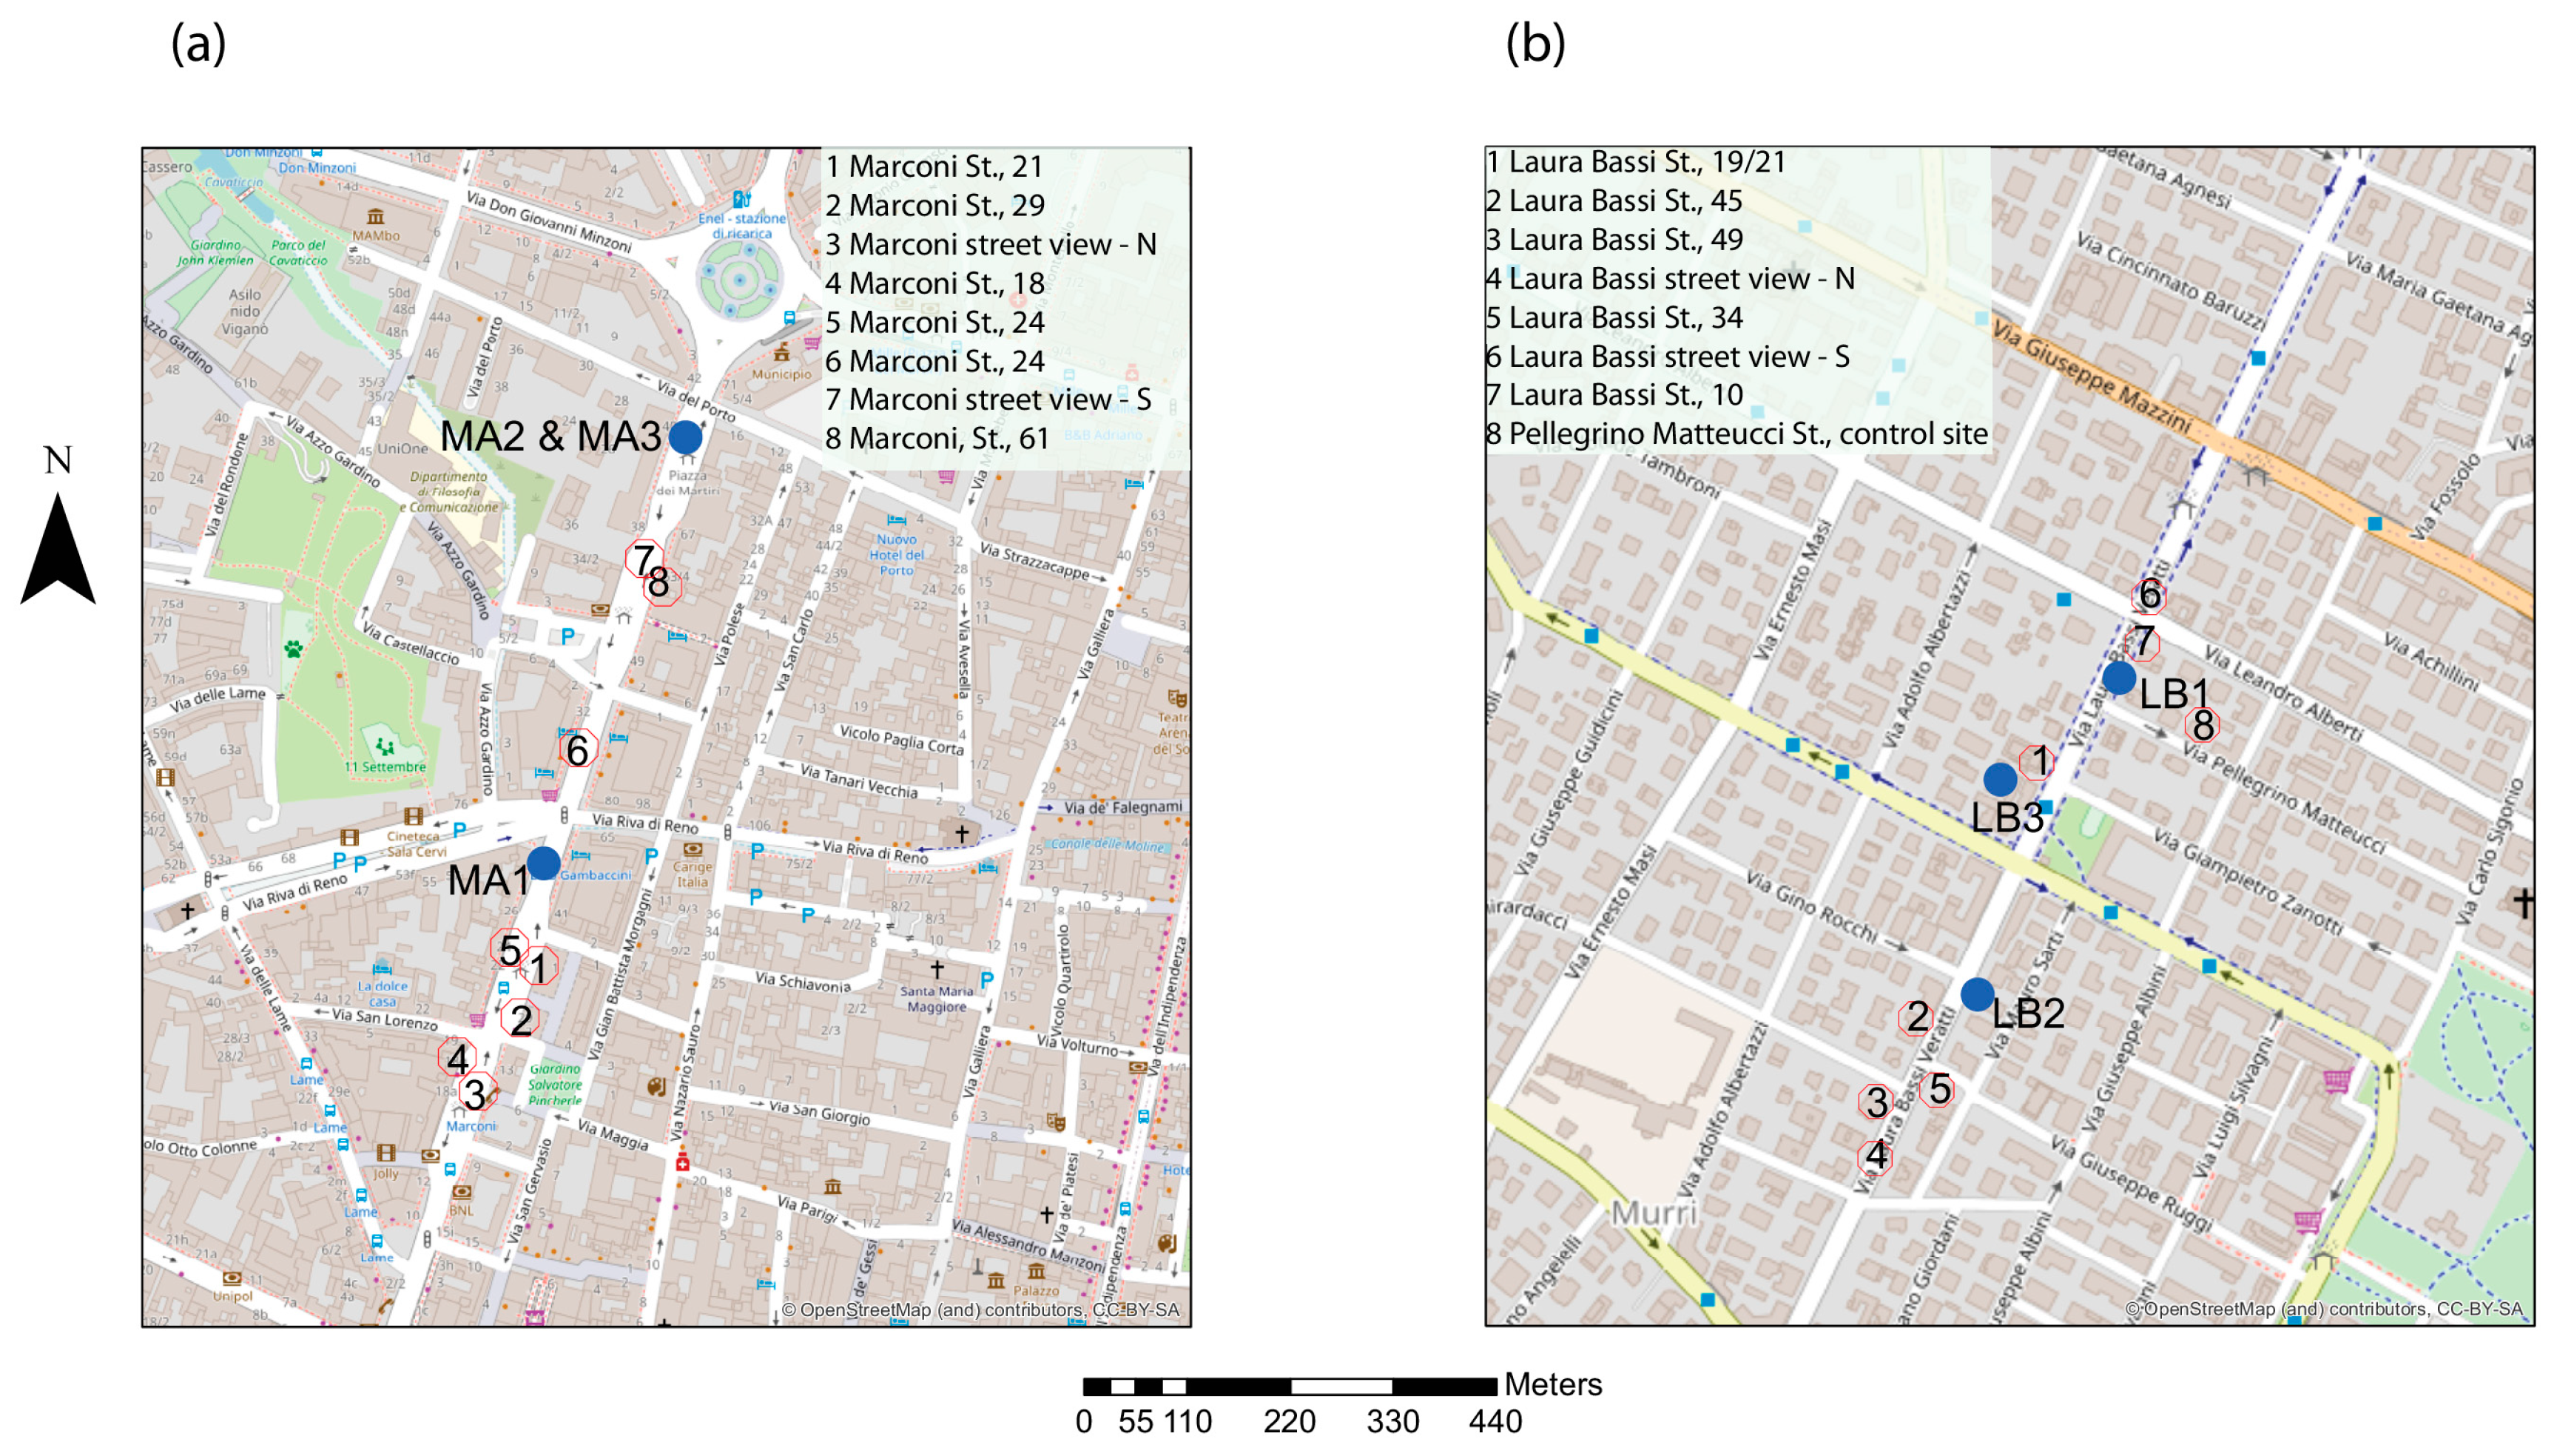
Figure 5.
Temperature evolution within the day of the summer (22–23 August 2017) (a) and winter (8–9 February 2018) (b) intensive thermographic campaign in the two street canyons in Bologna (Marconi St. on the left and Laura Bassi St. on the right), measured by the thermo-hygrometers located at ground and mid-level (respectively site 1 and 2), the Agenzia Regionale per la Prevenzione, l’Ambiente e l’Energia dell’Emilia-Romagna (ARPAE) instrumentation in one rural meteorological station (MZ) and of building façades of buildings located on the west and east side of the two street canyons as retrieved from the thermal images acquired with the two thermal cameras.
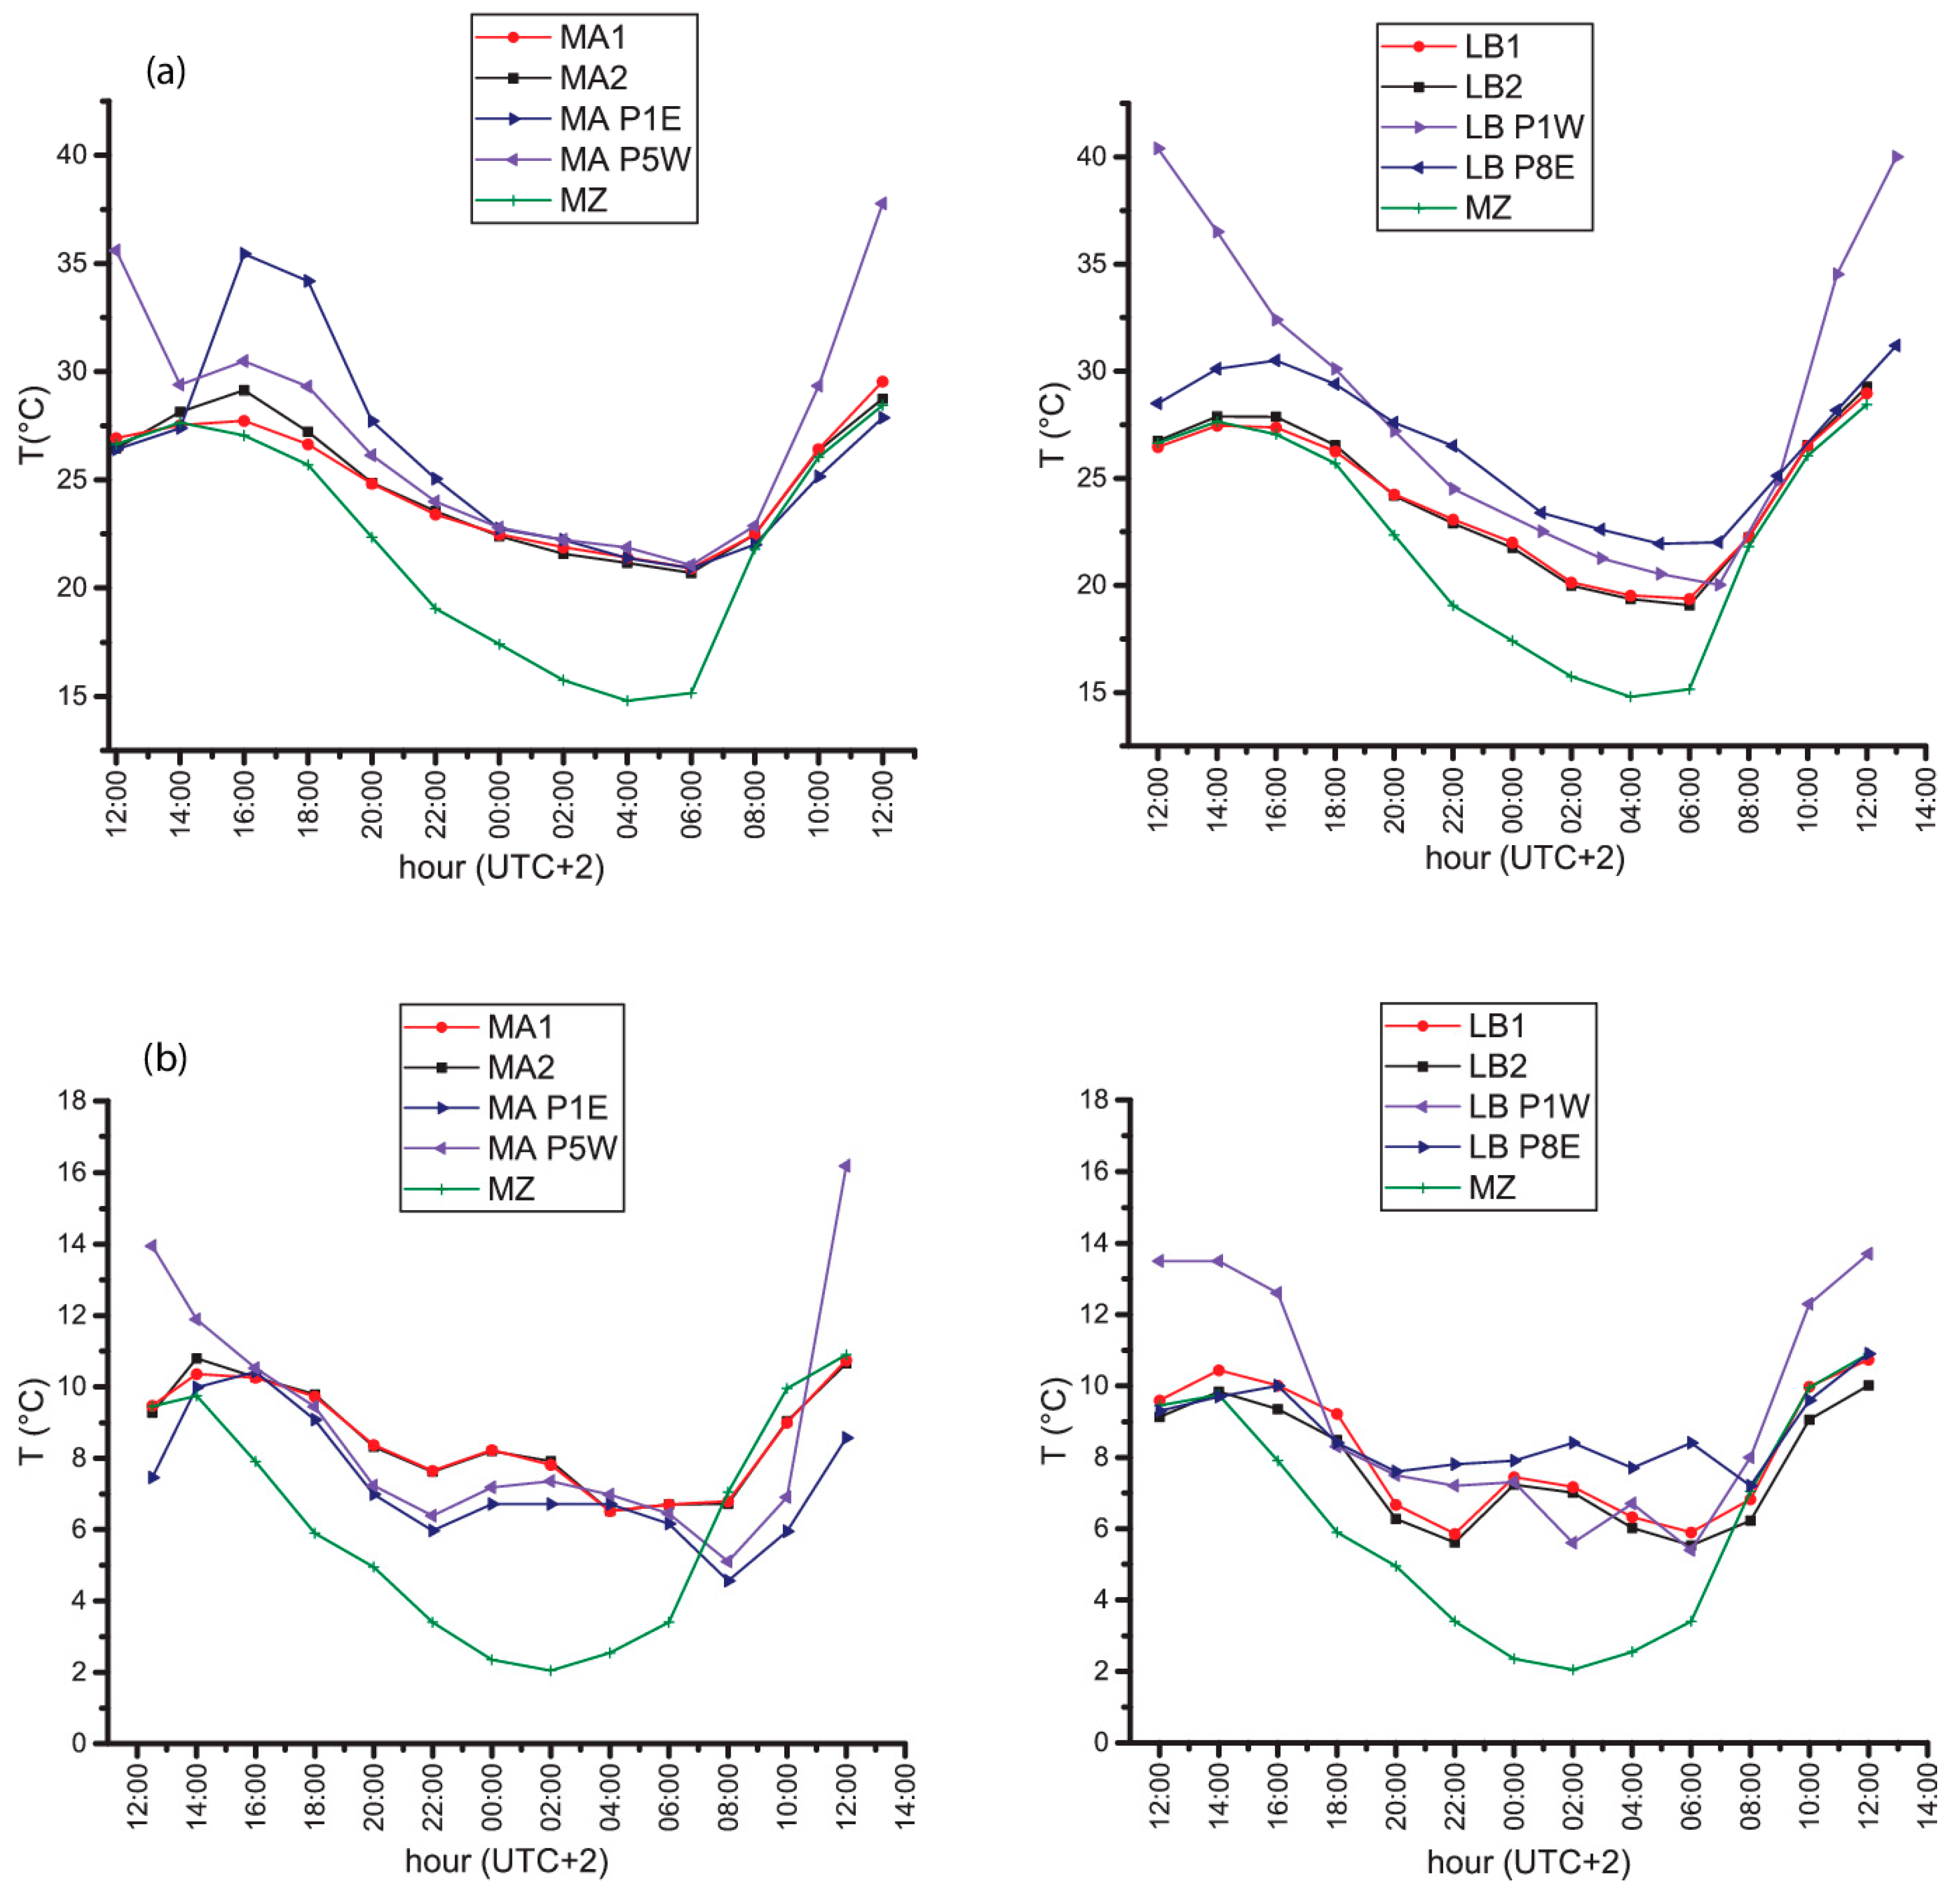
Figure 6.
(a) Normalized UHI intensity (solid lines) evolution within the day of the summer intensive thermographic campaign in Bologna (22–23 August 2017). The shadowed region defines the nocturnal period between sunset (2000 UTC) and sunrise (0630 UTC). (b) UHI intensity as a function of the wind speed. Different locations are compared. City scale UHI is shown with full circles, neighborhood scale UHI with full triangles.

Figure 7.
(a) Urban Heat Island (UHI) intensity from building façade temperature difference (solid lines) and in-canyon wind speed (dashed lines) evolution within the day of the summer intensive thermographic campaign in Bologna (22–23 August 2017). The shadowed region defines the nocturnal period between sunset (2000 UTC) and sunrise (0630 UTC). (b) UHI intensity from building façade temperature difference as a function of the in-canyon wind speed measured at the ground levels of each canyon.
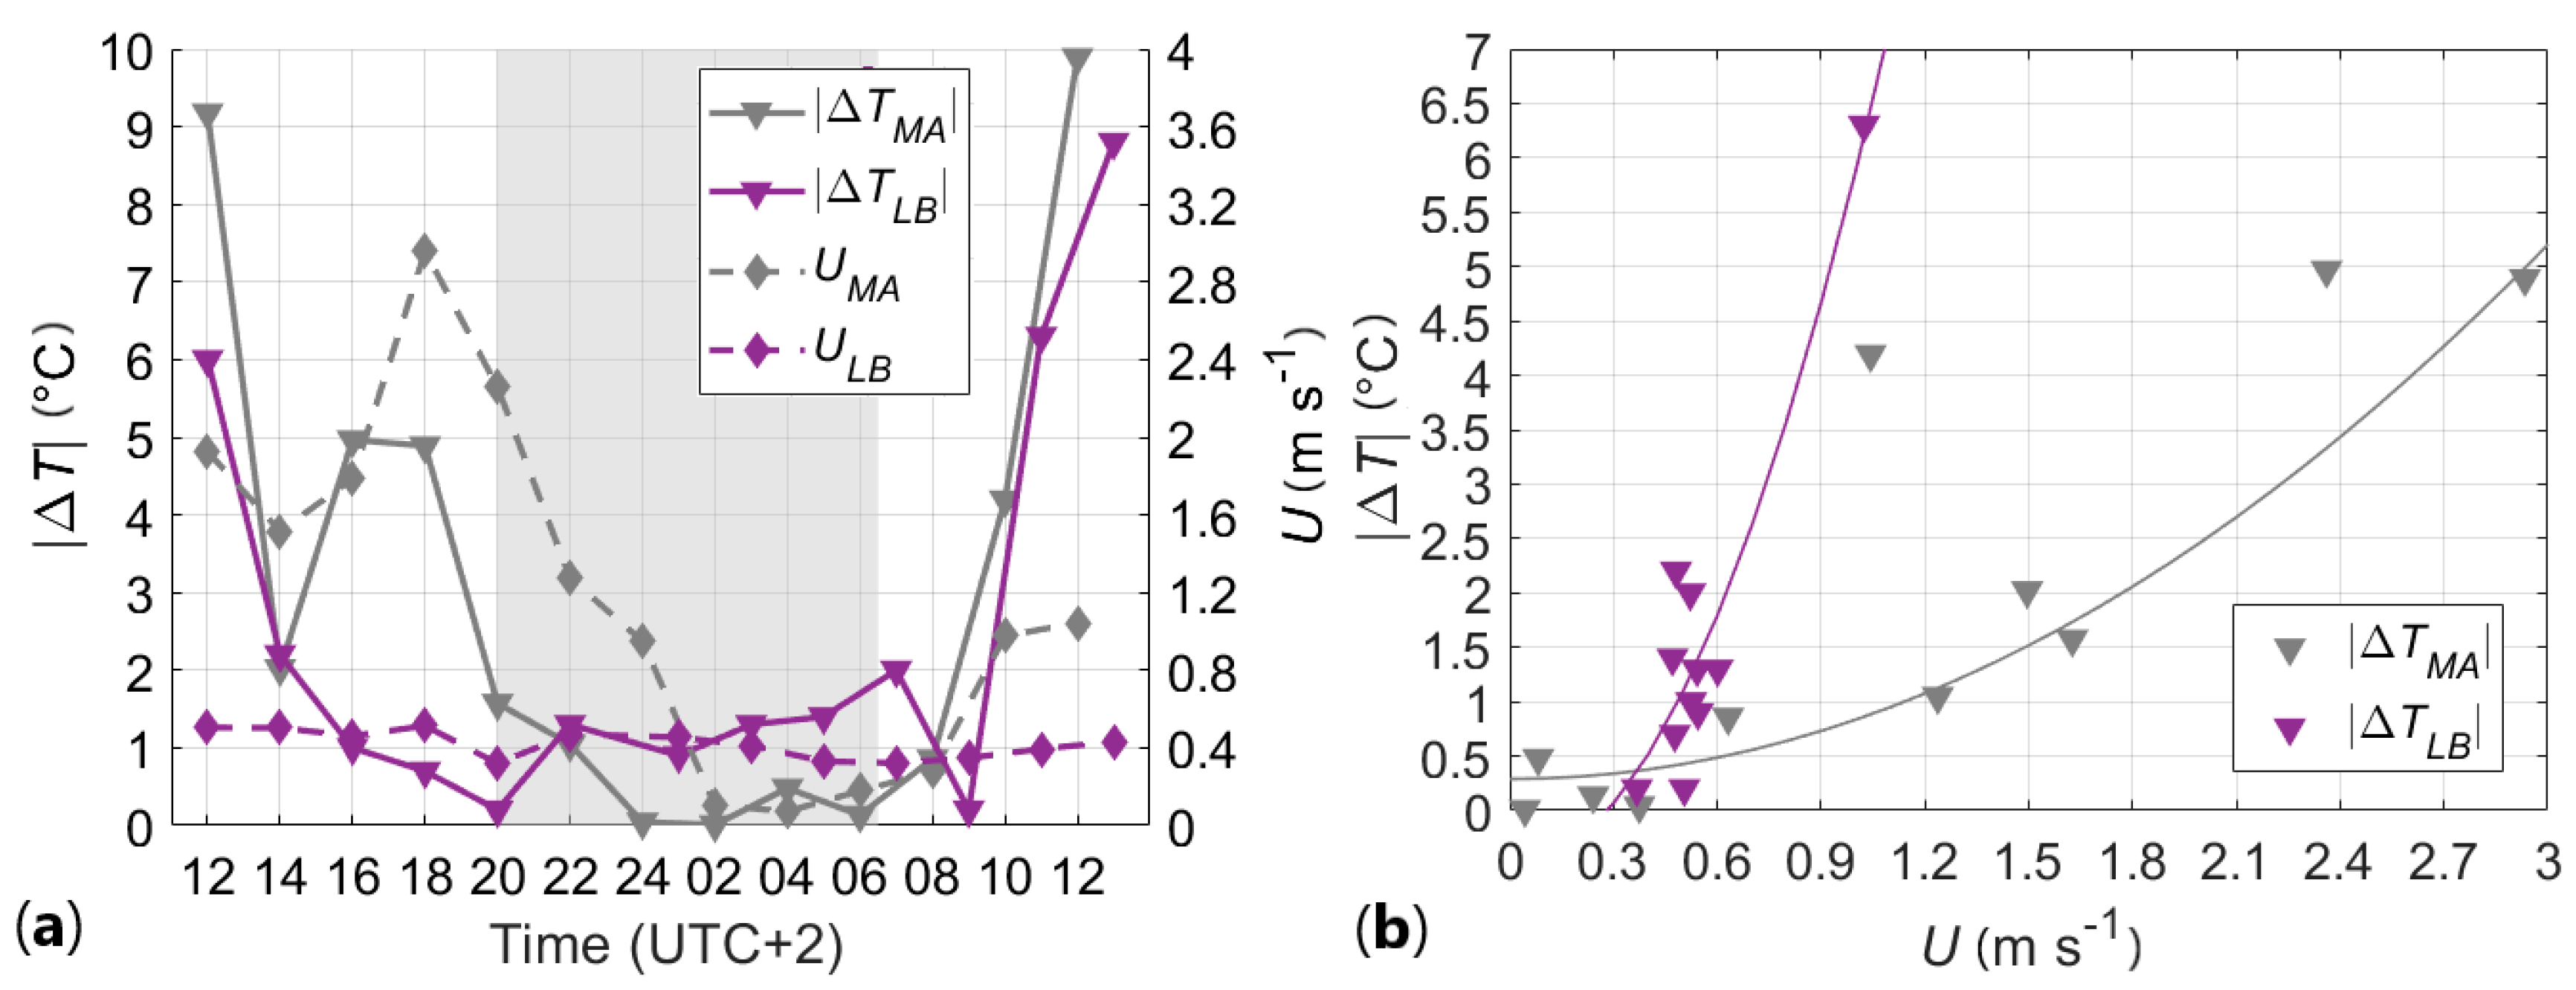
Figure 8.
(a) Normalized UHI convergence velocity as a function of the Reynolds number. (b) Comparison of the total parametrized velocity (dashed lines with diamonds) with the measured wind speed (dotted lines with pentagrams) within the canyons. The shadowed region defines the nocturnal period between sunset (2000 UTC) and sunrise (0630 UTC).

Figure 9.
Diurnal pattern of the thermal circulation velocity and of normalized CO concentrations in (a) Marconi St. and in (b) Laura Bassi St. during the summer intensive thermographic campaign.
Figure 9.
Diurnal pattern of the thermal circulation velocity and of normalized CO concentrations in (a) Marconi St. and in (b) Laura Bassi St. during the summer intensive thermographic campaign.

Figure 10.
Scatterplot of normalized concentrations vs. thermal circulation velocity in Marconi St. during the summer intensive thermographic campaign.
Figure 10.
Scatterplot of normalized concentrations vs. thermal circulation velocity in Marconi St. during the summer intensive thermographic campaign.
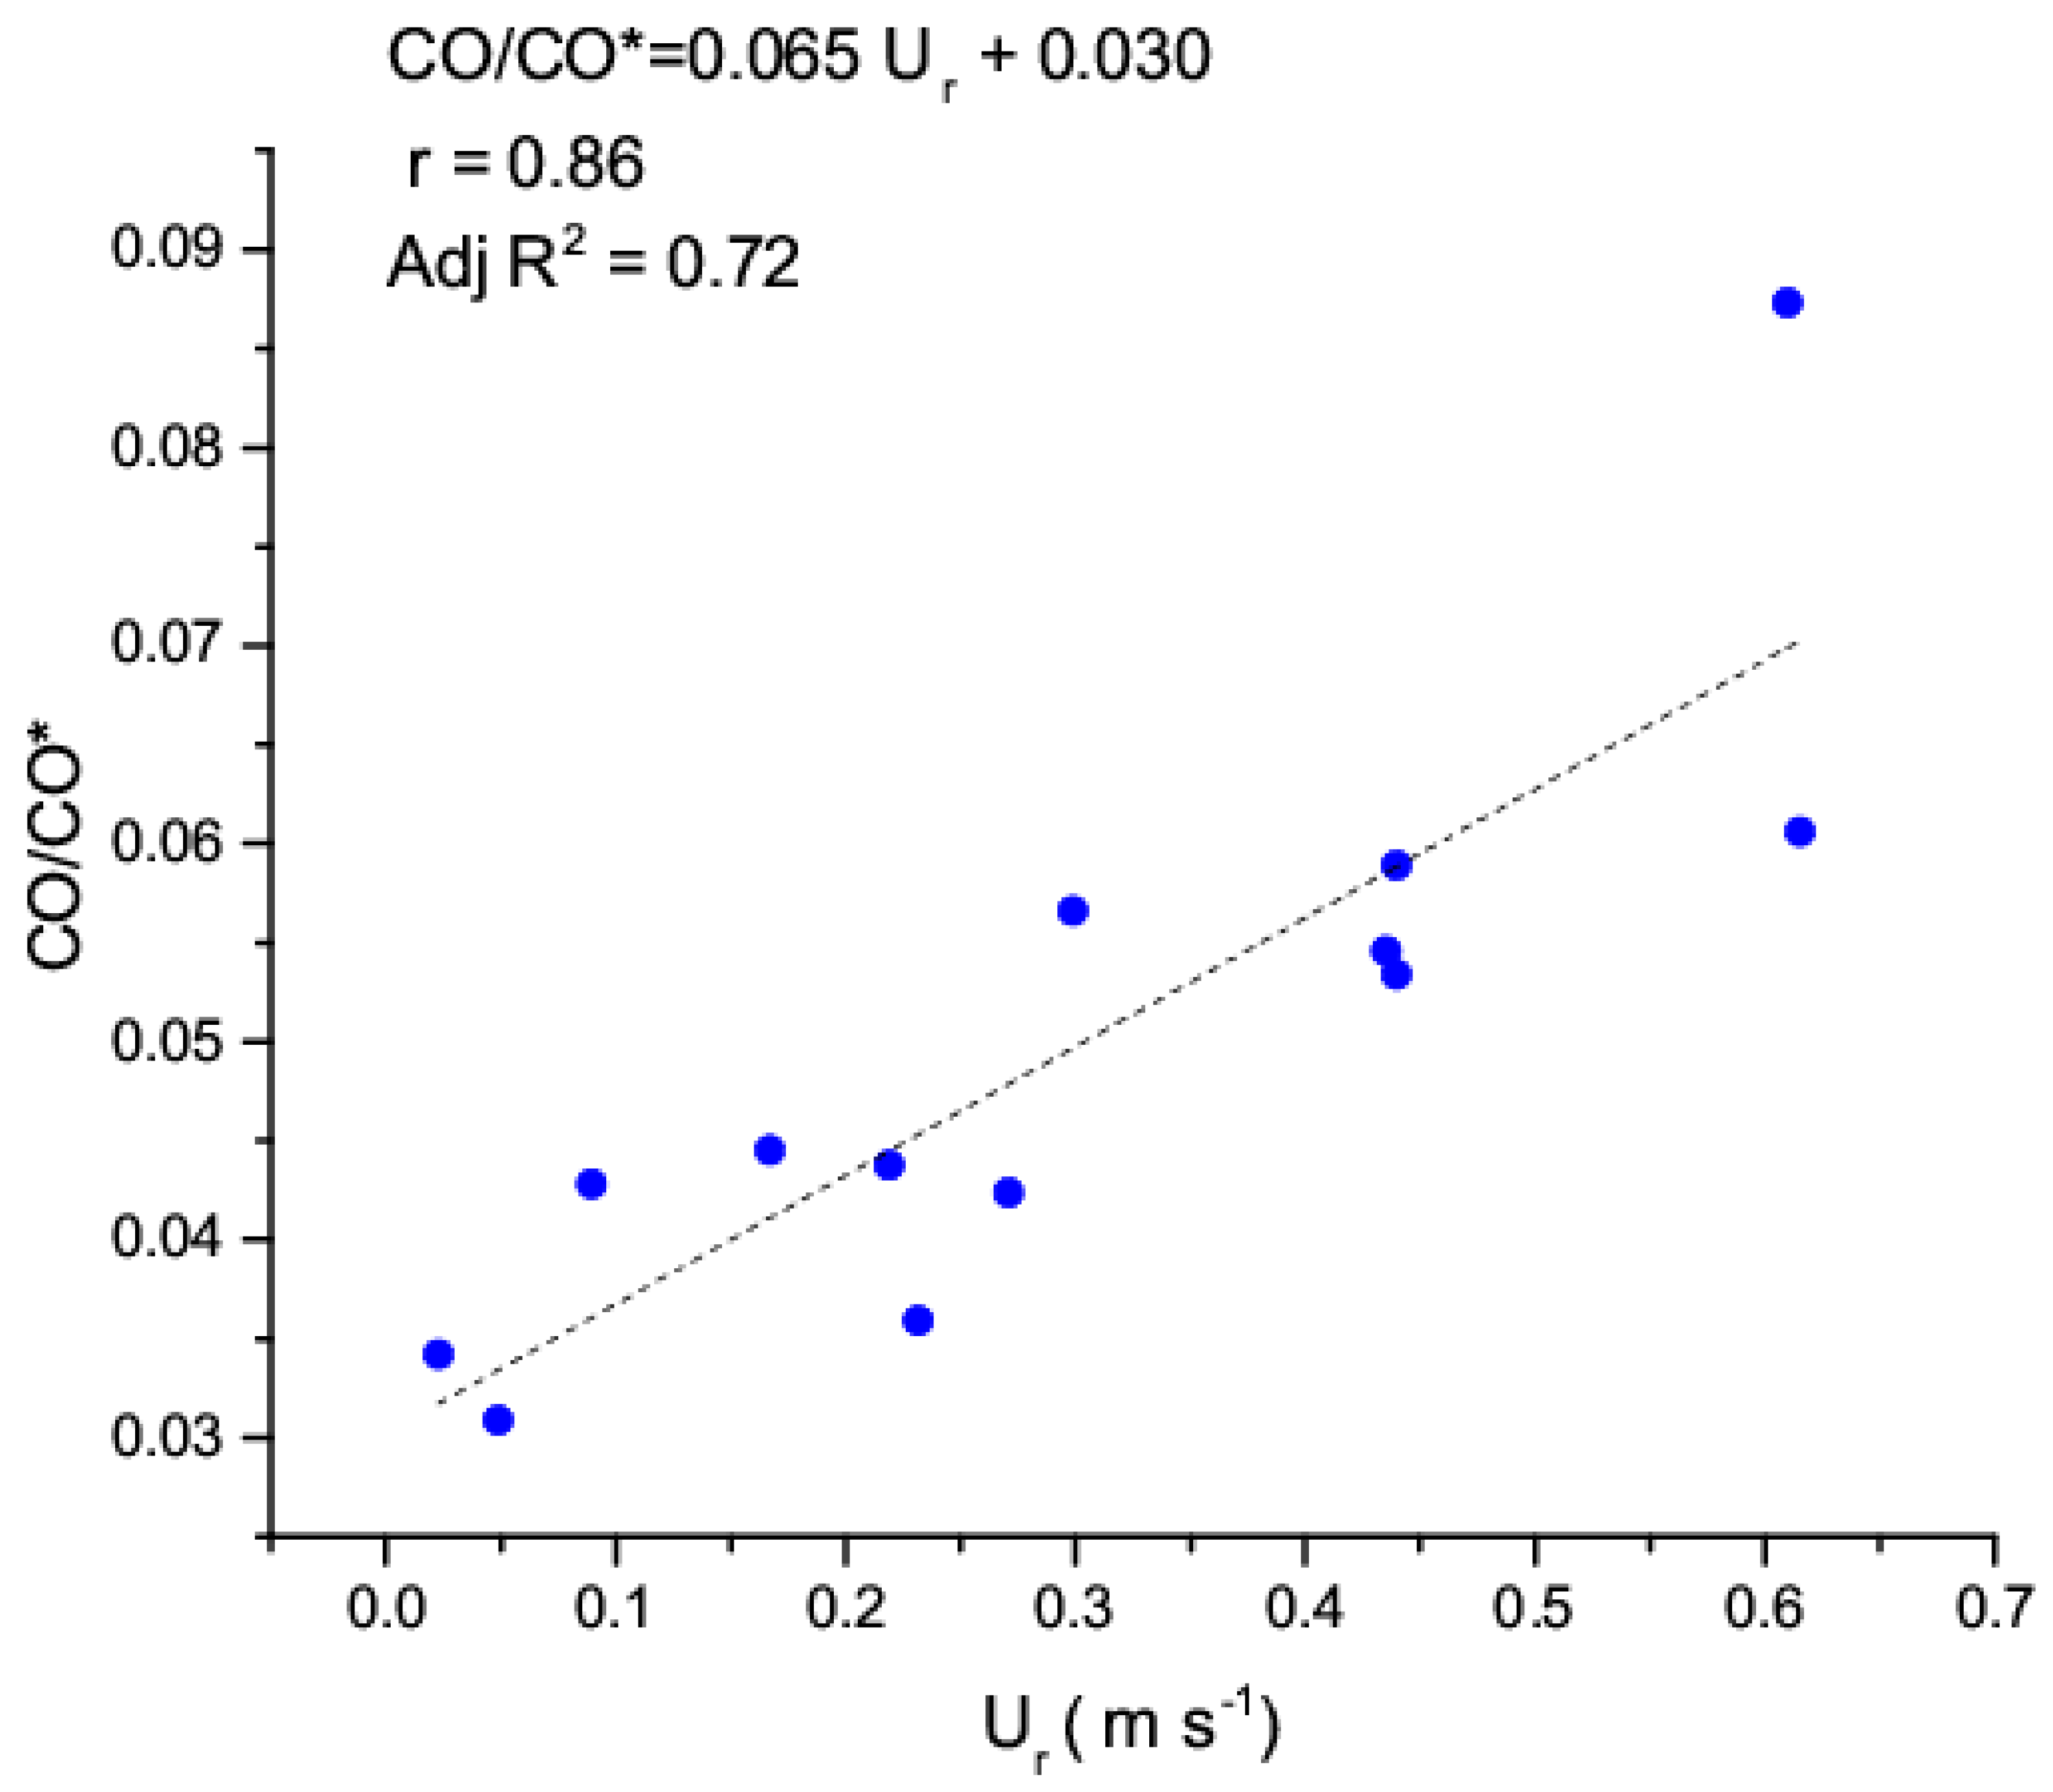
Figure 11.
Velocity vectors obtained in the two cases within a street canyon with aspect ratio 1 (a), 1.65 (b) and 2 (c). Case 1 (top) and Case 2 (bottom).
Figure 11.
Velocity vectors obtained in the two cases within a street canyon with aspect ratio 1 (a), 1.65 (b) and 2 (c). Case 1 (top) and Case 2 (bottom).
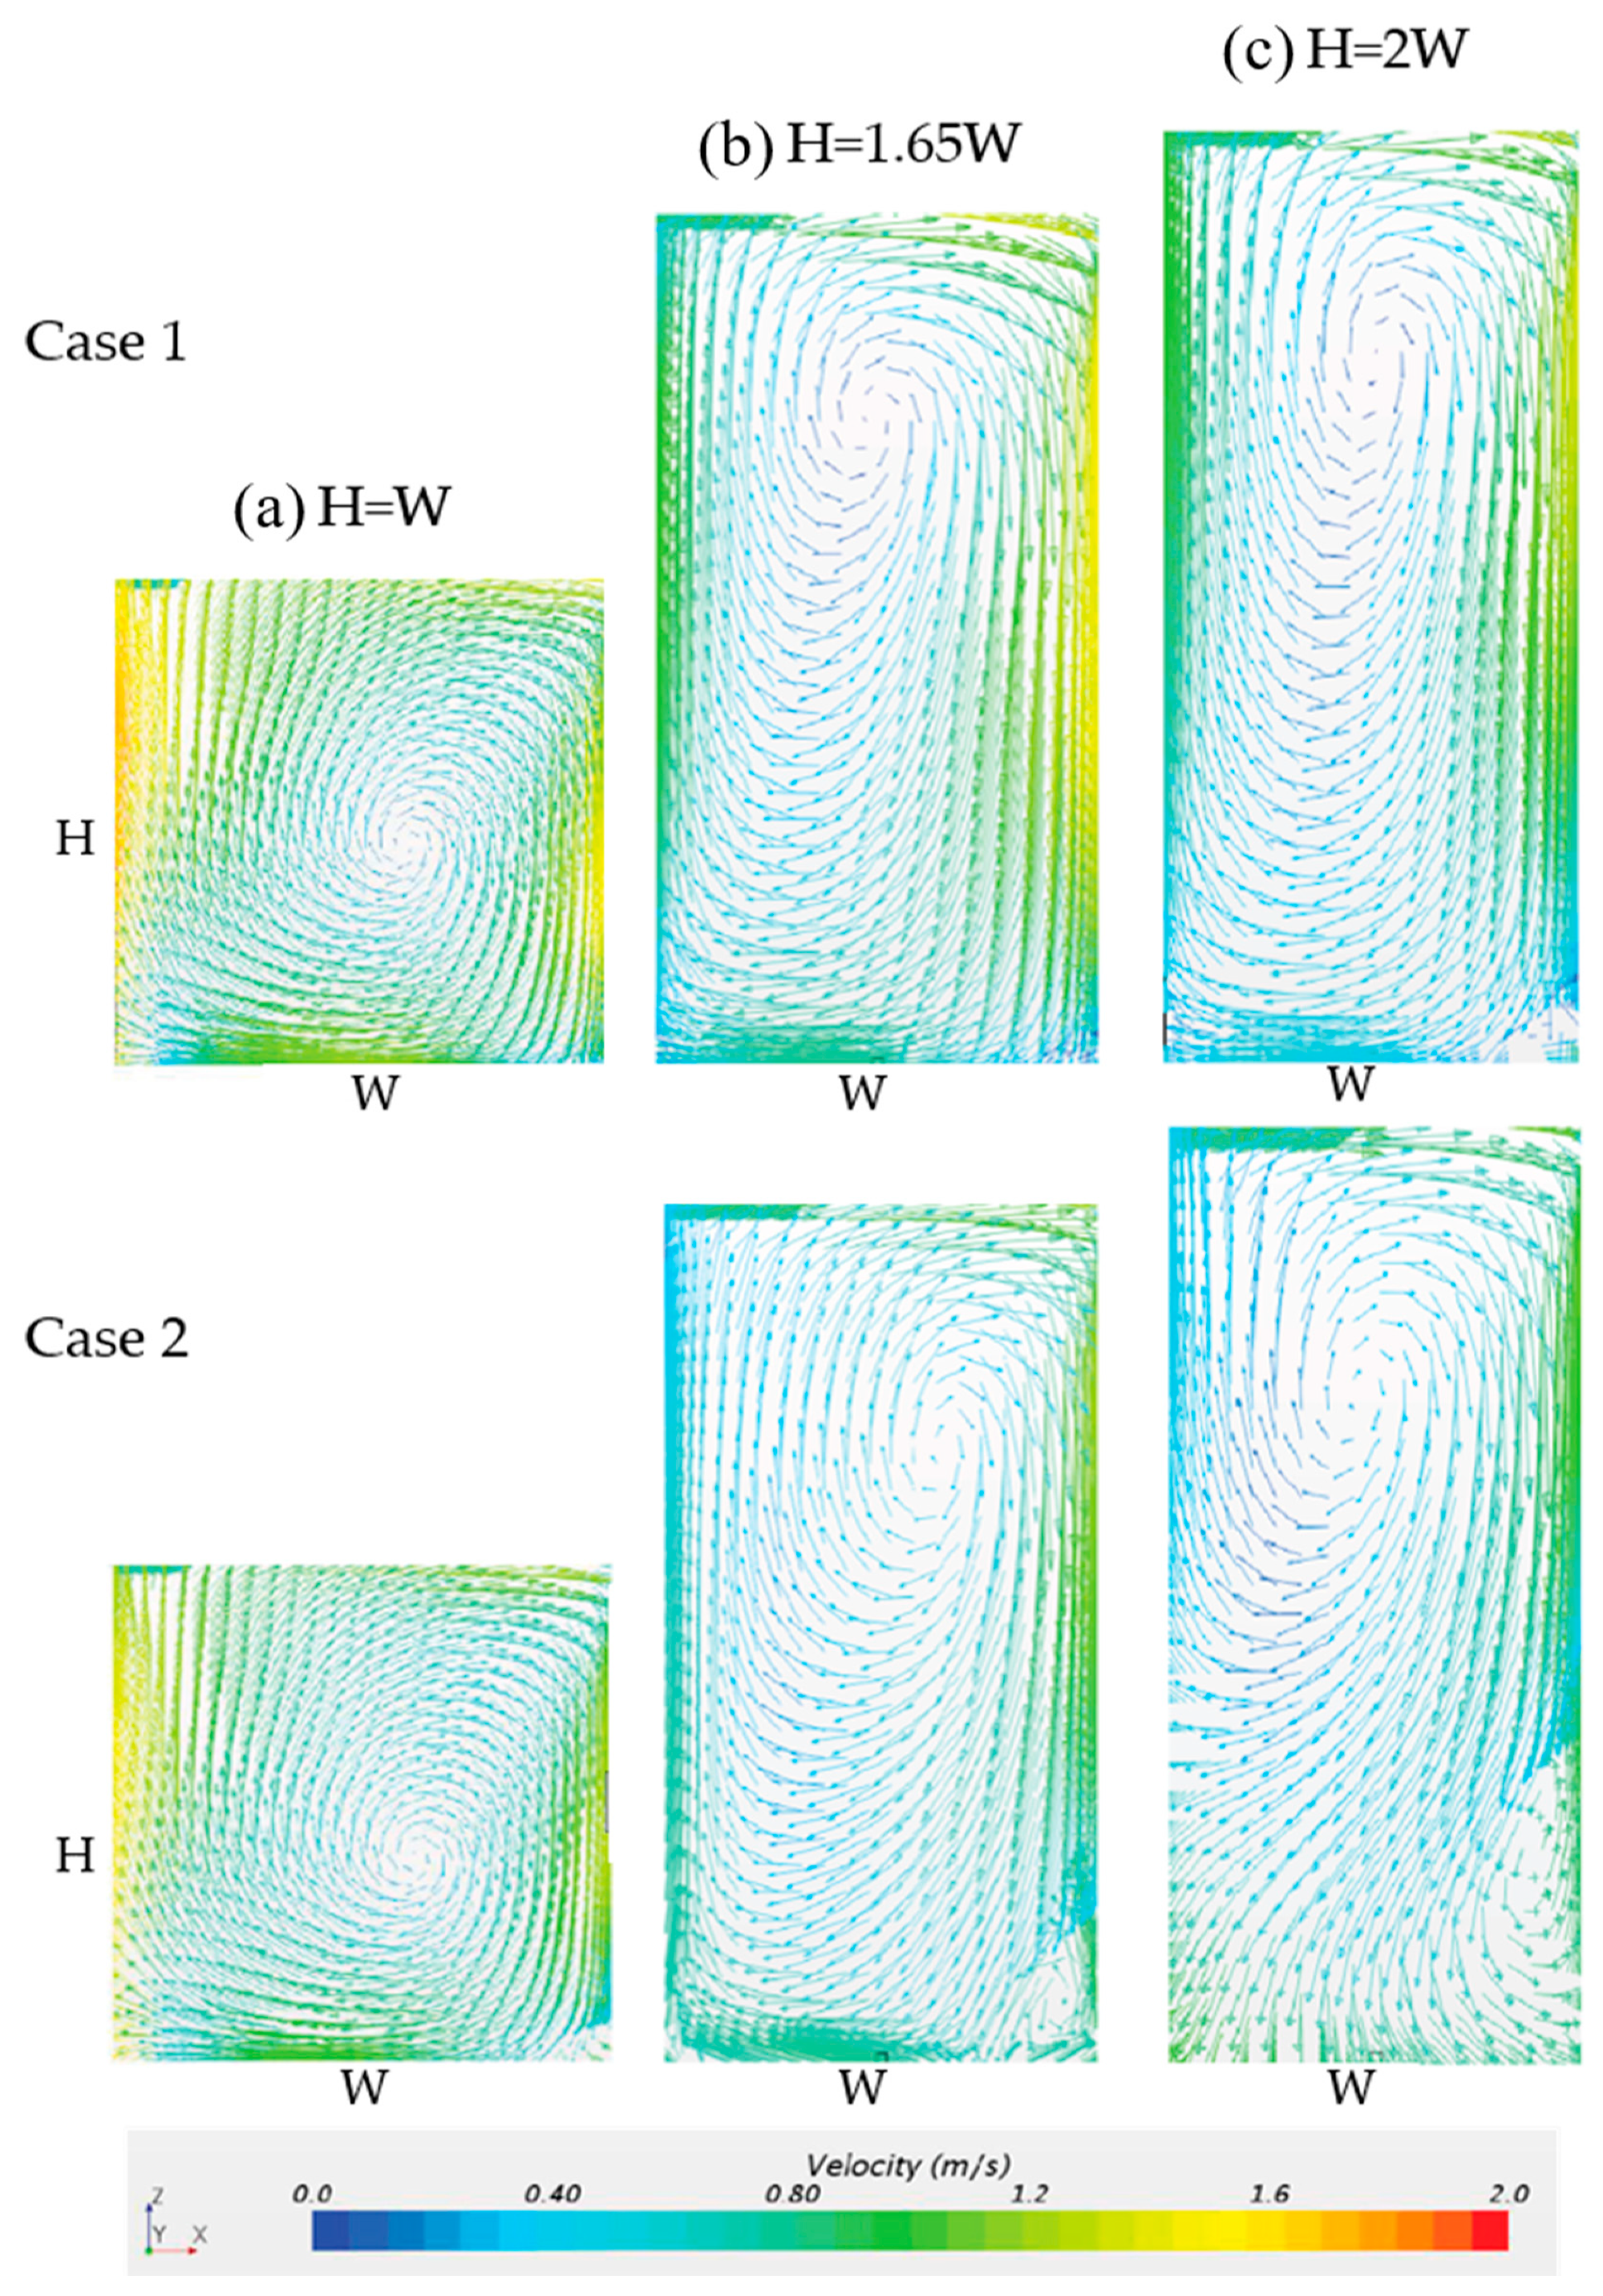
Figure 12.
CO concentration profiles within a street canyon with AR equal to 1 (a), 1.65 (b) and 2 (c). Case 1 (red line) and Case 2 (blue line). Vertical profiles are shown by probe lines, one located at 0.5 m from the leeward side (panels on the left) and one on the windward side (panels on the right).
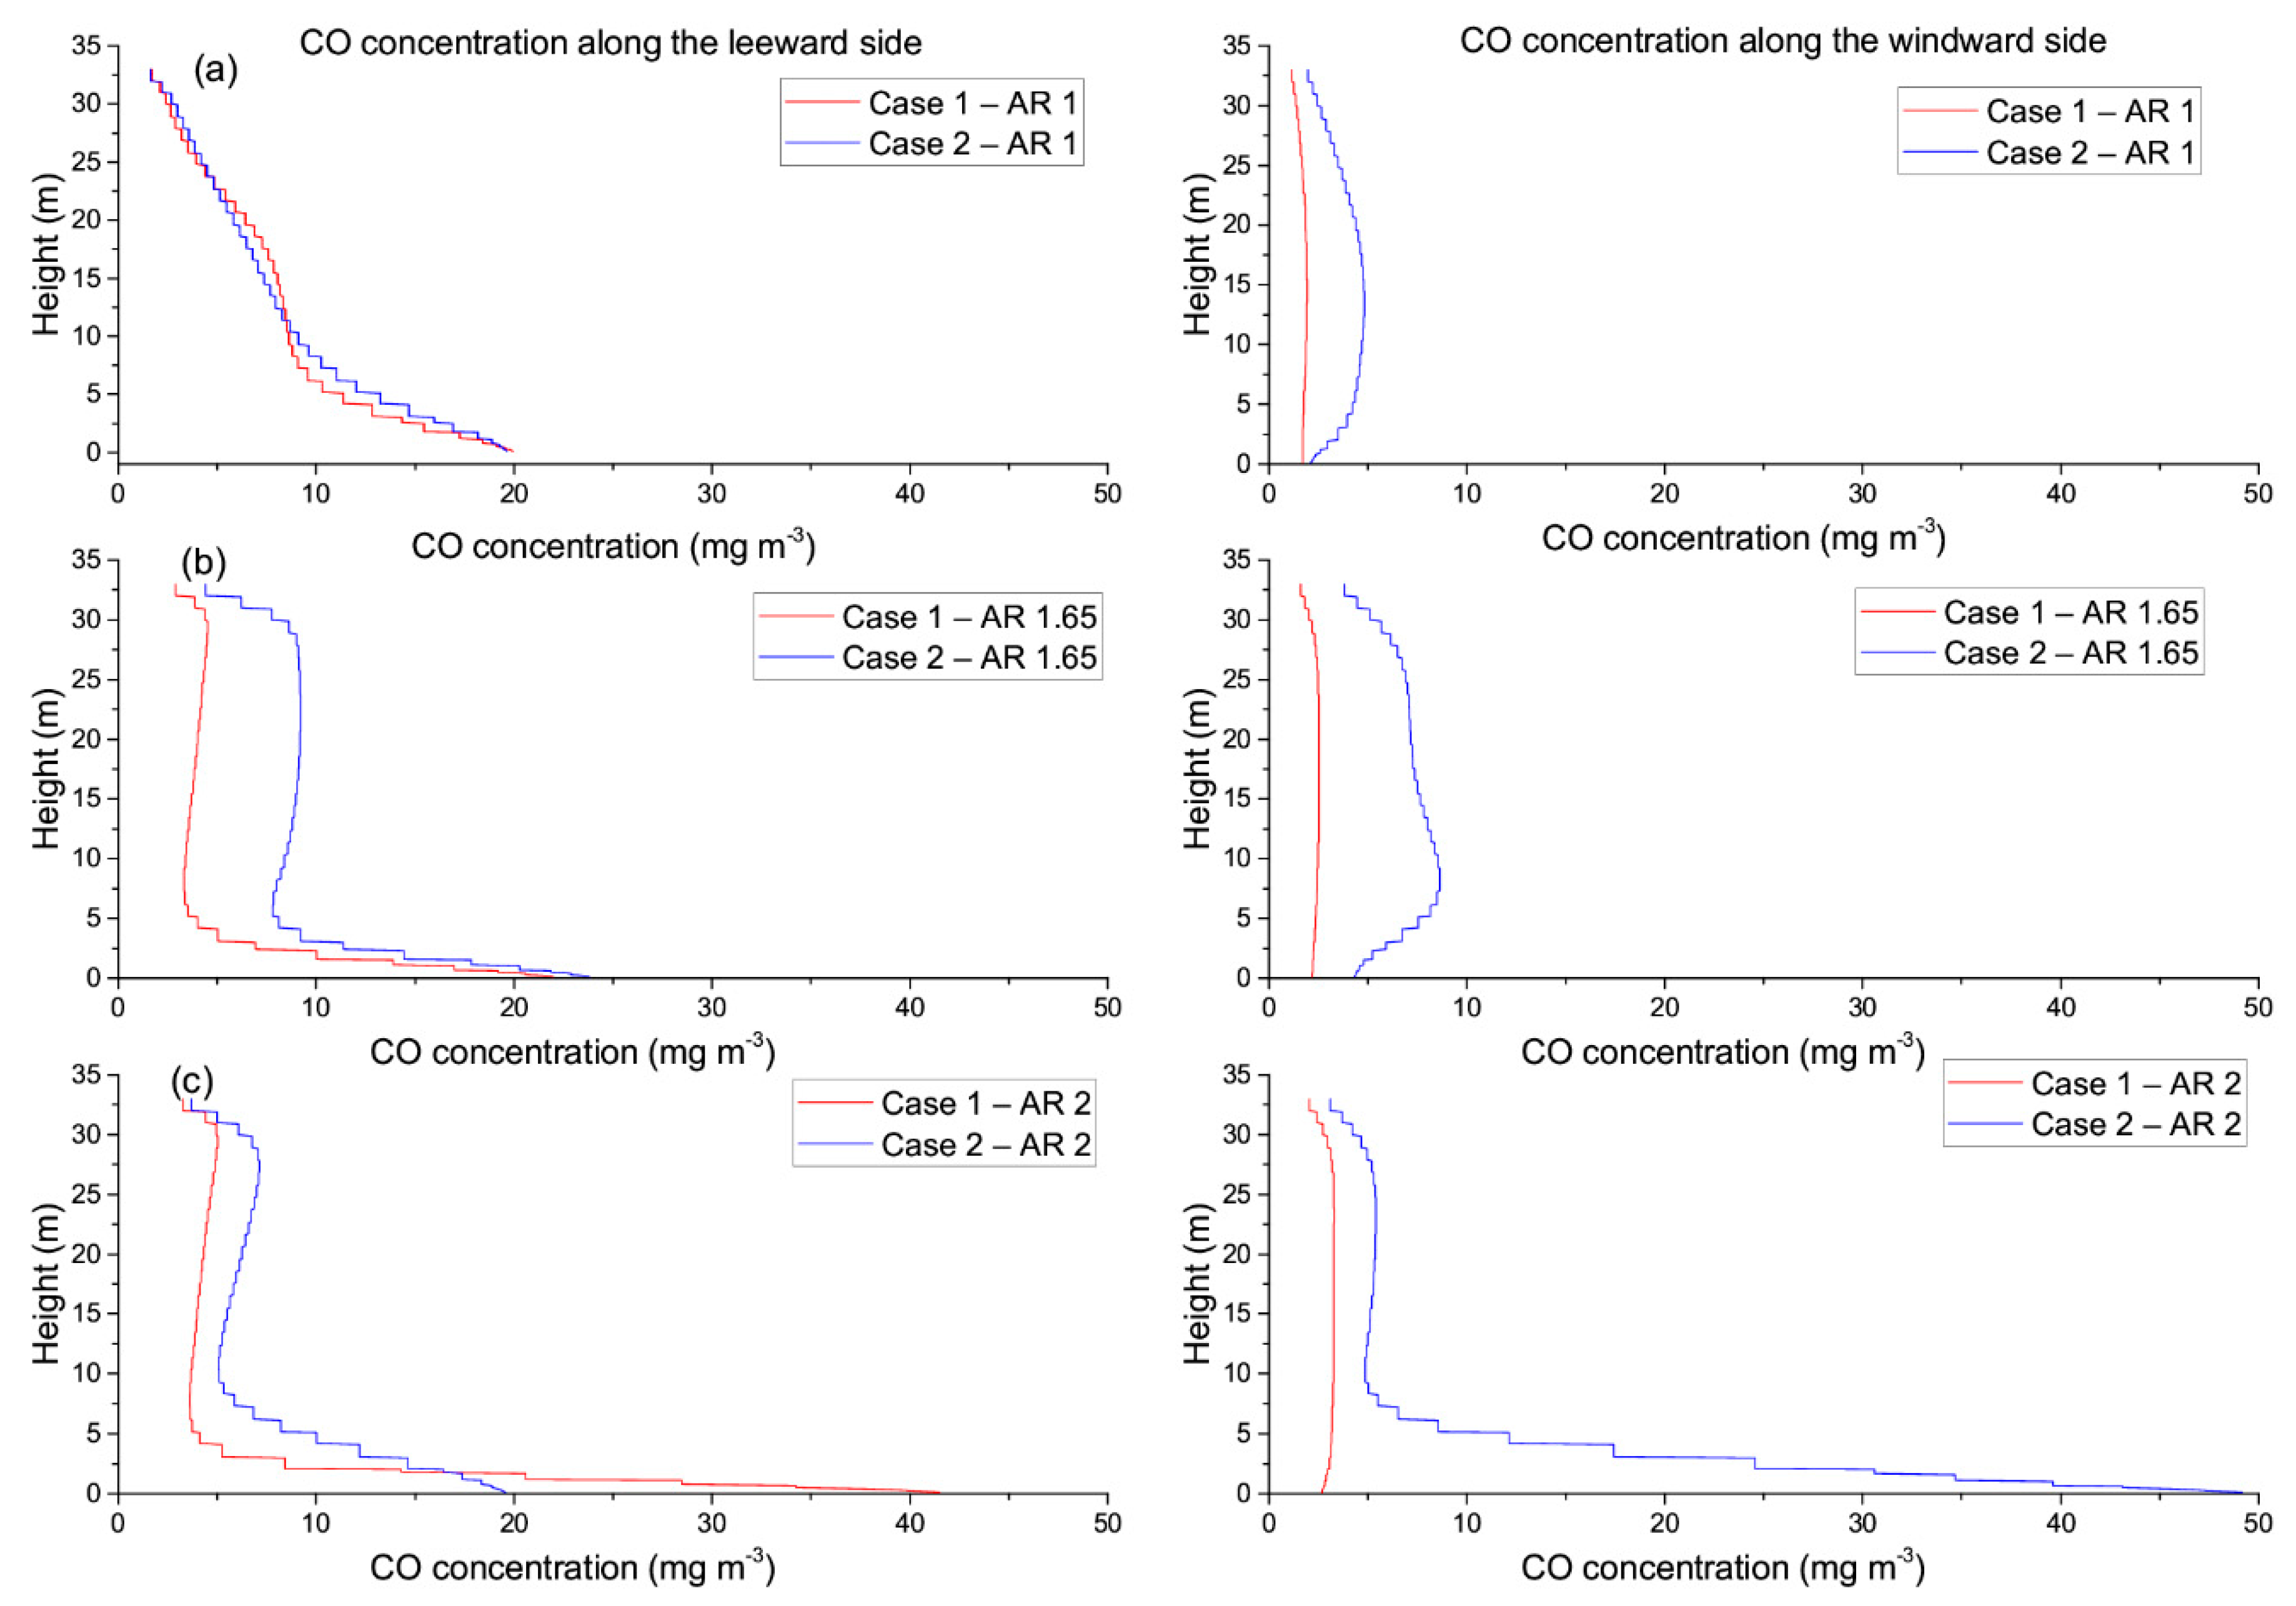
Figure 13.
Pattern of observed and simulated normalized CO concentration within a street canyon with AR equal to 1.65 in Computational Fluid Dynamics (CFD) simulations. Also shown are the vortices observed in the CFD simulations.
Figure 13.
Pattern of observed and simulated normalized CO concentration within a street canyon with AR equal to 1.65 in Computational Fluid Dynamics (CFD) simulations. Also shown are the vortices observed in the CFD simulations.
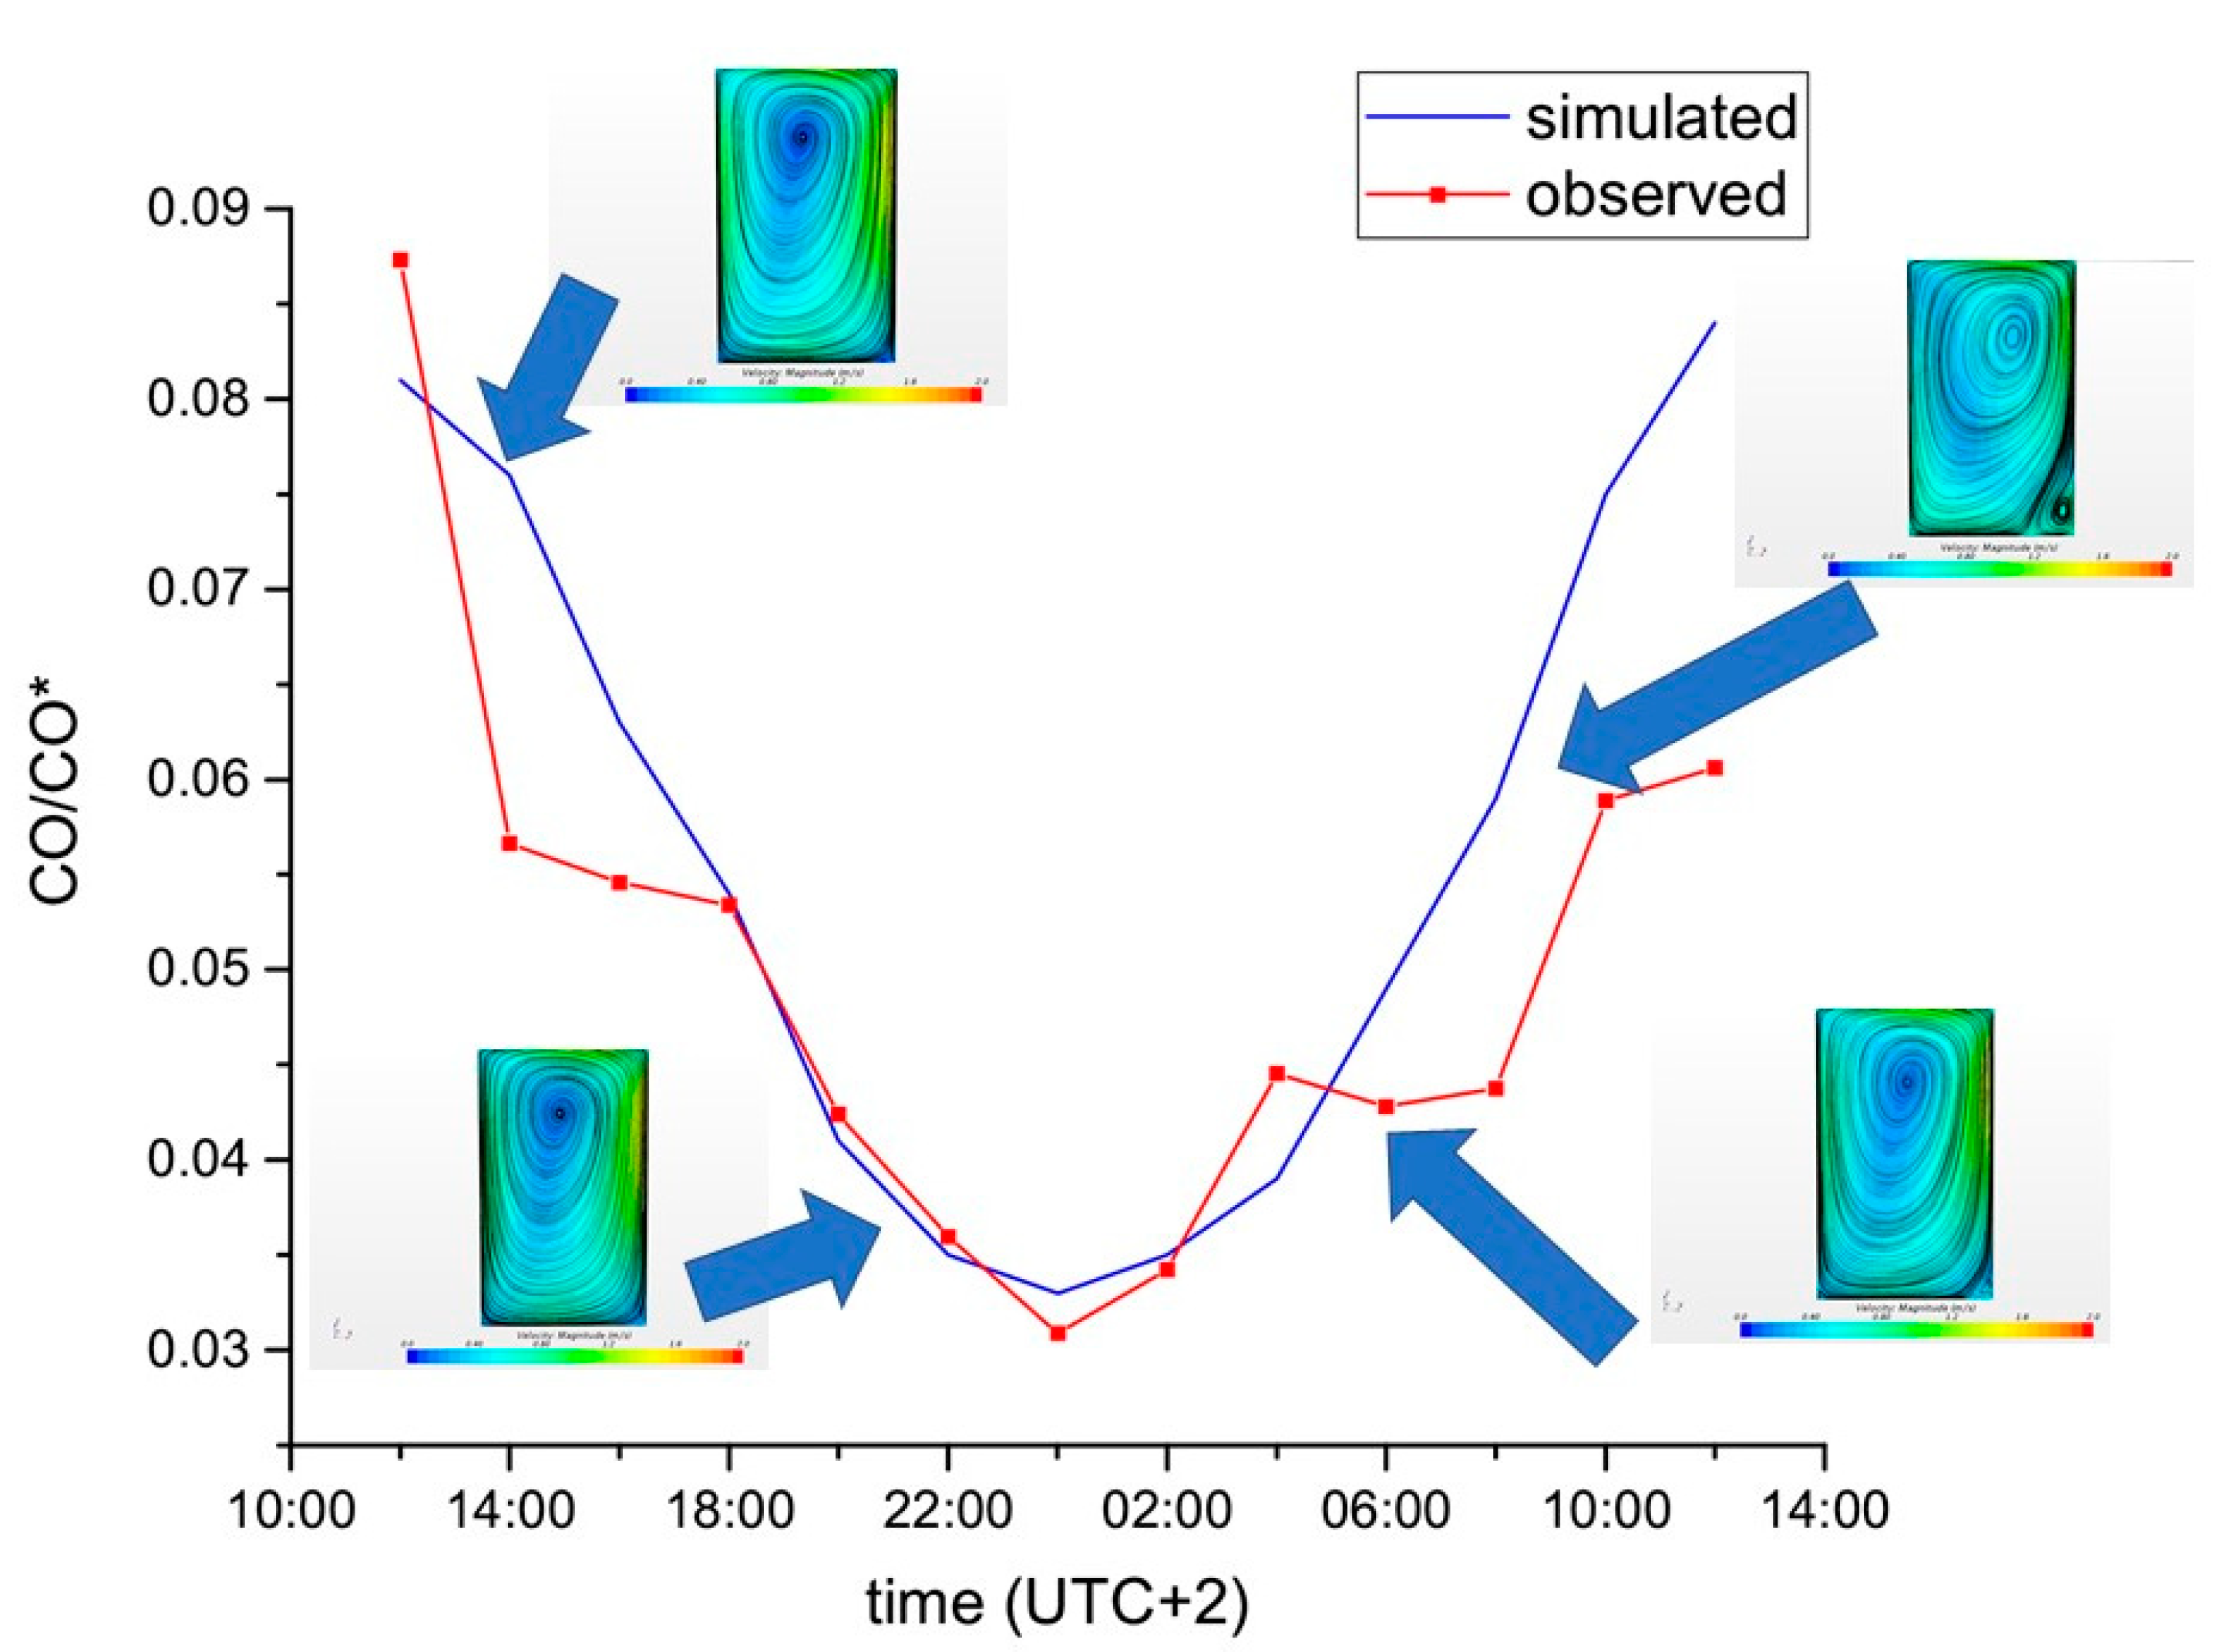
Table 1.
Experimental setup and measurements.
| Site | Site Description | Type | Instrumentation | Sample Rate |
|---|---|---|---|---|
Marconi St. Ground level (MA1) | Instrumented mobile van (measuring at 4 m AGL) parked sideline below a compact mean-high building with gallery and no vegetation. | In-canyon high-frequency meteorology and air quality | Sonic anemometer | 20 Hz |
| Thermohygrometer | 1 Hz | |||
| Barometer | 1 Hz | |||
| Air quality Lab | 1 min/1 d * | |||
Marconi St. Mid-canyon level (MA2)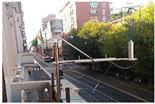 | T-bone pole on the 2nd floor balcony (7 m AGL) stretching towards the street from compact high-rise building. Short tree line on the opposite side. | In-canyon high-frequency meteorology | Sonic anemometer | 20 Hz |
| Thermohygrometer | 1 Hz | |||
Marconi St. Roof-top level (MA3)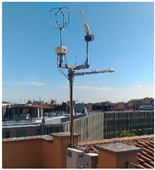 | Vertical pole on the rooftop balcony of a 33-m (AGL) high building. Located on compact high-rise building with no obstacles. There is no vegetation on the rooftop but trees at the canyon opposite side (see MA2). | Canyon rooftop interface high-frequency meteorology | Sonic anemometer | 20 Hz |
| Thermohygrometer | 1 Hz | |||
| Radiometer | 1 min | |||
Laura Bassi St. Ground level (LB1) | Instrumented mobile van (measuring at 3 m AGL) parked sideline below the tree line and in front of an isolated 2-floor house. Trees on both sides of the street. | In-canyon high-frequency meteorology and air quality | Sonic anemometer | 20 Hz |
| Thermohygrometer | 1 Hz | |||
| Barometer | 1 Hz | |||
| Air quality Lab | 1 min/1 d * | |||
Laura Bassi St. Mid-canyon level (LB2) | T-bone pole on the 3rd floor balcony (9 m AGL) stretching towards the street from isolated 3-floor house. Trees on both sides of the street. | In-canyon high-frequency meteorology | Sonic anemometer | 20 Hz |
| Thermohygrometer | 1 Hz | |||
Laura Bassi St. Rooftop level (LB3) | Vertical pole on the rooftop of a 18/15 **-m (AGL) height semi-isolated building of 6 floors (the tallest of the neighborhood). No obstacles from the neighboring buildings and no vegetation on the rooftop. Trees on both sides of the street below. | Canyon rooftop interface high-frequency meteorology | Sonic anemometer | 20 Hz |
| Thermohygrometer | 1 Hz | |||
| Radiometer | 1 min | |||
Silvani St. (SI)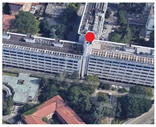 | WMO-(World Meteorological Organization) standard meteorological station at 35/27 *** m AGL located on top of the highest building of the neighborhood (red dot on left figure). | Urban (city-scale) meteorology | Cup and vane anemometer | 30 min |
| Thermohygrometer | 30 min | |||
Asinelli Tower (AS)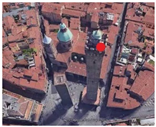 | WMO-standard meteorological station at 100 m AGL on top of the Asinelli Tower (red dot on left figure), 70–80 m above the nearest buildings. | Synoptic scale meteorology | Cup and vane anemometer | 30 min |
| Thermohygrometer | 30 min | |||
Porta San Felice (PSF)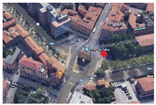 | WMO-standard urban traffic air quality 2-m AGL station (red dot on left figure) sideline to the urban ring-road next to a small vegetated area. | Urban traffic air quality | Gas and particulate analyzer | 30 min |
Giardini Margherita (GM) | WMO-standard urban background 2-m AGL air quality station (red dot on left figure) within the largest urban park of the city. | Urban background air quality | Gas and particulate analyzer | 30 min |
Irnerio St. (CL)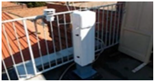 | Ceilometer located on the rooftop balcony (15 m AGL) within the city, with an open vertical path. | Urban boundary-layer height | Ceilometer | 16 s |
Mezzolara (MZ) | WMO-standard meteorological station at 10/2 *** m AGL within the rural area within Mezzolara, 7 km to the north of Bologna. | Rural meteorology | Cup and vane anemometer | 30 min |
| Thermohygrometer | 30 min |
* 1 min refers to the gaseous compounds, 1 day to the particulate matters. ** 18 m is the summer-campaign elevation, 15 m the winter-campaign elevation. *** The first value refers to the anemometer, the second to the thermohygrometer.
Table 2.
Fit characteristics and likelihood parameters (coefficient of determination R2 and root mean square error RMSE) between data in Figure 6b and Equation (2) for the different cases.
Table 2.
Fit characteristics and likelihood parameters (coefficient of determination R2 and root mean square error RMSE) between data in Figure 6b and Equation (2) for the different cases.
| K | RMSE | |||
|---|---|---|---|---|
| SI-MZ | 5.8 | 0.7 | 0.78 | 0.97 |
| AS-MZ | 7.9 | 0.8 | 0.76 | 1.43 |
| MA1-MZ | 8.1 | 0.6 | 0.76 | 1.30 |
| LB1-MZ | 6.1 | 0.6 | 0.72 | 1.14 |
| MA1-LB1 | 2.3 | 0.8 | 0.60 | 0.43 |
Table 3.
Fit characteristics and likelihood parameters (coefficient of determination and root mean square error (RMSE)) between data in Figure 7b and Equation (3) for the different cases.
Table 3.
Fit characteristics and likelihood parameters (coefficient of determination and root mean square error (RMSE)) between data in Figure 7b and Equation (3) for the different cases.
| [°C m−2 s2] | b | RMSE | ||
|---|---|---|---|---|
| MA | 0.55 | 0.28 | 0.87 | 0.73 |
| LB | 6.39 | −0.51 | 0.87 | 0.65 |
Table 4.
Wind and temperature data used to set the boundary conditions in the idealized street canyon in the two cases analyzed.
Table 4.
Wind and temperature data used to set the boundary conditions in the idealized street canyon in the two cases analyzed.
| Wind Speed (m s−1) | Wind Direction (°) | T East (K) | T West (K) | |||
|---|---|---|---|---|---|---|
| Case 1 | 2.69 | 127° | 0.4419 | 1.3067 | 300 | 307 |
| Case 2 | 2.61 | 91° | 0.1473 | 0.0003 | 312 | 302 |
Publisher’s Note: MDPI stays neutral with regard to jurisdictional claims in published maps and institutional affiliations. |
© 2020 by the authors. Licensee MDPI, Basel, Switzerland. This article is an open access article distributed under the terms and conditions of the Creative Commons Attribution (CC BY) license (http://creativecommons.org/licenses/by/4.0/).
Share and Cite
MDPI and ACS Style
Di Sabatino, S.; Barbano, F.; Brattich, E.; Pulvirenti, B. The Multiple-Scale Nature of Urban Heat Island and Its Footprint on Air Quality in Real Urban Environment. Atmosphere 2020, 11, 1186. https://doi.org/10.3390/atmos11111186
AMA Style
Di Sabatino S, Barbano F, Brattich E, Pulvirenti B. The Multiple-Scale Nature of Urban Heat Island and Its Footprint on Air Quality in Real Urban Environment. Atmosphere. 2020; 11(11):1186. https://doi.org/10.3390/atmos11111186
Chicago/Turabian StyleDi Sabatino, Silvana, Francesco Barbano, Erika Brattich, and Beatrice Pulvirenti. 2020. "The Multiple-Scale Nature of Urban Heat Island and Its Footprint on Air Quality in Real Urban Environment" Atmosphere 11, no. 11: 1186. https://doi.org/10.3390/atmos11111186
Note that from the first issue of 2016, this journal uses article numbers instead of page numbers. See further details here.