Ammonia Emissions from a Western Open-Lot Dairy

1
Department of Agronomy, Purdue University, 915 W. State St, West Lafayette Indiana, IN 47907, USA
2
Extension Animal Sciences and Natural Resources Department, NMSU Ag Science Center at Clovis, New Mexico State University, 2346 SR 288, Clovis, NM 88101, USA
*
Author to whom correspondence should be addressed.
Atmosphere 2020, 11(9), 913; https://doi.org/10.3390/atmos11090913
Submission received: 7 August 2020
/
Revised: 17 August 2020
/
Accepted: 19 August 2020
/
Published: 27 August 2020
(This article belongs to the Special Issue Livestock Odor and Air Quality)
Abstract
:Manure on dairies is the second largest agricultural source of ammonia emissions. Ammonia (NH3) emissions were measured at a 3400-cow open-lot dairy in Texas using a backward Lagrangian Stochastic model in combination with measurements from long-path tunable diode lasers and on-site sonic anemometers. Measurements were made for multiple weeks at a time for most seasons over two years. Both 30-min and daily average emissions were influenced by air temperature consistent with a van ’t Hoff equation. Emissions were also linearly related to saturation vapor density deficit. The influence of temperature on NH3 solubility, expressed by the van ’t Hoff temperature correction function, decreased as the water vapor deficit increased. The mean annual daily NH3 emissions at the farm was estimated at 82 g NH3 d−1 per animal (105 g NH3 AU−1 d−1, 1 AU = 500 kg) with mean emission during the summer of 124 g NH3 d−1 per animal (159 g NH3 AU−1 d−1). A distinct diurnal pattern in NH3 emissions was consistent with diurnal patterns in wind speed, saturation vapor density deficit and air temperature. The mean daytime emissions were twice the mean nighttime emissions. Additional studies are needed to evaluate the frequency of high emission days during the summer.
1. Introduction
Ammonia emissions from animal agriculture manure accounts for about 78% of the total agricultural NH3 emissions in the United States of America [1]. The second largest source of NH3 from manure comes from dairies, estimated at 13.5% of the total agricultural NH3 emissions [1]. Dairies in the drier regions of the United States, with annual precipitation of 500 mm or less [2], are typically open-lot management systems [3].
The open-lot management system has cows spending most of their time in the open-lot corral consisting of bare ground mixed with manure. Urine and manure deposited in place by the animals undergoes rapid drying and NH3 volatilization due to the generally low relative humidity (high saturation vapor density deficit) [3,4,5]. Evaporation of water and volatilization of NH3 are inter-related [4]. Initial evaporation from a wet surface is driven (for a given gradient between air and surface) by available energy but as the soil surface dries subsequent evaporation is driven by soil moisture conditions and soil hydraulic properties [6,7,8]. Initial volatilization of NH3 from a wet urine spot (with a given NH3 concentration gradient) occurs when the soil moisture is around saturation and is driven by solubility and pH (influencing the NH3–ammonium (NH4+) equilibrium), and declines as the soil water content decreases and NH4+ sorption to the soil particles increases [9].
Open-lot dairies manage the manure deposited on the corral surfaces harrowing the surface. This harrowing, commonly done daily, results in soil/manure/urine mixing and a disruption of urine—likely a major source of volatilization. Studies have shown that both evaporation and volatilization processes are inter-related. The manure in soils influences evaporation through soil aggregation, water saturation vapor pressures, and water retention [10]. Evaporation influences NH3 volatilization through the convective movement of NH4+ through the water down the water potential gradient [9]. The evaporation from unsaturated soils results in increased convective supply of NH4+ and increased NH3 diffusion through the soil and out the soil surface [11,12]. Volatilization is influenced by the solubility of NH3, the NH4+ − NH3 equilibrium controlled by the soil solution pH [13], the NH3 gradient between the liquid and air [12], the efficiency of gaseous diffusion and NH4+ convection within the soil [11], and the efficiency of transport from the surface to the air (represented by the U, u*) [14].
Ammonia emissions from open-lot dairies vary from less than 100 g NH3 hd−1 d−1 (hd = animal) to more than 300 g NH3 hd−1 d−1. Ammonia emissions from open-lot dairy production systems have been measured for short periods in California [3,15,16], Idaho [17,18], Texas [19], and New Mexico [3]. Few emission measurement studies extend for more than one week, and therefore may not be representative of the yearly or seasonal mean emissions. Emissions ranging from 40 to 250 g NH3 hd−1 d−1 on a few days each in January, March, June, and September at an Idaho dairy [17]. Reported emissions of 150 g NH3 hd−1 d−1 from an open-lot dairy in Idaho were based on measurements of open lot (20 d), compost area (10 d), and wastewater storage (11 d) source components distributed over a year [18]. Higher emission of 304 g NH3 hd−1 d−1 were found under late summer conditions on a dairy with minimum flushing of manure of aprons to the lagoons which maximized emissions in the corral [3]. The objective of this study was to determine the annual variation in NH3 emissions from open-lot dairies based on longer-term frequent measurements and evaluate the dominant factors influencing the emissions.
2. Experiments
The Southwestern Holstein dairy facility [19] consisted of ten corrals (eight milk cow corrals and two dry cow/close up corrals), a milking parlor, an office, a hay shed, a commodities barn, a calving/fresh cow barn and a truck scale (Figure 1). The milking parlor and holding area were in the center of the north end of the corral; and the scraped corral manure was piled to the south of the corrals. There were two settling basins and two holding ponds to the southeast of the corrals (Figure 1). The facility had a capacity of 3400 cows (typical regional dairy has 3000–4000 cows), with a 60-cow (double 30 parallel) milking parlor. Mature cows weighed 640 kg. Wastewater from the dairy drained to two 4750 m2 earthen sludge/settling basins before entering a retention/treatment pond (Figure 1). Runoff from the corrals drained first to a 12,350 m2 retention pond and then to a 22,400 m2 retention pond. Liquid from the largest (and last) retention pond was applied to fields to the north, east, south and southwest of the 24,200 m2 corral (Figure 1). Manure was harrowed in the corrals and scraped from the concrete skirts almost daily with dry fluff manure centered in the corrals twice a week. Manure was eventually hauled to the manure windrows south of the corrals prior to semiannual land applications (fall after harvesting of the maize and wheat crops and late spring prior to planting (Figure 1). Cows were milked three times a day. Manure from the holding pen was flushed from the pen every 3 h, and pumped to the sludge basins to the south of the manure drying piles (Figure 1). The dairy did not start keeping records of harrowing and scraping until June of 2008. During the study no sludge was removed from the ponds. Producer activity during the measurement periods is indicated in Table 1 and coincide with land preparation for crop rotations. The dairy was built in 2005 and was at an elevation of 3647 ft. Soils at the farm are classified as an Estacado clay loam, a well-drained calcareous loamy eolian-deposited soil [20].
The dairy is located in a multi-county region with a high density of both dairy (approximately 350,000 dairy cows) and beef feedlot (approximately 1,000,000 head) livestock operations. Within 15 km of the dairy, there are eight open-corral operations to the north (nearest 4.4 km away), one to the east (6.8 km away), one to the west (6.8 km away), and six to the south (nearest 4.0 km away).
The NH3 emissions from the farm were measured using two scanning tunable diode laser spectrometers (TDL; GasFinder2, Boreal Laser, Inc., Spruce Grove, Alberta, Canada) open path instruments located 1 m above ground level (agl) and 3-dimensional (3D) sonic anemometers located 2 m agl in conjunction with a backward Lagrangian Stochastic (bLS) model and meteorological measurements.
The three sonic anemometers, located to the north, east, and west of the corrals, were inter-compared in the field at the beginning and end of every measurement period. All inter-comparisons showed each individual instrument to report a mean wind speed (U) within 0.2 m s−1 of the mean value of the three on-site instruments. Given the complexity of the corral structure, particular attention was made to be sure that the turbulence structure was consistent with the expectations of turbulence stationarity and homogeneity needed for valid flu calculations from the bLS flux model. Stationarity of the turbulent shear over half-hour periods was assessed [21] with half-hour turbulence statistics not used if the statistic was greater than 0.30 with the inclusion of any 5-min period to the sum. Homogeneity of turbulence was assessed by homogeneity of turbulence during rolling 15-min sample periods (three sequential 5-min periods) by comparing the theoretically derived and measured integral turbulence scales of u* to the standard deviation of w′ (σw) [21]. Half-hour averages of turbulence were not used if the statistic was greater than 0.30 with the inclusion of any 5-min period to the sum.
The scanning TDL instruments were at the NE (TDL/scanner TS1) and SW (TDL/scanner TS2) corners of the farm providing five optical paths (OP) around the farm (Figure 1): a 329-m OP from TS1 to retro-reflector N1, a 742-m long OP from TS1 to retro-reflector E1 (measured during measurement periods 2 through 8), a 506-m long OP from TS1 to retro-reflector E2 (measured during measurement period 9), a 560-m OP from TS2 to retro-reflector E2 (measurement periods 6 through 9) and a 618-m OP from TS2 to retro-reflector E1 (measured during measurement periods 1 and 3). Proximity of the north, west, and east OP to the source suggested an emission measurement error of +10% to −5% across a wide range of atmospheric stabilities [22]. The change in south OP (between the TDL/scanner and E1 and E2, Figure 1) was due to the obstruction of the OP to E1 by manure accumulated in the compost piles south of the corrals. The tallest objects in the corral, the shading structures, are approximately 5 m high and 97 m from the measurement path to the east (fetch 1:50), 147 m from the measurement path to the north (fetch approx. 1:100), 147 m from the measurement path to the south (fetch approx. 1:100), and 147 m from the measurement path to the west (fetch approx. 1:100). The path integrated concentrations (PICs) of each OP were measured with 15 s dwell time. Moving the TDL to the second path required approximately 5 s. Consequently, every 30-min averaging period contained up to 45 measurements along each path. Quality assurance of the TDL measurements reduced the samples to an average of between 11 and 28 measurements.
The TDL sensors were multi-point calibrated six to eight times over the study period and checked for performance at the beginning and end of each measurement period [23]. Additional typical quality assurance criteria involving sensor performance were used in the validation of the TDL measurements [23]. The minimum detection limit (MDL) for the TDL units was on average 2.5 ppm-m (parts per million volume per meter optical path) NH3, corresponding to a concentration of 4 μg NH3 m−3 for a nominal 400 m OP. An on-site inter-comparison with an OP of 473 m on 12 June 2008 showed a 133 μg NH3 m−3 difference between sensors. Further investigation showed one TDL had an electrical grounding problem, resulting in the exclusion of all emission measurements during period 4 (Table 1) when the sensor was downwind of the farm.
Meteorological measurement sensors, including barometric pressure (Model 278, Setra Systems, Inc., Boxborough, MA 01719), air temperature and relative humidity (Model HMP 45C, Vaisala, Inc, Helsinki, Finland), and solar radiation (Model 190SB, LiCOR, Inc, Lincoln, NE, USA) were located 100 m N of the corral (Figure 1). Actual and saturation water vapor density as well as the saturation vapor density deficit (Dvapor) was calculated. Precipitation measurements from an airport weather station 71 km to the northeast were used to approximate the precipitation on-farm. Daytime was defined by a mean hourly solar irradiance of at least 1 Wm−2.
Surface manure was sampled during each measurement period at random locations in the corrals, the scraping lanes, and the milking parlor. Three core samples were drawn from a composite mixture of all manure within a 2-ft radius of the sample location. Samples were analyzed by Midwest Laboratories (Omaha, NE, USA) for pH [24], total nitrogen [25], total ammoniacal nitrogen [26] and moisture content [27].
Emissions were determined by inverse modeling using a backward Lagrangian Stochastic (bLS) model (WindTrax, Thunder Beach Scientific, Nanaimo, B.C, Canada) in combination with the NH3 PIC measurements along all OP and on-site turbulence measurements. The NH3 emissions rate (Q) was determined for the farm by single value decomposition of the matrix incorporating all available OP:
where N, W, and E are the OP, the CBG is the ‘background’ concentration, and a for each OP represents the ratio of the number of air parcels impacting the surface within the source domain (m) weighted by the vertical velocity at the surface (w0) determined stochastically from the turbulence statistics for 30 equidistant points j along each OP:
The turbulent statistics used to estimate the trajectory of each parcel backward in time and space were derived from Monin–Obukhov theory using turbulence statistics based on measurements from a 3D sonic anemometer on site within the internal boundary layer of the farm. The best location of the anemometer was in the internal boundary layer of the source, whether within the source area or downwind of the source [22].
Turbulence at the farm was produced by the land surface, the cows, and the farm infrastructure (buildings, shade structures, stanchions and fencing). The influence of the corral infrastructure was especially evident in the surface roughness (zo) calculated from the north anemometer (Figure 1 and Figure 2A). The mean zo for wind directions of 120° to 190° was 0.08 m (σ = 0.02 m), while that for all other wind directions was 0.04 m (σ = 0.01 m). However, it is important to note that the turbulence homogeneity was still within the quality assurance criteria under these wind directions. Turbulence homogeneity in w for the northern anemometer was nearly uniform for all wind directions (Figure 2B). Flow stationarity was also generally good for winds from the corral with more loss of measurement periods associated with winds from the southwest than from the south or southeast. The turbulence created by the corral was similar at the north and east anemometers for all wind directions. Turbulence at the west anemometer differed substantially from the north and east anemometer due to differences in upwind fetch. Turbulence statistics derived from measurements made at the anemometer to the north of the corral (Figure 1) were preferred in emissions modeling—even when the winds were from the east or west. Ninety-seven percent of emissions were calculated using the anemometer with the corral upwind (usually the north anemometer). The east anemometer was only used when measurements from the north anemometer were invalid.
The large size of the farm prevented reliable communications with a TDL on opposite sides of the predominantly metal-framed corral infrastructure, no direct measure of CBG, was possible. Emissions (Equation (1)) were estimated from CBG values estimated using a range of assumptions: (1) assuming no ambient CBG (0 μg NH3 m−3), (2) assuming CBG to be equal to the mean ambient NH3 concentration measured during the period of study at the National Atmospheric Deposition Program Ammonia Network (AMoN) measurement site TX43 [28] located 71 km to the east (2.3 μg NH3 m−3), (3) assuming CBG to be equal to the minimum mean upwind OP NH3 concentration measured during the study (17 μg NH3 m−3) (Table 2), and (4) assuming CBG to be equal to the mean upwind OP NH3 concentration measured during the study (32.35 μg m−3) (Table 3). The first CBG assumption was clearly not valid, since AMoN measurements have never been zero in the high plains; however, this assumption provided a worst-case scenario for the emissions. The second CBG assumption assumed that the density of livestock operations around the AMoN measurement site TX43 was equal to that around the dairy. There were 16 livestock operations within a 15 km radius circle around the dairy while there were no livestock operations with a 15 km radius circle of TX43. The third and fourth CBG assumption assumed that the distribution of livestock operations was relatively uniform in the area of the dairy and that either the NH3 diffused and deposition on soil and vegetation around the dairy varied over time and wind direction (assumption 3) or uniform over time and wind direction (assumption 4). The validity of these last two assumption is discussed below. Emissions were also assumed to be uniform from the corral, retention and treatment ponds, and the compost windrows. The impact of this assumption on the emissions was tested and is described below.
To be considered valid, 30-min bLS emissions estimates were required to have absolute values of the Monin–Obukhov length (L) of greater than 4 m, friction velocities (u*) greater than 0.15 m s−1, homogeneity of σw of less than 0.4 [21], wind direction standard deviation of less than 30°, and touchdown fractions (TD) of more than 0.4. Assuming a theoretical random error of 22% [29], the expected error in the bLS-measured NH3 emissions was ± 24%. This was consistent with tracer-estimated errors of the bLS emission calculation method of between 5% and 36% [30].
The influence of the open shade structures and fencing on the turbulence around the corral was evaluated by examining the dependence on wind direction of the roughness length (zo) calculated for the north anemometer and comparing the turbulence statistics calculated from the sonic anemometers located to the north and east of the corral.
Statistical analysis including non-linear and linear regression and Pearson linear correlations used the embedded statistical routines of Grapher® 11 (Golden Software, LLC, Golden, CO, USA) and Tablecurve 2D® v5.01 and Tablecurve 3D® v4.0 (SYSTAT Software, Inc., San Jose, CA, USA).
The producer provided information on animal inventories during the measurement periods (Table 1). The animal population varied from 3342 to 3623 over the study with a mean value of 3492. It was assumed that dry cows represent 20% of the herd and that there were no heifers present. Nominal animal mass values were used for the milking cows and dry cows [31]. Actual feed rations were not reported by the producer. The nominal feed ration of the region was assumed for all cows: 30% corn silage, 30% rolled corn, 20% alfalfa hay, 10% dry distiller’s grains, 4% soybean meal, and 6% minerals and supplements. Crude protein (CP) for each feedstuff was assumed [32]: 8.3% for corn silage, 7% for rolled corn [33], 16% for alfalfa hay, 23% for dry distiller’s grains, and 50% for soybean meal. Average CP for the herd was estimated at 15% assuming an even distribution of fresh to late lactating cows and the dry herd fraction. This estimated CP was equal to that used by one ID dairy study [3] but less than the 17.6% used in second ID dairy study [18]. Emissions were calculated at 30-min intervals and normalized by source area, mean animal inventory (hd), and animal mass units (AU = 500 kg). Annual emissions were based on averaged seasonal emissions to minimize bias associated with unequal sampling throughout the year.
3. Results and Discussion
Measurements were made on 192 of the 200 days on site, for a total of 5930 30-min averages of at least some of the measurements (turbulence or NH3 measurements at some locations; Table 1). Weather conditions during the study were generally near normal for the region with air temperatures during the summer reaching 39 °C and temperatures during the winter down to −16 °C (Table 3). The normal range for a nearby airport was a high and low temperature of 33 and −5 °C, respectively [28]. The mean wind daily speed was 4.1 m s−1, lower than normal mean daily wind speed for the region of 6.1 m s−1 [2]. Winds were higher during the winter than the summer, and originated most commonly from the south and west.
The mean NH3 upwind concentrations around the farm were highest at the southern OP (Table 2). Measurements across the south side of the farm were frequently below the top of and between composting manure piles (Figure 1). Since the upwind concentrations for southerly winds were influenced by the composting wind rows, the southerly OP did not represent an upwind concentration. Excluding the south OP, there were weak correlations between the mean NH3 upwind concentrations and the number of upwind open-corral operations (R = 0.19) and distance to the nearest operation (R = 0.36). Winds from the east and north had higher minimum mean concentrations than those form the west (Table 3). These were likely a result of volatilized NH3 from the manure retention pond irrigation applications on fields to the north and east (Figure 1). The lowest upwind NH3 concentration was for winds from the west where there was only one upwind livestock operation and no field for manure application (Table 2). Mean NH3 downwind concentrations were higher for the east and west OP than for the north OP (Table 2). This was probably due in part to the closer proximity of the OP to the corral surface (Figure 1). The lack of a true downwind PIC for the whole farm when winds were from the north prevented the measurement of emissions from the farm during north winds. The measured upwind concentrations were at least an order of magnitude greater than the MDL of the sensor. Only 3479 of the possible 5930 30-min bLS emissions values met all quality assurance criteria. Approximately 46% of the possible bLS emissions were excluded because the 30-min u* was less than 0.15 ms−1, |L| was less than 2 m, or there was a touchdown fraction of less than 0.4; 11% because the σwind direction exceeded 30°; and 11% due to σw inhomogeneity (homogeneity index greater than 0.4).
It is likely that at least one half of the NH3 emitted from the cow manure was emitted from urine [3,13,34]. No samples of urine were collected for analysis. The remaining NH3 emissions is from the solid manure. As the manure dries, the wet-basis solids content should increase while the NH3 content and NH3/N ratio should decrease. Variation in the drying of the manure at the dairy was evidenced by the variation in solid content: the solids content of the collected manure was higher in manure collected from the corral, which was scraped every two weeks, compared to the scraping lanes and parlor, where manure was scraped out within the day (Table 4). Ammonia concentrations were higher in the wetter manure collected from the scraping lanes and parlor than the dryer manure collected from the corral (Table 4). The similarity in N and NH3 content of the manure from all locations suggests little N loss from NH3 volatilization (Table 4). However, the higher variability in NH3 content (coefficient of variation, CV = 0.81) over N content (CV = 0.22) for co-analyzed manure samples across all locations suggests that NH3 is rapidly volatilized from deposited manure. This is consistent with studies indicating that NH3 emission from manure feces applied on fields may be nearly complete within one to two days [13]. It is, however, important to note that there were no significant differences (P = 0.05) in the total nitrogen (N), total solids, or NH3 with sample location in the dairy.
3.1. Half-Hour Emisions
The NH3 emissions were, as expected, inversely related to the assumed CBG. Mean NH3 emission assuming a CBG of 0 μg NH3 m−3 was 4.51 g NH3 s−1 (Table 5). The mean emission decreased with increasing background concentration at a rate of 0.054 g NH3 s−1 per μg NH3 m−3 CBG. Presumably negative emissions occurred because the CBG was assumed to be constant but certainly varies over time—assuming a CBG that is higher than actually occurring could result in a negative emission estimated for a low actual emission. The minimum upwind OP concentration of 17 μg NH3 m−3 (west OP; Table 3) resulted in a relatively small number of negative emissions and was estimated to best represent a fixed CBG at the dairy. Negative emissions generally occurred when the winds were from the north (Figure 3). Since there was only weak correlation of the minimum upwind OP concentration and nearby livestock operations, the primary assumption in using this value for the CBG was that variability in the minimum upwind OP was a result of temporally varying NH3 being diffused the short distance to the OP upwind from the dairy.
The 30-min mean NH3 emissions were related to air temperature, wind speed, friction velocity, and water vapor saturation deficit. Air temperature was positively correlated with emissions (R = 0.46). Water vapor deficit (Dvapor) was positively correlated with emissions (R = 0.29), in part due to the correlation between air temperature and Dvapor. Friction velocity was more highly correlated with emissions (R = 0.39) than wind speed (R = 0.29). The open-lot dairy sun shades in the corrals reduce solar radiation on the cows during the typically sunny days, and the wind breaks on the north ends/sides of the corrals reduce the dust in the corrals associated with steady high winds. The shade structures contribute significantly to air flow turbulence. The low correlations between wind speed and emissions were likely a result of the relative dominance of the roughness of the upwind corral structures on the amount of turbulence and not the ambient atmospheric conditions.
The influence of temperature on emissions from the manure-mixed corral surface soil was modeled using air temperature (Tair) as a proxy for exchange surface temperature assuming volatilization was from liquid surfaces with a NH3 solubility described by a van ’t Hoff temperature function of:
where α represents the NH3 source emission strength at 25 °C and the temperature coefficient (γ) assumed 4100 [35]. Applying this model (with α = 5.0 g NH3 s−1) accounted for only 17% of the measured emissions (Qmeas) variability (R2 = 0.17; Figure 4A). Although this explained less of the Qmeas variability than a linear model (R2 = 0.21), the Equation (3) model was used since the model had a theoretical basis [12].
Qest = α * exp(−γ(1/Tair−1/298.15K)
While a portion of the Qmeas variability was likely due to measurement error, the magnitude of NH3 emissions is known to be influenced by many processes in addition to the water solubility of NH3. Since the corrals were harrowed almost daily, the excreted urine and solid manure was mostly mixed into the surface soil. As previously discussed, volatilization from a manure/soil mix has also been found to be influenced by the NH4+–NH3 equilibrium controlled by the soil solution pH, the NH3 gradient between the liquid and air, the efficiency of gaseous NH3 transport and convective NH4+ transport within the soil, and the efficiency of transport in the air. The influence of these processes was assessed by exploring the relationship between measured variables and the Qmeas/Qest ratio.
The measured manure pH, total N and NH3 concentrations indicated relatively little N in NH3 (Table 4) and consequently the likelihood that the influence of temperature on NH4+ dissociation significantly contributed to Qmeas/Qest variability was likely small. The weak positive linear relationship between Qmeas/Qest and U (R2 = 0.05; Figure 5), suggested that the efficiency of transport was not an important factor in NH3 volatilization. Unfortunately, the NH3 gradient between the liquid and air was not measured. The efficiency of gaseous NH3 transport and convective NH4+ transport within the soil is influenced by water transport and evaporation [11,12]. A model incorporating these factors indicated NH3 volatilization from soils with low characteristic soil moisture parameter (β) such as the clay-loam soil at this dairy (β = 5; [36]) resulted in high NH3 losses through efficient NH4+ transport to the liquid/air interface [12]. This efficient transport also results in relatively high water evaporation [9]. This was consistent with the observed inverse linear relationship between Qmeas/Qest and Dvapor, although the explained variability of a linear model was very small (R2 = 0.02; Figure 5).
A strong diurnal pattern in NH3 emissions was evident in the 30-min measurements (TD > 0.4; Figure 5), with mean emissions of 3.7 g NH3 s−1 +/− 1.0 g s−1 during the day (0600 h to 2000 h local time) and 2.4 g NH3 s−1 +/− 0.3 g NH3 s−1 during the night. A similar diurnal variation in emissions were found at dairies in Idaho [17,18]. The diurnal pattern was associated with both air temperature, wind speed, and water vapor density saturation deficit (Figure 4). Air temperatures averaged 8.9 °C during the night (0600 h to 2000 h local time) and 16.1 ° C during the day. Wind speeds during the night were nearly steady (coefficient of variation (CV) of 2%), averaging 3.2 m s−1, while wind speeds during the day were more variable, averaging 4.6 m s−1. The water vapor density saturation deficit was highest during the day and lowest at night; varying from 0.00 to 5.08 g m−3 with a mean of 0.77 g m−3 (+/−0.77 g m−3).
3.2. Daily Emissions
Initially, daily emissions were considered to be valid only for days with valid 30-min emissions measurements for at least 75% of the day resulted in 56 days with valid daily emissions (TD > 0.4). However, reducing the threshold for the number of measurements needed to represent a day to 50% increased the number of days with valid daily emissions while decreasing the mean emissions by 6% and increasing the coefficient of variance by 8%. Mean daily emissions for days with 50% of the measurements appeared to well-represent the emissions with 75% of the measurements present during the day (Figure 3). Consequently, the 50% measurement threshold for a representative daily emission estimate was used in subsequent analysis.
Defining the exact boundaries of the homogeneous source area was difficult due to the limited number of OP being able to separate individual sources across the farm (Figure 1). With only one or two OP and consequently limited wind directions with valid measurements, the source area(s) was effectively limited to a single source of presumed uniform emission intensity. The uniform emission assumption was based on other studies find that the open lot, which accounted for between 60% and 90% of the farm area, accounted for between 78% and 95% of the farm emissions [7,13,18,37]. The impact of assuming a single emission source including the corral, retention/treatment ponds, and composting windrows on the farm emissions was evaluated by comparing the farm emissions calculated both including and excluding the area of retention/treatment ponds and temporary storage of dry manure as source areas. The mean daily area-based emissions were 9.1 g NH3 m−2 d−1 from a source area including the open lot, feed storage, composting manure storage and wastewater pond. However, if we specified the emissions as coming only from the open-lot corral, the mean daily emissions increased to 12.0 g NH3 m−2 d−1. There was, however, no measurable difference in NH3 emissions on an animal basis, presumably because during the south winds required for valid measurements the retention/treatment ponds and composting windrows were much further upwind (more than 800 m) from the downwind OP than the corrals and milking parlor (100 and 170 m respectively). Because of the large differences in area-based emissions depending on assumed source area, the best representation of emissions from this farm was on an animal or animal mass basis. The entire farm was assumed to be a single homogeneous source.
The annual daily NH3 emission (TD > 0.4) was 288 kg NH3 d−1 (82 g NH3 AU−1 d−1, 105 g NH3 hd−1 d−1) for the whole farm (Table 6). Since CBG was estimated and not measured, an error of +/− 5 μg NH3 m−3 in the assumed CBG (based on the CBG influence on mean emission described above) would correspond to a mean emission error of +/− 0.26 g NH3 s−1 (7 g NH3 hd−1 d−1). The annual daily emission of 105 g NH3 hd−1 d−1 was lower than the mean annual emission estimates of 150 g NH3 hd−1 d−1 [18], 158 g NH3 hd−1 d−1 [17], 141 to 200 g NH3 hd−1 d−1 [37], and the 165.2 g NH3 hd−1 d−1 value determined in a meta-analysis [38]. However, since the meta-analysis of Liu et al. indicates changes in dietary CP between 12.5% and 18% result in NH3 emissions changes of 64 g NH3 hd−1 d−1 [38], differences between the reported daily mean emissions may be largely due to dietary differences [39].
While the annual daily emission was lower than found in the literature, the seasonal range in daily emissions of 74 to 159 g NH3 hd−1 d−1 (Table 6) was within the reported range of 40 to 250 g NH3 hd−1 d−1 from measurements during a few days in January, March, June, and September at an Idaho dairy [17]. Although the mean daily summer emissions of 159 g NH3 hd−1 d−1 was lower than the 304 g NH3 hd−1 d−1 reported for a New Mexico dairy with similar air temperatures and wind speeds [3], there was great variability in the measured emissions (Table 6).
Daily NH3 emissions were weakly related to mean daily air temperature and hence NH3 solubility. Considering only days with at least 24 half-hourly emissions measurements (termed ‘representative day’), the mean daily emissions was modeled based on mean daily air temperature in the form of Equation (1). This model accounted for only 5% of the emissions variability (α = 5.5 g NH3 s−1; R2 = 0.05). Please note that the α for both the half-hourly and daily mean emissions estimate model were similar (5.0 and 5.5 g NH3 s−1), suggesting that this relationship between mean temperature and mean volatilization was consistent across different time scales.
As with the influence of half-hourly mean wind speed on half-hourly emissions, the emissions ratio (Qmeas/Qest) increased slightly with increased mean daily wind speed (Qmeas/Qest = 0.18*U+0.29, R2 = 0.05; Figure 6B). Also as found with the mean half-hourly Dvapor, Qmeas/Qest decreased with increasing Dvapor (Qmeas/Qest = −0.55* Dvapor +1.81, R2 = 0.17; Figure 6C). While the influence of U on Qmeas/Qest was the same for half-hourly or daily mean values, the influence of Dvapor was much greater for daily means than half-hourly means (R2 of 0.2 and 0.17 respectively). The equal R2 associated with mean wind speed for both half-hourly and daily emissions was likely partly due to the low CV (31%) and low range in mean daily wind speeds (Figure 6) and. In contrast, mean Dvapor varied to a greater extent from one day to the next (CV 59%). The inverse influence of Dvapor and the negligible influence of U on Qmeas/Qest might be explained in part by the processes of drying manure and urine and volatilization of NH3 from the corral surface. Based on our assumptions, the inverse relationship of Dvapor on Qmeas/Qest indicated that as Dvapor increased the influence of NH3 solubility (and hence the temperature influence) on the volatilization decreased. When the vapor deficit was high, the process of NH3 volatilization was apparently not limited by the water-solubility of NH3.
While it was assumed that corral harrowing would result in a relatively homogeneous NH3 source, the variability in manure analyses suggest that the source strength may not have been uniform. As previously stated, NH3 concentrations were higher in manure collected from the scraping lanes and parlor than from the corral. No measurements of the NH3 concentration of the soil of the urine patches or the distribution of urine patches the corral were made.
Modifying the emissions estimation model (Equation (1)) to include U increased the explained variability from 5% to 12% (adjusted R2 = 0.12) while modifying the emissions estimation model (Equation (1)) to include Dvapor increased the explained variability from 5% to 27% (adjusted R2 = 0.27). The best fit two-parameter model of estimated emissions for a given T and Dvapor using a NH3 solubility van ’t Hoff temperature function was:
with a NH3 source emission strength at 25 °C in saturated air (α) of 8.67 g NH3 s−1 and a temperature coefficient γ of -4100 according to NIST (2011) (Figure 6A). The resulting model had an RMS error of −0.13 g NH3 s−1 (−4.2 kg NH3 d−1) with a bias of 1.08 g NH3 s−1 (157.9 kg NH3 d−1) and a median error of −0.51 g NH3 s−1 (−43.7 kg NH3 d−1). Model greatly underestimated the emissions for two measurements when the wind speed was around 4.5 ms−1 and water vapor density deficit was high (around 1.5 g m−3; Figure 7).
Qest = 8.67 * (1−0.28*Dvapor) exp (γ * (1/Tair−1/298.15K) [g NH3 s−1]
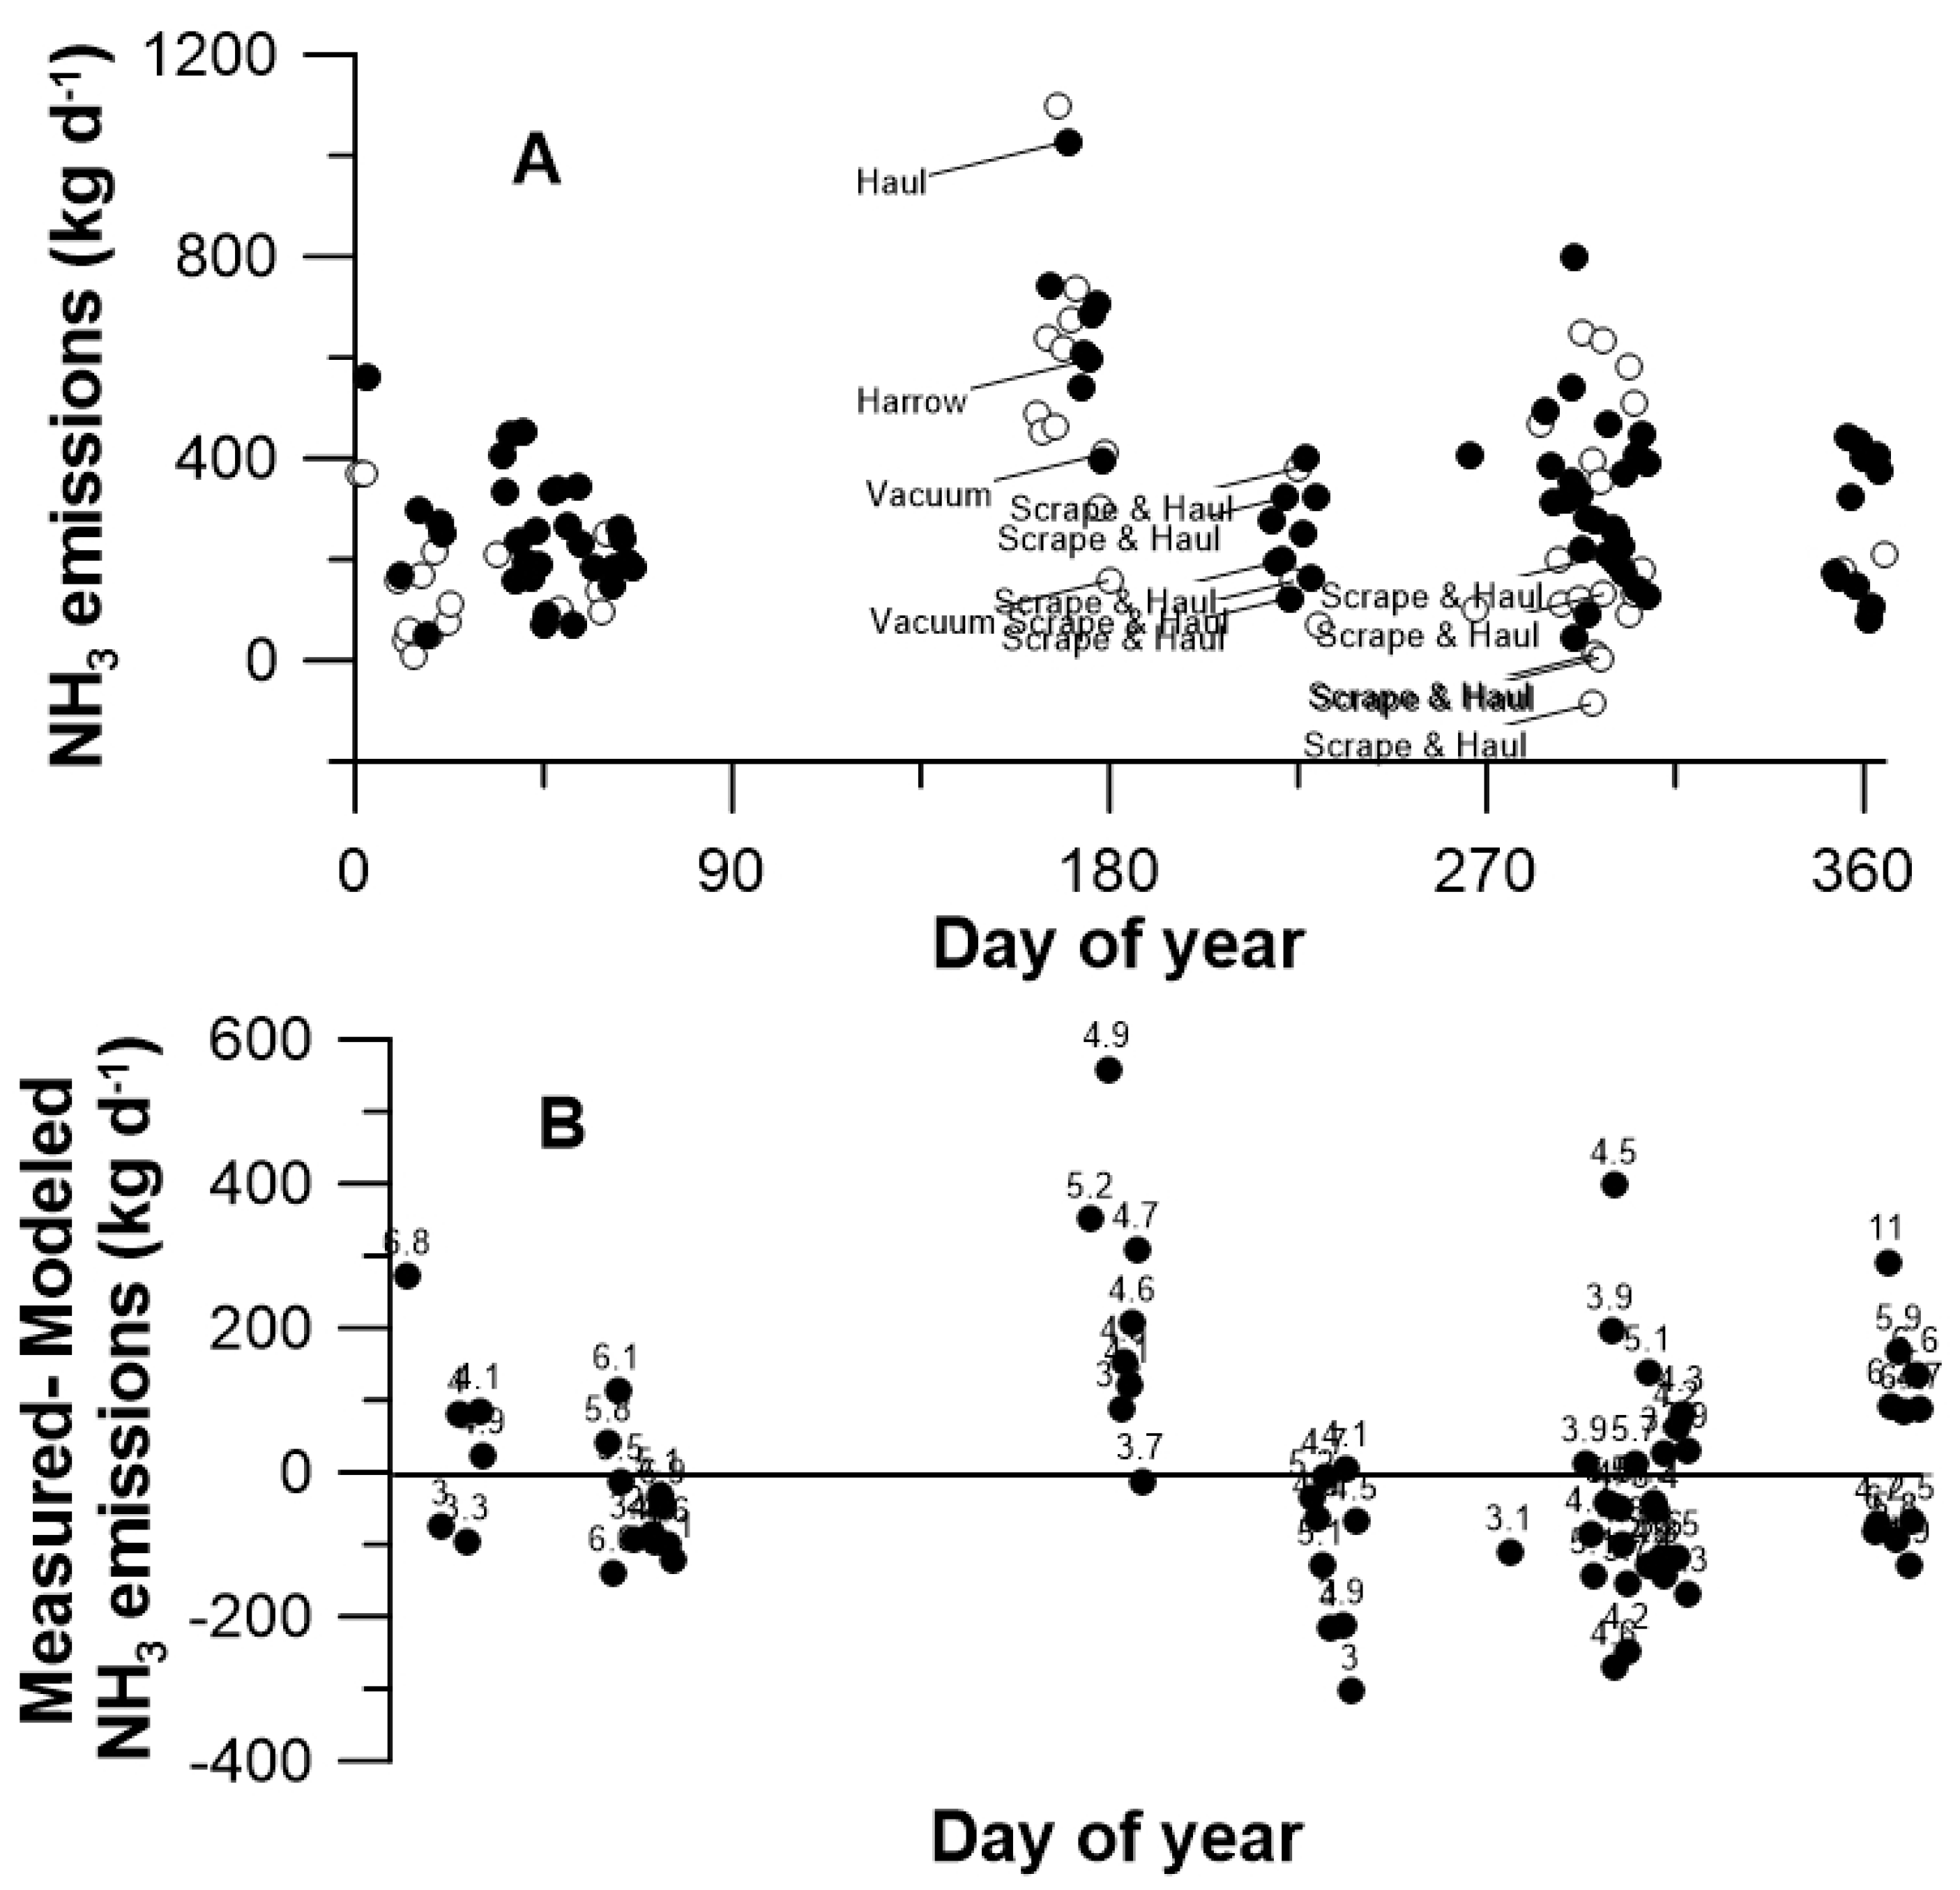
Emissions tended to be underestimated during the summer (Figure 8), suggesting that the influence of temperature and possibly saturation vapor deficit was incorrectly represented in the model. Volatilization of NH3 might be expected to be explained by temperature and the vapor deficit over time as winds are relatively constant and new urine and manure is added daily while day-old manure and urine is incorporated into the corral surface. However, periodically, the corral is scraped to remove accumulated manure and hauled to the composting windrows (Figure 1). The highest daily emissions (and model error) occurred in the summer (Figure 8), when the corral manure was being hauled to the compost rows; the high measured emissions may have been influenced by the compost rows that were assumed to have the same emissions as the corral. However other instances of major scraping and hauling did not appear to influence the measured emissions (Figure 8).
3.3. N Balance
Based on nominal feed requirements, the estimated daily N intake of the lactating cows was 315 g N d−1 to 440 g N d−1 and that of the dry cows was 222 g N d−1 [38]. For the herd mix at the dairy, the mean daily N intake of the lactating cows was 338 g N d−1. Given the calculated mean annual (summer) emissions of 82 g NH3 hd−1 d−1 (124 g NH3 hd−1 d−1), the volatilized NH3 represented 24% (37%) of animal intake. If we assumed the more regional (NADP-measured) background of 2.3 μg NH3 m−3 for CBG, the mean annual (summer) NH3 emissions for the dairy was 102 g NH3 hd−1 d−1 (144 g NH3 hd−1 d−1), representing 30% (43%) of the daily cow N uptake. These estimated mean feed N loss values were lower than that estimated at an ID dairy [3], but more than that indicated through a meta-analysis [39]. Todd and coworkers estimated feed N loss from NH3 emissions to be 43% (whole farm) or 41% (open lot) for a New Mexico dairy using more detailed feed information [3]. A meta-analysis of the influence of diet on ammonia emissions from only the open-lot indicated a mean NH3-N loss of 16% (SD 8%) for open lot dairies [38].
4. Conclusions
Emissions from the high plains open-lot dairy were influenced by both air temperature and saturation vapor density deficit resulting in a diurnal variation with maximum emissions around 1200 to 1300 local time. A semi-empirical model of the daily emissions suggest that emissions were inversely related to the saturation vapor density deficit, indicating that the influence of temperature on NH3 solubility, expressed by the van ’t Hoff temperature correction function, decreased as the water vapor deficit increased. There was only a weak correlation between emission and wind speed—likely due to the high and relatively constant winds at this high plains dairy farm. The near-daily harrowing and the consistent high winds appeared to keep the mixed soil/manure NH3 volatilization from the corral controlled by the adhesion of NH3 on the wet soil/manure particles (function of pH and soil properties), the solubility of the NH3 in the soil/manure water, and the gradient of NH3 and water between surface and the air. The annual mean NH3 emissions at the open-lot dairy was 288 kg NH3 d−1 (105 g NH3 AU−1 d−1, 82 g NH3 hd−1 d−1) with emissions 50% higher during summer.
Author Contributions
Conceptualization, R.H.G. and G.R.H.; methodology, R.H.G.; software, M.T.B.; validation, M.T.B. and R.H.G.; formal analysis, R.H.G. and M.T.B.; investigation, R.H.G.; resources, R.H.G.; data curation, M.T.B. and R.H.G.; writing—original draft preparation, R.H.G.; writing—review and editing, R.H.G., M.T.B., G.R.H.; visualization, R.H.G.; supervision, R.H.G.; project administration, R.H.G.; funding acquisition, R.H.G. All authors have read and agreed to the published version of the manuscript.
Funding
This research was funded by livestock producers, the Agricultural Air Research Council, Inc. and Dairy Research Incorporated.
Acknowledgments
Assistance with field measurements was made by J. Wolf, S. Cortus, C. Fullerton, and D. Snyder. M. Mangan assisted in the modeling and data analysis. Without their help this work could not have been possible.
Conflicts of Interest
The authors declare no conflict of interest. The funders had no role in the design of the study; in the collection, analyses, or interpretation of data; in the writing of the manuscript, or in the decision to publish the results.
References
- Paulot, F.; Jacob, D.J.; Travis, K.; Henze, D.K. Ammonia emissions in the United States, European Union, and China derived by high resolution inversion of ammonium wet deposition data: Interpretation with a new agricultural emissions inventory (MASAGE_NH3). J. Geophys. Res. Atmos. 2014, 119, 4343–4359. [Google Scholar] [CrossRef]
- Climatic Wind Data for the United States; National Climatic Data Center, National Oceanic and Atmospheric Administration, Department of Commerce: Washington, DC, USA. Available online: http://www.ncdc.noaa.gov/oa/documentlibrary/wind/wind1996.pdf (accessed on 8 November 2018).
- Todd, R.W.; Cole, N.A.; Hagevoort, G.R.; Casey, K.D.; Avermann, B.W. Ammonia losses and nitrogen partitioning at a southern High Plains open-lot dairy. Atmos. Environ. 2015, 110, 75–83. [Google Scholar] [CrossRef]
- Chao, T.T.; Kroontje, W. Relationships between ammonia volatilization, ammonia concentration and water evaporation. Soil Sci. Soc. Amer. J. 1964, 28, 393–395. [Google Scholar] [CrossRef]
- Stewart, B.A. Volatilization and nitrification of nitrogen from urine under simulated cattle feedlot conditions. Environ. Sci. Technol. 1970, 4, 579–582. [Google Scholar] [CrossRef]
- Brutsaert, W. Evaporation into the Atmosphere: Theory, History, and Applications; Springer: Dordrecht, The Netherlands, 1982; p. 299. [Google Scholar]
- Kondo, J.; Saigusa, N.; Sato, T. A model and experimental study of evaporation from bare-soil surfaces. J. Appl. Meteorol. 1992, 31, 304–312. [Google Scholar] [CrossRef] [Green Version]
- Leytem, A.; Dungan, R.; Bjorneberg, D.; Koehn, A. Emissions of ammonia, methane, carbon dioxide, and nitrous oxide from dairy cattle housing and manure management systems. J. Environ. Qual. 2011, 55, 826–833. [Google Scholar] [CrossRef] [PubMed] [Green Version]
- Al-Kanani, T.; MacKenzie, A.F.; Barthakur, N.N. Soil water and ammonia volatilization relationships with surface applied nitrogen fertilizer. Soil Sci. Soc. Am. J. 1991, 55, 1761–1766. [Google Scholar] [CrossRef]
- Unger, P.W.; Stewart, B.A. Feedlot waste effects on soil conditions and water evaporation. Soil Sci. Soc. Am. J. 1974, 38, 954–957. [Google Scholar] [CrossRef]
- Kirk, G.J.D.; Nye, P.H. A model of ammonia volatilization from applied urea. V. The effects of steady-state drainage and evaporation. J. Soil Sci. 1991, 42, 103–113. [Google Scholar] [CrossRef]
- Kirk, G.J.D.; Nye, P.H. A model of ammonia volatilization from applied urea. VI. Effects of transient-state water evaporation. J. Soil Sci. 1991, 42, 115–125. [Google Scholar] [CrossRef]
- Hristov, A.N.; Hanigan, M.; Cole, A.; Todd, R.; McAllister, T.A.; Ndegwa, P.M.; Rotz, A. Review: Ammonia emissions from dairy farms and beef feedlots. Can J. Anim. Sci. 2011, 91, 1–35. [Google Scholar] [CrossRef] [Green Version]
- Sommer, S.G.; Olesen, J.E. Effects of dry matter content and temperature on ammonia loss from surface-applied cattle slurry. J. Environ. Qual. 1991, 20, 679–683. [Google Scholar] [CrossRef]
- Cassel, T.; Ashbaugh, L.; Flocchini, R. Ammonia flux from open-lot dairies: Development of measurement methodology and emission factors. J. Air Waste Manage. Assoc. 2005, 55, 816–825. [Google Scholar] [CrossRef]
- Cassel, T.; Ashbaugh, L.; Flocchini, R.; Meyer, D. Ammonia emission factors for open-lot dairies: Direct measurements and estimation by nitrogen intake. J. Air Waste Manag. Assoc. 2005, 55, 826–833. [Google Scholar] [CrossRef] [PubMed] [Green Version]
- Bjorneberg, D.L.; Leytem, A.B.; Westermann, D.T.; Griffiths, P.R.; Shao, L.; Pollard, M.J. Measurement of atmospheric ammonia, methane, nitrous oxide at a concentrated dairy operation facility in southern Idaho using open path FTIR spectroscopy. Trans. ASABE 2009, 52, 1749–1756. [Google Scholar] [CrossRef]
- Mukhtar, S.; Mutlu, A.; Capareda, S.C.; Parnell, C.B. Seasonal and spatial variations of ammonia emissions from an open-lot dairy operation. J. Air Waste Manag. Assoc. 2008, 58, 369–376. [Google Scholar] [CrossRef] [PubMed]
- National Air Emissions Monitoring Study: Data from the Southwestern US Milk Production Facility TX5A; Final Report to the Agricultural Air Research Council; Purdue University: West Lafayette, IN, USA. Available online: http://www.epa.gov/airquality/agmonitoring/pdfs/TX5ASummaryReport.pdf (accessed on 5 February 2017).
- National Cooperative Soil Survey, Web Soil Survey 1.1; United States Department of Agriculture National Resources Conservation Service, United State Department of Agriculture: Washington, DC, USA. Available online: https://websoilsurvey.sc.egov.usda.gov/App/WebSoilSurvey.aspx (accessed on 21 February 2019).
- Foken, T.; Wichura, B. Tools for quality assessment of surface-based flux measurements. Agric. For. Meteorol. 1996, 78, 83–105. [Google Scholar] [CrossRef]
- Flesch, T.K.; Wilson, J.D.; Harper, L.A. Deducing ground-to-air emissions from observed trace gas concentrations: A field trial with wind disturbances. J. Appl. Meteorol. 2005, 44, 475–484. [Google Scholar] [CrossRef]
- Grant, R.H.; Boehm, M.T.; Lawrence, A.F.; Heber, A.J. Ammonia Emissions from Anaerobic Treatment Lagoons at Sow and Finishing Farms in Oklahoma. Agric. For. Meteorol. 2013, 180, 203–210. [Google Scholar] [CrossRef]
- pH Electrometric Measurement. Method 9040C (Rev. 3); United States Environmental Protection Agency, Office of Water, Office of Science and Technology: Washington, DC, USA. Available online: www.epa.gov/sw-846/pdfs/9040c.pdf (accessed on 3 July 2006).
- Total Kjeldahl Nitrogen in Water and Biosolids by Automated Colorimetry with Preliminary Distillation/Digestion (Draft); Method 1687; EPA-821/R-01-004 (CD); United States Environmental Protection Agency, Office of Water, Office of Science and Technology: Washington, DC, USA, 2001.
- Nitrogen, Ammonia (Colorimetric, Titrimetric, Potentiometric Distillation Procedure). Method 350.2. Available online: www.umass.edu/tei/mwwp/acrobat/epa350_2NH3titration.pdf (accessed on 19 January 2006).
- Total, Fixed, and Volatile Solids in Water, Solids, and Biosolids; Method 1684; United States Environmental Protection Agency, Office of Water, Office of Science and Technology: Washington, DC, USA, 2001; EPA-821/R-01-015 (CD).
- National Atmospheric Deposition Program/Ammonia Monitoring Network. Available online: http://nadp.sws.uiuc.edu/data/sites/siteDetails.aspx?net=AMON&id=TX43 (accessed on 7 July 2011).
- Laubach, J.; Kelliher, F.A. Measuring methane emission rates of a dairy cow herd (II): Results from a backward-Lagrangian stochastic model. Agric. For. Meteorol. 2005, 129, 137–150. [Google Scholar] [CrossRef]
- Flesch, T.K.; Prueger, J.H.; Hatfield, J.L. Turbulent Schmidt number from tracer experiment. Agric. For. Meteorol. 2002, 111, 229–307. [Google Scholar] [CrossRef]
- Manure Production and Characteristics; American Society of Agricultural Engineers Standard D384.2; American Society of Agricultural and Biological Engineers: St. Joseph, MI, USA, 2005; pp. 1–19.
- NRC. Nutritional Requirements of Beef Cattle, 6th ed.; National Research Council, National Academy Press: Washington, DC, USA, 1984; p. 248. [Google Scholar]
- Lardy, G. Feeding Corn to Beef Cattle. North Dakota State University Extension Service AS1238. 2013. 4p. Available online: https://library.ndsu.edu/ir/bitstream/handle/10365/5349/as1238.pdf?sequence=1 (accessed on 15 February 2015).
- Ward, G.M.; Muscato, T.V.; Hill, D.A.; Hansen, R.W. Chemical composition of feedlot manure. J. Environ. Qual. 1978, 7, 159–164. [Google Scholar] [CrossRef]
- Chemistry Webbook: Ammonia. Material Measurement Laboratory, National Institute of Standards and Technology. Available online: http://webbook.nist.gov/cgi/cbook.cgi?ID=C766441 (accessed on 11 February 2011).
- Campbell, G.S.; Norman, J.M. An Introduction to Environmental Biophysics, 2nd ed.; Springer: New York, NY, USA, 1998; pp. 129–139. [Google Scholar]
- Moore, K.D.; Young, E.; Gurell, C.; Wojcik, M.D.; Martin, R.S.; Bingham, G.E.; Pfeiffer, R.L.; Prueger, J.H.; Hatfield, J.L. Ammonia measurements and emissions from a California dairy using point and remote sensors. Trans. ASABE 2014, 57, 181–198. [Google Scholar]
- Liu, Z.; Liu, Y.; Murphy, M.P.; Maghirang, R. Ammonia and Methane Emission Factors from Cattle Operations Expressed as Losses of Dietary Nutrients or Energy. Agriculture 2017, 7, 16. [Google Scholar] [CrossRef] [Green Version]
- Bougouin, A.; Leytem, A.; Dijkstra, J.; Dungan, R.S.; Kebreab, E. Nutritional and environmental effects on ammonia emissions from dairy cattle housing: A meta-analysis. J. Environ. Qual. 2016, 45, 1123–1132. [Google Scholar] [CrossRef] [PubMed] [Green Version]
Figure 1.
Farm layout and configuration of measurements. Locations of the TDL/scanners (labeled TS1 and TS2) and retro-reflectors (labeled N1, W1, E1, E2) and sonic anemometers (triangles) are indicated. Dashed lines indicate optical paths. The meteorological station was located at M.
Figure 1.
Farm layout and configuration of measurements. Locations of the TDL/scanners (labeled TS1 and TS2) and retro-reflectors (labeled N1, W1, E1, E2) and sonic anemometers (triangles) are indicated. Dashed lines indicate optical paths. The meteorological station was located at M.
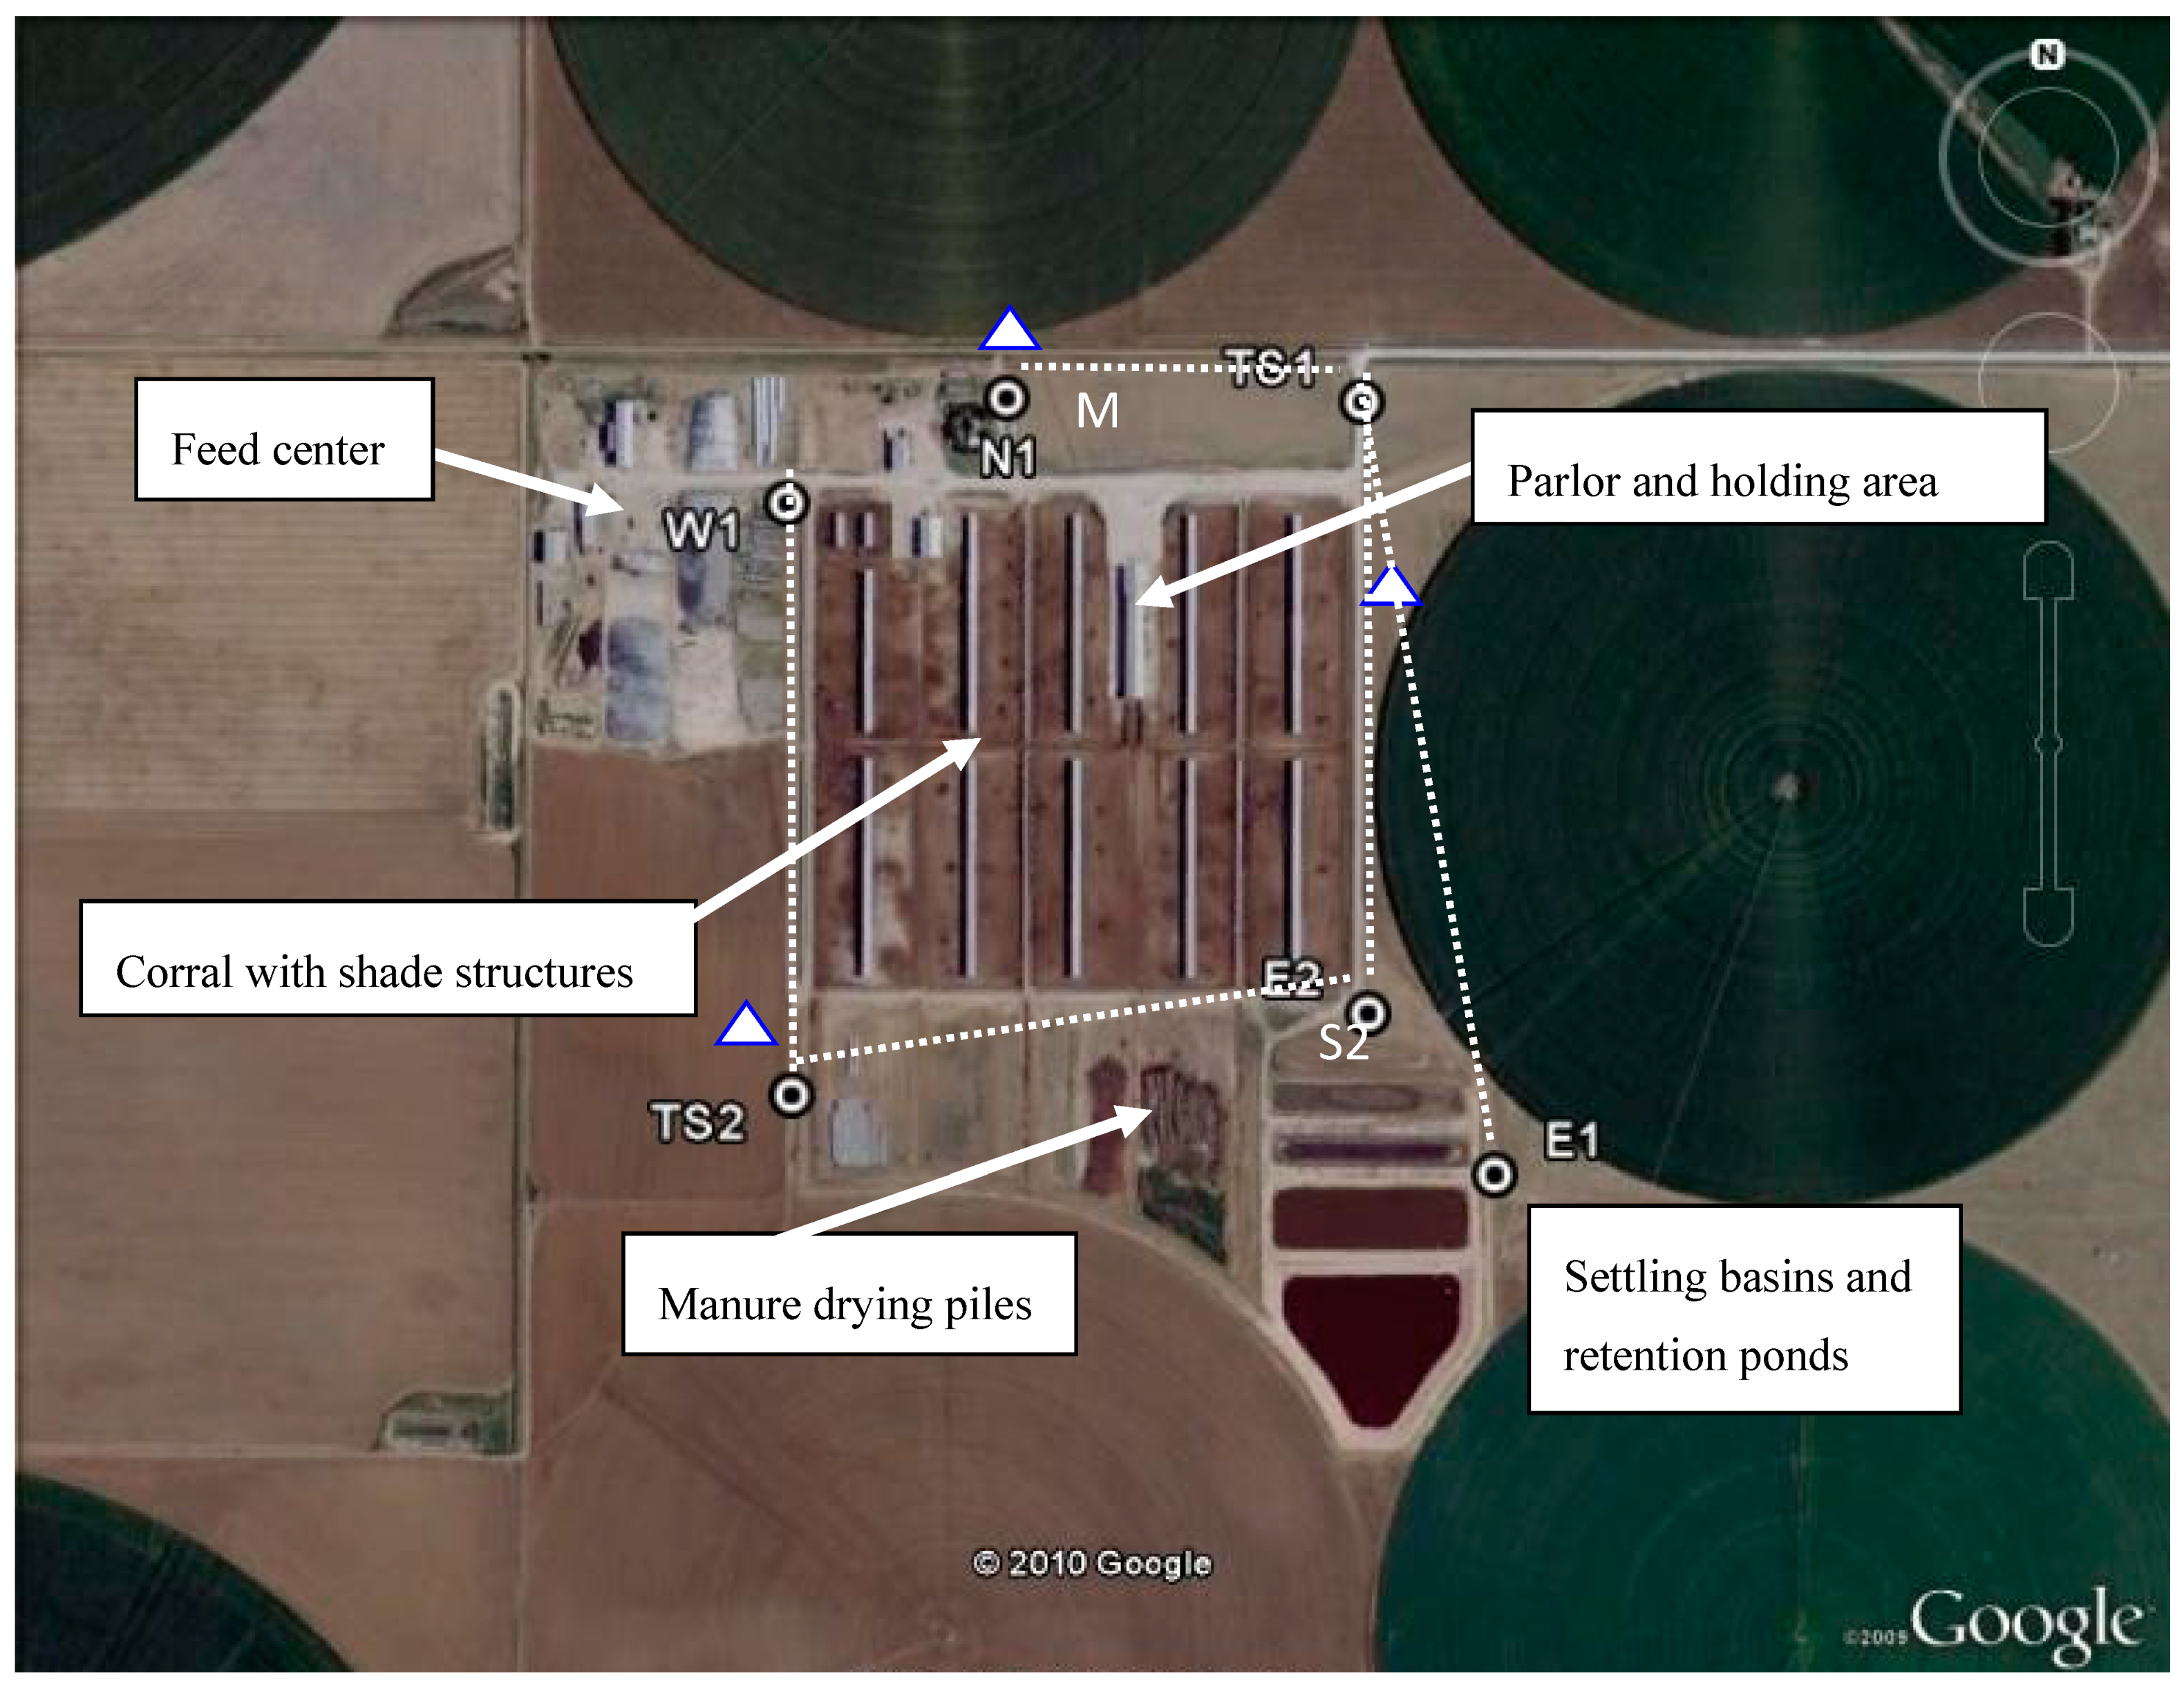
Figure 2.
Turbulence characteristics with wind direction. The variation in the calculated half-hour mean zo (A) and homogeneity of half-hour mean σw (B) are indicated based on measurements of the north sonic anemometer. The influence of the corral infrastructure on the roughness is evident for winds coming from the south.
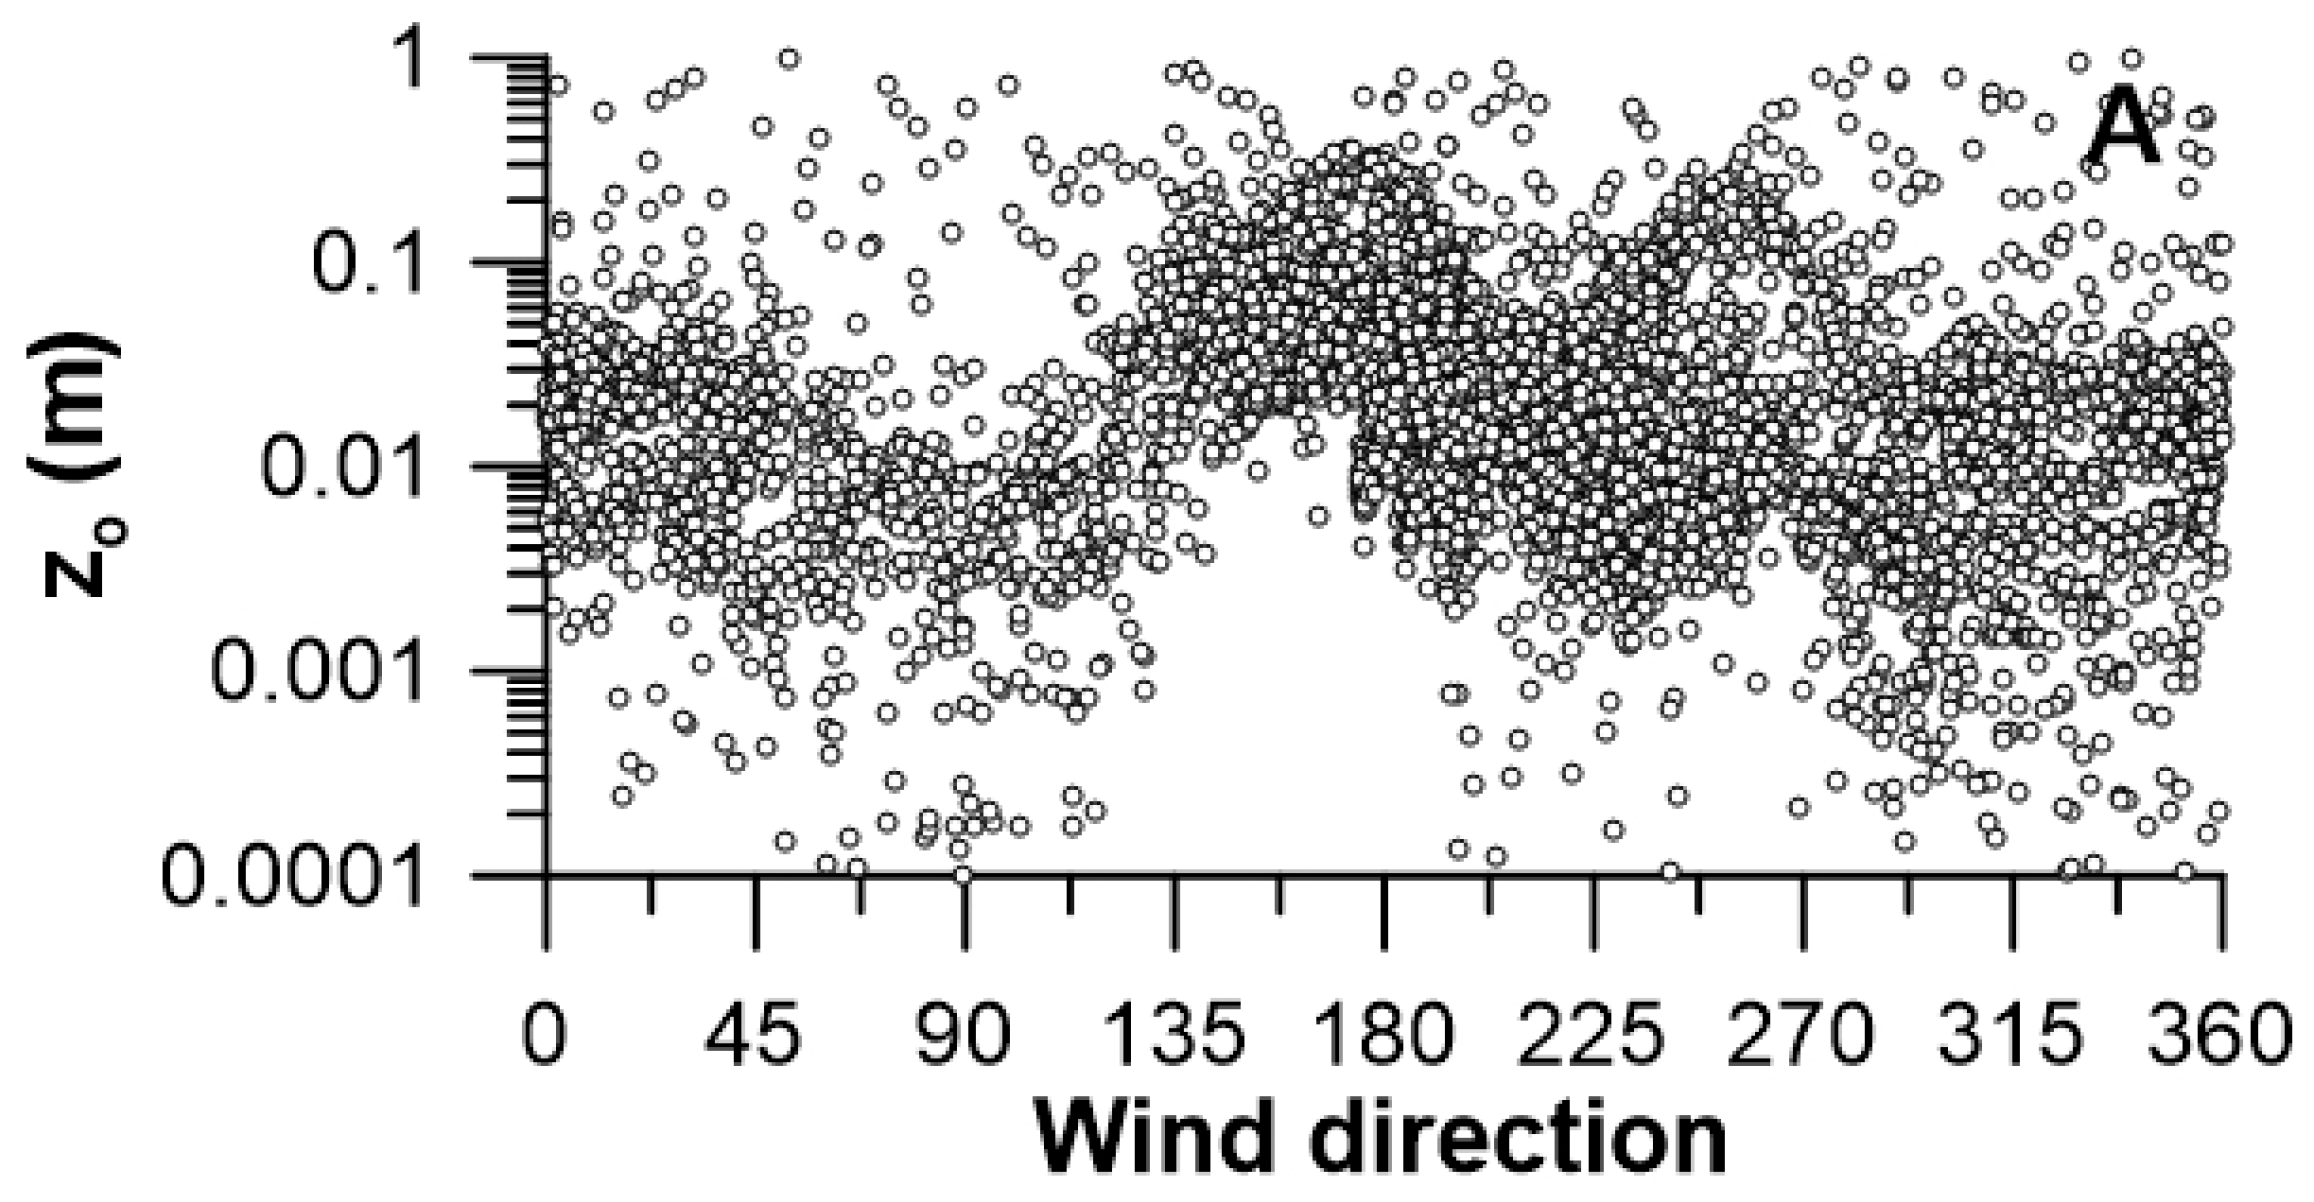
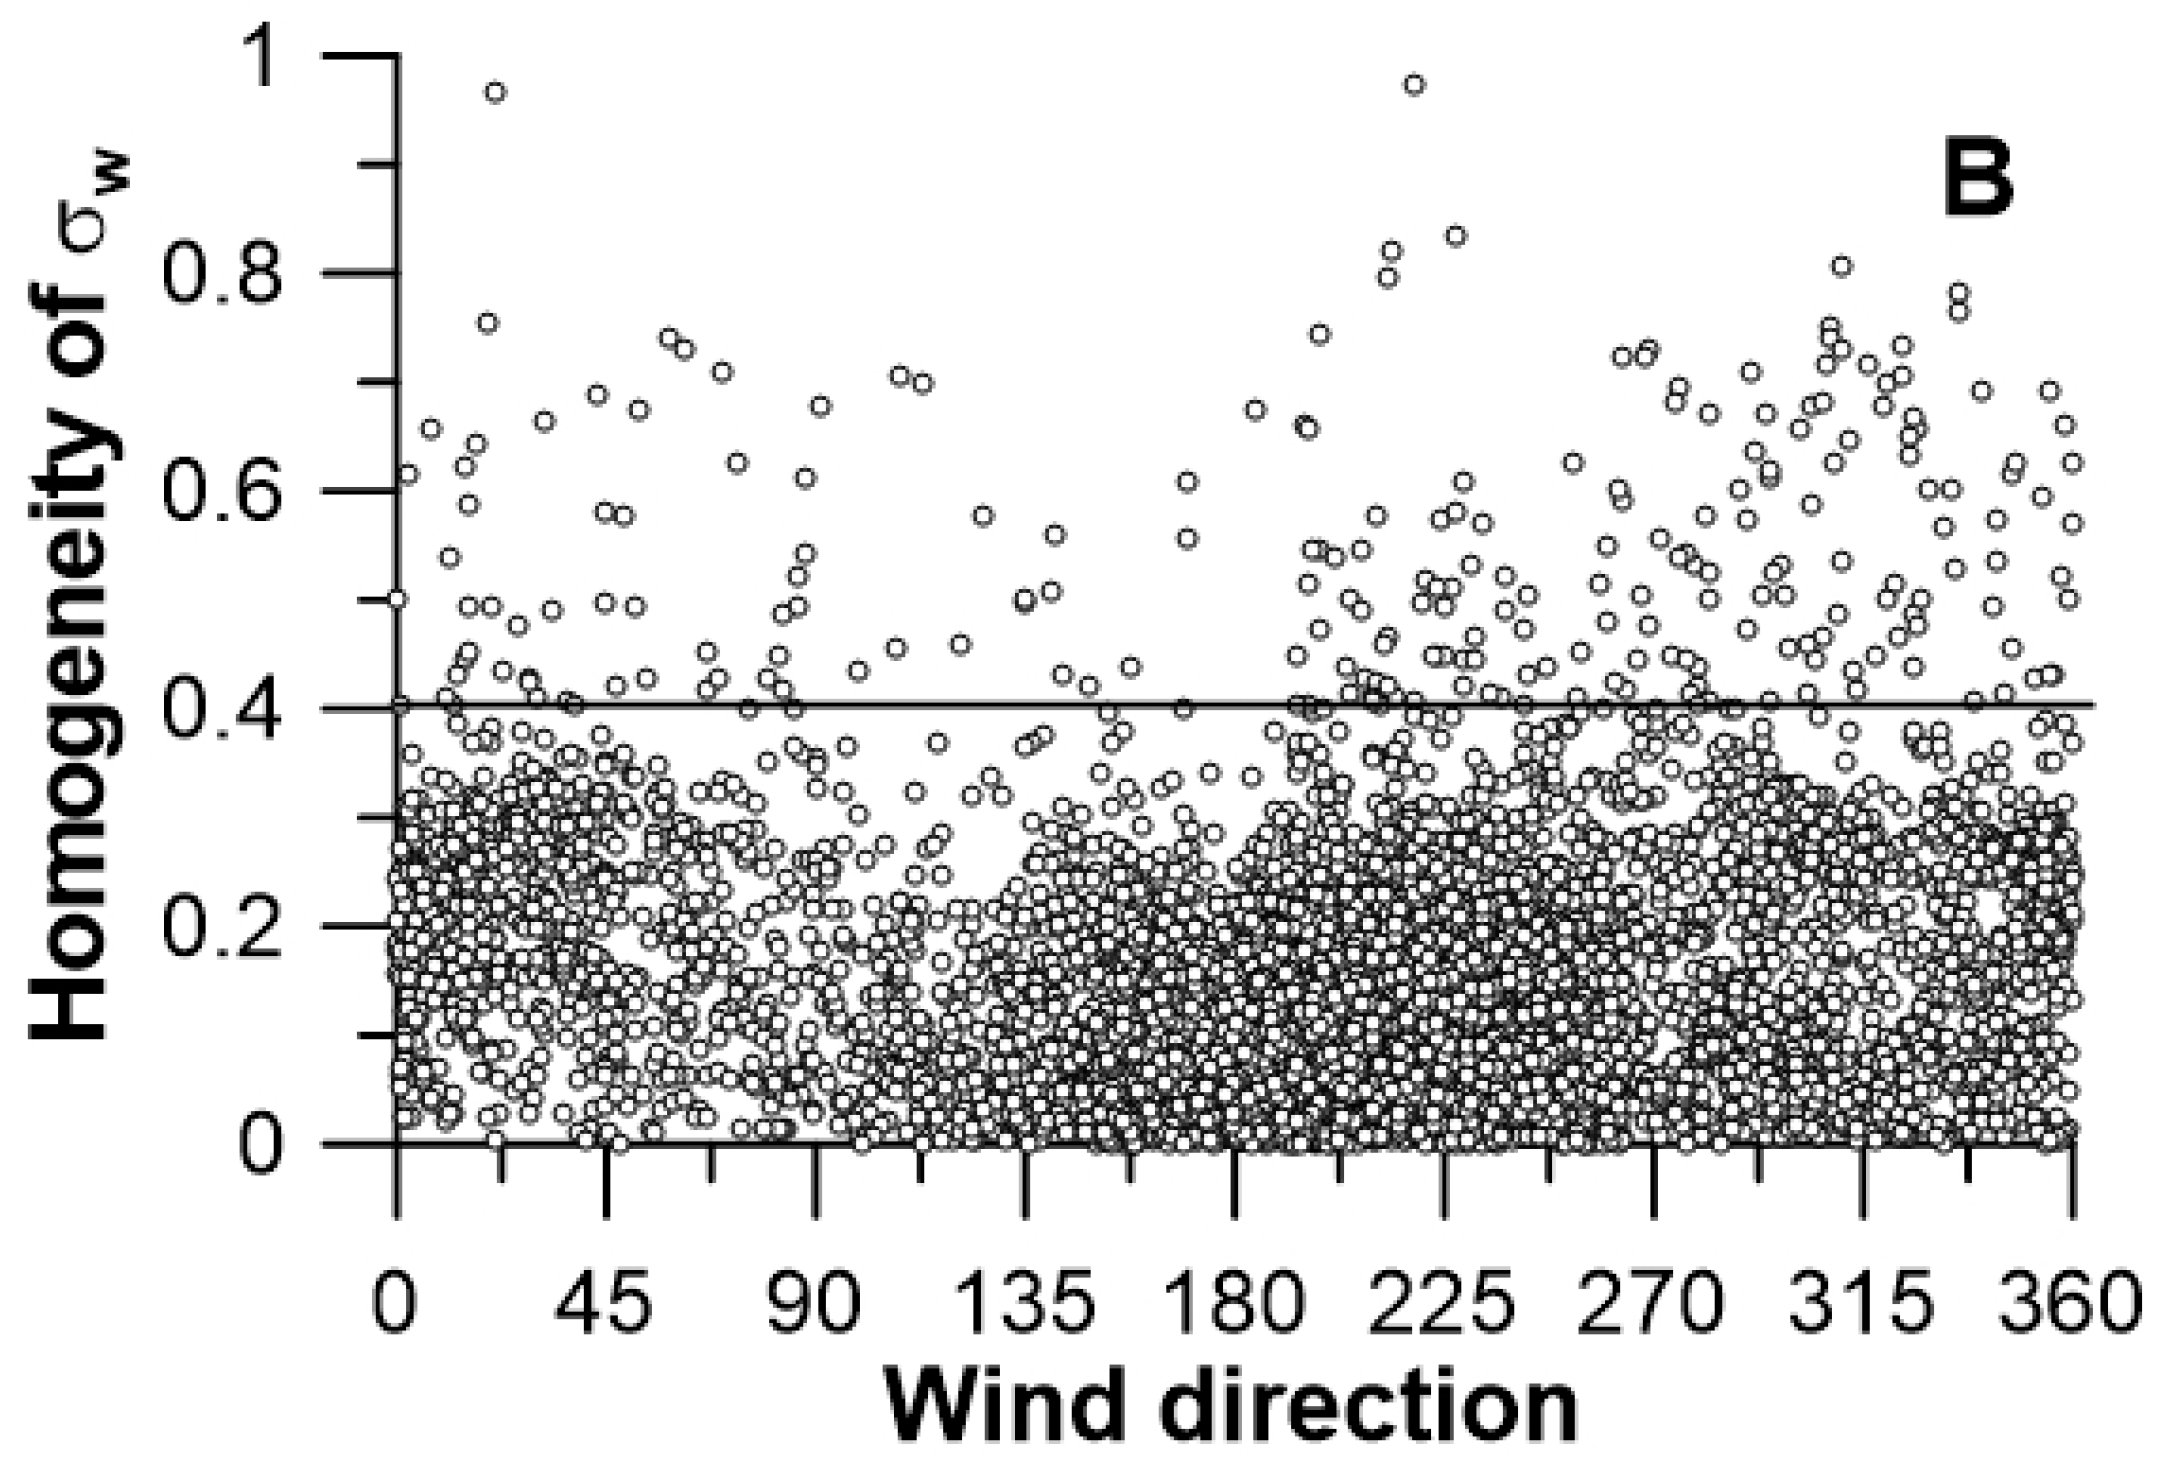
Figure 3.
Influence of wind direction on NH3 emissions. Variation in half-hour NH3 emissions (small filled circles), daily NH3 emissions (filled large circles) and representative daily NH3 emissions (open large circles) are illustrated in panel (A). The air temperatures during the half-hour NH3 emission (small filled circles) and daily emissions (large filled circles) are indicated in panel (B).
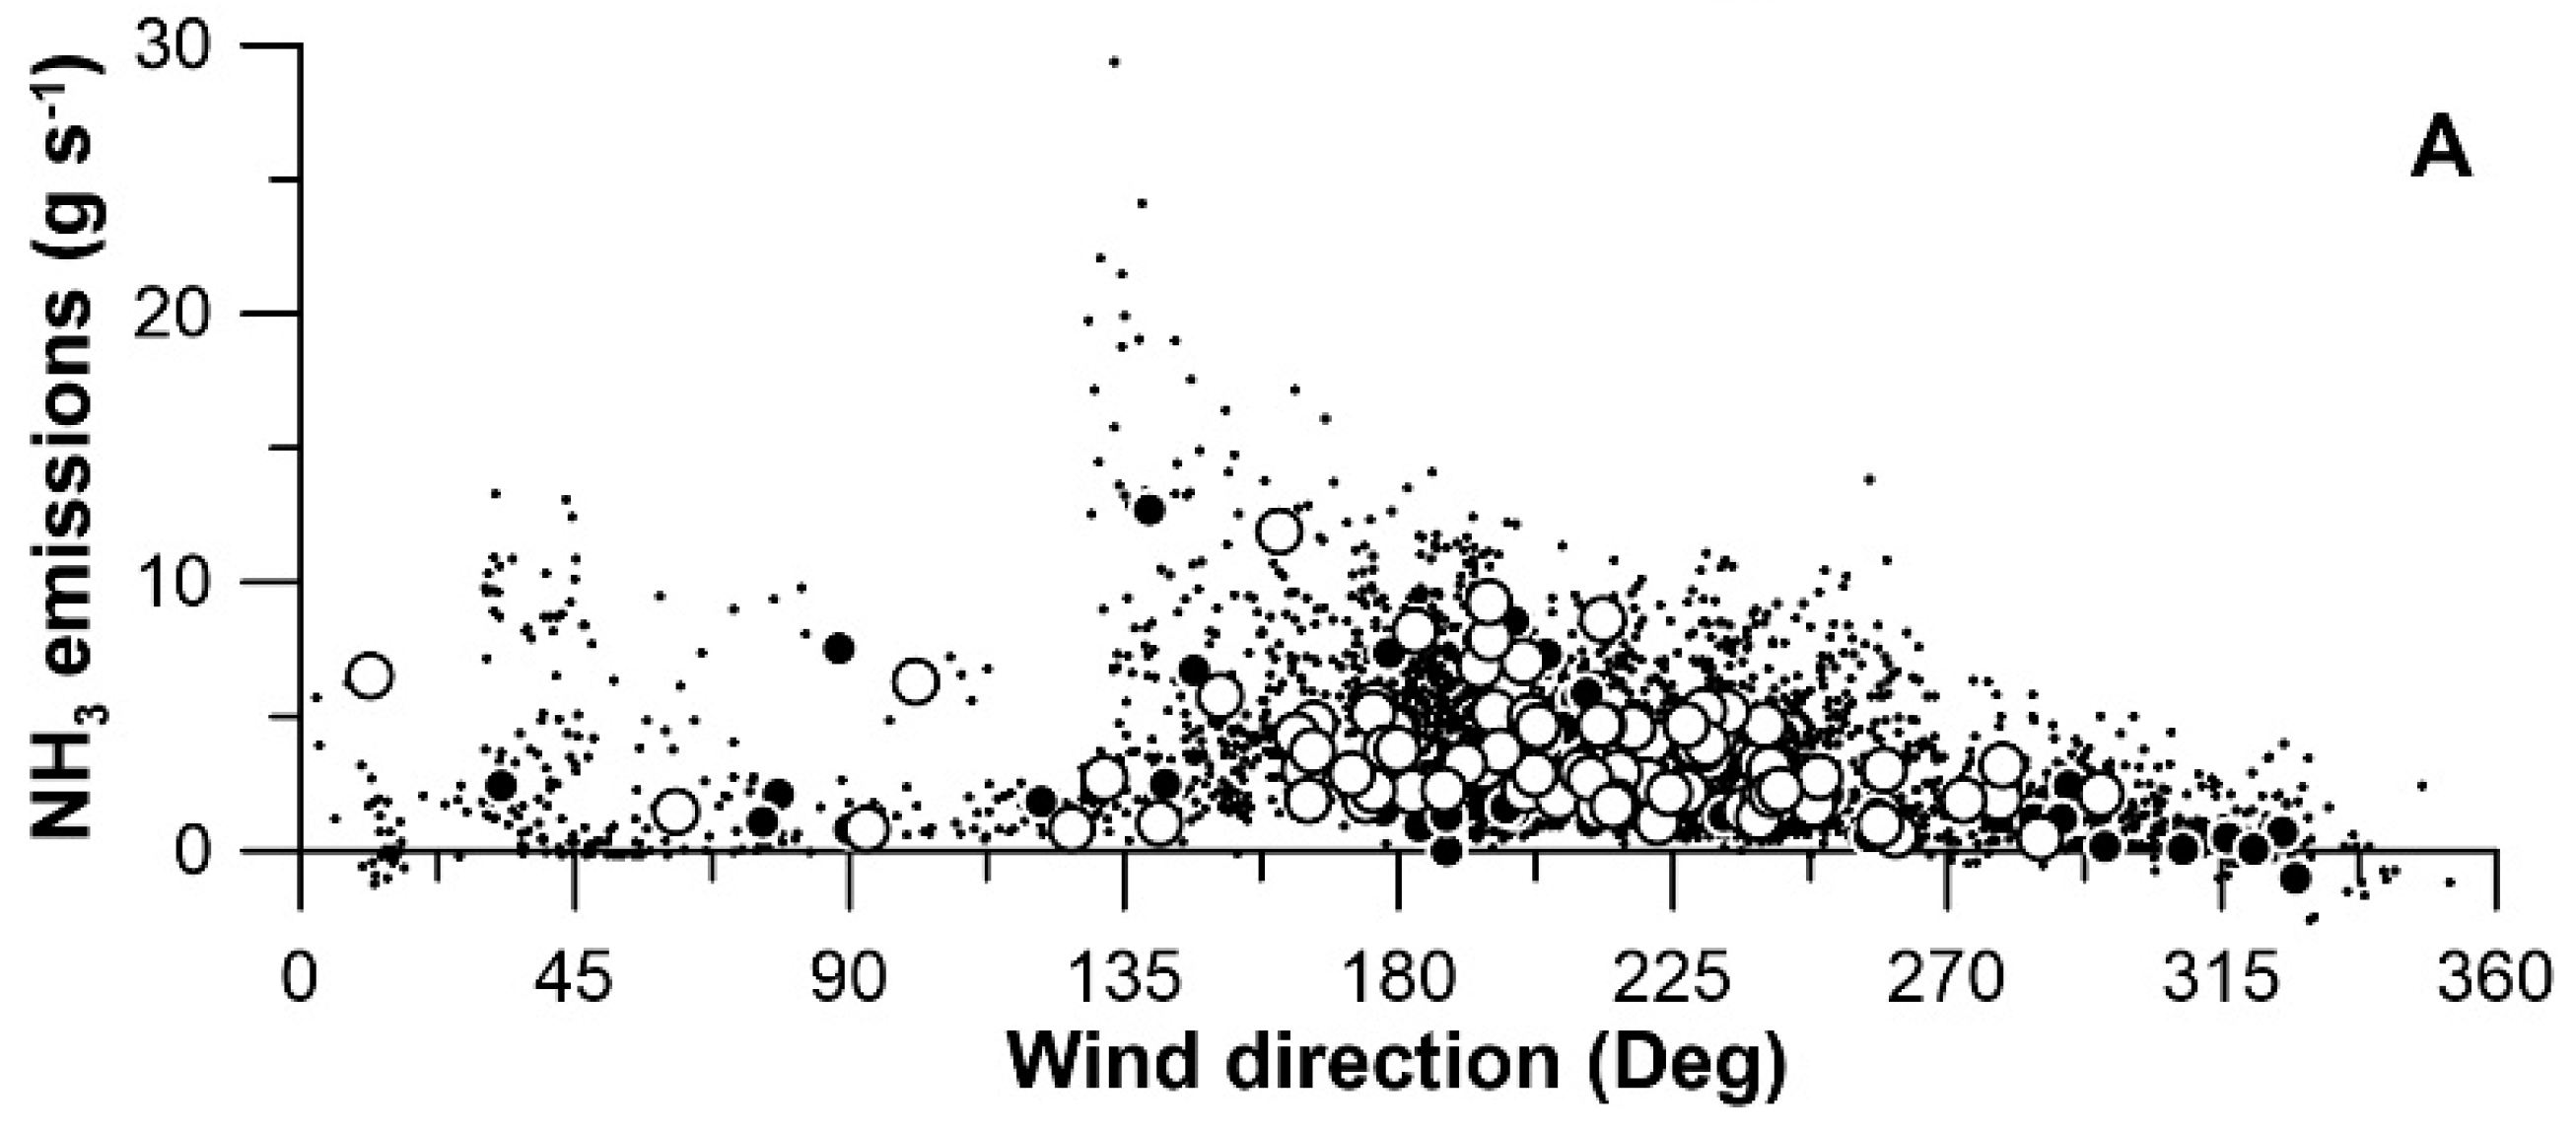
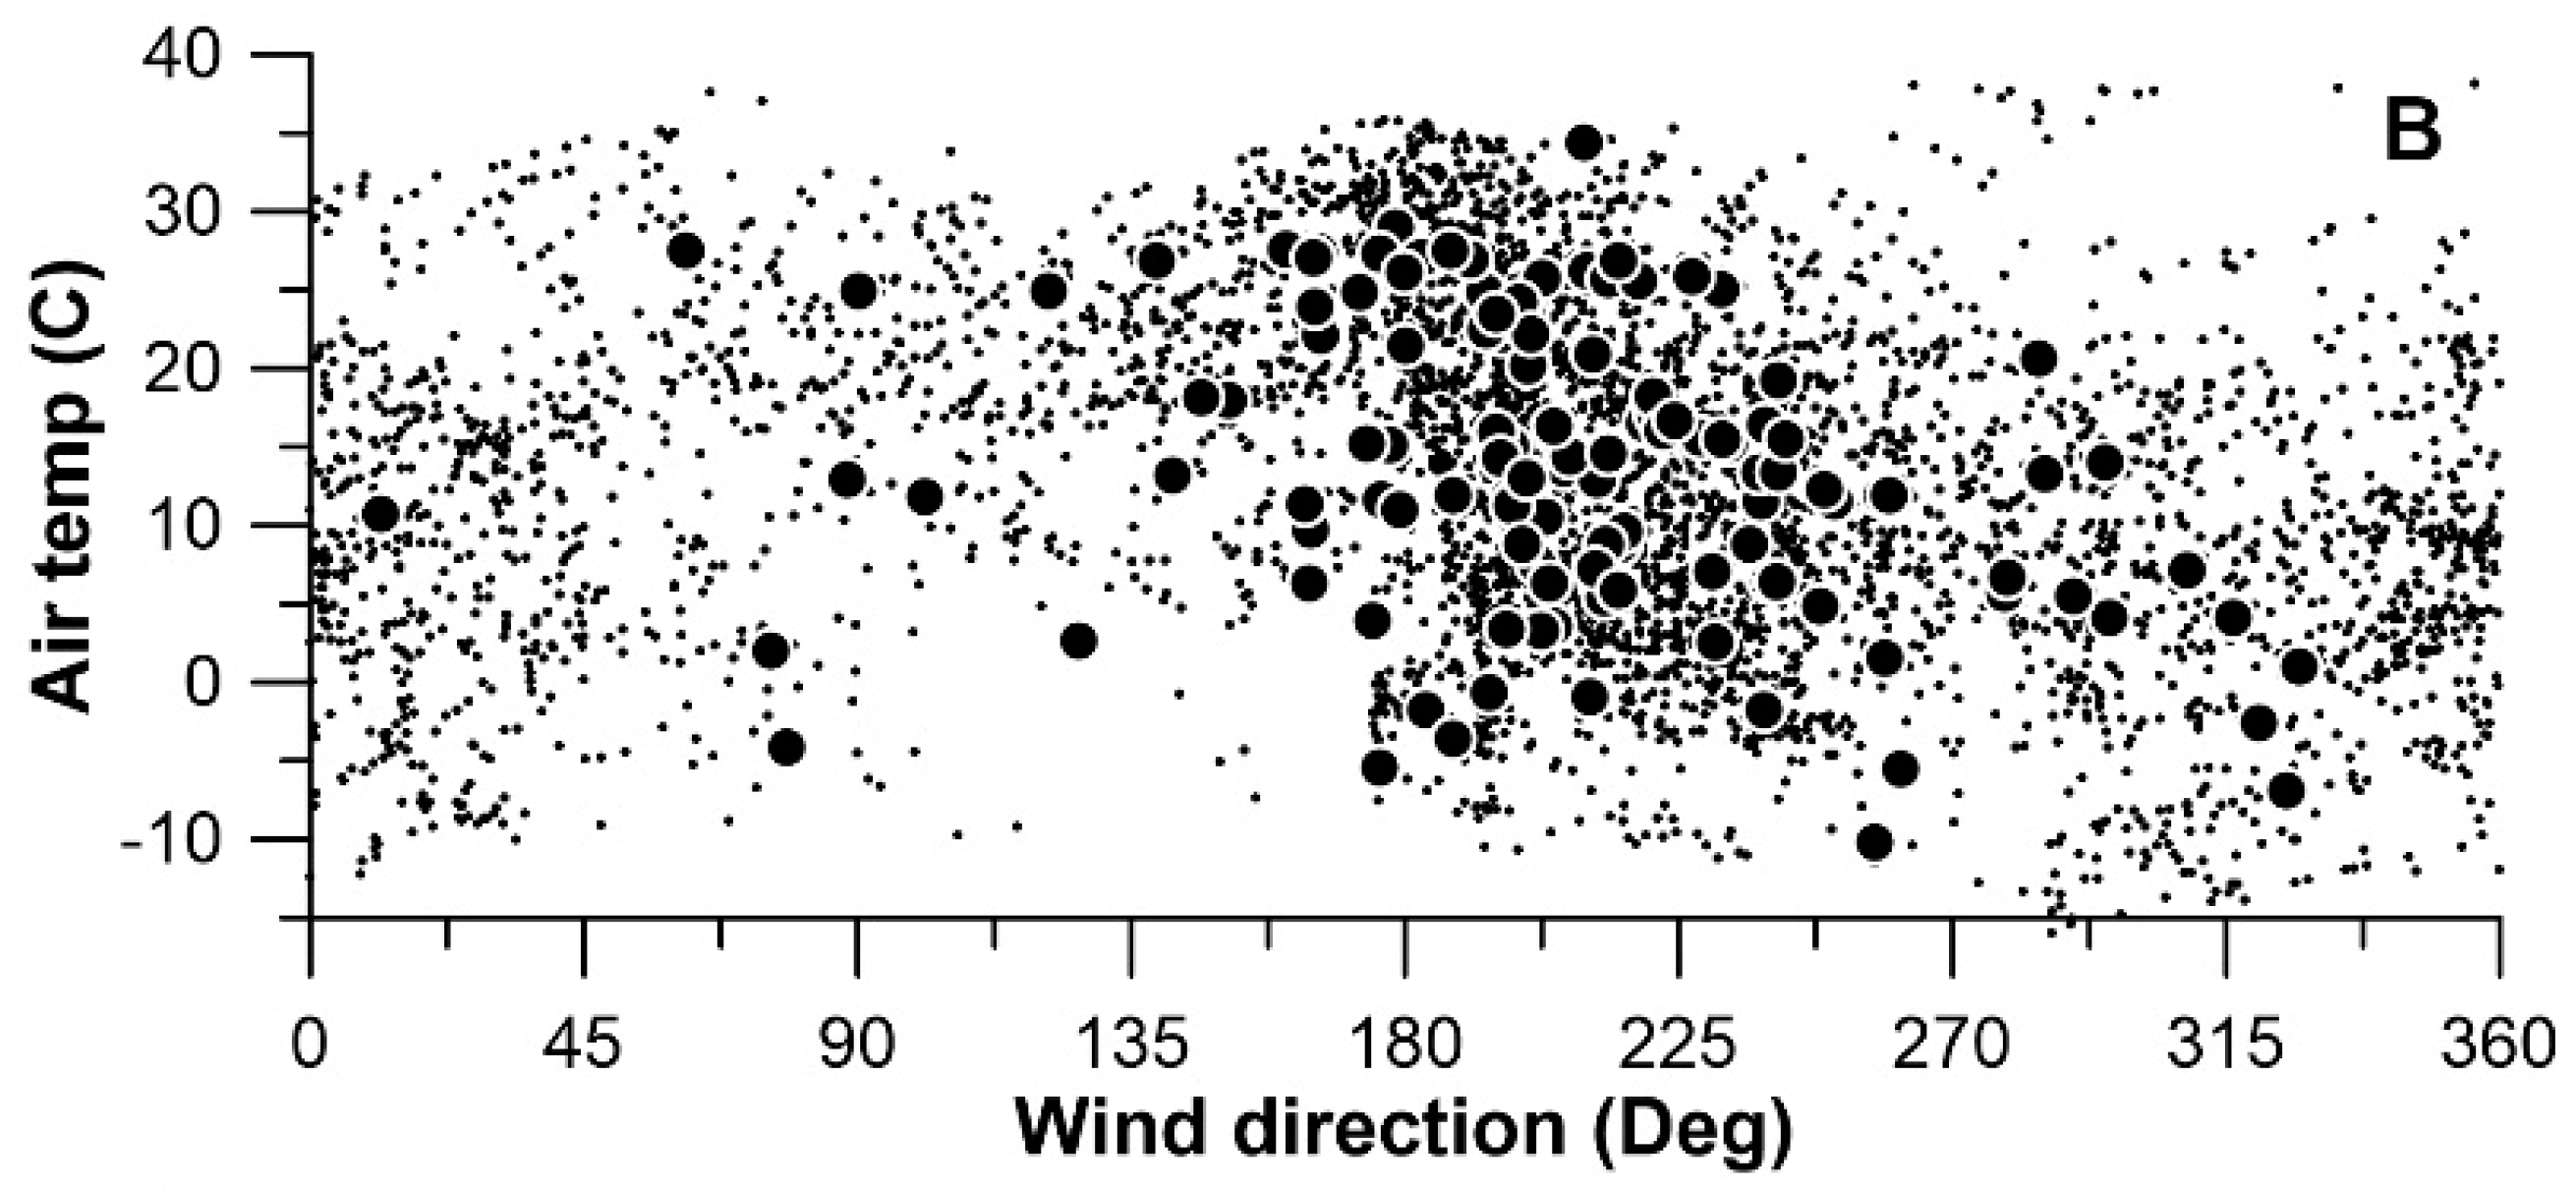
Figure 4.
Influence of air temperature, wind speed and saturation water vapor deficit on half-hourly NH3 emissions. Panel (A) illustrates the correlation between air temperature at 1 m height and 30-min mean emissions (open circle) and the best-fit emissions estimation model including only air temperature as variate (Equation (3); solid line). Panels (B,C) illustrate the relationship between the measured and modeled emissions and wind speed and saturation water vapor deficit (open circles). The ratio of measured and modeled emission (Qmeas/Qest) was classified (wind speed at 0.5 ms−1 intervals and water vapor deficit at 0.5 gm−3 intervals) with mean and standard deviation of the mean of each classified bin indicated. Linear regressions of the classified wind speed (between 0 and 8 ms−1) on Qmeas/Qest had an R2 of 0.05. Linear regressions of the classified vapor deficit (between 0 and 3.5 gm−3) on Qmeas/Qest had an R2 of 0.02.
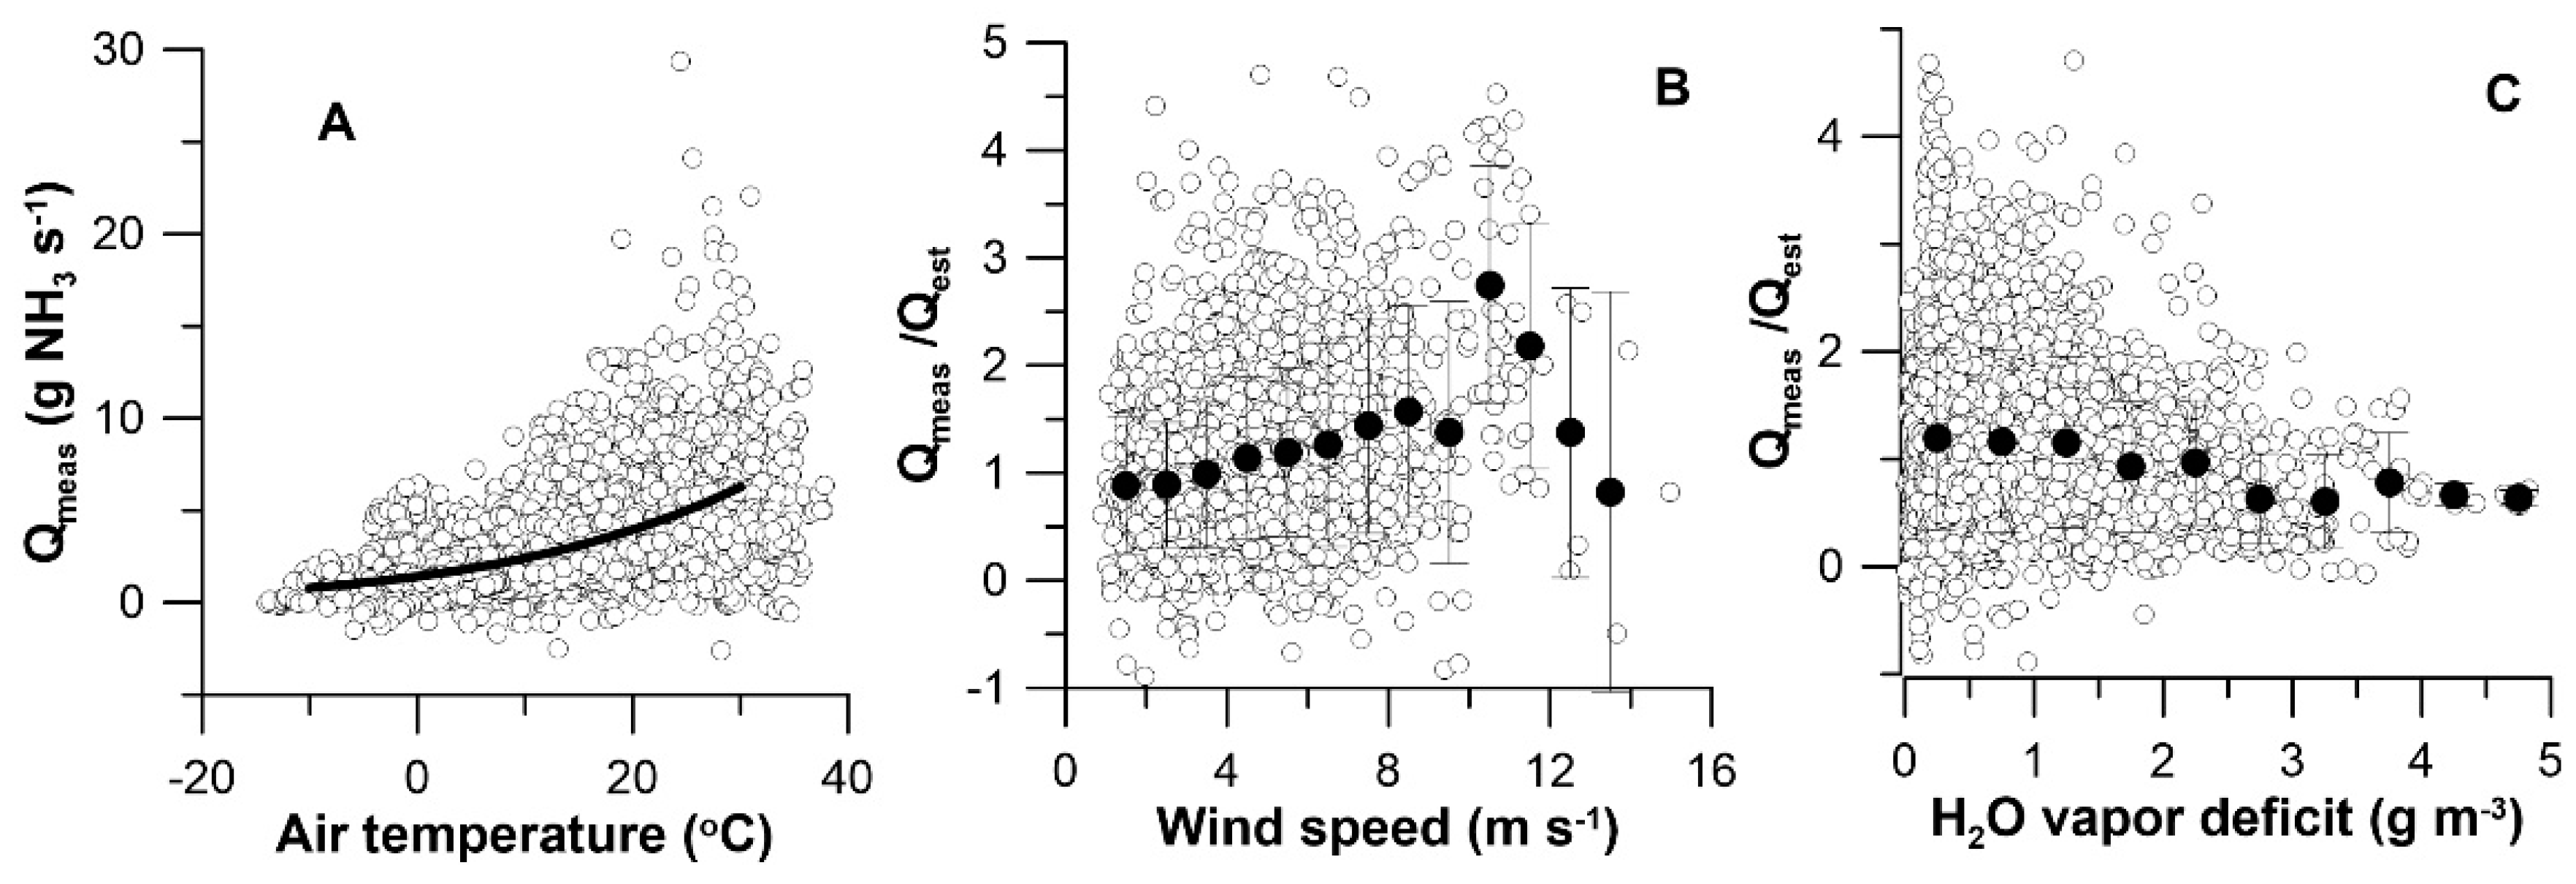
Figure 5.
Diurnal variation in emissions and related variables. The mean hourly air temperature (open square) and wind speed (open triangle) and water vapor density saturation deficit (open circle) is compared against the mean hourly NH3 emissions with TD = 0.4 (solid circles). Bars represent one standard deviation of the hourly measured emissions.
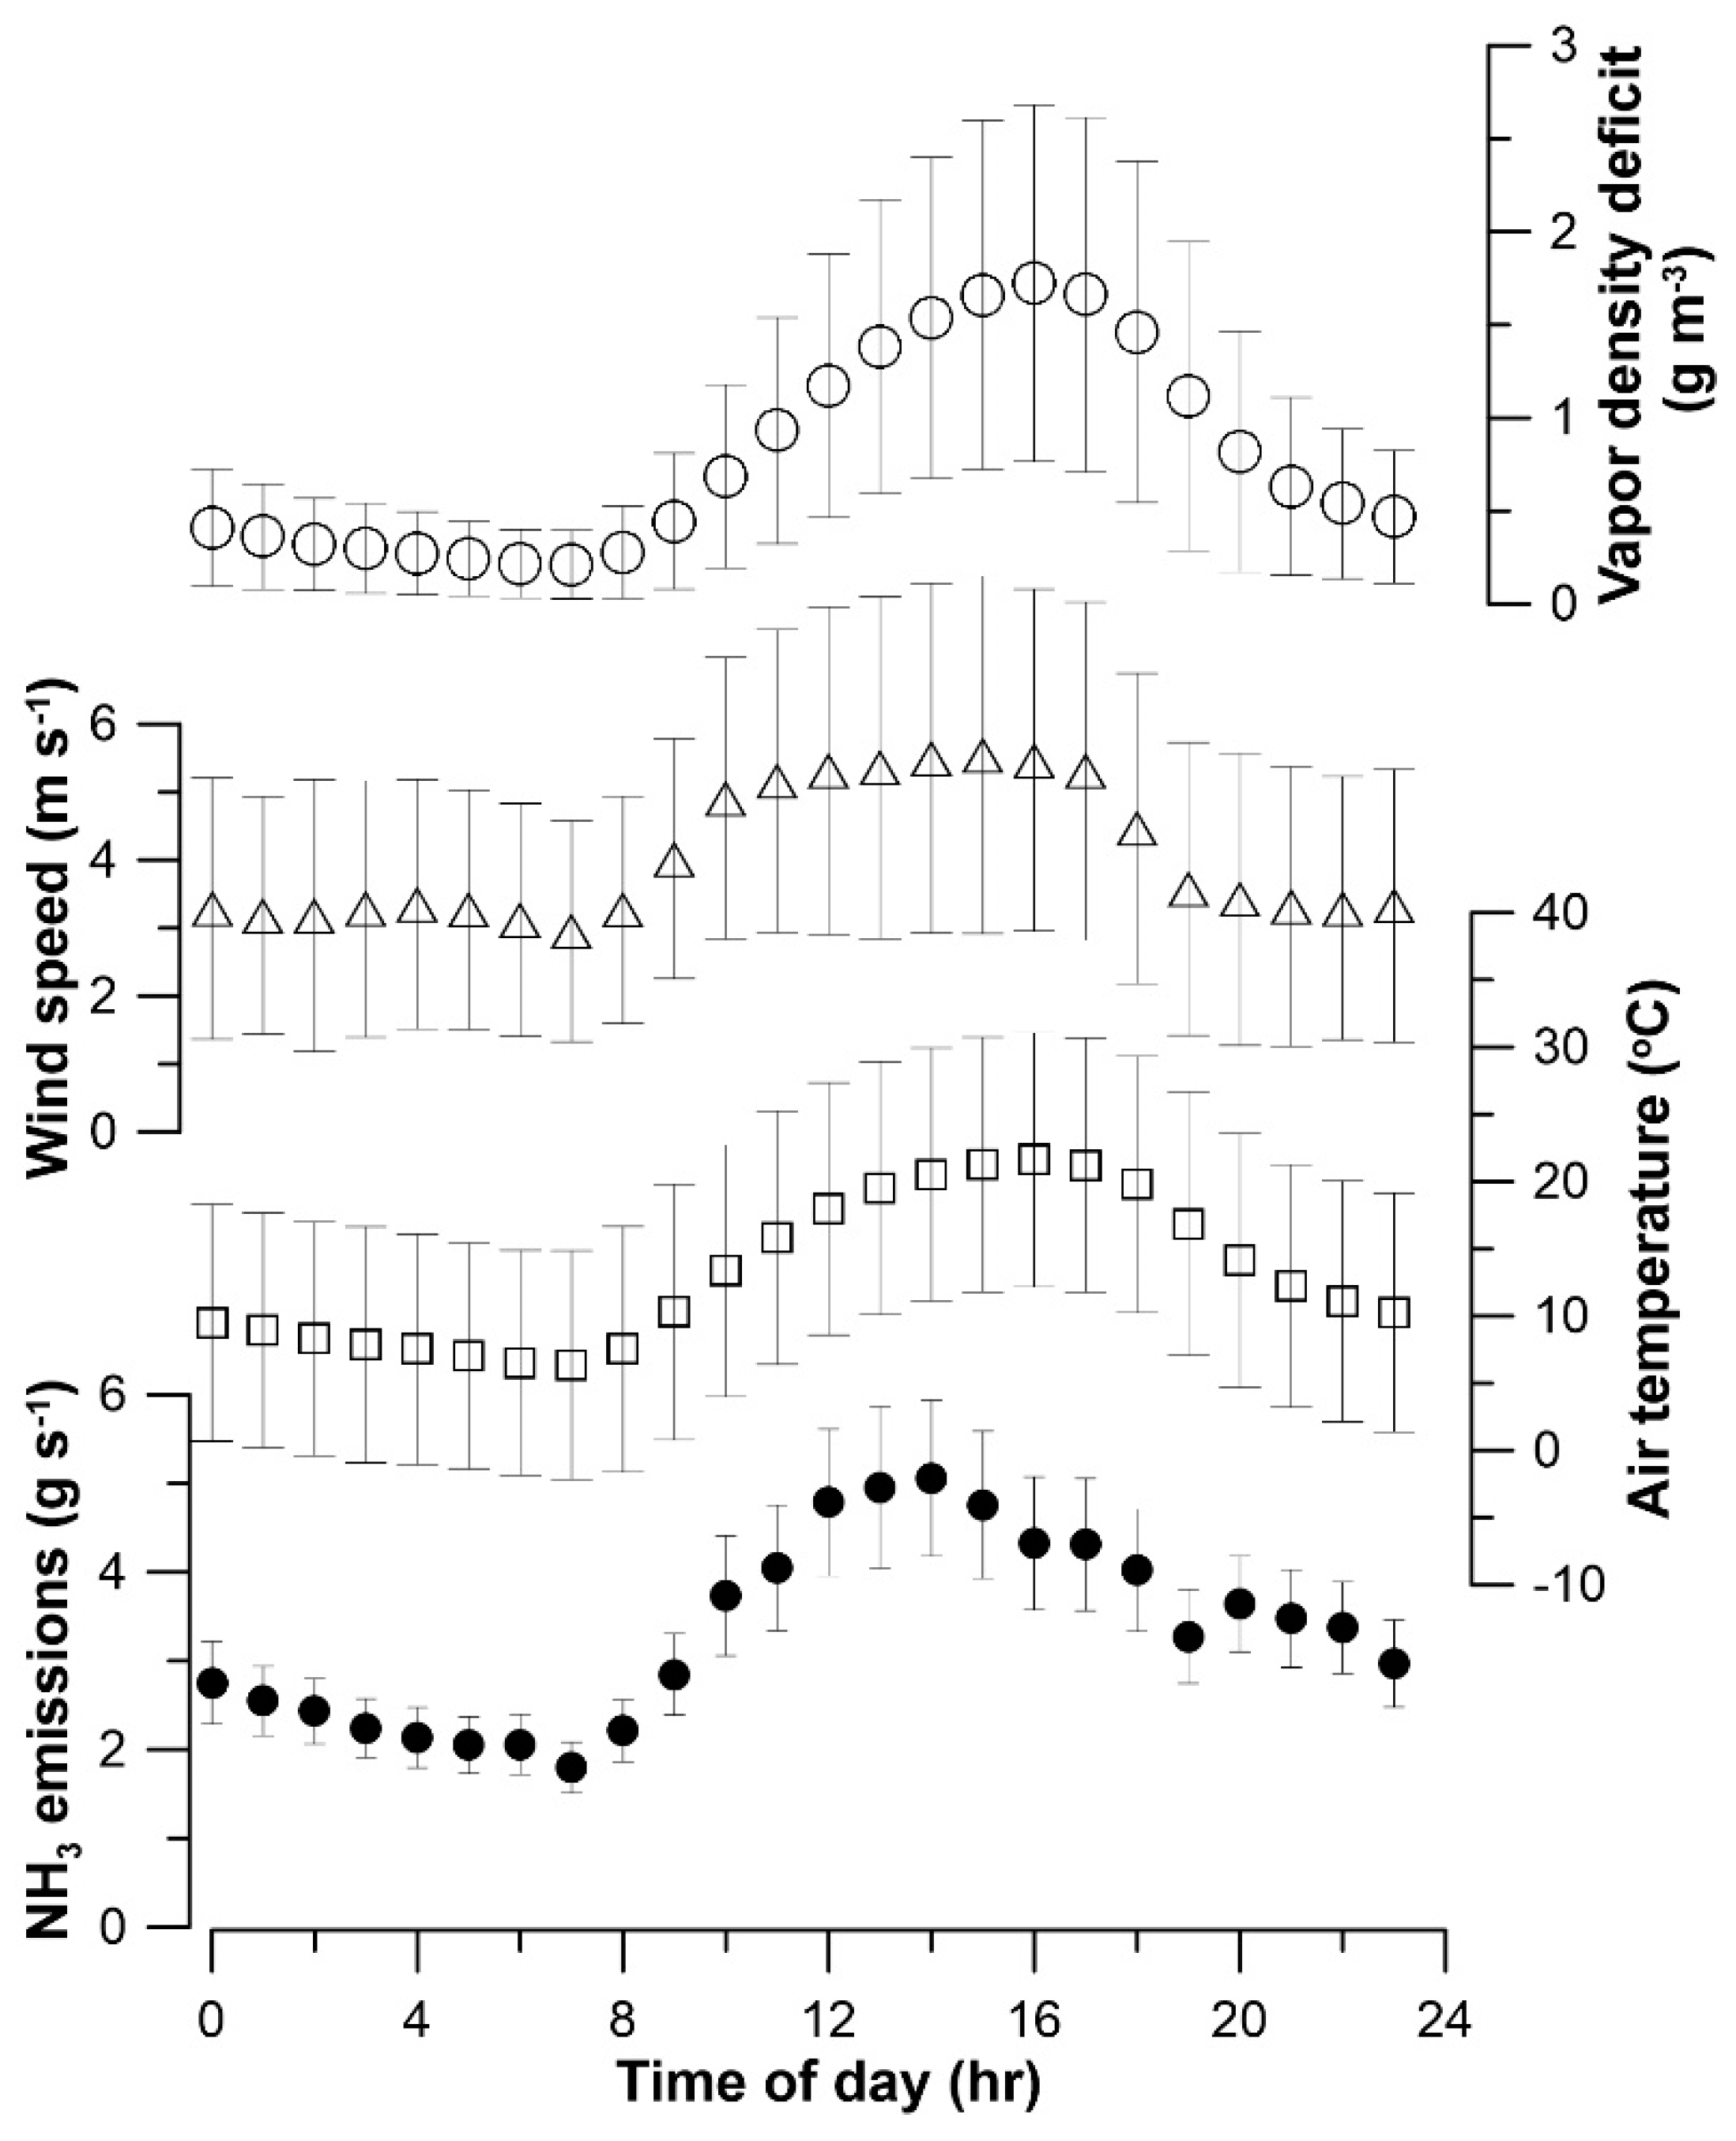
Figure 6.
Influence of air temperature, wind speed and saturation water vapor deficit on daily NH3 emissions. Panel (A) illustrates the correlation between daily mean air temperature at 1 m height and daily mean emissions (open circle) and the best-fit emissions estimation model including only air temperature as variate (Equation (3) with α = 0.55; solid line). Panels (B,C) illustrate the relationship between the measured and modeled emissions and wind speed and saturation water vapor deficit (open circles). The ratio of measured and modeled emission (Qmeas/Qest) was classified (wind speed at 1 ms−1 intervals and water vapor deficit at 0.5 gm−3 intervals) with mean and standard deviation of the mean of each classified bin indicated. Linear regressions of the classified wind speed (between 4 and 7 ms−1) on Qmeas/Qest had an R2 of 0.05. Linear regressions of the classified vapor deficit (between 0 and 3 gm−3) on Qmeas/Qest had an R2 of 0.18.
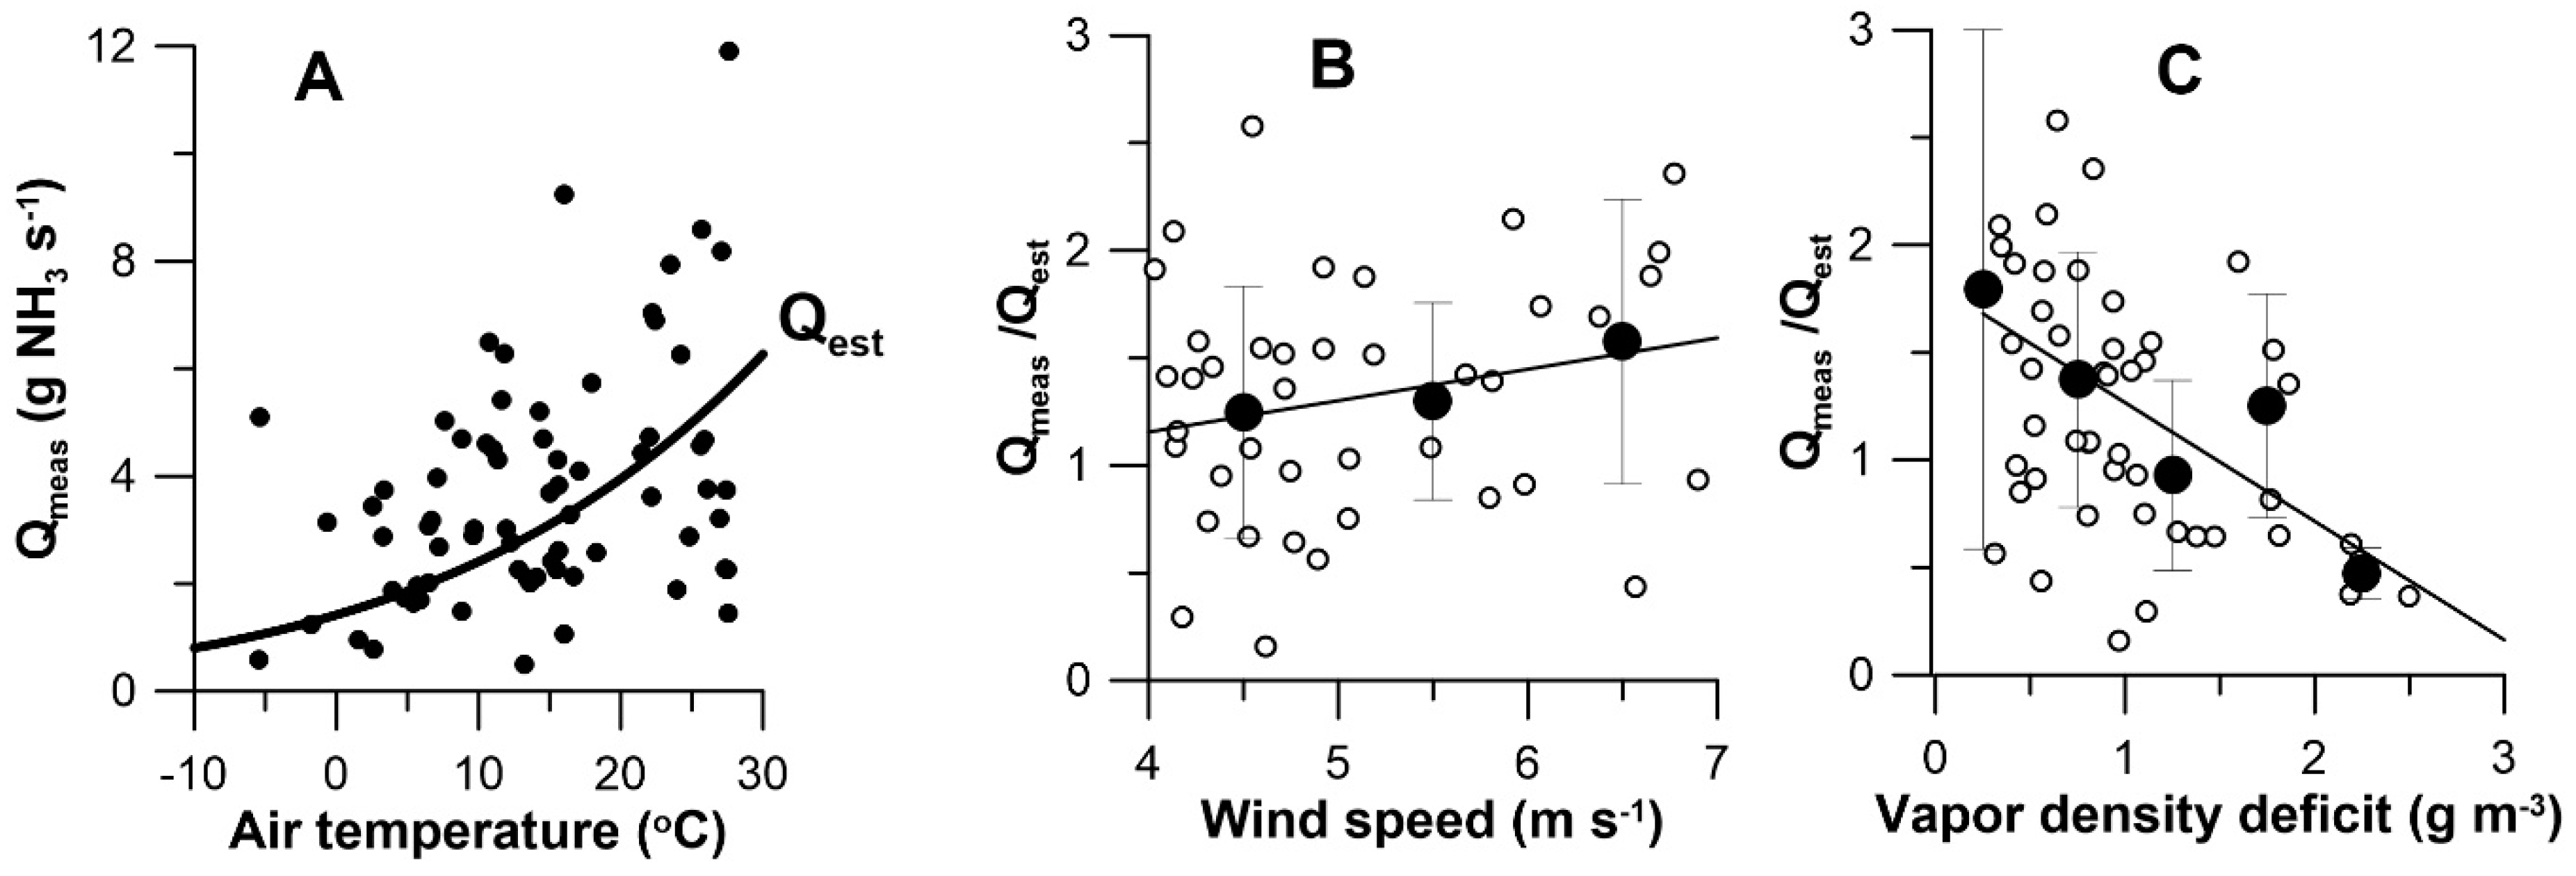
Figure 7.
Model response surface of air temperature and saturation water vapor deficit on measured daily NH3 emissions. Daily emission measurements for representative days are mapped onto the response surface of the model defined by Equation (2).
Figure 7.
Model response surface of air temperature and saturation water vapor deficit on measured daily NH3 emissions. Daily emission measurements for representative days are mapped onto the response surface of the model defined by Equation (2).
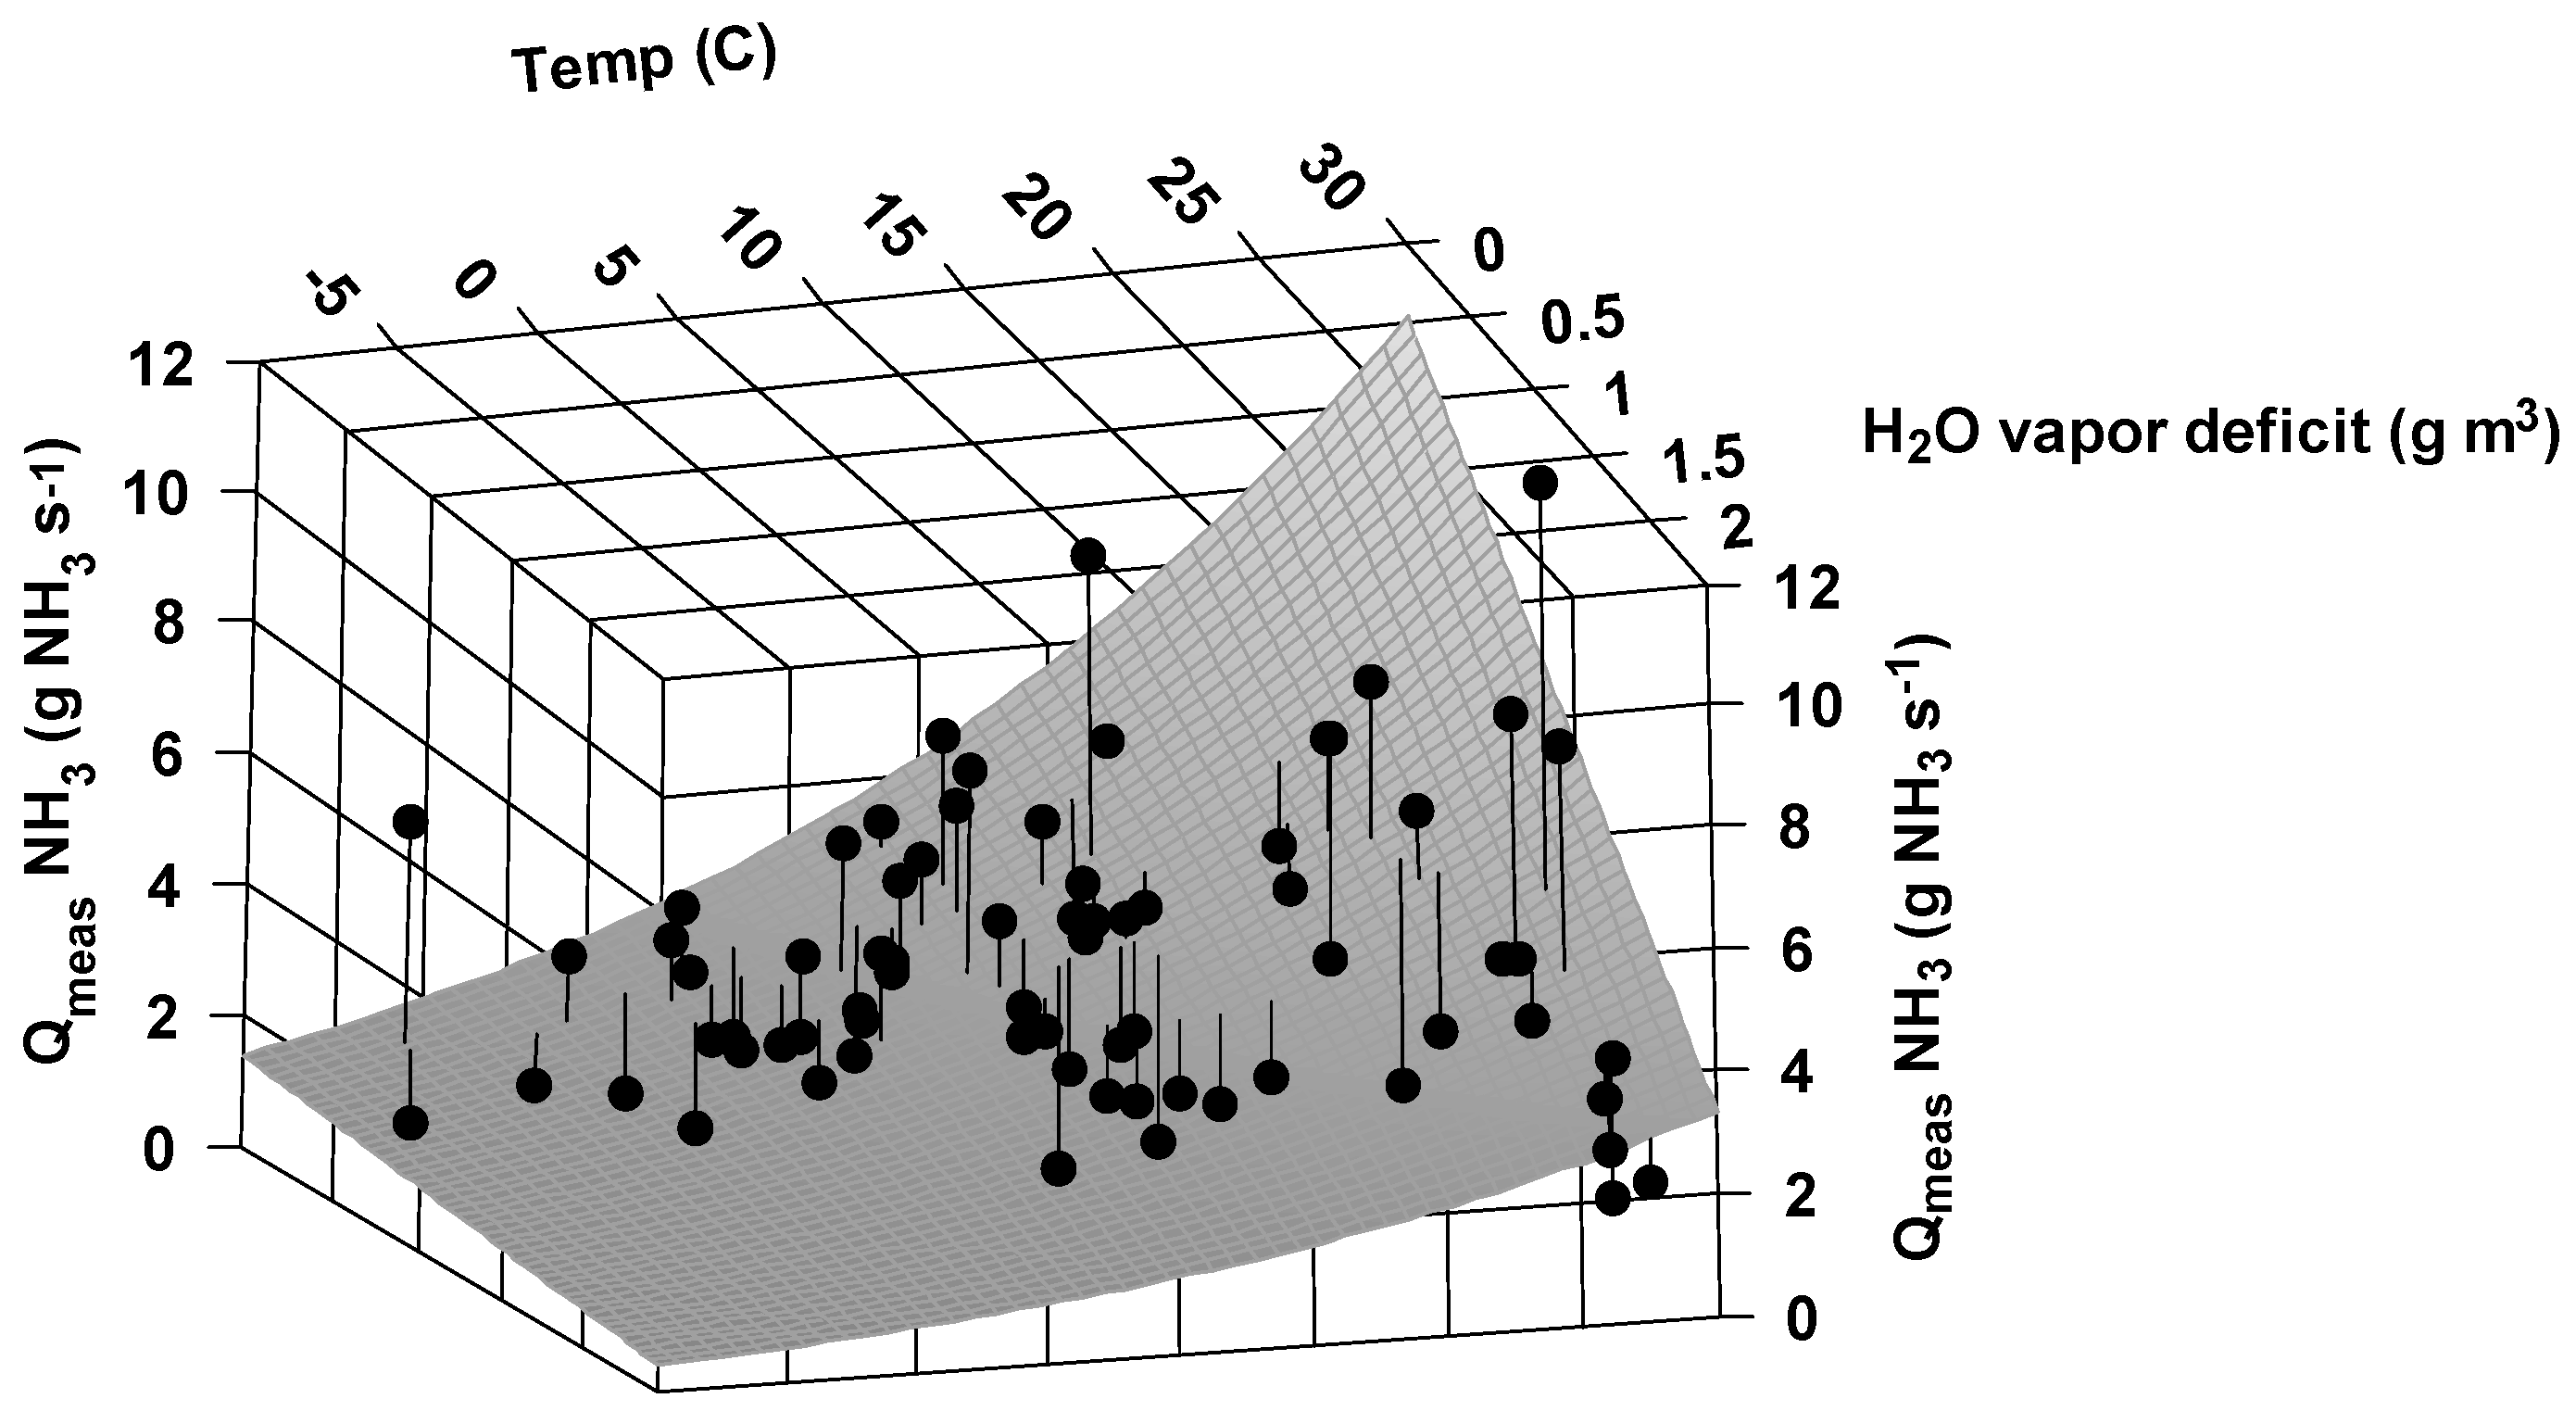
Figure 8.
Daily NH3 emissions. Representative daily mean emissions based on a touchdown fraction (TD) threshold of 0.4 and minimum of 24 half-hourly measurements per day (solid circles) as well as emission with fewer measurements per day (open circles) are indicated in Panel (A). Datum labels in panel A indicate specific major activity on the farm from Table 1. Daily emissions model error for representative days (≥24 measurements/day, TD > 0.4) are indicated in Panel (B) with datum labels indicating the associated mean daily wind speed.

Table 1.
Producer activities during measurement periods.
| Measurement Period (mm/dd/yy) | # Days on Site | Date (mm/dd/yy): Activity | Animal Inventory |
|---|---|---|---|
| 2: 9/19–11/6/07 | 47 | 10/22/07–10/26/07: Major manure scraping and haul to windrows | 3435 |
| 3: 1/8–1/23/08 | 14 | No major activities | 3342 |
| 4: 4/1–4/23/08 | 20 | No major activities | 3450 |
| 5: 6/10–7/1/08 | 19 | 6/19/08: Manure scraping and haul to windrows 6/28/08: Vacuum concrete skirts 6/29/08: Vacuum concrete skirts 6/30/08: Manure scraping and haul to windrow | 3384 |
| 6:10/15–11/4/08 | 19 | No major activities | 3594 |
| 7a: 12/16/08–1/6/09 | 20 | No major activities | 3606 |
| 7b: 1/27–2/19/09 | 22 | No major activities | 3535 |
| 8: 2/19–3/18/09 | 27 | No major activities | 3623 |
| 9: 8/3–8/27/09 | 12 | 8/9/09–8/13/2009: Manure scraping and haul to windrows | 3463 |
Table 2.
Characteristics of the TDL path NH3 concentrations.
| Wind Direction | Optical Path | ||||
|---|---|---|---|---|---|
| TS1-N1 | TS1-E1 | TS1-E2 | TS2-S2 | TS2-W1 | |
| Mean (μg m−3) | |||||
| 0°–45° | 22 | 18 | 18 | 92 | 130 |
| 45°–90° | 47 | 28 | 21 | 81 | 223 |
| 90°–135° | 81 | 32 | 18 | 128 | 262 |
| 135°–180° | 1673 | 46 | 45 | 83 | 113 |
| 180°–225° | 177 | 107 | 183 | 96 | 33 |
| 225°–270° | 70 | 142 | 375 | 71 | 14 |
| 270°–315° | 22 | 130 | 259 | 89 | 19 |
| 315°–360° | 20 | 38 | 77 | 150 | 47 |
| Downwind 1 | 172 | 136 | 317 | 121 | 243 |
| Upwind 2 | 36 | 28 | 48 | 90 | 17 |
| All | 76 | 68 | 125 | 99 | 105 |
1: +/− 45° of downwind direction; 2: +/− 45° of upwind direction; 3: italics indicate concentrations along downwind OP.
Table 3.
Aggregate monthly weather conditions during the two-year study.
| Air Temperature | Solar Radiation | Wind Speed | ||||||||
|---|---|---|---|---|---|---|---|---|---|---|
| Month | n 1 | Mean Daily (°C) | Mean Daily Maximum (°C) | Mean Daily Minimum (°C) | n 1 | Mean Daily (Wm−2) | Mean Daily Maximum (Wm−2) | n 1 | Mean Daily (m s−1) | Mean daily Maximum (m s−1) |
| Jan | 19 | 0.1 | 21.7 | −16.3 | 22 | 135 | 566 | 20 | 4.11 | 11.79 |
| Feb | 9 | 8.3 | 26.1 | −9.8 | 28 | 184 | 725 | 26 | 4.51 | 15.85 |
| Mar | 14 | 7.2 | 24.1 | −11.8 | 17 | 197 | 819 | 17 | 4.33 | 13.50 |
| Apr | 20 | 11.5 | 30.3 | −2.8 | 20 | 264 | 907 | 18 | 4.61 | 15.39 |
| May | - | - | - | - | - | - | - | - | - | - |
| Jun | 19 | 23.7 | 38.7 | 11.5 | 19 | 316 | 1017 | 18 | 3.95 | 12.39 |
| Jul | 1 | 20.7 | 28.1 | 15.1 | 1 | 235 | 1052 | 1 | 2.99 | 5.85 |
| Aug | 20 | 24.1 | 36.0 | 11.5 | 20 | 279 | 978 | 11 | 3.96 | 8.40 |
| Sep | 10 | 20.1 | 32.4 | 8.5 | 10 | 231 | 862 | 2 | 2.46 | 6.53 |
| Oct | 46 | 13.9 | 31.9 | −3.2 | 46 | 197 | 761 | 36 | 3.58 | 11.06 |
| Nov | 10 | 10.4 | 26.7 | −6.1 | 10 | 159 | 667 | 9 | 3.29 | 8.90 |
| Dec | 14 | 3.4 | 24.3 | −13.8 | 14 | 103 | 492 | 13 | 4.83 | 13.94 |
1: Days of measurement.
Table 4.
Solid manure analyses.
| Percent (Wet Weight Basis) | |||||||
|---|---|---|---|---|---|---|---|
| Date | Sampling Location | n | pH (Mean ± σ) | Total Nitrogen (mean ± σ) | Solids (Mean ± σ) | NH3 (Mean ± σ) | NH3/N (%) |
| 1/30/2008 | Corral | 4 | 6.8 ± 0.1 | N/A 1 | 16.4 ± 0.5 | 0.01 ± 0.01 | |
| 4/25/2008 | Corral | 4 | 7.9 ± 0.2 | N/A | 24.0 ± 3.4 | 0.02 ± 0.01 | |
| 7/24/2008 | Corral | 4 | 8.8 ± 0.1 | N/A | 53.8 ± 17.6 | 0.04 ± 0.03 | |
| 1/14/2009 | Corral | 4 | 7.2 ± 0.1 | 0.47 ±0.17 | 19.8 ± 3.2 | 0.00 ± 0.00 | 0 |
| 3/16/2009 | Corral | 4 | 6.0 ± 0.5 | 0.46 ± 0.21 | 15.1 ± 0.8 | 0.02 ± 0.01 | 4.3 |
| 8/21/2009 | Corral | 4 | 7.0 ± 0.1 | 0.25 ± 0.02 | 16.0 ± 1.0 | 0.01 ± 0.00 | 4.0 |
| 1/30/2008 | Parlor | 4 | 6.7 ± 0.2 | N/A | 15.1 ± 0.5 | 0.01 ± 0.01 | |
| 4/25/2008 | Parlor | 4 | 6.4 ± 0.2 | N/A | 14.4 ± 1.1 | N/D 2 | |
| 7/24/2008 | Parlor | 4 | 6.6 ± 0.3 | N/A | 25.0 ± 17.1 | 0.02 ± 0.01 | |
| 1/14/2009 | Parlor | 4 | 6.6 ± 0.5 | 0.36 ± 0.02 | 16.0 ± 0.3 | 0.02 ± 0.02 | 5.6 |
| 3/16/2009 | Parlor | 4 | 6.3 ± 1.0 | 0.45 ± 0.17 | 17.1 ± 1.8 | 0.05 ± 0.05 | 11.1 |
| 8/21/2009 | Parlor | 4 | 5.8 ± 0.0 | 0.39 ± 0.05 | 14.7 ± 1.0 | 0.02 ± 0.01 | 5.1 |
| 1/30/2008 | Scraping Lane | 4 | 6.8 ± 0.2 | N/A | 15.4 ± 1.3 | 0.01 ± 0.00 | |
| 4/25/2008 | Scraping Lane | 4 | 8.1 ± 0.3 | N/A | 24.1 ± 3.7 | 0.13 ± 0.12 | |
| 7/24/2008 | Scraping Lane | 4 | 8.7 ± 0.2 | N/A | 38.2 ± 10.0 | 0.05 ± 0.05 | |
| 1/14/2009 | Scraping Lane | 4 | 6.3 ± 0.3 | 0.34 ± 0.03 | 16.3 ± 0.9 | 0.01 ± 0.00 | 2.9 |
| 3/16/2009 | Scraping Lane | 4 | 6.0 ± 0.5 | 0.35 ± 0.07 | 15.3 ± 1.9 | 0.02 ± 0.01 | 5.7 |
| 8/21/2009 | Scraping Lane | 4 | 7.1 ± 0.1 | 0.27 ± 0.03 | 15.5 ± 0.8 | 0.01 ± 0.01 | 3.7 |
| Mean | Corral | 6.7 | 0.39 ± 0.13 | 24.2 ± 4.4 | 0.017 ±0.01 | 4.2 | |
| Mean | Parlor | 6.3 | 0.40 ± 0.08 | 17.1 ± 3.6 | 0.02 ±0.02 | 5.0 | |
| Mean | Scraping Lane | 6.5 | 0.32 ± 0.04 | 20.8 ± 3.1 | 0.038 ±0.32 | 4.1 | |
1: not measured; 2: not detected.
Table 5.
Influence of assumed background NH3 concentration on emissions.
| CBG (μg m−2 NH3 s−1) | ||||
|---|---|---|---|---|
| 0 | 2.3 | 17.0 | 32.35 | |
| Minimum | −0.05 | −0.38 | −2.60 | −5.93 |
| 10% percentile | 1.47 | 1.37 | 0.74 | −0.01 |
| 50% percentile | 3.71 | 3.58 | 2.72 | 1.92 |
| 90% percentile | 8.89 | 8.73 | 7.43 | 6.22 |
| Maximum | 31.33 | 30.75 | 29.35 | 23.19 |
| Mean | 4.52 | 4.38 | 3.52 | 2.61 |
| σ | 3.15 | 3.11 | 2.91 | 2.72 |
Table 6.
Annual variation in whole-farm NH3 emissions for representative days.
| Season | # days | Mean | σ | CV | Mean | Mean | 90th%ile |
|---|---|---|---|---|---|---|---|
| kg d−1 | kg d−1 | % | g hd−1 d−1 | g AU−1 d−1 | g hd−1 d−1 | ||
| Spring | 5 | 203.1 | 44.2 | 22% | 58.2 | 74.4 | 91.4 |
| Summer | 13 | 434.0 | 197.0 | 45% | 124.3 | 159.1 | 249.9 |
| Fall | 17 | 256.6 | 120.2 | 47% | 73.5 | 94.1 | 143.2 |
| Winter | 32 | 257.9 | 101.1 | 39% | 73.8 | 94.5 | 144.7 |
| Annual | 67 | 287.6 | 144.7 | 82.4 | 105.4 | 160.7 |
≥50% valid 30-min measurements in the day with touchdown fraction >0.4.
© 2020 by the authors. Licensee MDPI, Basel, Switzerland. This article is an open access article distributed under the terms and conditions of the Creative Commons Attribution (CC BY) license (http://creativecommons.org/licenses/by/4.0/).
Share and Cite
MDPI and ACS Style
Grant, R.H.; Boehm, M.T.; Hagevoort, G.R. Ammonia Emissions from a Western Open-Lot Dairy. Atmosphere 2020, 11, 913. https://doi.org/10.3390/atmos11090913
AMA Style
Grant RH, Boehm MT, Hagevoort GR. Ammonia Emissions from a Western Open-Lot Dairy. Atmosphere. 2020; 11(9):913. https://doi.org/10.3390/atmos11090913
Chicago/Turabian StyleGrant, Richard H., Matthew T. Boehm, and G. Robert Hagevoort. 2020. "Ammonia Emissions from a Western Open-Lot Dairy" Atmosphere 11, no. 9: 913. https://doi.org/10.3390/atmos11090913
Note that from the first issue of 2016, this journal uses article numbers instead of page numbers. See further details here.