Article

Seeking the Sources of Dust: Geochemical and Magnetic Studies on “Cryodust” in Glacial Cores from Southern Spitsbergen (Svalbard, Norway)

1
Institute of Geophysics, Polish Academy of Sciences, Ks. Janusza 64, 01-452 Warsaw, Poland
2
forScience Foundation, ul. Przy Skarpie 70/47, 87-100 Toruń, Poland
3
Faculty of Natural Sciences, University of Silesia in Katowice, Będzińska St 60, 41-200 Sosnowiec, Poland
*
Author to whom correspondence should be addressed.
Atmosphere 2020, 11(12), 1325; https://doi.org/10.3390/atmos11121325
Submission received: 21 October 2020 / Revised: 30 November 2020 / Accepted: 1 December 2020 / Published: 7 December 2020
(This article belongs to the Special Issue Long-Range Transport of Dust over the High-Latitude Regions)

Abstract

:
Natural mineral particulate matter deposited from aerosols and trapped in glaciers—herein defined as “cryodust”—may be an excellent indicator of atmospheric circulation, if terrestrial sources of dust can be identified. In this study, we analyzed the composition of cryodust in shallow ice cores taken from five glaciers in Southern Spitsbergen (Svalbard Archipelago, Northern Norway). The chemical composition, magnetic properties and radiogenic ages of individual grains were measured, where possible, to provide indicators of source areas. To identify mineral and rock fragments, solid particulates were examined by Scanning Electron Microscope fitted with a backscattered electron and Energy Dispersive Spectroscopic detectors. An Electron MicroProbe was employed for the U-Th-Pb chemical dating of monazite grains. Magnetic measurements comprised analyses of magnetic susceptibility (κ) vs. temperature (T) variations and determination of magnetic hysteresis parameters. Monazite ages span 445–423 Ma, consistent with mineral growth during the Caledonian orogeny. Caledonian rocks are exposed in the Nordaustlandet area of North-Eastern Svalbard, and this is the most probable source for monazite grains. Magnetic analyses show a predominance of ferrous (FeII) over ferric (FeIII) phases, consistent with a lack of input from subtropical sources. The results from both methods are consistent with local sources of dust from exposures in the Svalbard archipelago.

1. Introduction

The deposition of solid phases in glaciers is increasingly recognized as a critical component of the Earth’s climate system, due to their influence on the physicochemical properties of ice, with consequences for global-scale processes [1,2,3,4]. Dust particulates include space dust (micrometeorites), grains from weathered rocks [5,6] and fine ejecta from volcanic eruptions [7,8]. Other particles in ice can be products of wildfires [9], industrial activity (e.g., black carbon particles, BCPs) [10,11,12,13] or biological activity, such as spores and pollen [14].
The dust particles can contribute to deposits of cryoconite (named from Greek “kryos”—cold and “konis”—dust), infilling small water reservoirs on the ice surface, called cryoconite holes [15]. Whereas cryoconite is a mixture of biotic and abiotic elements, in this study, we coin the term “cryodust” to describe only abiotic particulate matter distributed within the ice of glaciers. This study aims to use the composition of solid abiotic particles deposited in glaciers of the Southern Spitsbergen to identify potential source areas of aerosol dust. Our first working hypothesis was that Fe-(hydro)oxides, if transported from weathered rocks at lower latitudes, should have a different geochemical signature from local minerals, expressed by a predominance of more oxidized ferric (FeIII) over ferrous (FeII) phases. The second working hypothesis was that we can constrain dust source areas by using geochemical dating of radioactive minerals, since the age of these minerals provide a provenance from exposures of rock of equivalent age. The problems of dust sources and compositions is important for better understanding of the behavior of glaciers on Svalbard, since the different reflectivity and absorption of dust components can change physical properties of the ice, decreasing albedo and increasing the pace of glacial melting [16,17,18]. To test our hypotheses, scanning electron microscope (SEM) Energy Dispersive Spectrometry (EDS) and back-scattered electron (BSE) imaging were employed for geochemical identification, and an Electron MicroProbe (EMP) was used for mineral dating. Additionally, magnetic methods commonly used in paleomagnetic and rock–magnetic studies were employed for identification of magnetic phases.

2. Field and Laboratory Work

2.1. The Origins of Cryodust

More than half of Svalbard is covered by ice, strongly influencing the climate in Europe [19]. The ice caps and glaciers of Svalbard have been frequently analyzed in terms of water-soluble ion chemistry [20,21,22,23]. However, with the exception of studies on tephra layers [7] and locally derived dust particles [24] in glaciers, natural micrometer-sized mineral particulates have not been a subject of detailed studies.
Deposited with snow on the surface of the glacier, the dust gradually becomes incorporated into the ice. In the accumulation zone, cryodust trapped in the firn and subsequently in the ice becomes an inherent component of the cryosphere [25], forming laterally variable seasonal layers. Most deposition of dust occurs when wind speed decreases or when the sediments get mixed with falling snow in autumn and winter, through niveo-aeolian deposition [26,27]. Recent estimation of dust load in the Central Spitsbergen ranges from 3 × 10⁻³ kg m−2 to 1.7 kg m−2 for the summer season [27,28], with rates of niveo-aeolian deposition in the years 2000–2005 ranging between 70 and 115 g m−2 a−1 [26]. In comparison, aeolian deposition at Hornsund, southern Spitsbergen, was estimated at 300–400 g m−2 a−1 for the winter of 1957/1958 [29]. Measurements in 2019 show that the maritime Hornsund region experienced lower High Latitude Dust deposition rates than the drier and more continental region of Central Spitsbergen, with averages of 3.8 and 9.3 g m−2, respectively [30].

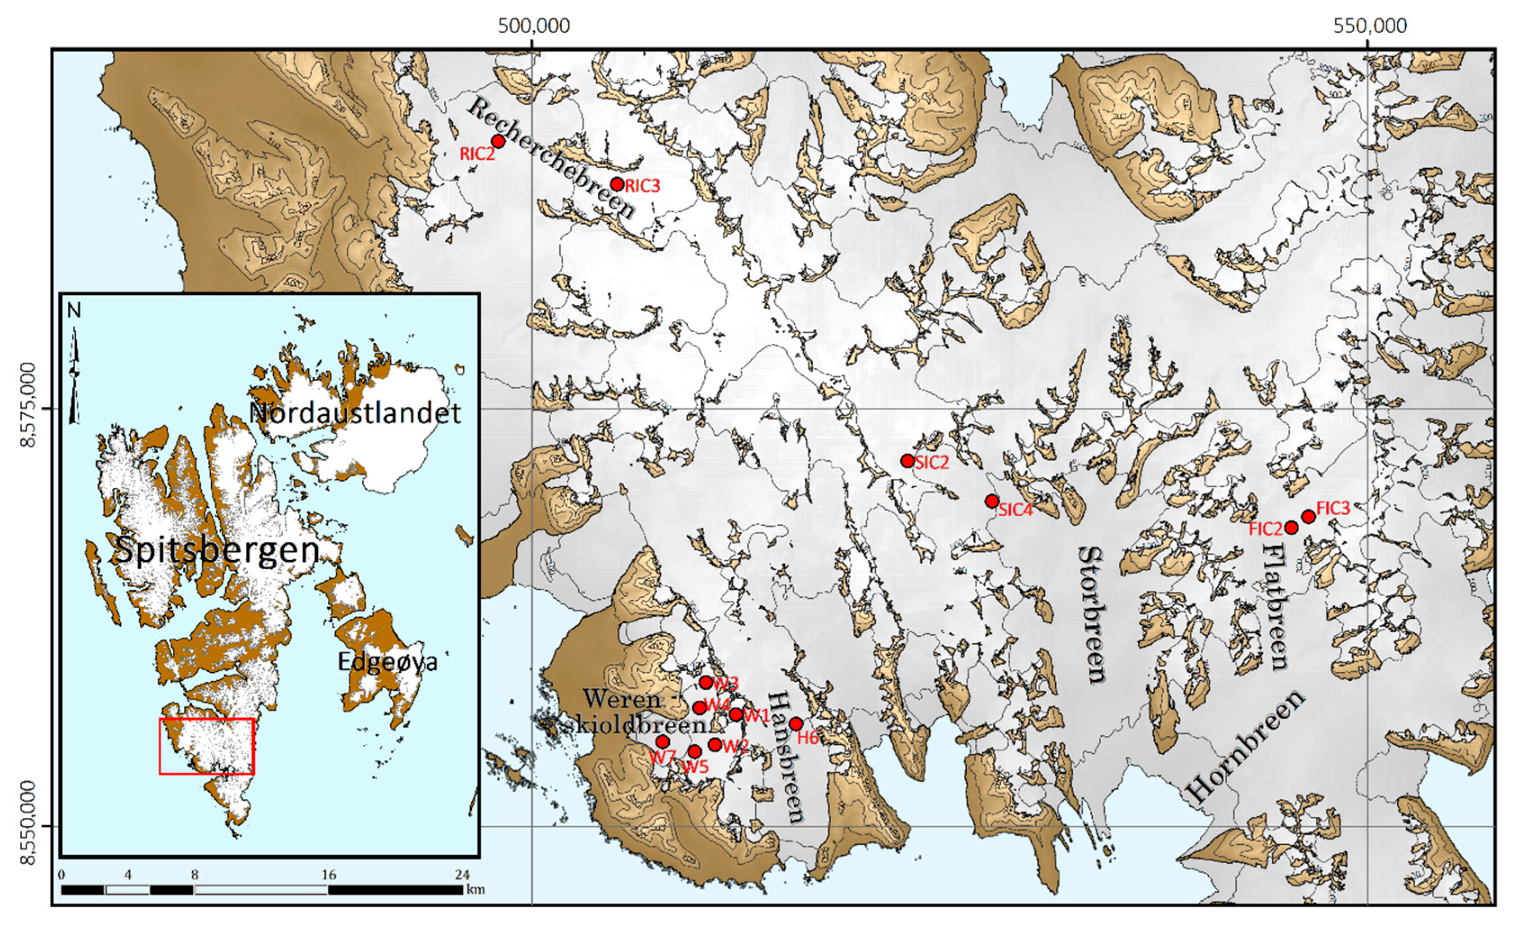
2.2. Sampling in the Field

Sampling of cryodust-bearing ice was performed in April 2018. Shallow cores were drilled from five glaciers in Southern Spitsbergen. Two different core lengths were drilled: (a) up to 0.5 m on Recherchebreen, Hornbreen (Flatbreen), Storbreen and Werenskioldbreen; and (b) 1.0 m on Hansbreen (Figure 1 and Table 1, [31,32]).
The coordinates of sampling spots are given in Table 2.
The samples (90 mm in diameter) were collected away from snow scooter tracks and other potential sources of contamination, using the hand-operated Mark II Coring System (Kovacs Ice Drilling Equipment, Roseburg, USA). Cores were packed into polyethylene bags, secured, transported to the Polish Polar Station Hornsund and stored in the deep freezer, in the dark, for a maximum of five days.
Although core material was collected underneath the snow cover, the ice could have been temporarily exposed to solar radiation during ablation periods. Each collected core may comprise accumulation spanning a maximum of a few years; however, this does not necessarily imply synchronicity (within this time limit) of the core samples, due to the unknown depth/degree of ablation.

2.3. Cryodust Extraction

The core samples were taken to the chemical laboratory of the Polish Polar Station Hornsund. Core transportation, sample preparation, filtration and filter packaging assured the highest possible standards to protect cryodust samples from contamination.
The core samples were rinsed, using deionized water (conductivity < 0.06 µS/cm; Norm PN-EN ISO 3696:1999; Polwater DL100, Labopol-Polwater, Poland), and melted at room temperature, in closed new polyethylene bags. After melting samples were passed through pre-rinsed sterile Millipore Mixed Cellulose Ester filters (white-gridded, 0.45 μm pore size; Merck Millipore, Germany).
Samples SIC2 and SIC4 were shorter than others and were filtered in combination, so that the filtered residuum is mixed. The 1.0 m long ice/firn core sample from Hansbreen glacier broke into four pieces during transportation. Each piece was weighed, measured and filtered separately.
After filtration, the residue was placed in a dryer chamber for two hours at 60 °C. Each sample was then stored in a separate polystyrene Petri dish, secured by the Parafilm sealing film and transported to Poland.
Cryodust samples from Hansbreen (H6/1, H6/2, H6/3 and H6/4), Hornbreen (Flatbreen; FIC2 and FIC3) and Werenskioldbreen (W1, W2, W3, W4, W5 and W7) were analyzed, using magnetic methods only, whereas samples from Storbreen (SIC2 and SIC4) and Recherchebreen (RIC2 and RIC3) were also analyzed under the electron microscope.

2.4. Geochemical Experiments

2.4.1. Sample Preparation

For electron microbeam studies, dust material was mounted in epoxy discs and polished to expose midsections of grains. The mounts were cleaned and imaged, to aid in identification of deposited material. Analyses were taken by using the JEOL JSM-6380 Scanning Electron Microscope (JEOL, Yokogushi, Japan) at the Warsaw University. An accelerating voltage of 20 kV was used. EDS analyses were performed with an XFlash 6I10 Bruker detector (Warsaw, Poland). After BSE imaging, mounts were carbon coated for analysis by electron microprobe (EMP, Cameca, Genevilliers, France).

2.4.2. Monazite Dating by Electron Microprobe

Electron microprobe analyses were performed at the Electron Microprobe Laboratory, State Geological Institute of Dionýza Štúra in Bratislava, Slovakia, utilizing a Cameca SX-100 electron microprobe (Cameca, Genevilliers, France), equipped with four wavelength-dispersive spectrometers. Large high-sensitivity LPET and LLIF crystals and a conventional TAP crystal were used for analysis. Analytical conditions were chosen to balance the best analytical conditions against reasonable acquisition times. At the start of each dating session, a set of monazite reference materials (Thompson Mine and 44069), reliably dated by SHRIMP (Sensitive High Resolution Ion Microprobe) [33] were analyzed. These were used to test the effectiveness of correction factors, with the weighted mean of “apparent ages” from analyses accepted when within 5 m.y. of the published age of each standard. Analytical spot positions on sample grains were carefully selected with the use of high-contrast BSE images. Chemical-dating methodology is based on the assumption that no initial Pb was present in the mineral (i.e., the only Pb comes from the radiogenic decay of U and Th) and the mineral system was closed. The software DAMON [34,35] by P. Konečný was used for data handling, age calculation and construction of histograms. The software calculates ages by following a published methodology [36]. The analytical routine has already been successfully applied for dating monazite [37,38].

2.5. Magnetic Experiments

Rock magnetic methods included the determination of low field magnetic susceptibility and parameters of magnetic hysteresis at the Laboratory for Paleomagnetism and Environmental Studies located at the Institute of Geophysics, Polish Academy of Sciences in Warsaw, Poland.
Fifteen samples were used for studies of magnetic properties. For two samples (RIC3 and SIC2-SIC4), a minor amount of collected dust was previously separated to perform SEM analysis. The mass of the filters was measured with a RADWAG WAX 62 laboratory weight balance (accuracy 0.01 mg, Radwag, Radom, Poland). No filter seasoning at controlled temperature/humidity conditions was performed prior to mass determination. The mass of reference empty filters was used to calculate the approximate mass of dust residue remaining in filters for rock magnetic measurements. It was decided that very detailed mass determination is not needed for rock magnetic studies, and the cryodust mass was used only for reference.
More details on the Chemical Th-U-total Pb Isochron Method (CHIME) procedure are given in Appendix A, while details on magnetic susceptibility measurements and hysteresis loop acquisition are given in Appendix B.

2.5.1. Magnetic Susceptibility Experiments

At the first step, a low field magnetic susceptibility (κ) at room temperature was determined for filters with MFK-1 magnetic susceptibility bridge (Agico, Brno, Czech Republic). For cryodust residue with determined mass, the mass specific κ could be calculated. The distribution of raw and mass normalized κ values of dust filters was further evaluated.
The dependence of κ upon heating and cooling κ(T) was determined with KLY5 magnetic susceptibility bridge with high-temperature CS4 unit attached (Agico, Brno, Czech Republic), at the field of 300 A/m at 1440 Hz, at the temperature range of 20 to 700 °C. Halves of filters were carefully shredded to smaller segments and placed in the quartz holder, to be heated in the furnace. Curves of κ(T) upon heating and cooling in the air atmosphere κ(T) were processed to remove the signal of the measuring vessel with Cureval 8 software (Agico, Brno, Czech Republic). The data of κ(T) curves can indicate the presence of ferromagnetic phases like magnetite, pyrrhotite, goethite or hematite.

2.5.2. Magnetic Hysteresis Experiments

Samples for hysteresis were prepared for all studied dust filters, as well as empty filters. For each type of experiment (hysteresis loop, backfield and isothermal remanence), the signal of the quartz holder was initially measured and later subtracted. Saturation magnetization (Ms) and remanence magnetization (Mr), as well as coercive force (Hc), were calculated from the ferromagnetic loop, using Hystlab software [39]. Backfield experiments with initial magnetization of up to 0.5 T and consecutive stepwise demagnetization up to 100 mT was done to determine the coercivity of remanence (Hcr). Isothermal remanence magnetization (IRM) curves were also obtained upon magnetizing in a field up to 500 mT, to check whether a high coercivity component that is not saturated in a field of 500 mT is also present. The procedure was used for one empty filter, 15 non-heated dust samples and for a residue from one previously heated sample (SIC2-SIC4).
The ratios of Mr vs. Ms and Hcr vs. Hc were plotted on a Dunlop–Day diagram to compare results with theoretical curves of mixtures of magnetite with different domain states [40]. Apparent contributions of paramagnetic/diamagnetic phases vs. ferromagnetic phases in the cryodust sample were evaluated based on magnetic hysteresis data for 13 out of 15 samples.
All quantitative results can be compared between samples based only on a similar range of mass of samples used for experiments.

3. Results

3.1. Geochemical Results

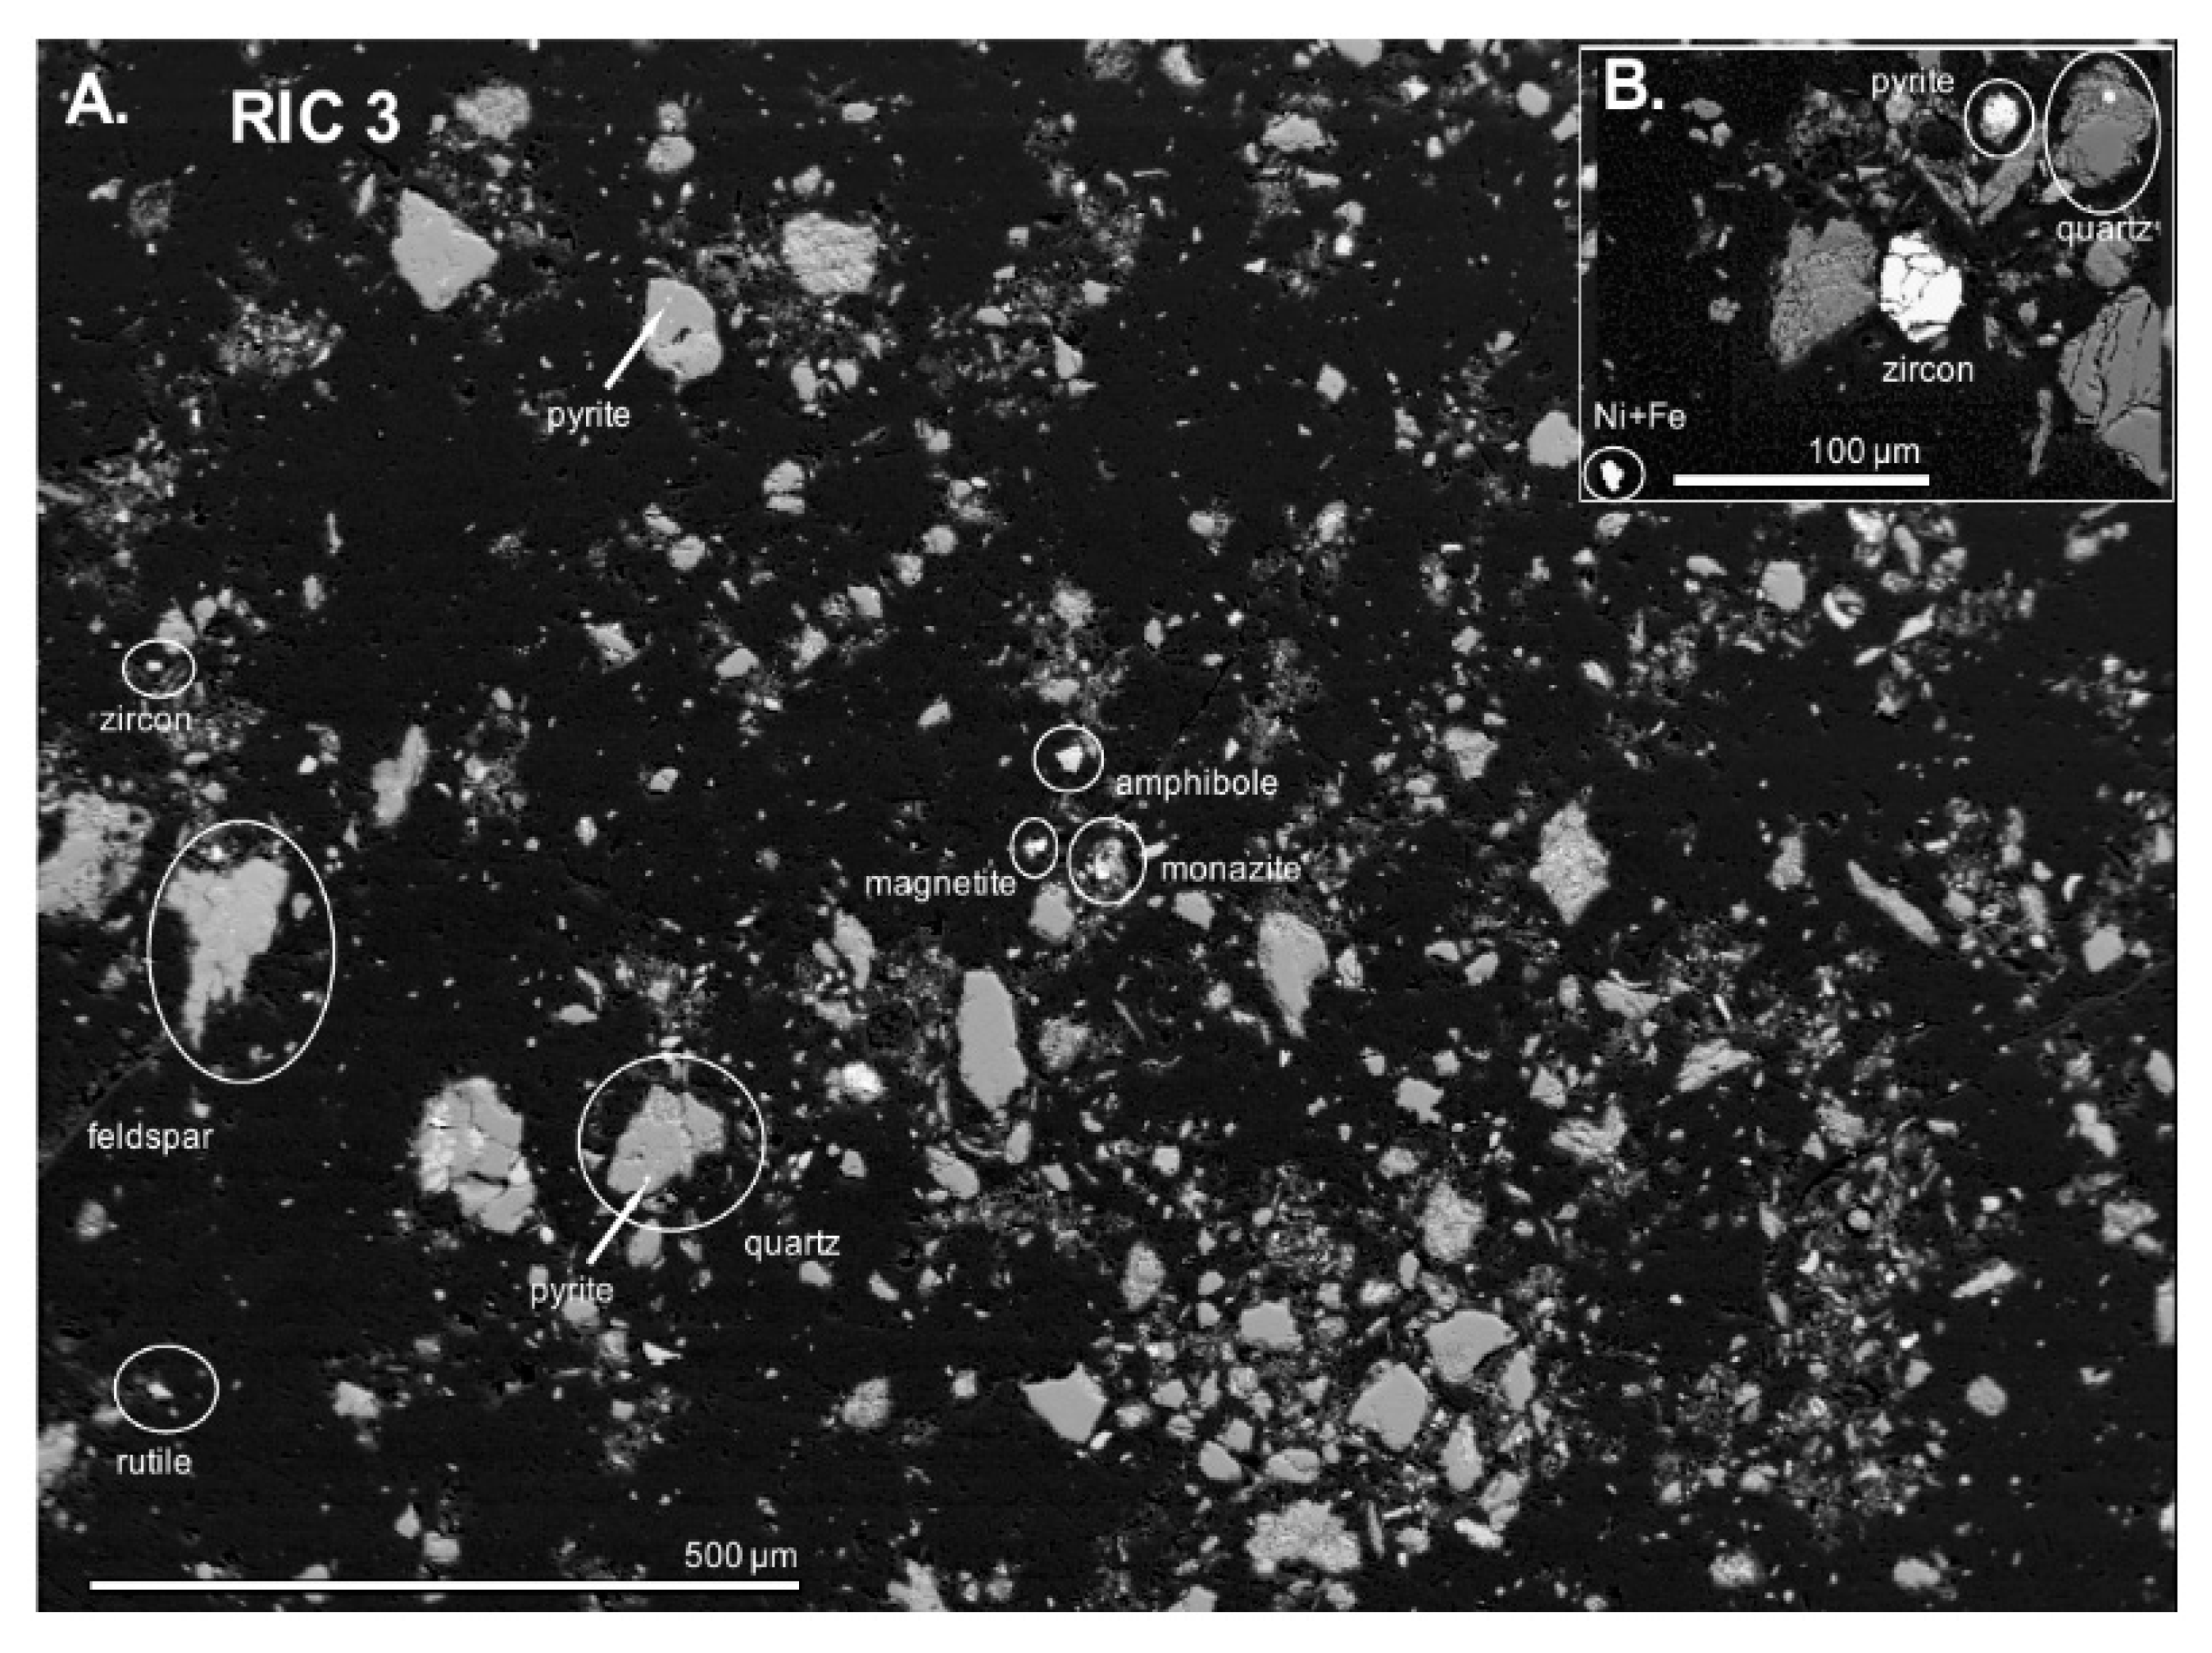
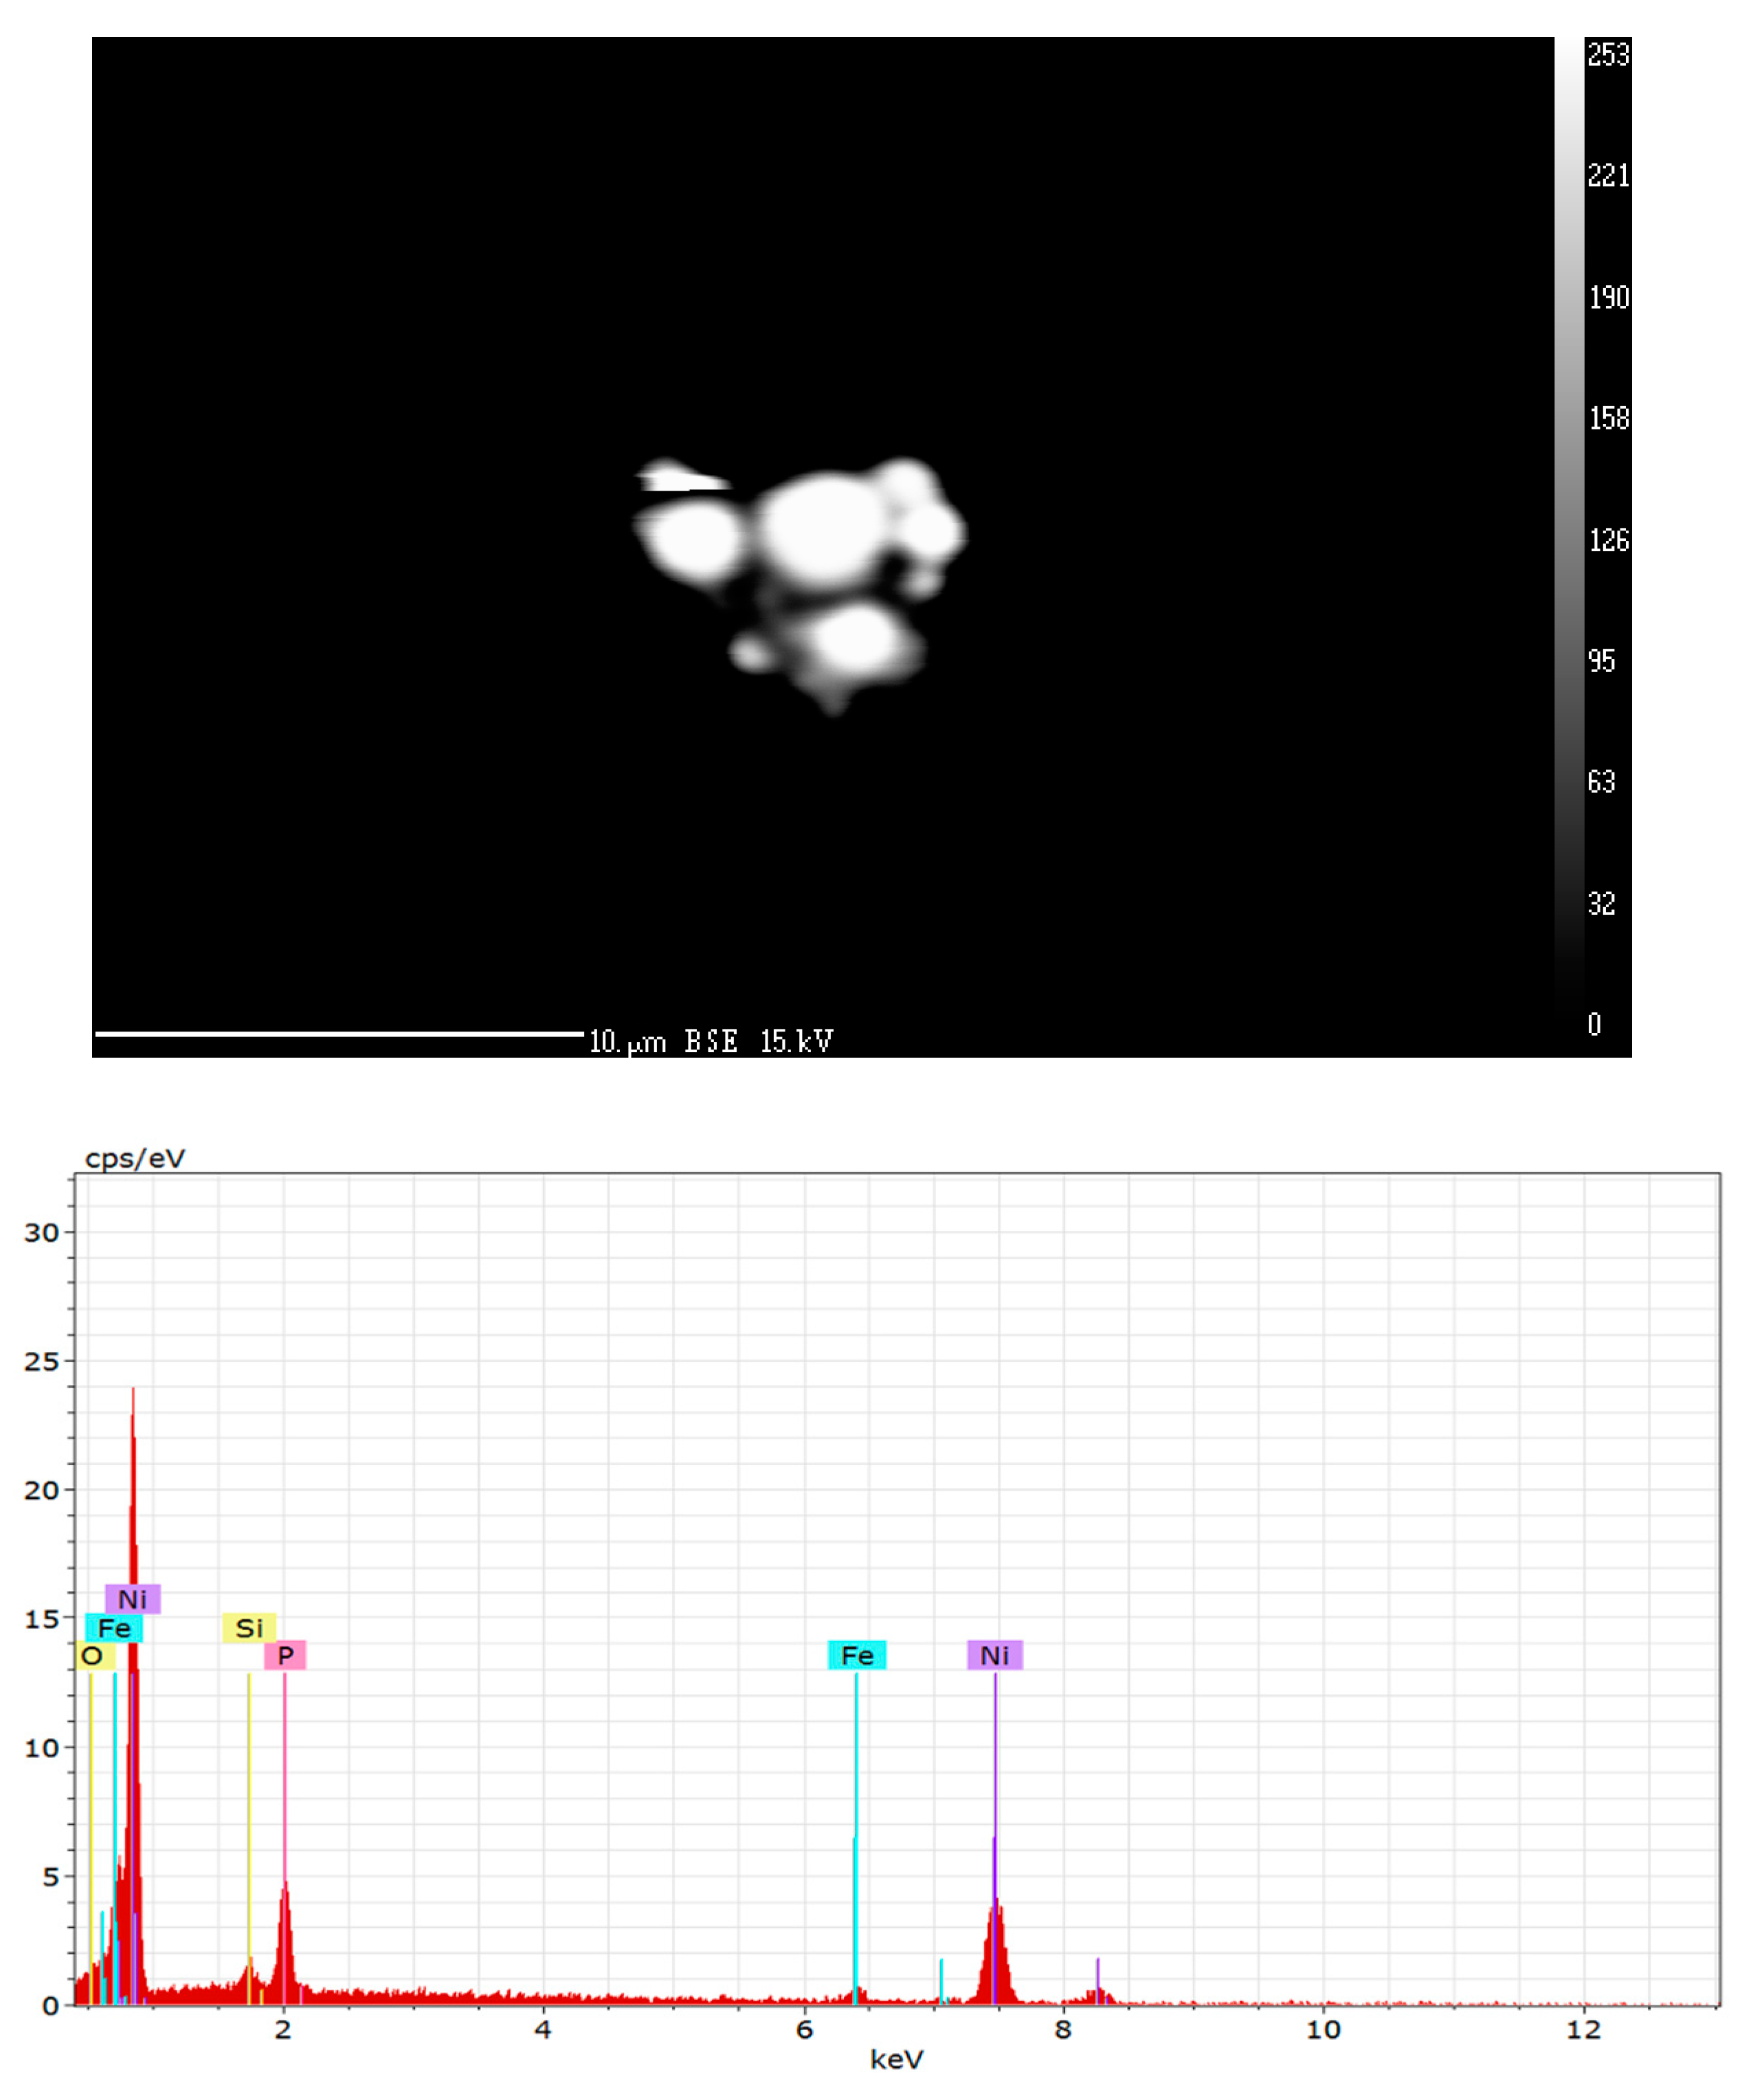
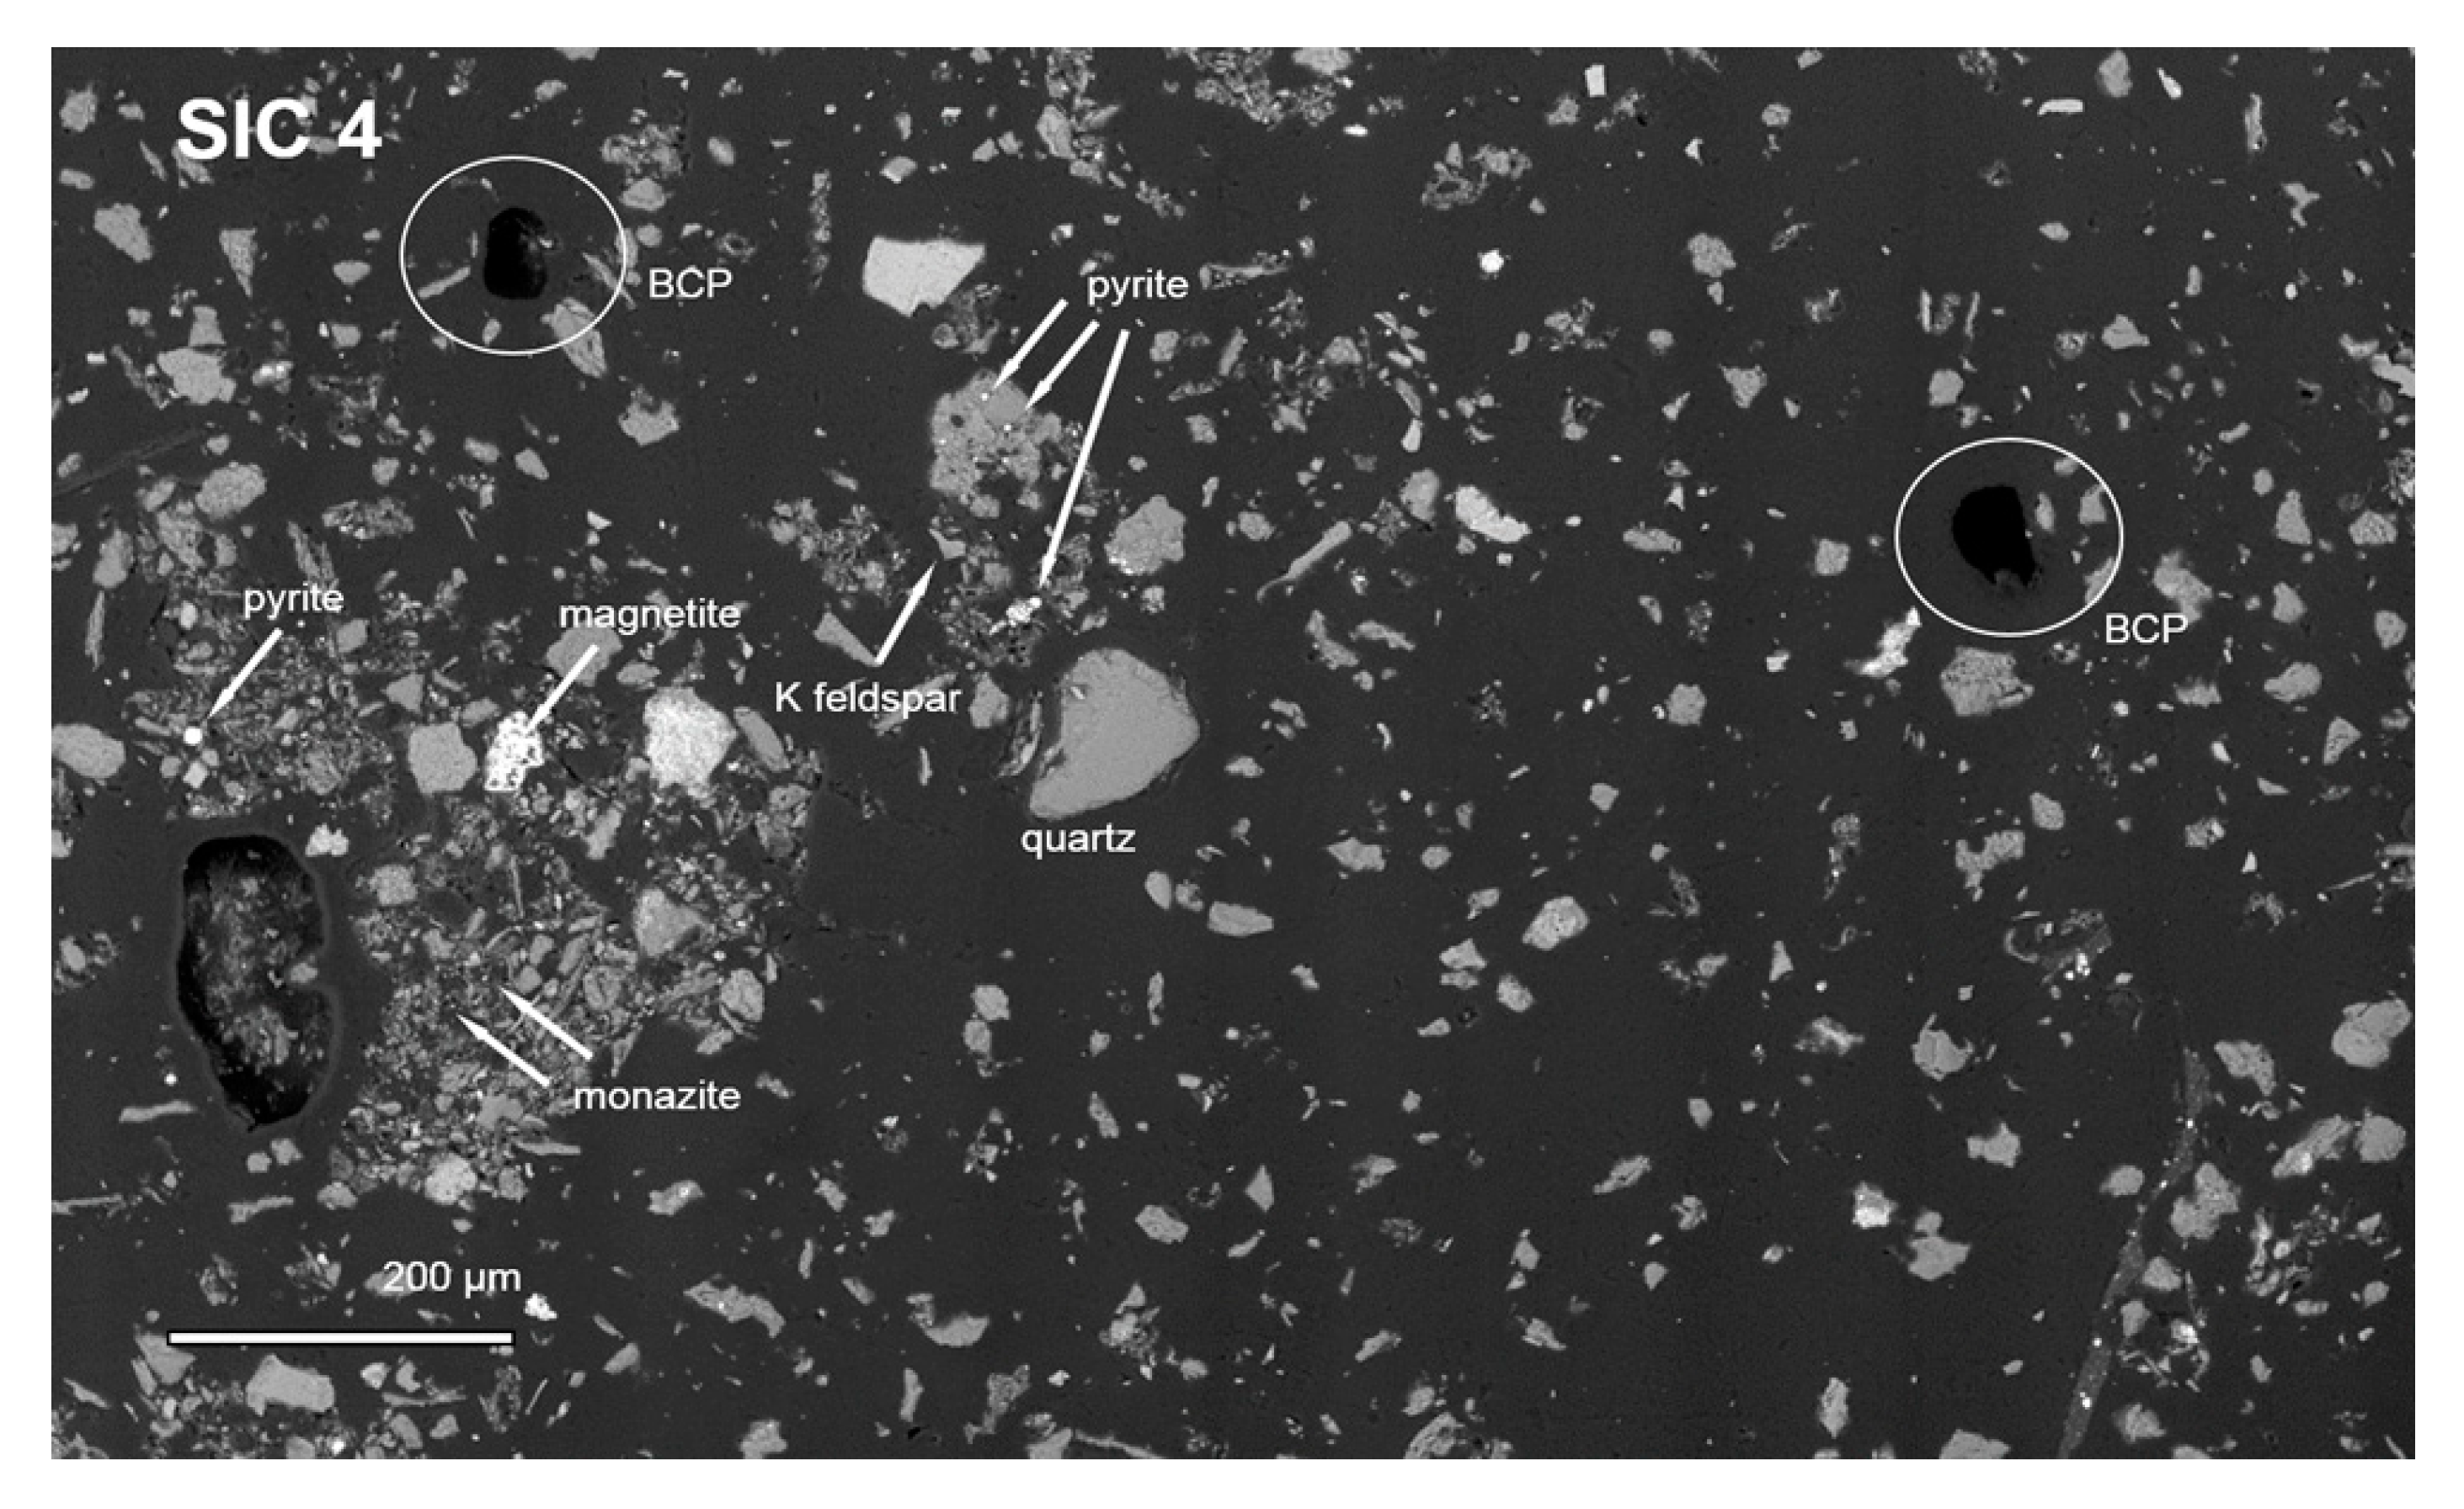
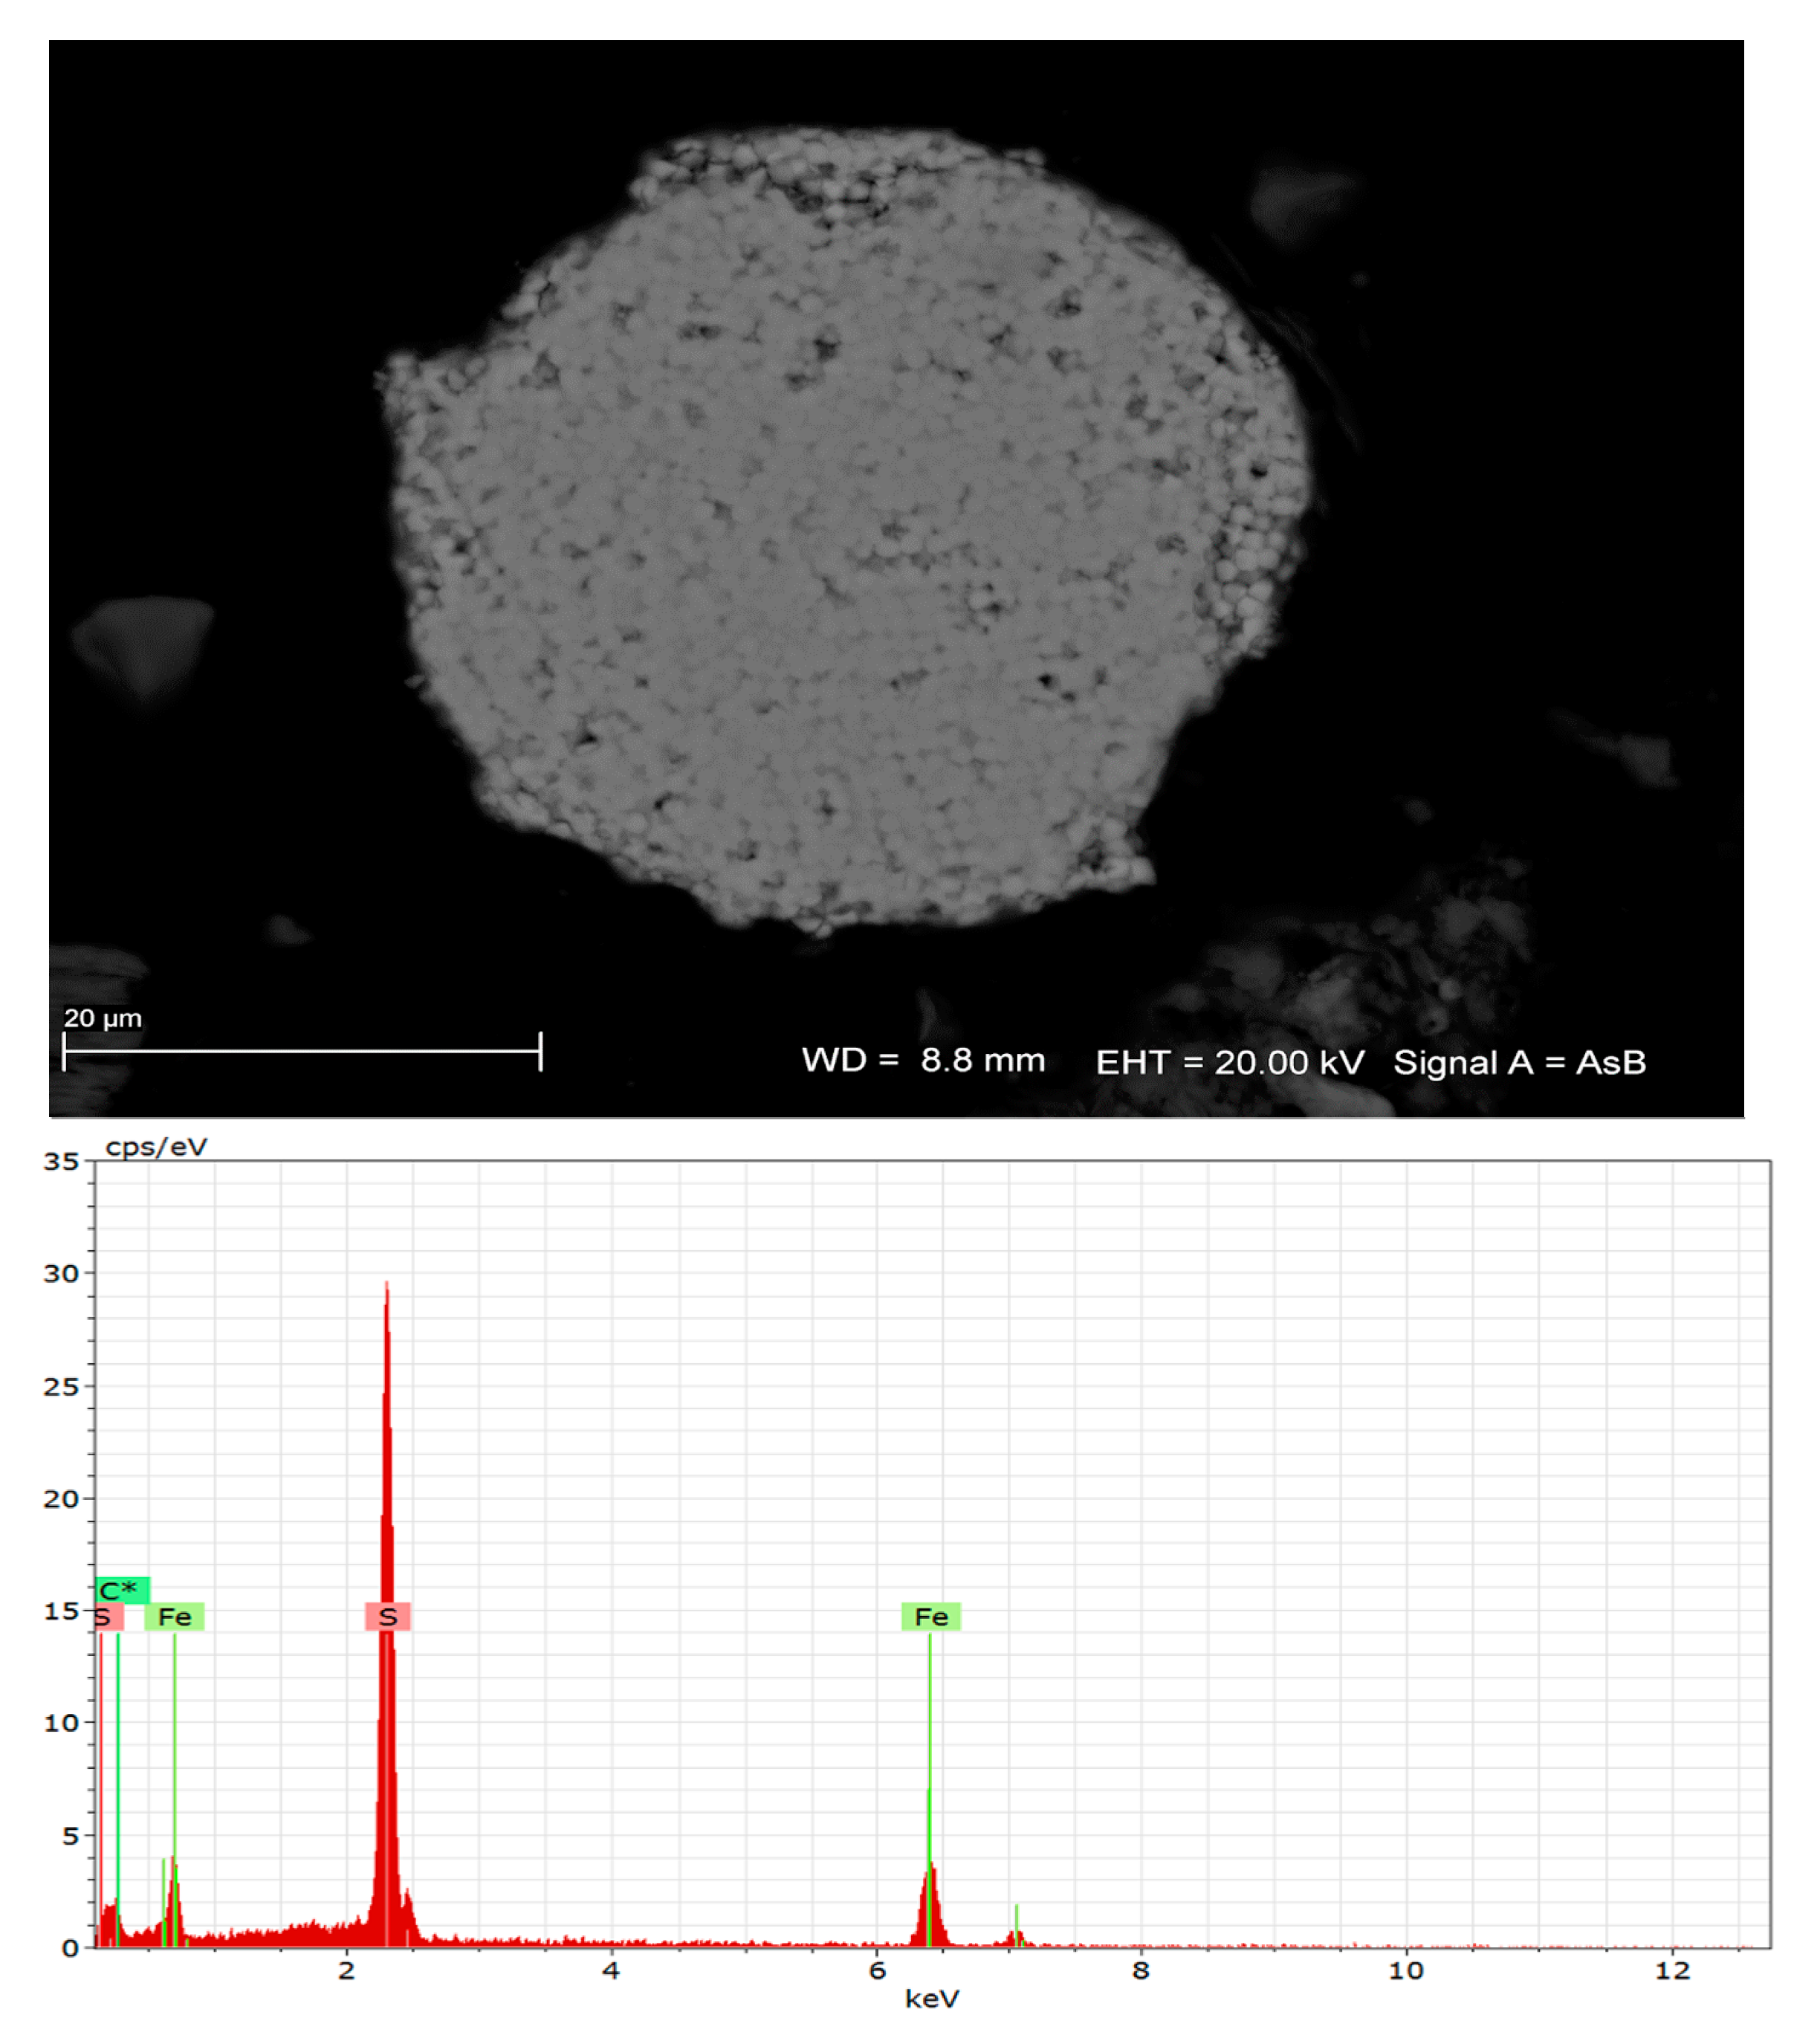
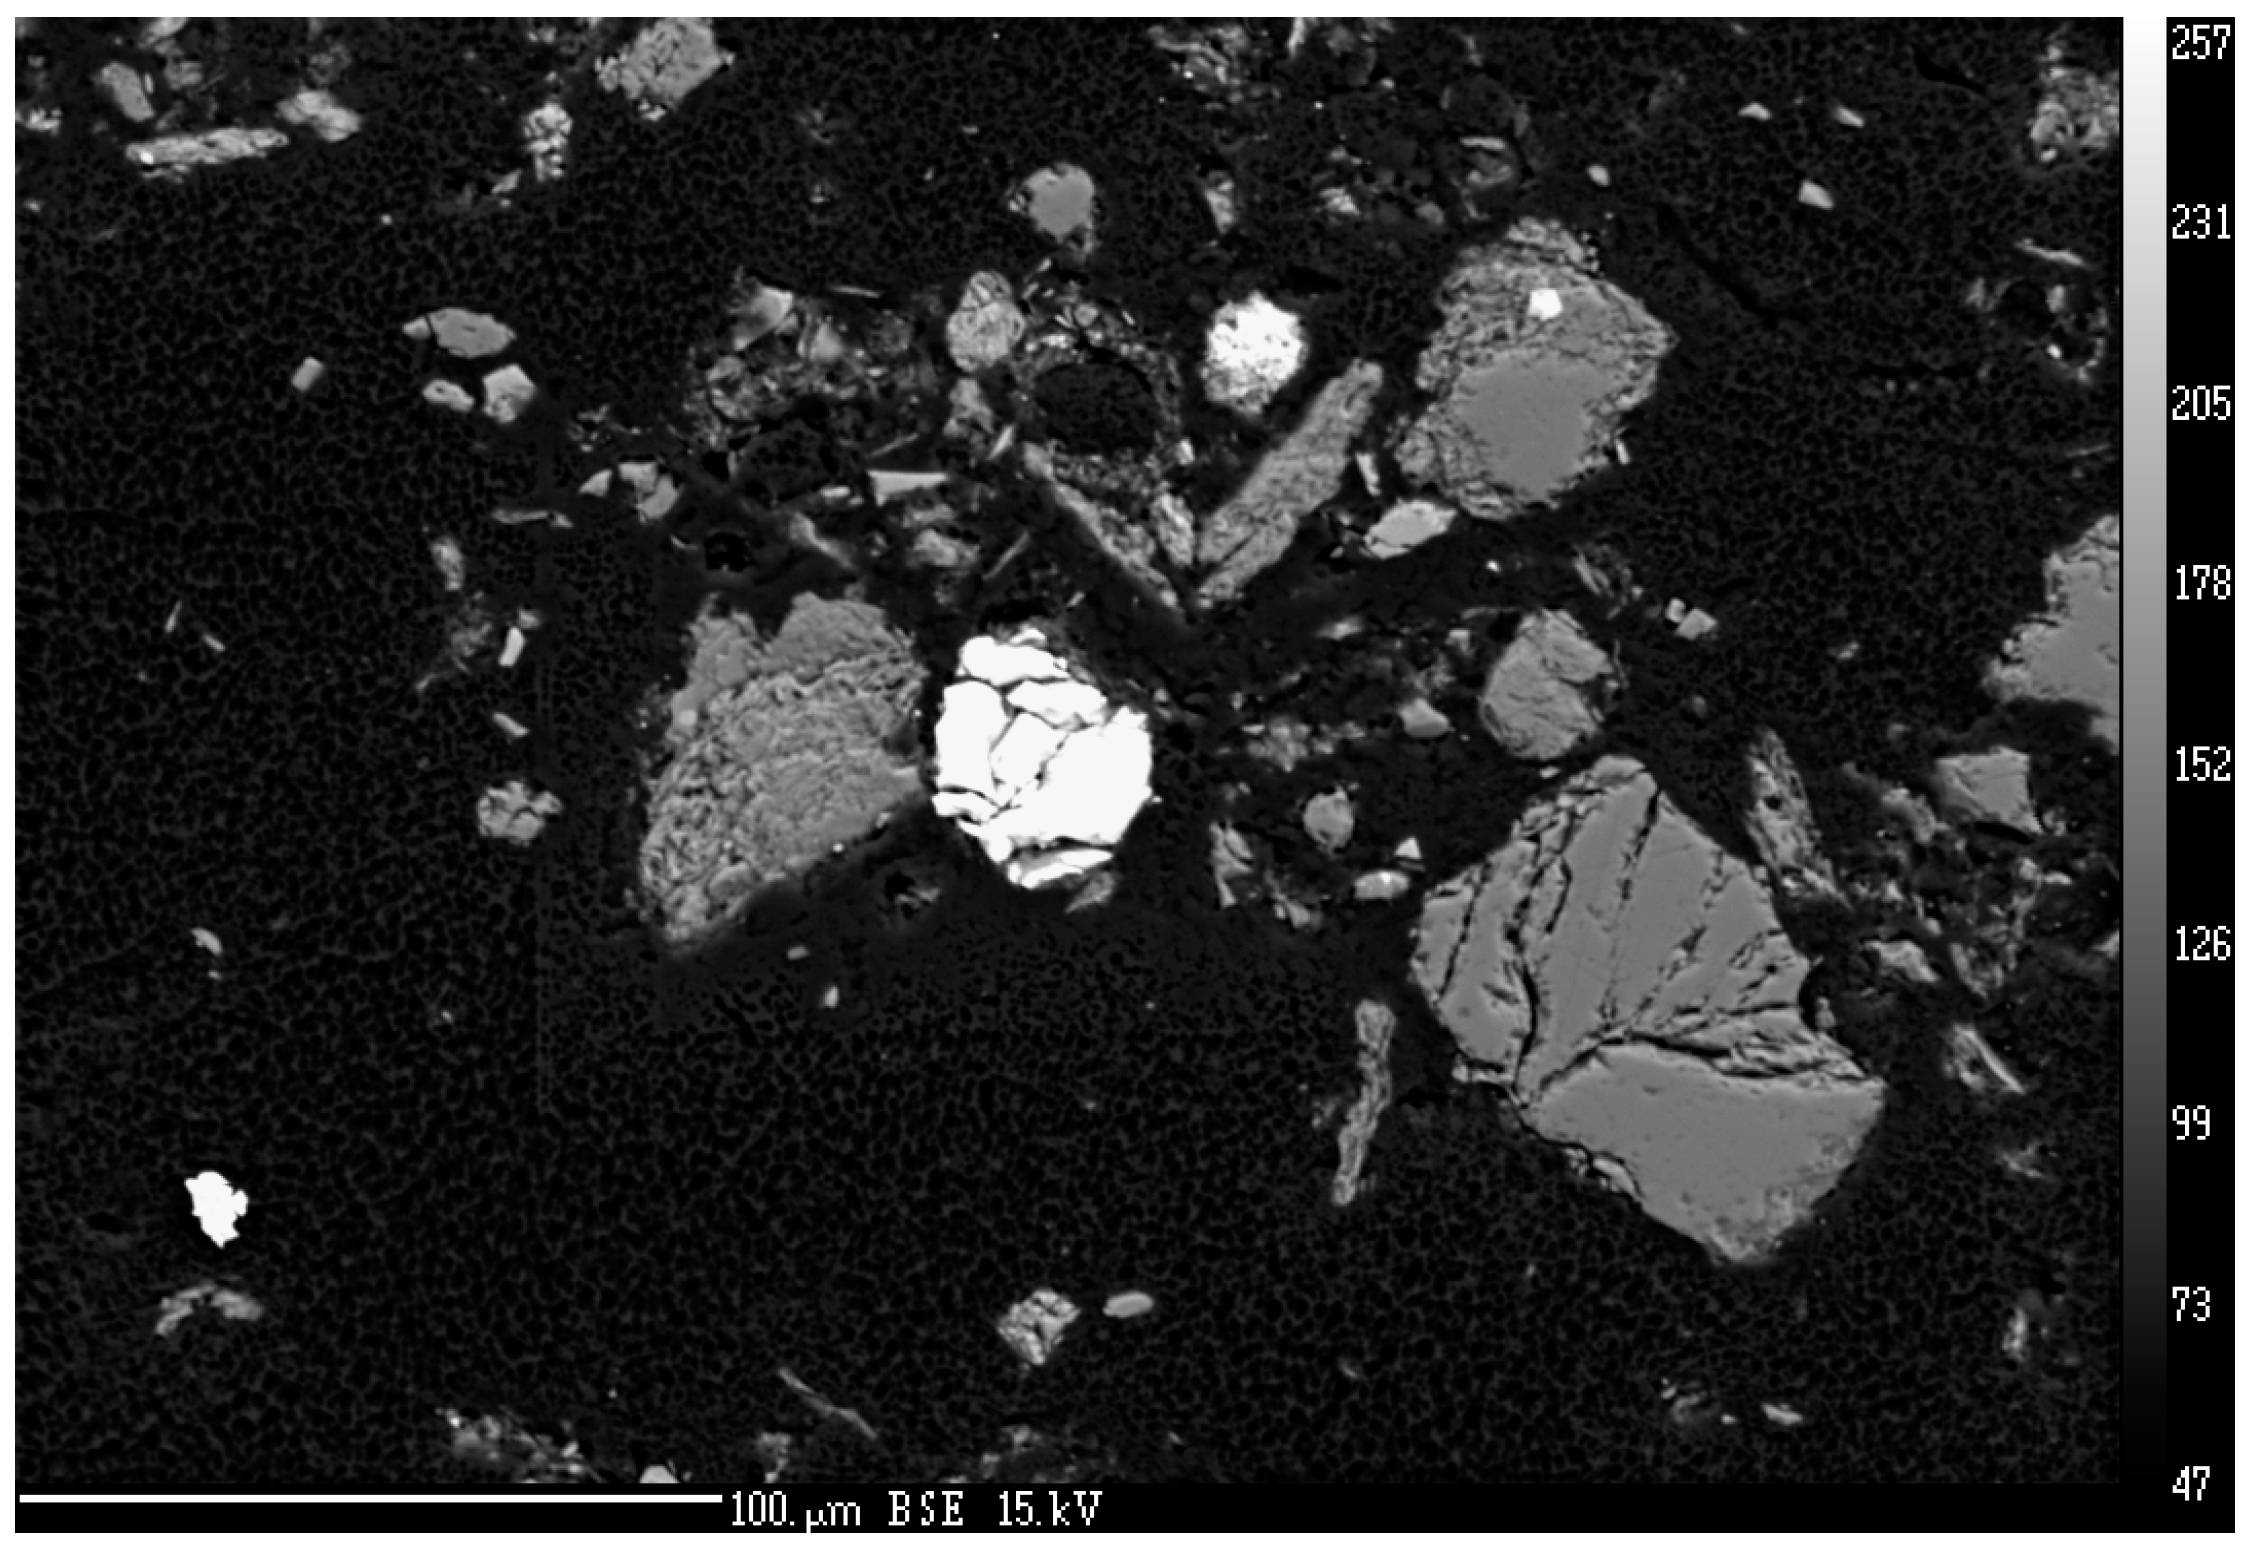
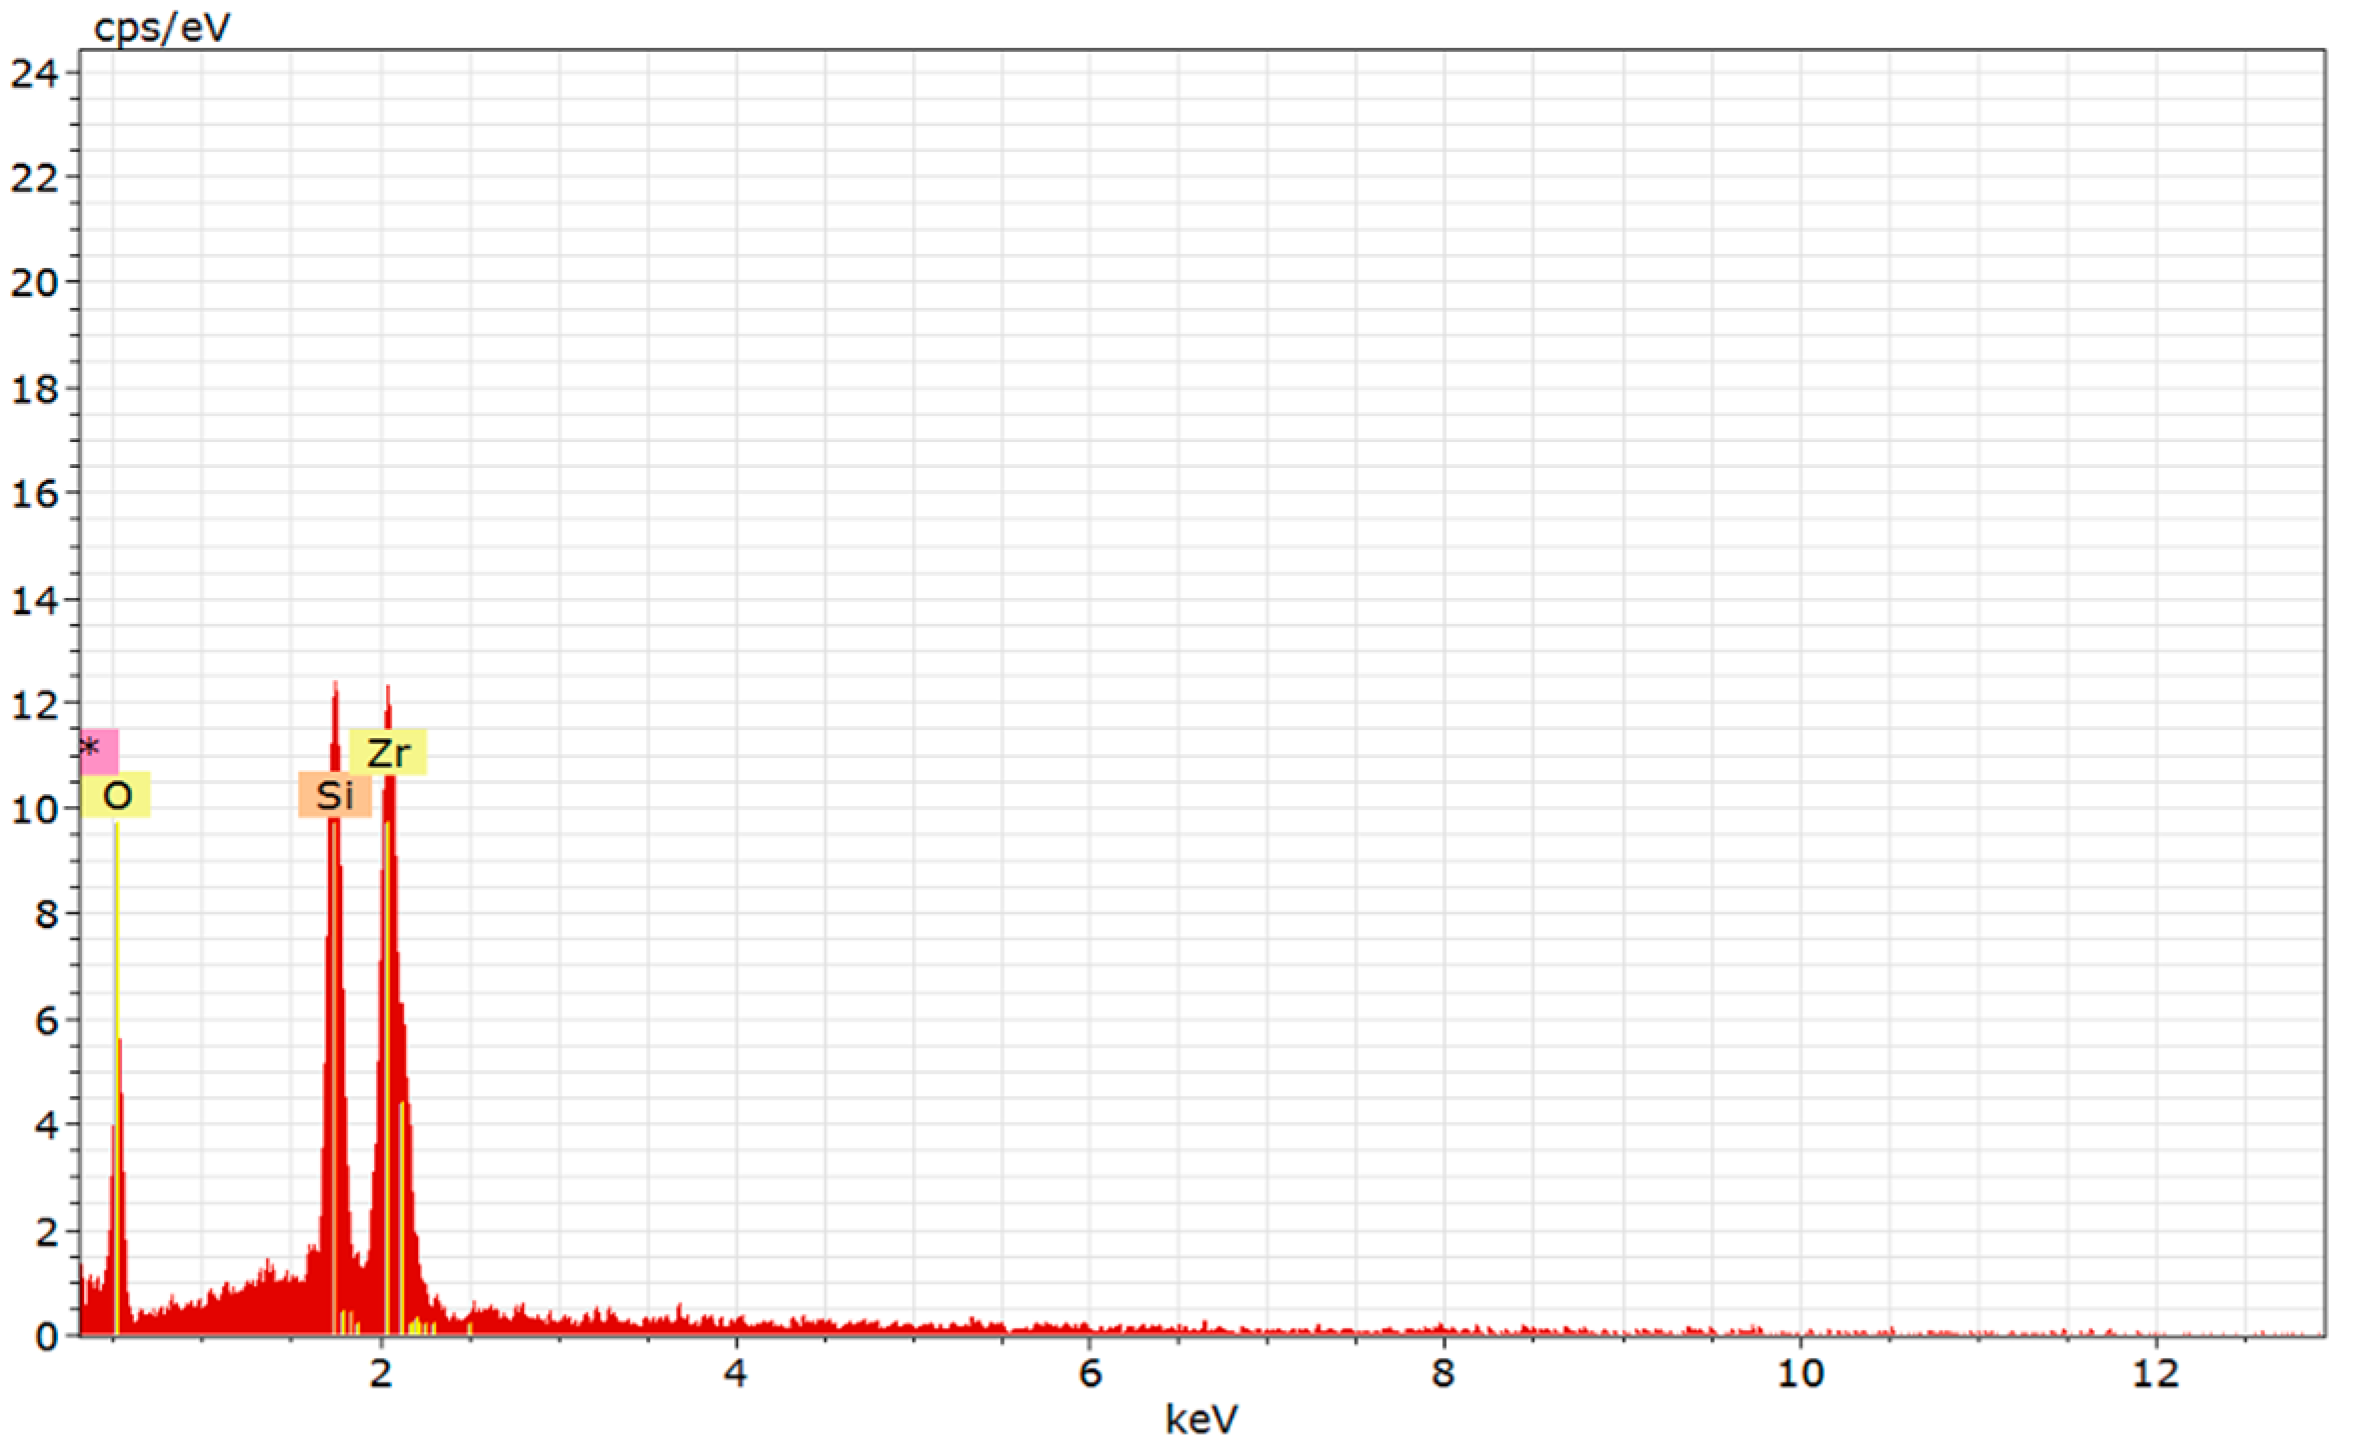
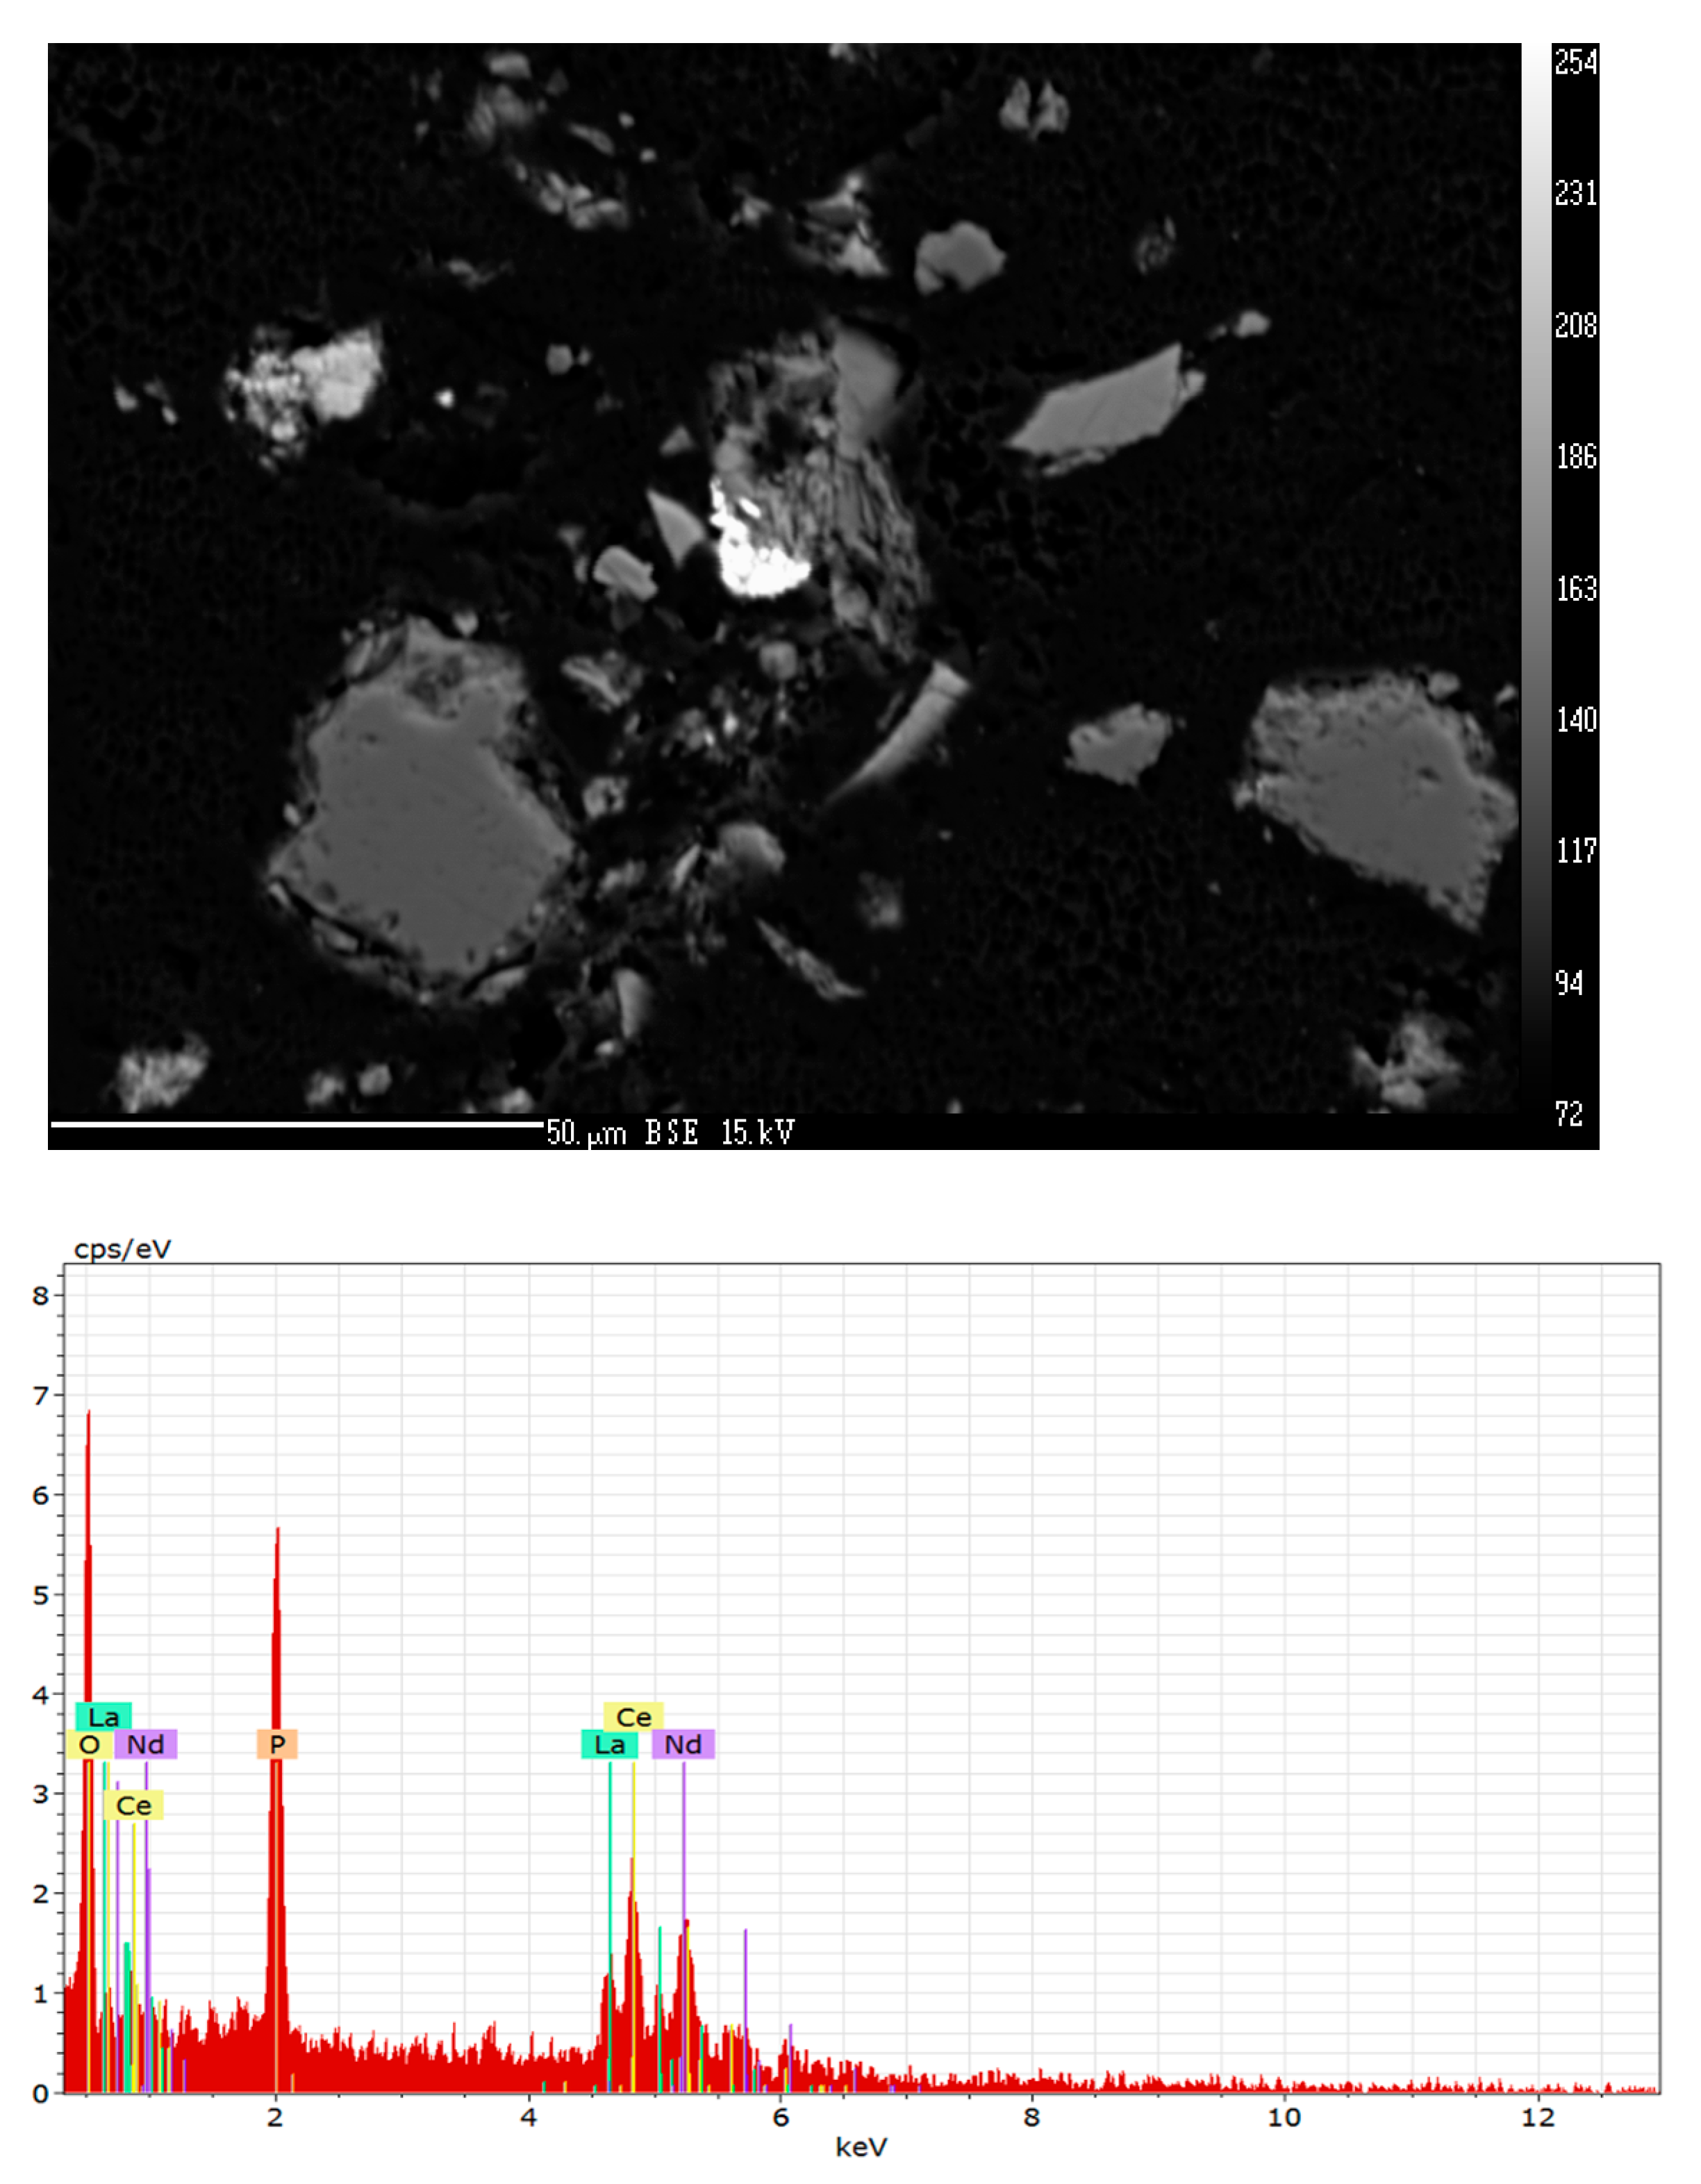
3.1.1. SEM–EDS Results

Mineral variety of the cryodust is illustrated in Figure 2, Figure 3, Figure 4, Figure 5, Figure 6, Figure 7 and Figure 8, where both scanned images and elemental spectra of solid fractions from Recherchebreen and Storbreen are presented. Along with rock-forming minerals (e.g., quartz, feldspar and amphibole), various accessory minerals were identified in samples from both glaciers (Figure 2, Figure 3 and Figure 4). Amongst particles identified, micrometeorites (Figure 3) and particles of elemental carbon, probably BCPs, were found. These are of various sizes (up to ca. 100 μm) and have sharp edges. Accessory minerals include pyrite, which occurs as inclusions in feldspar (Figure 2) and independently in framboidal form (Figure 5). The presence of zircon, ZrSiO4 (Figure 6), and monazite, CePO4 (Figure 7), has the potential for geochronology. We utilized an electron microprobe with a beam size of < 5 μm to measure total U, Th and Pb and calculate chemical ages of monazite particles.

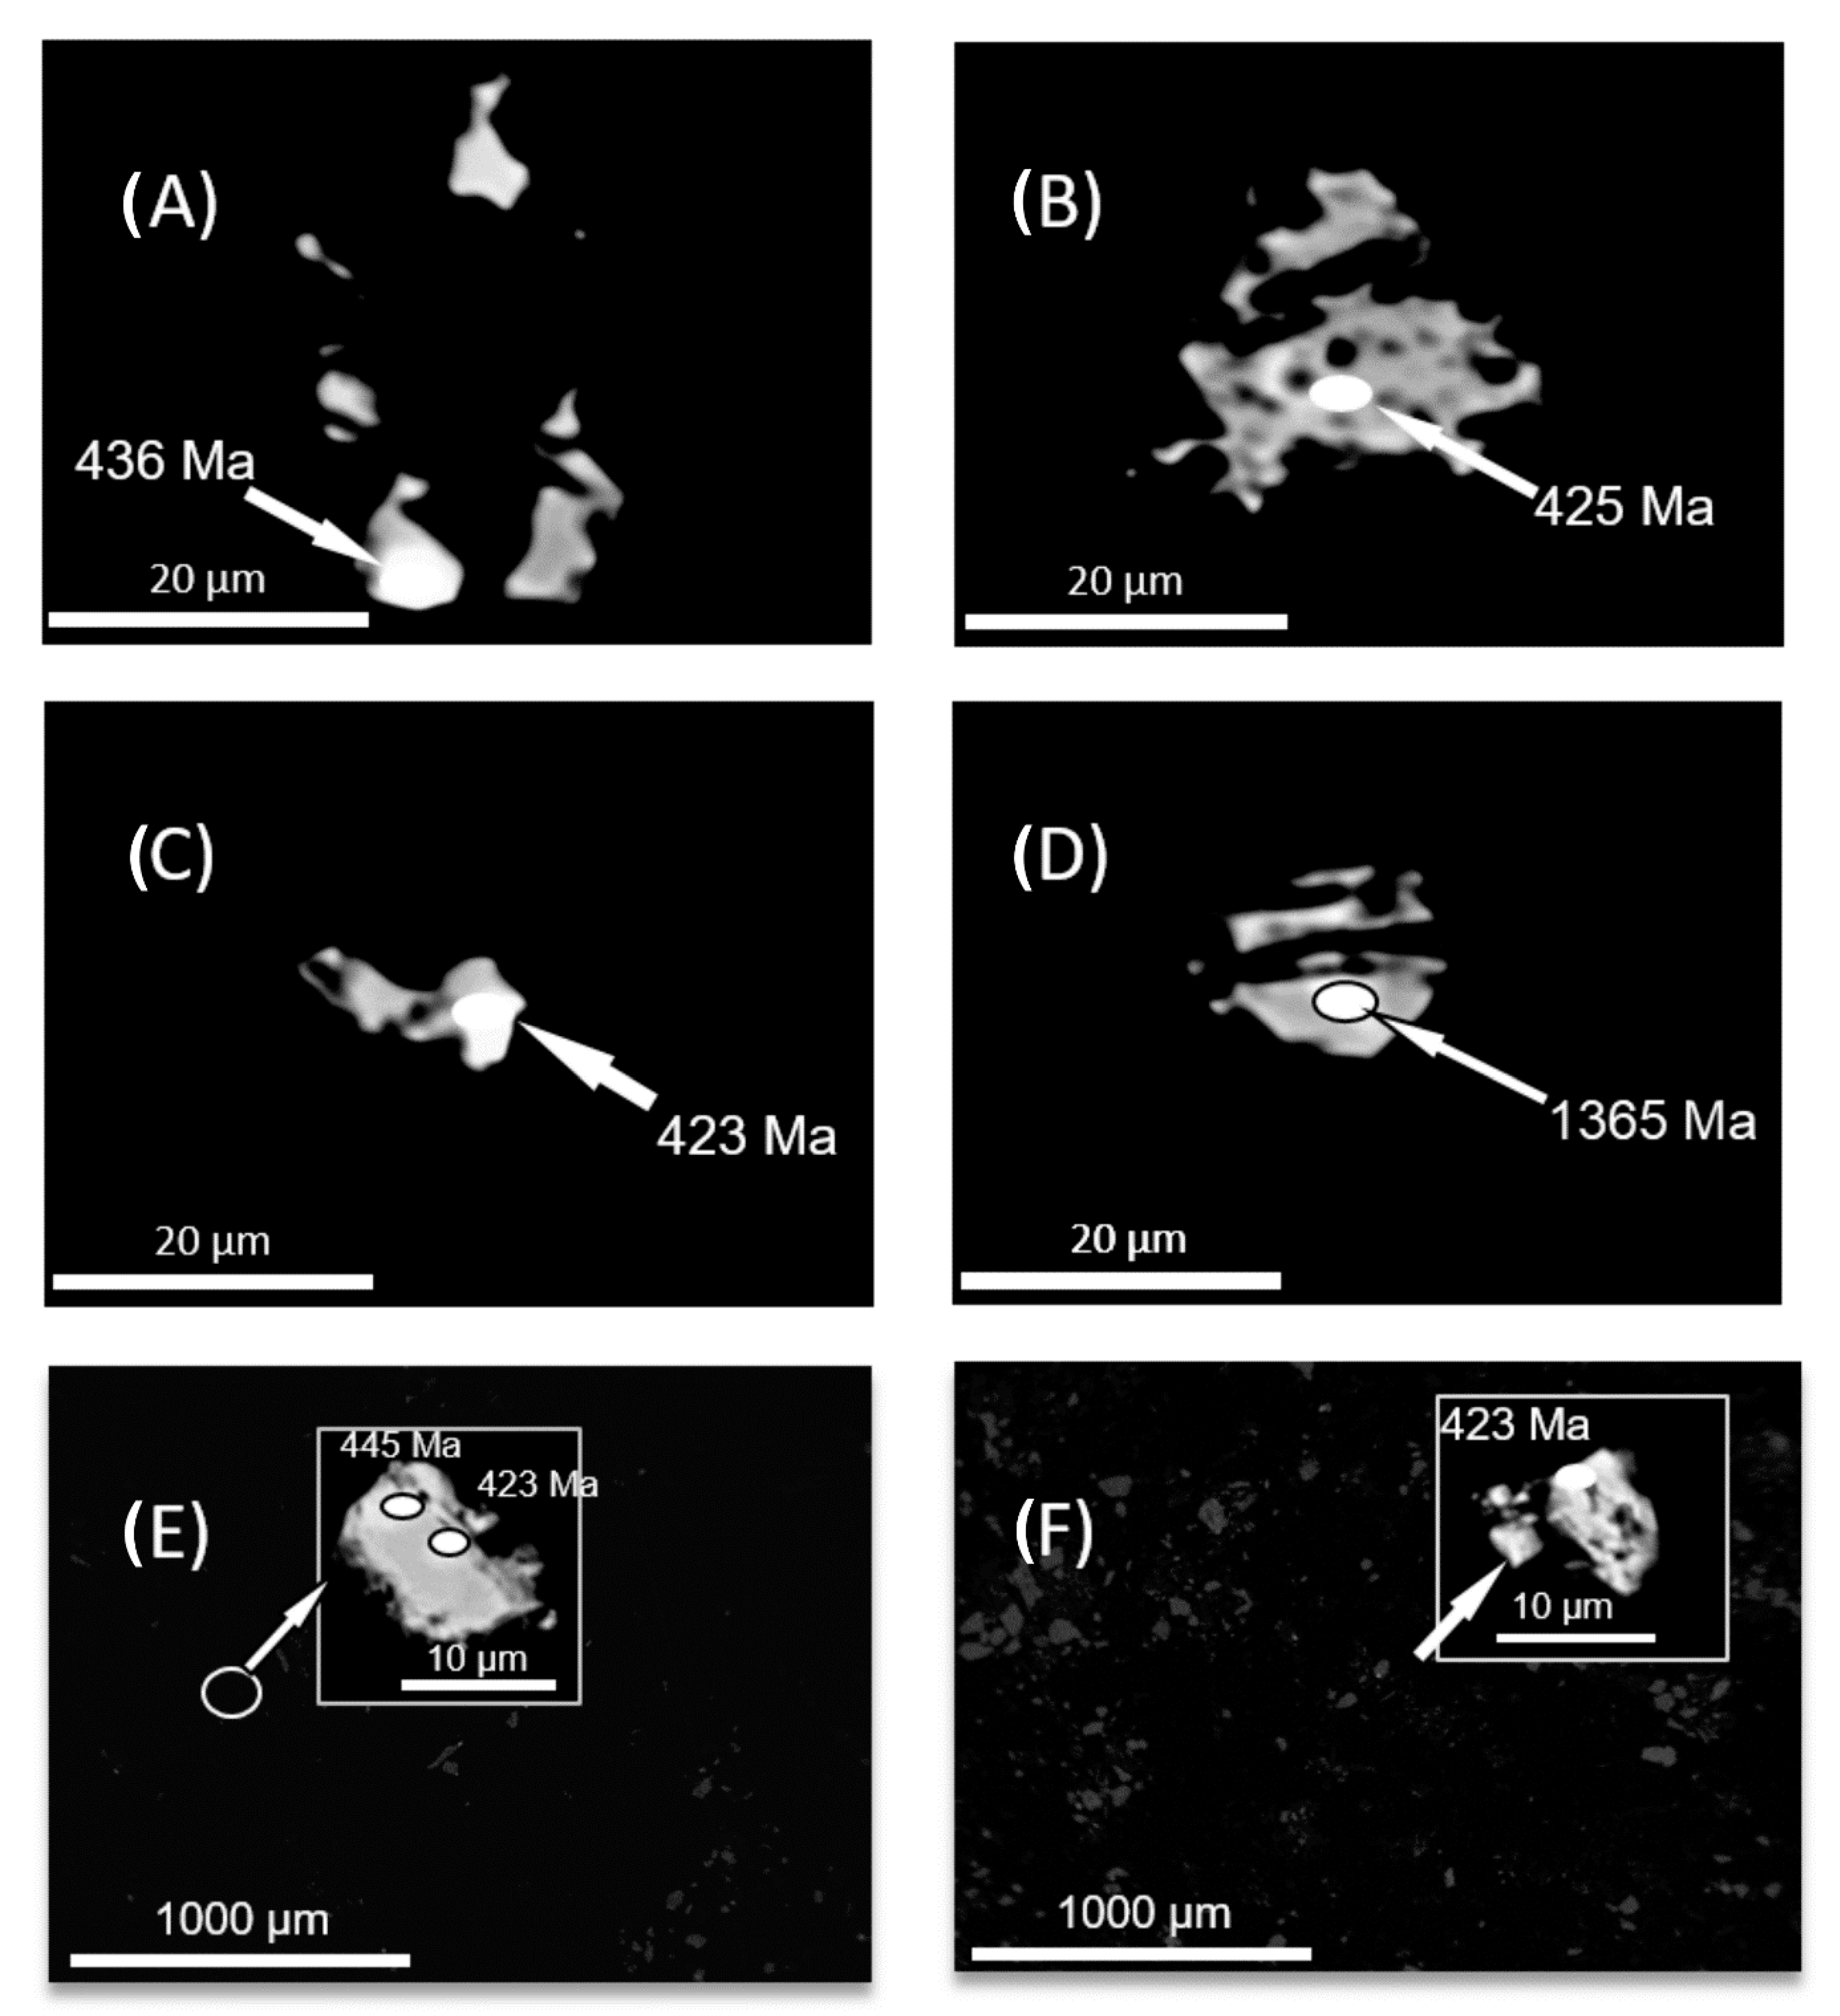
3.1.2. EMP Dating Results

Four monazite grains from Storbreen were dated (Sample SIC4), yielding an age range of 423–436 Ma, with one outlier of 1365 ± 34 Ma (2σ). The grains contain up to 4.7 wt% Th and up to 0.3 wt% U (Table A1). Eight analyses on six monazite grains from Recherchebreen were done, with a similar Silurian age range of 423–468 Ma. Outliers include ages of 1644 ± 42 Ma and 1780 ± 42 Ma (data from one monazite grain), together with a much younger age of 256 ± 36 Ma. The relatively large 2σ errors of individual analyses come from the low U and Th content in the monazite grains and, as a consequence, low Pb content. There is no correlation between age and error. Representative monazite grains with spot ages are presented in Figure 8.

3.2. Magnetic Results

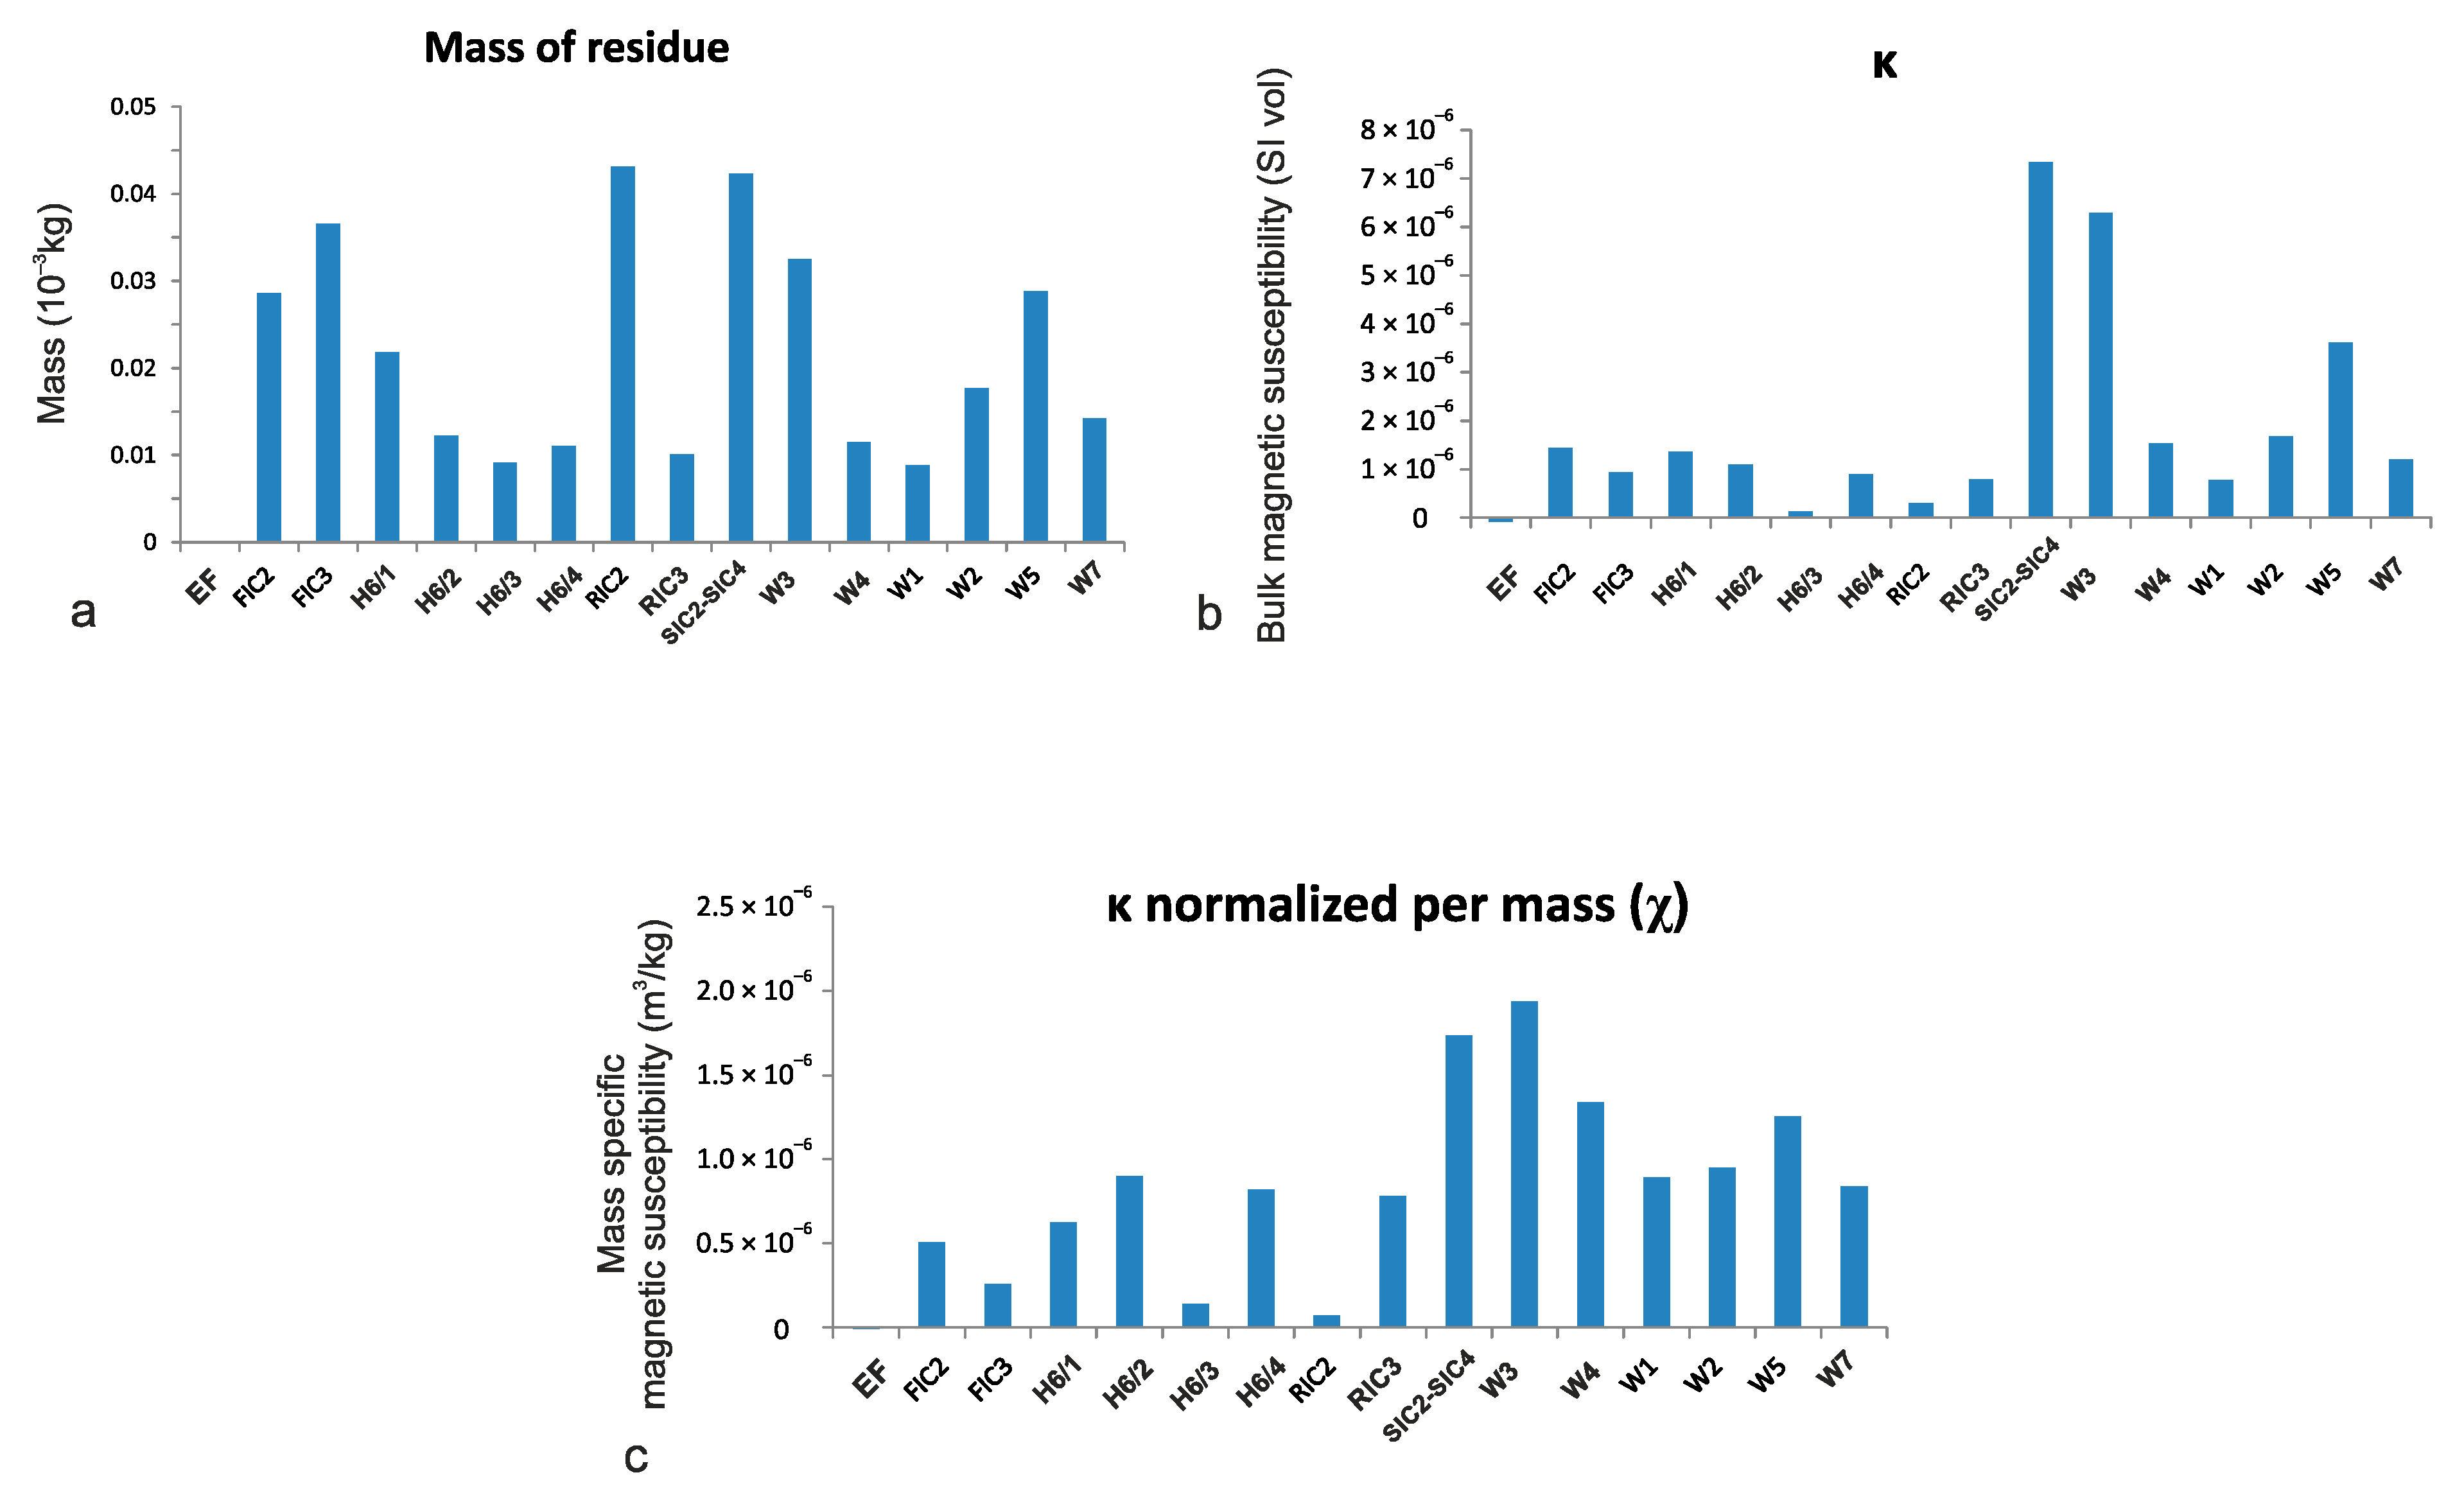
3.2.1. Mass and Magnetic Susceptibility of Dust

Dust residues in filters used for measurements of rock magnetism weigh between 8 and 43 mg (Figure 9a; empty filters weigh ~ 78 mg). A few filters (e.g., H6/3 and H6/4 samples) had some dust removed for other experiments before magnetic susceptibility determination. Therefore, for these samples, measured mass of residue is not the total amount collected.
Magnetic susceptibility shows a substantial scatter of values between samples, from 1.3 × 10⁻⁷ SI vol. for H6/3 up to 7.35 × 10⁻⁶ SI vol. for SIC2-SIC4 (Figure 9b), within the sensitivity range of the MFK-1 device. The standard error of measurement was less than 1.5 × 10⁻⁸ SI vol. for all samples. The very low κ of sample H6/3 is probably due to removal of a significant amount of dust residue for geochemical studies. The combined SIC2-SIC4 sample had an extremely high κ (Figure 9b). Susceptibility normalized by mass (χ) shows significant variation between the samples (Figure 9c).

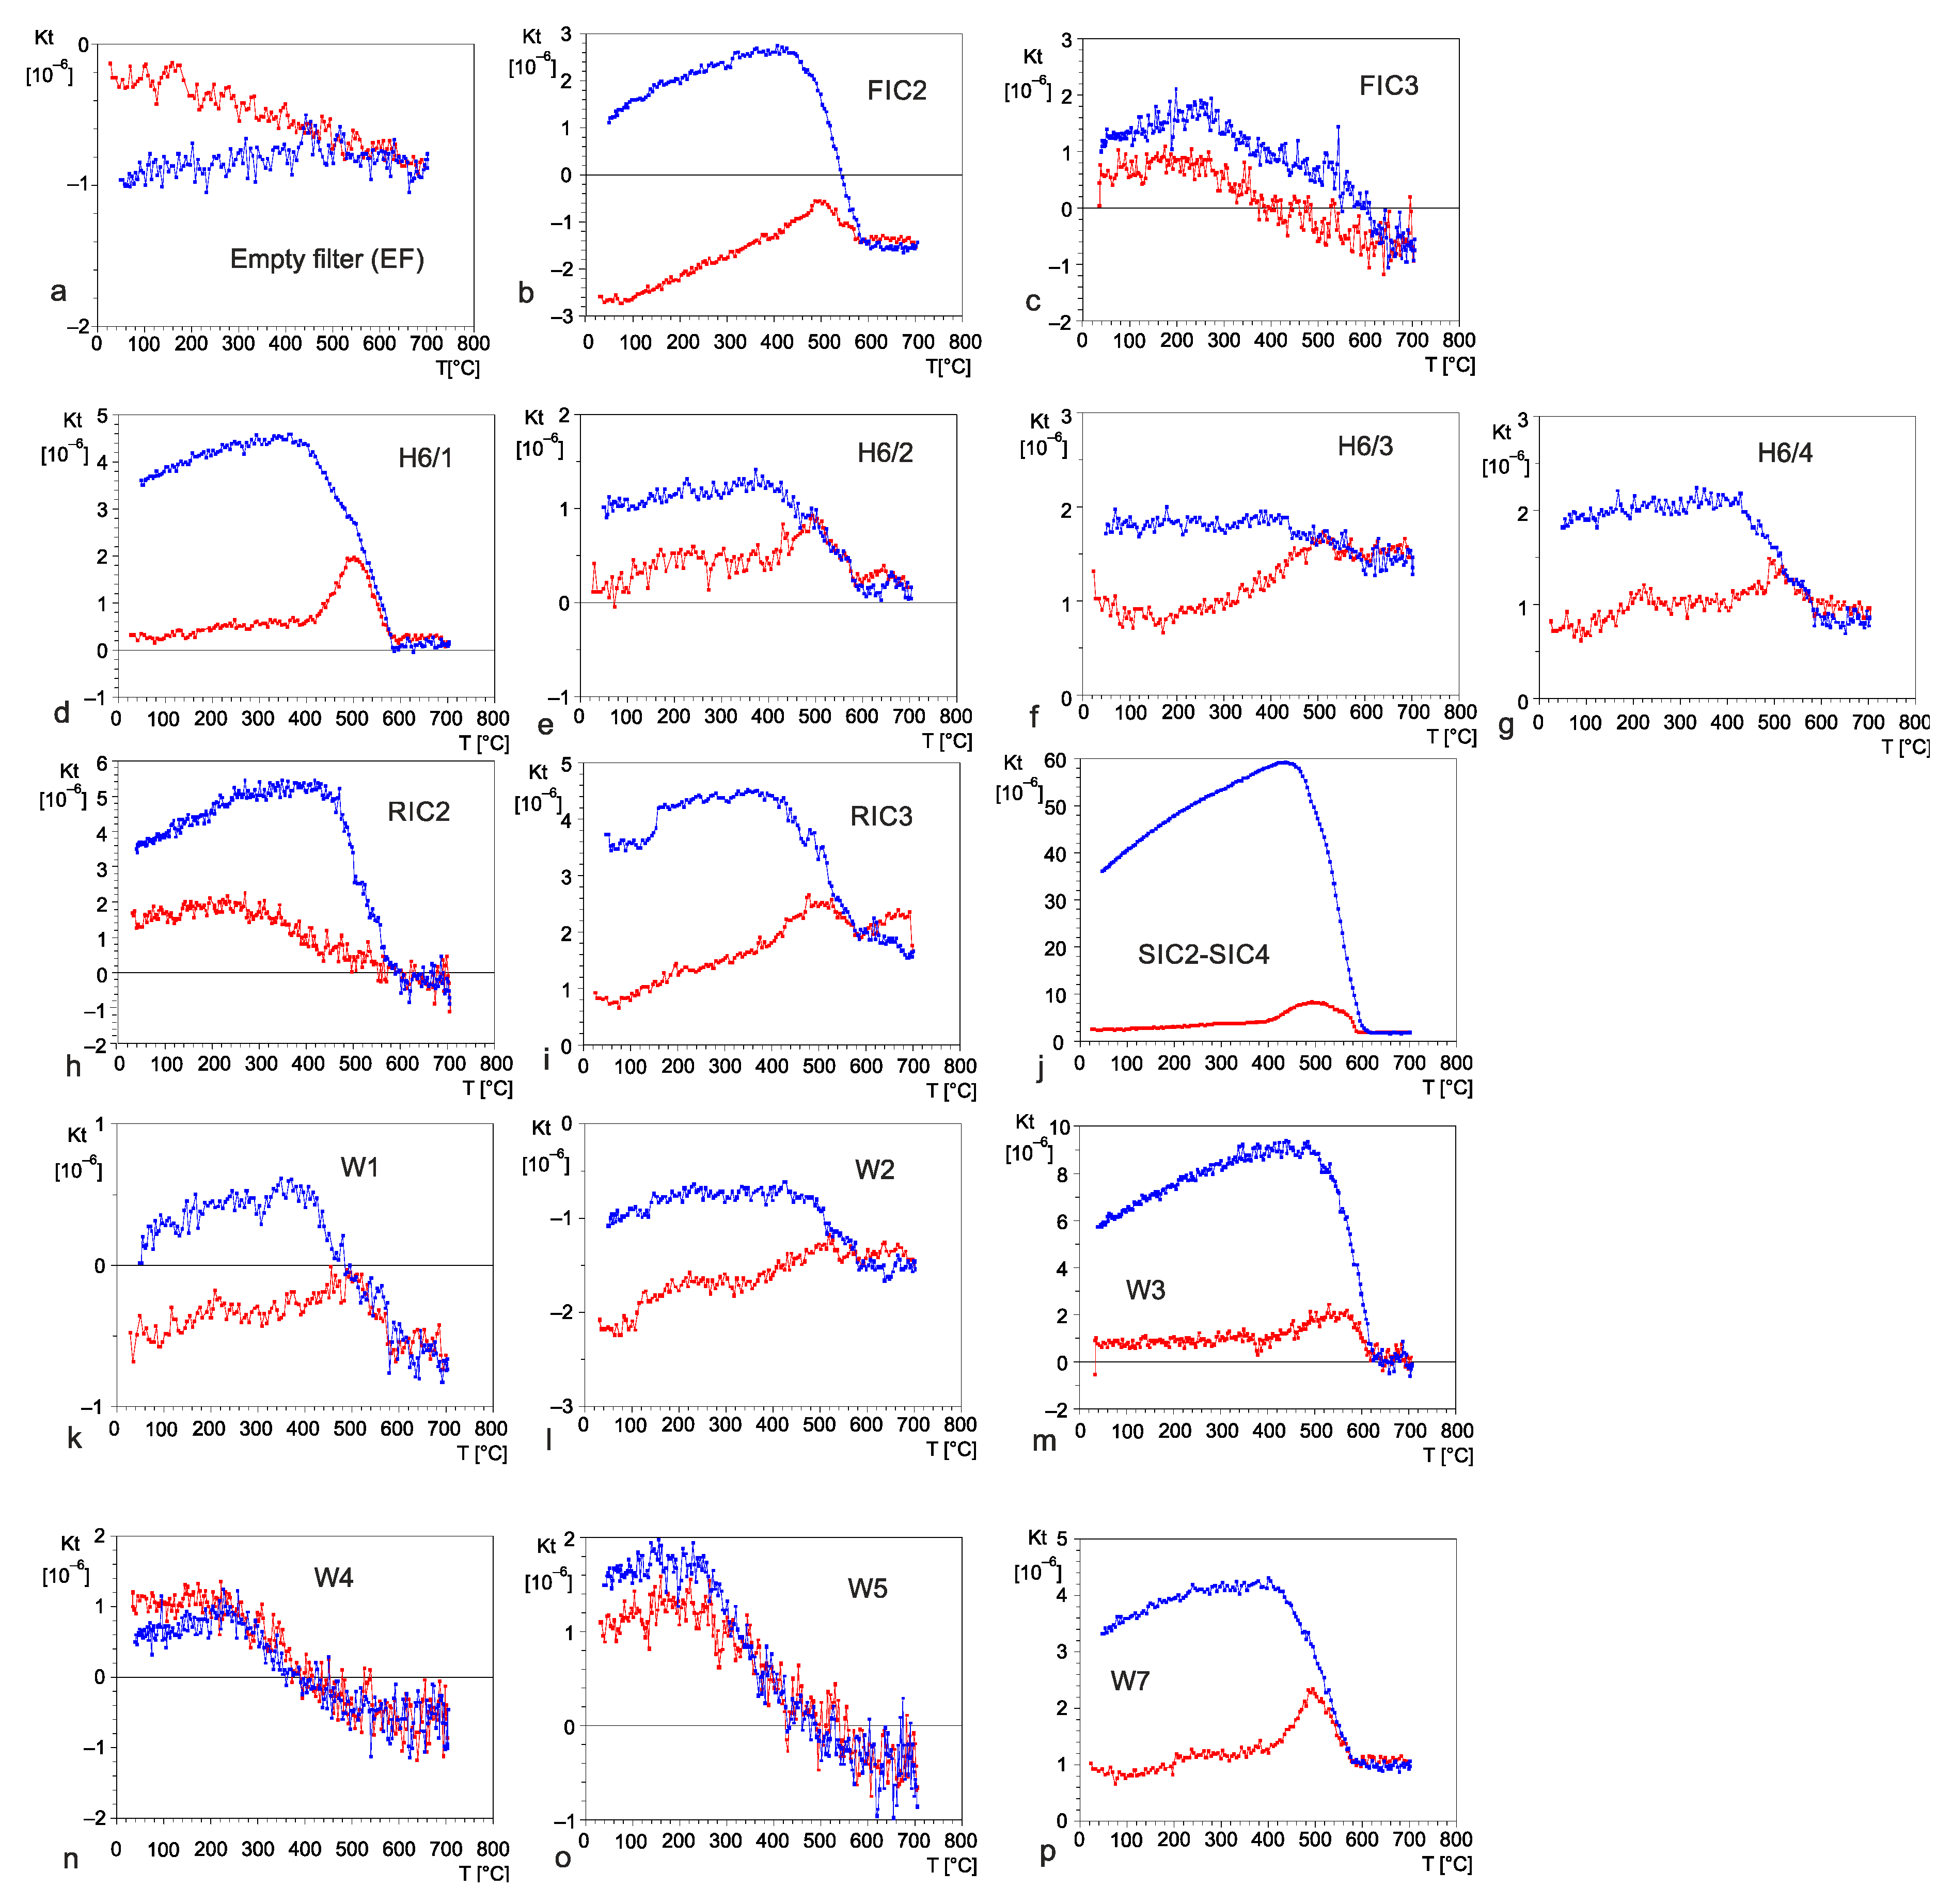
3.2.2. Magnetic Susceptibility upon Heating/Cooling

Curves of change in magnetic susceptibility upon heating and cooling are shown in Figure 10 for dust samples, as well as for empty filters. The matrix of the filter was burned when heated up to 700 °C. When heated in the sample tube with limited access to the atmospheric air, the dust residue can also undergo continuous change. Consequently, changes in magnetic susceptibility upon heating may reflect not only the response of dia-, para- and ferromagnetic phases to increasing temperature but also mineralogical changes. For the empty filter, only minor decay of susceptibility upon heating is observed, with no ferromagnetic contamination (Figure 10a). The stable susceptibility of the empty filter upon cooling indicates the removal of any paramagnetic phase. The background signal of the empty filter was subtracted from the total signal of dust and filter (Figure 10b–p). For dust samples, an increase in susceptibility upon heating occurs up to 500 °C, especially above 400 °C. A drop in susceptibility on heating to 580–600 °C is present for all samples. In the 600–700 °C range, signals show more noise and are difficult to interpret. Cooling curves from 600 °C have a typical strong increase below 580 °C, and upon cooling to room temperature, the susceptibility remains significantly higher than before heating.

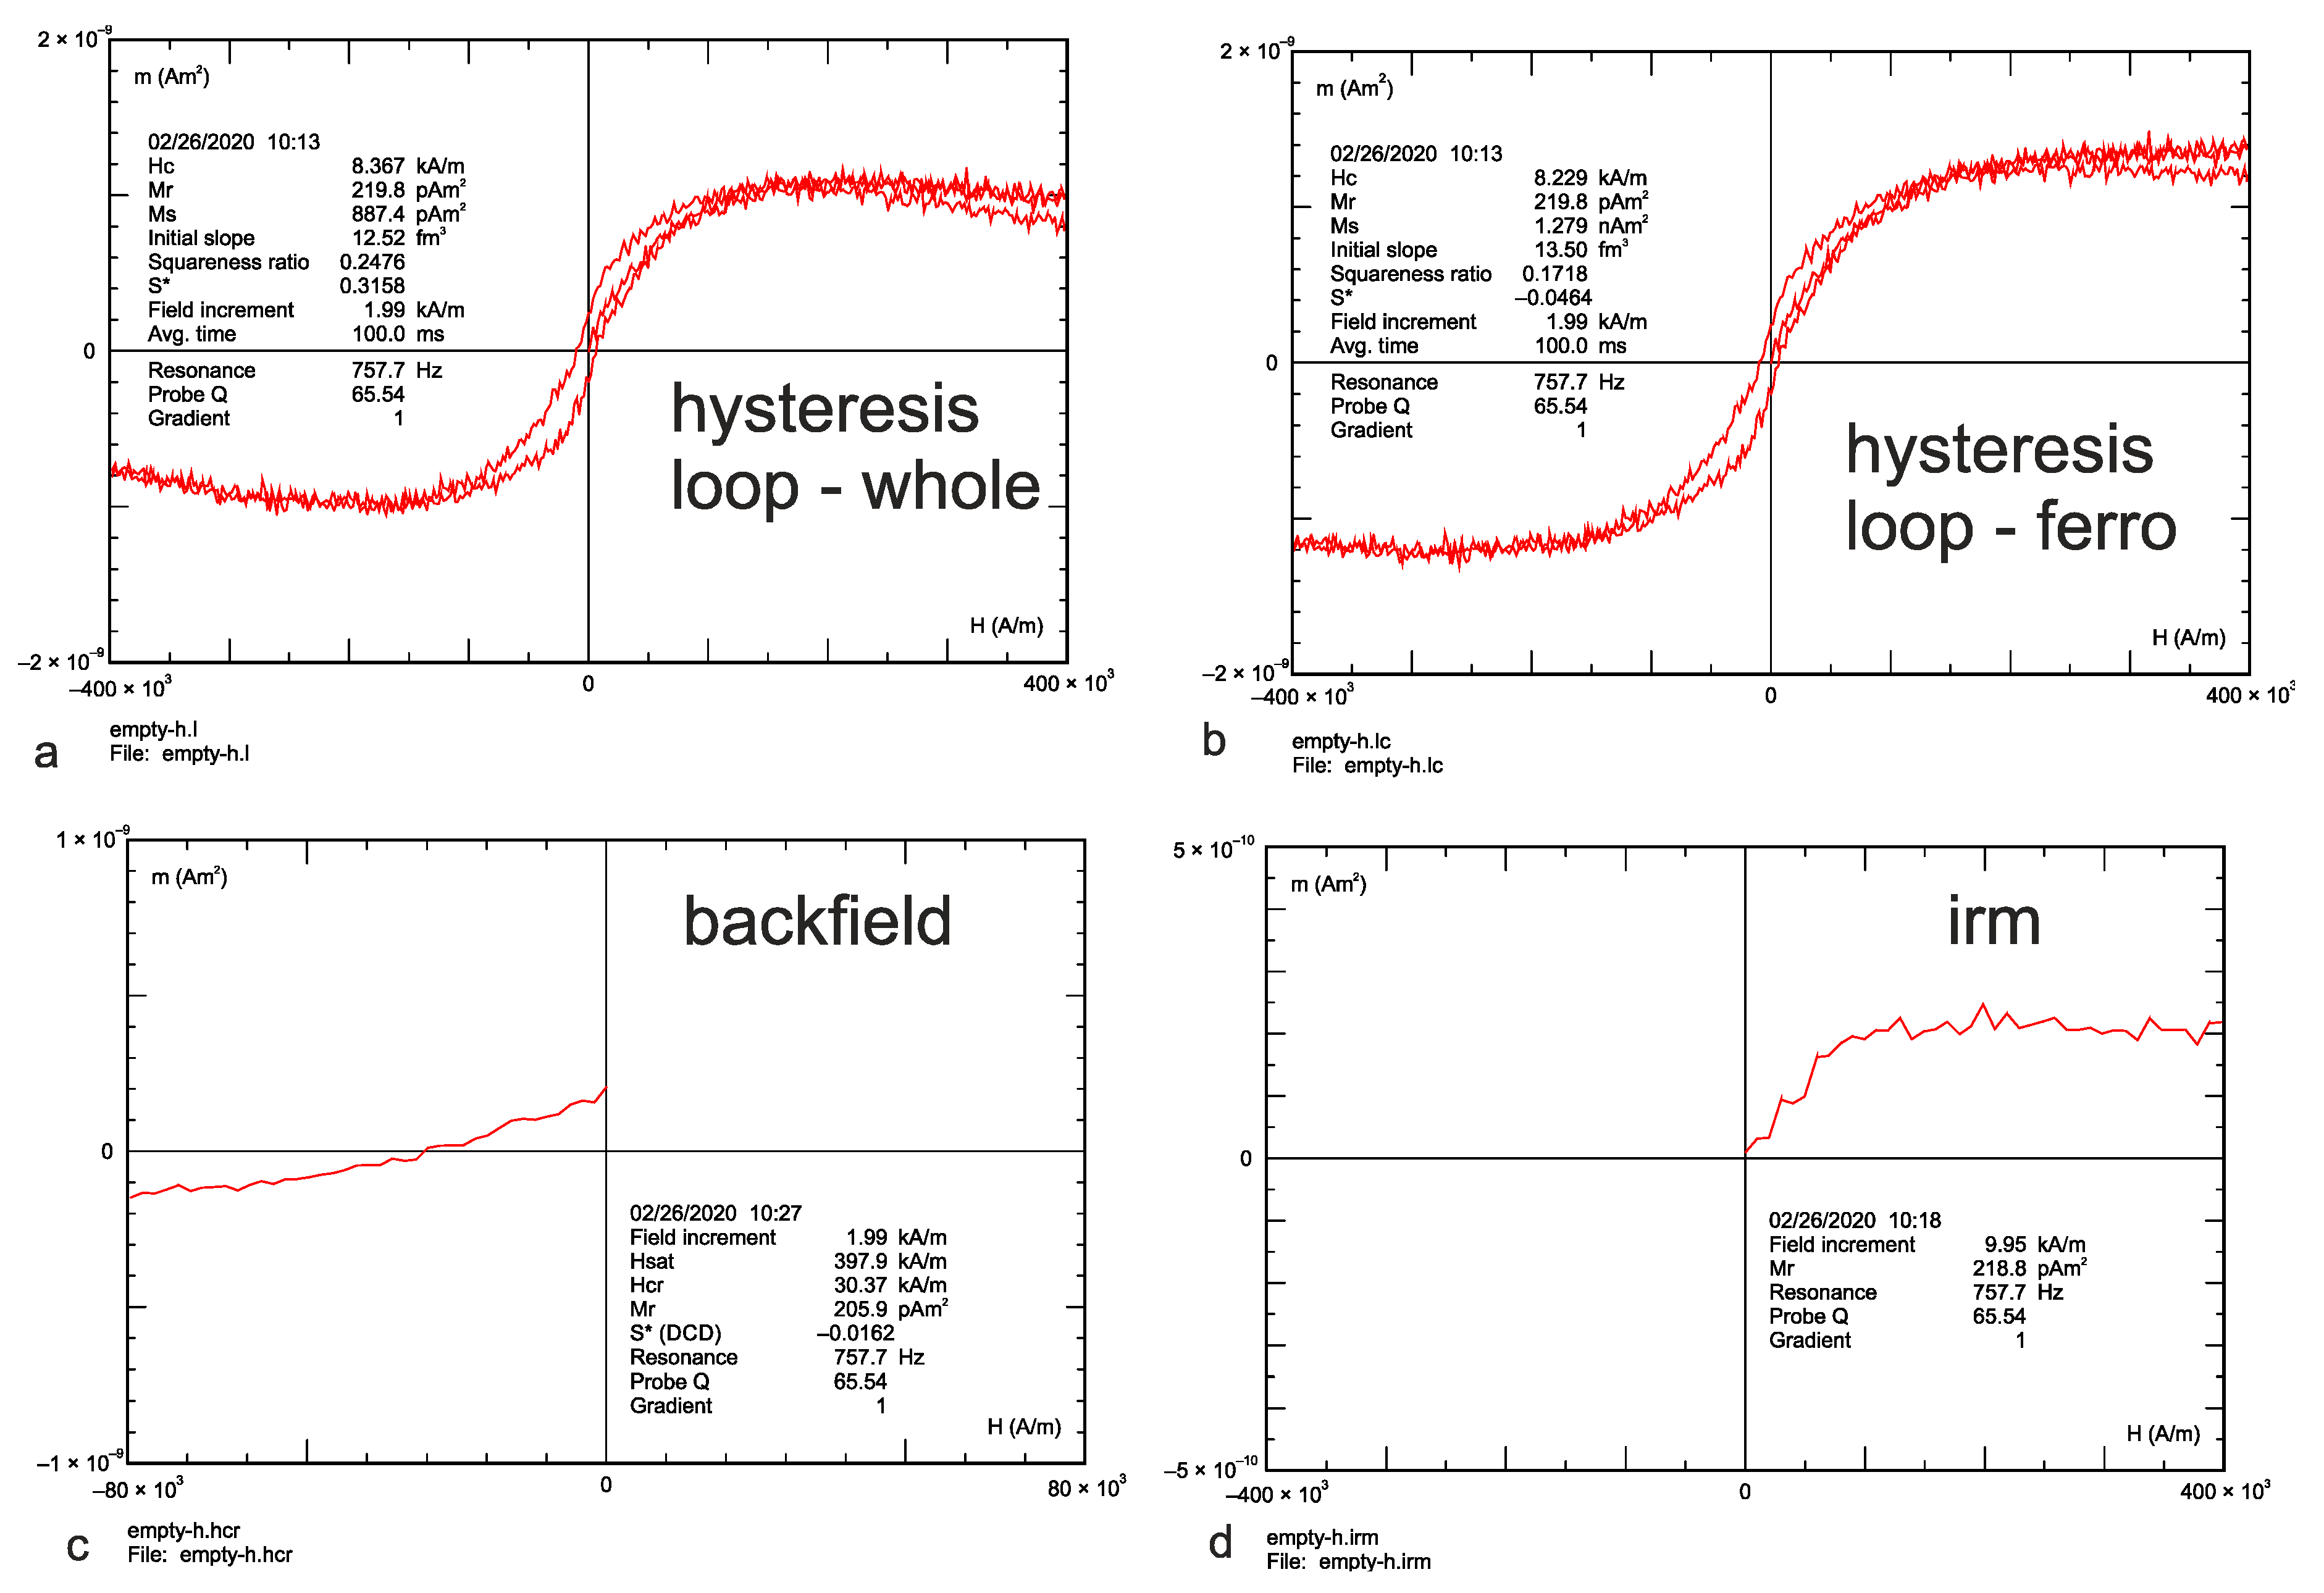
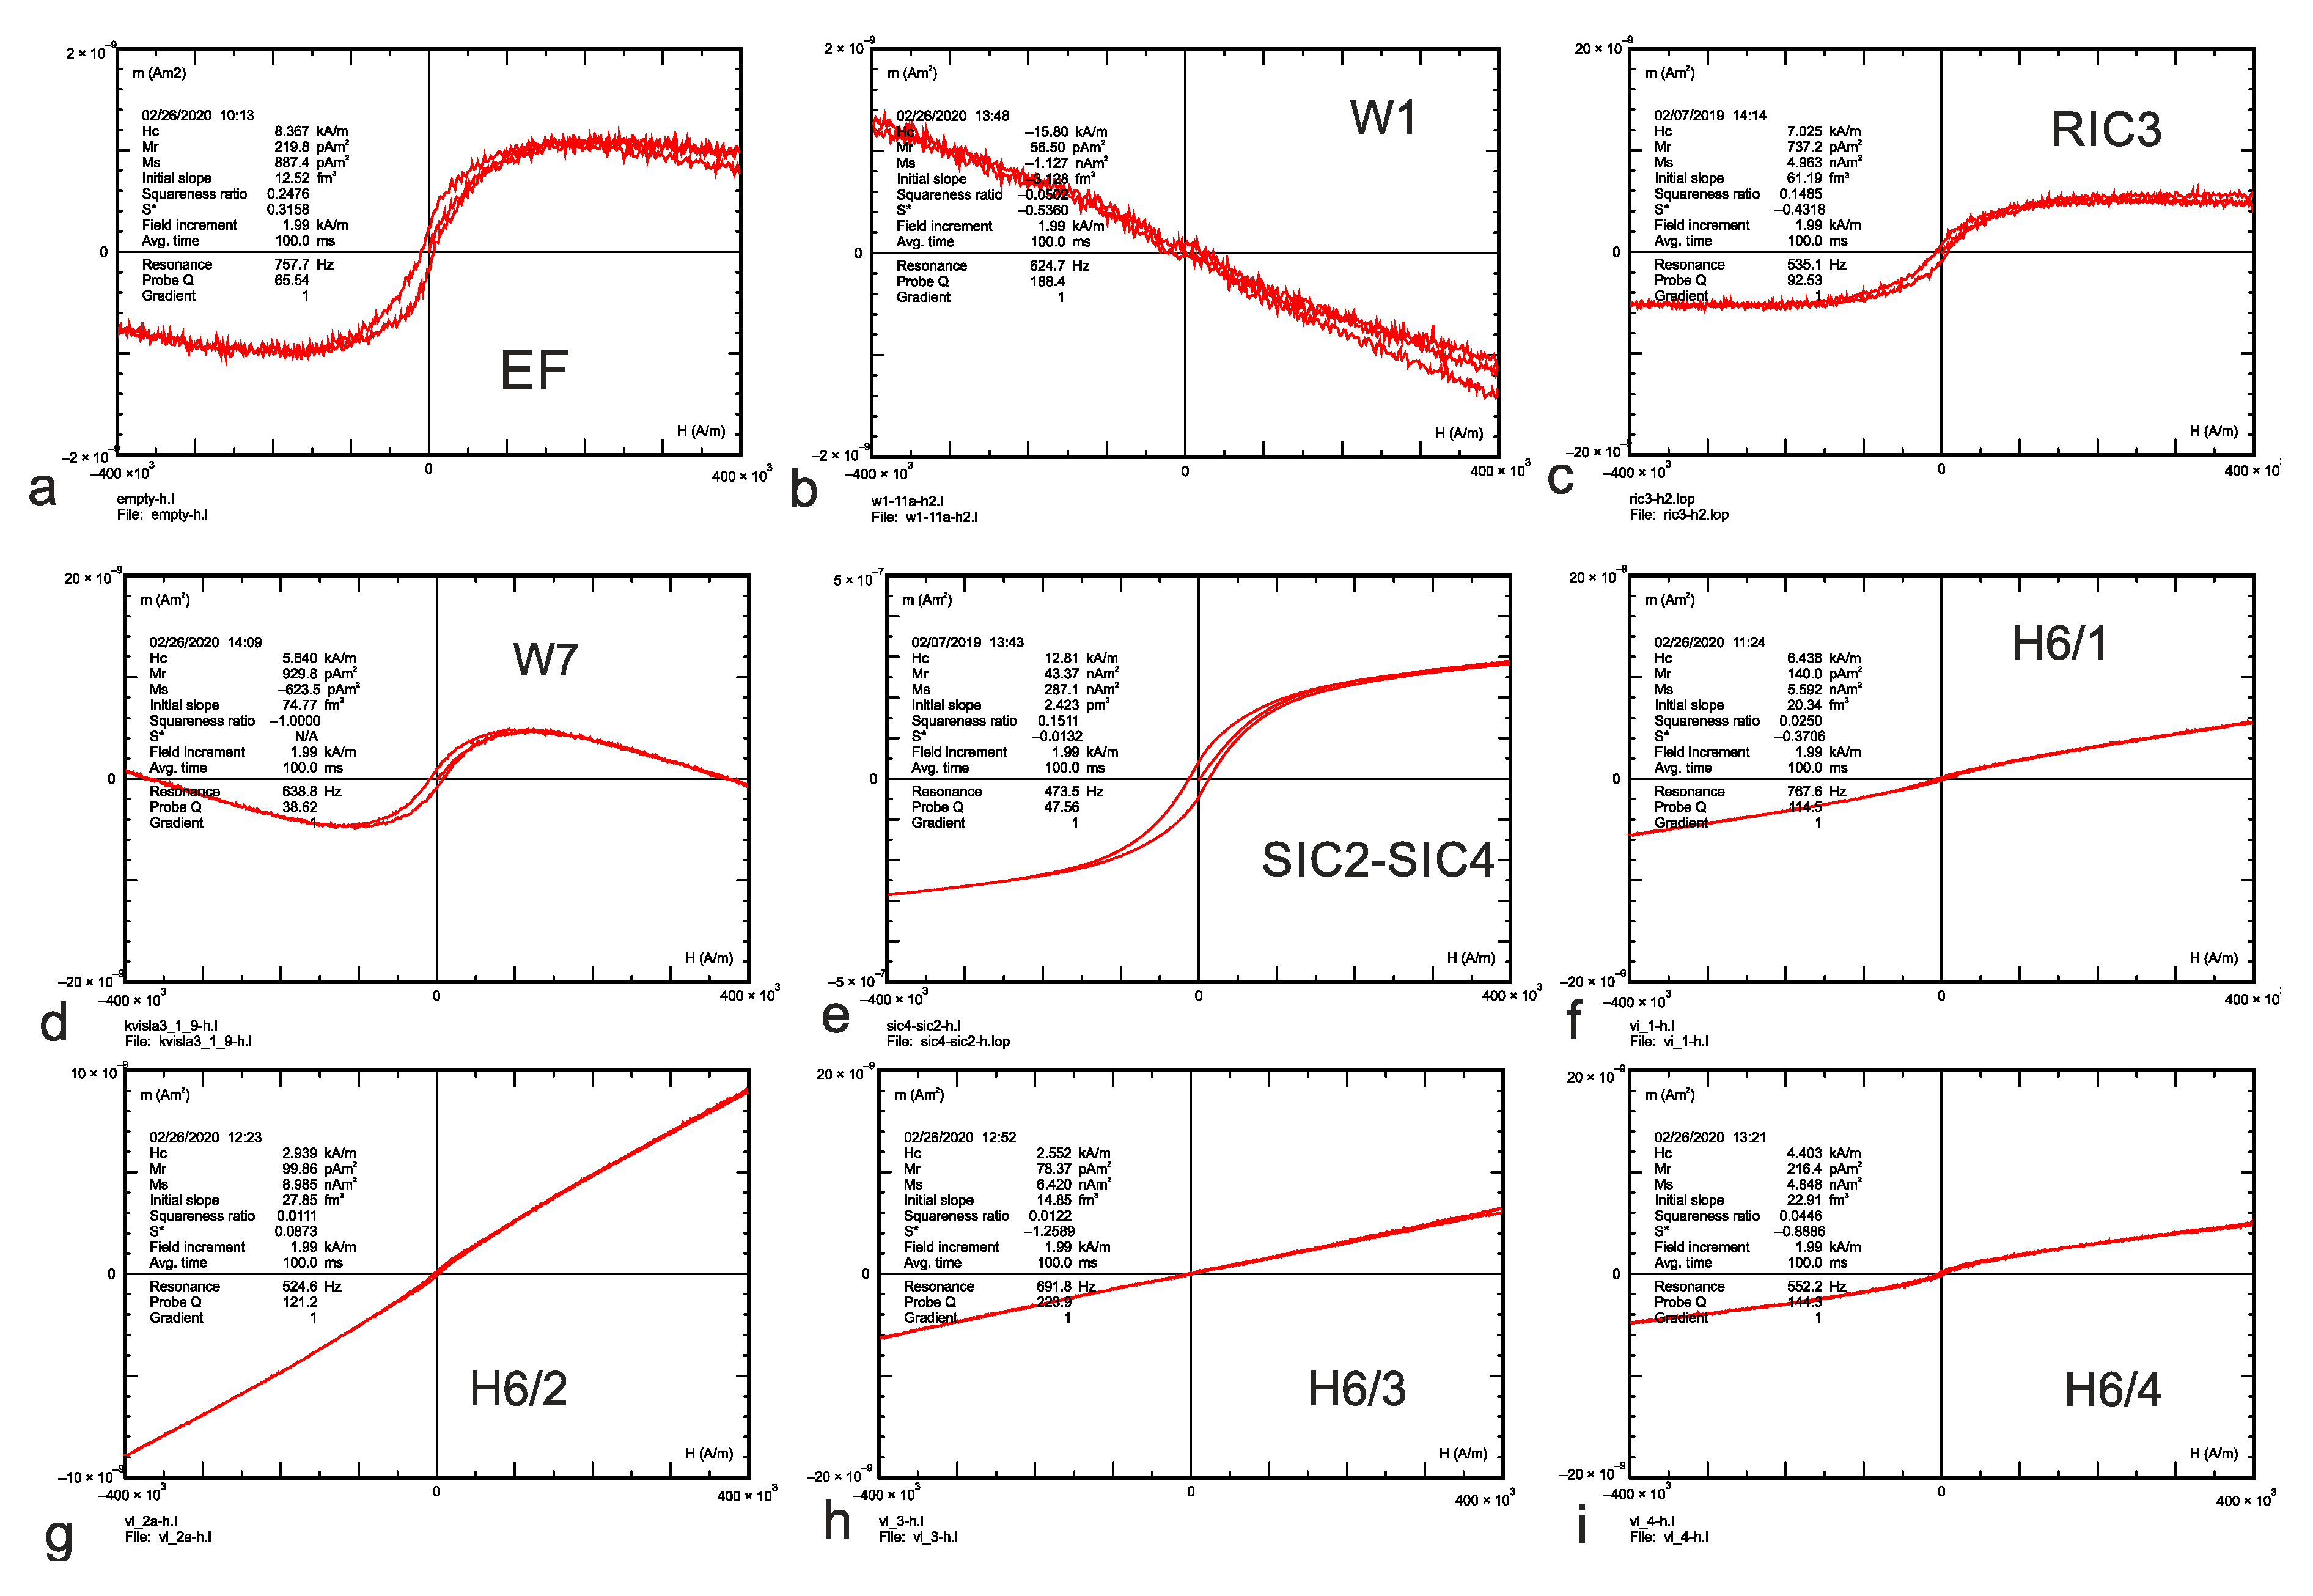
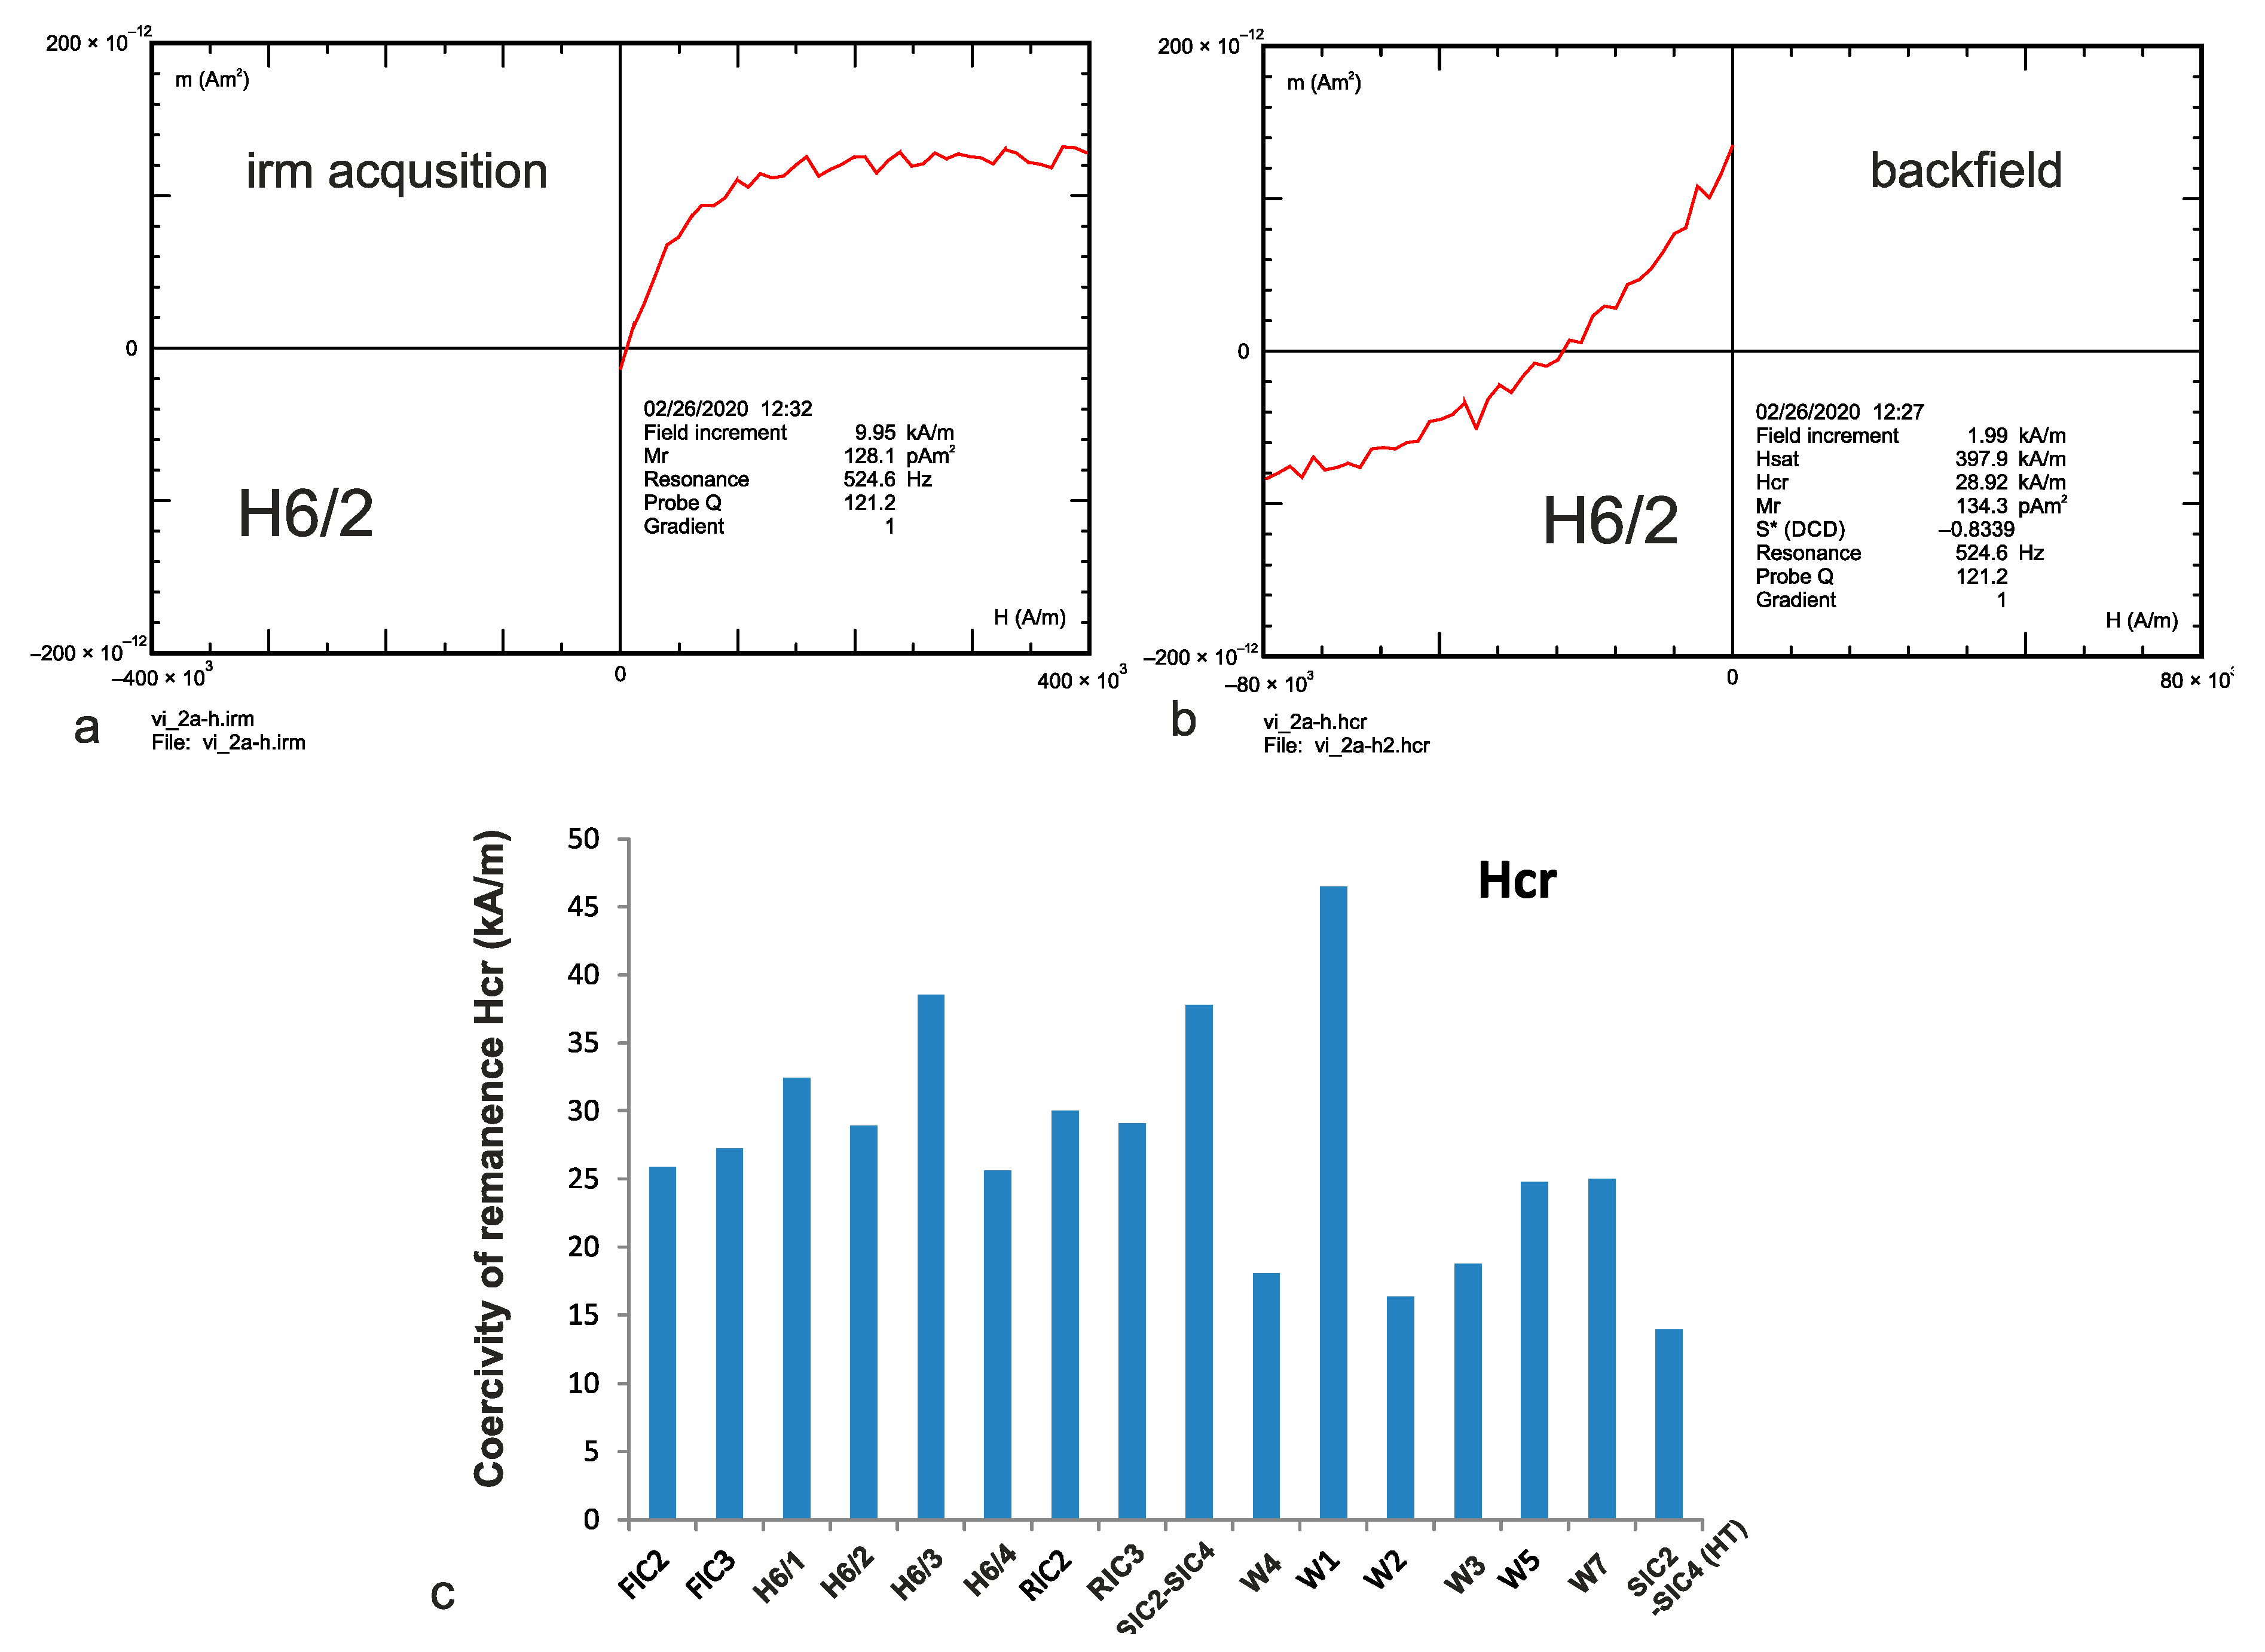
3.2.3. Magnetic Hysteresis Results

For an empty filter of mass 1.06 mg, the magnetic moment was a few times higher than for a diamagnetic sample holder. This indicates that, for most samples measured, results fall within the sensitivity of the equipment. The hysteresis loop for an empty filter reveals a weak ferromagnetic and diamagnetic contribution, as well (Figure 11), due to external impurities/contamination.
For dust samples collected on filters, experimental conditions were the same for all samples with mass in the range of 0.8–2.6 mg. The contribution of different phases to the initial (low field) susceptibility was evaluated based on the comparison of initial slope for the whole loop (Figure 11a, the contribution of all dia-, para- and ferromagnetic phases) and slope corrected values (Figure 11b, the contribution of a ferromagnetic phase only). Saturation magnetization moment Ms varied widely from −1.1 nAm2 (sample W1) to 287 nAm2 (sample SIC2-SIC4, Figure 12b–i) for raw (i.e., not slope-corrected) loops. In the case of two samples (W1 and W7), saturation magnetization Ms was negative due to a dominant diamagnetic background in dust collected in the filter. For sample W1, the ferromagnetic phase contribution was too low to calculate hysteresis parameters. For samples H6/1 to H6/4, a dominant paramagnetic phase was detected with a variably minor contribution of a ferromagnetic phase (Figure 12f–i).
The apparent contribution of phases to magnetic susceptibility was approximated based on the ratio of the initial slope after slope correction to the initial slope before slope correction (Figure 13). If such ratio is lower than 0.5, a dominant paramagnetic phase is observed (e.g., samples H6/1–H6/4, Figure 12f–i).
Further analysis of hysteresis parameters included interpretation of IRM acquisition curves and coercivity of remanence values. No noticeable increase in IRM intensity was observed above 300 mT in any sample, indicating that a high coercive ferromagnetic phase is not present (Figure 14a). The coercivity of remanence values (16–46 mT) is also typical for low-coercive ferromagnetic phases (Figure 14b,c). The product of heating of SIC2-SIC4 dust shows much lower coercivity, pointing to a phase transformation of some dust components, e.g., magnetite from pyrite (Figure 14c).
For samples where hysteresis parameters Mr, Ms, Hc and Hcr for ferromagnetic phases were calculated (all samples except for W1 and H6/3), the Day–Dunlop plot of apparent ratios Mr/Ms vs Hcr/Hc was compared with theoretical curves calculated for several mixtures of single domain, superparamagnetic and multi-domain (SD, SP and MD) magnetite (Figure 15). Samples show a well-developed cluster of values characterized by a mixture of SD+MD or SD+SP magnetite grains.

4. Discussion

To our best knowledge, there have been no studies to date involving geochemical dating of a dust particulates as small as < 20 μm, to infer dust sources, specifically using non-isotopic methods. In contrast, magnetic methods have been used for determination of the dust sources both at low-to-moderate latitudes (e.g., Reference [41]), and in polar regions (see References [42,43] and references therein). Magnetic studies (IRM) of the whole-ice specimens from Antarctica and Greenland were performed at temperatures of 77 K [42] or 100 K [43], using superconductive magnetometers (SQUID) for IRM measurements, which were then used for Hcr calculation. We also performed magnetic studies, but at room temperature, using a Micromag AGM magnetometer to obtain hysteresis parameters from direct measurements on cryodust concentrates. Unlike the IRM method, magnetic susceptibility vs. T analyses (not possible on ice cores) allowed us to determine the Curie temperature, which unequivocally identifies the magnetic phase.

4.1. Geochemical Results

Interestingly, zircon and monazite are present among heavy mineral particles, and, consequently, geochronological measurements by electron microprobe could be performed. Although electron microprobe analysis is not as precise as isotope dating, it has high spatial resolution, and age of particles less than 10 microns across can be estimated without damaging the material. For the purpose of our study, age information is very important in recognizing the potential sources of aerially transported dust. Most of the data from both geochemically analyzed glaciers, indicate Silurian (syn-Caledonian) ages. Age data of 1.3 Ga (Figure 8D), 1.6 Ga and 1.8 Ga may be derived from basement rocks, as such data were documented from granitic–gabbroic rocks of the Skålfjellet Subgroup in Southwest Spitsbergen [44].
Spherical aggregates of minute pyrite (framboids) are the most common sulfides in the natural environment. There are various proposals for the formation of framboids, mostly involving a biogenic origin (see Reference [45] for a comprehensive overview). Pyrite framboids often occur along with organic matter, silicates and/or carbonates. Although framboids are widely dispersed in rocks and sediments worldwide, we suggest that framboids in glacier ice stem from a local cryoconite microenvironment, in which biotic–abiotic interactions in the presence of sulfur and iron ions facilitated the formation of FeS2. This is supported by the well-preserved spherical forms of the framboids (Figure 5).
Black carbon particles are emitted as a result of the incomplete combustion of fossil fuels and biomass (e.g., see Reference [11]). Once deposited in or on snow, BCPs can reduce snow albedo and accelerate snow melting, depending on their size distribution on the surface. We note that the BCPs identified in this study are relatively large, perhaps pointing to nearby combustion sources and anthropogenic activity.

4.2. Magnetic Results

For all dust residue samples collected in filters, magnetic methods brought information about the magnetic phase composition. It should be underlined that magnetic analysis comprised all magnetically active mineral particulates in the sample, regardless of their size. The amount of collected material was sufficient to produce interpretable κ(T) and hysteresis curves for all but two samples.

4.2.1. Susceptibility Results

Changes in magnetic susceptibility upon heating revealed the presence of magnetite that could be of two origins—primary or produced in the laboratory as the product of oxidizing of initial non-ferromagnetic phases. The increase of the amount of magnetite upon heating, revealed by the cooling curves, can be attributed to the oxidation of iron sulfides. High-temperature segments of κ(T) curves are difficult to interpret. The presence of a small amount of weakly ferromagnetic hematite cannot be excluded (Figure 10c,f–i). Such hematite could be both primary and secondary, generated during laboratory experiments due to oxidation of Fe-bearing minerals. However, in fresh non-heated samples, no significant amount of high coercivity phases, such as hematite and/or goethite, was observed when IRM acquisition curve data are examined. Given these circumstances, it is advised to perform κ(T) experiments in the presence of Ar gas, to assure a neutral ambient atmosphere for heated samples. We noted an important variation of magnetic susceptibility for unheated samples (Figure 9c), pointing to differences in the concentration of magnetic fractions between coring sites.

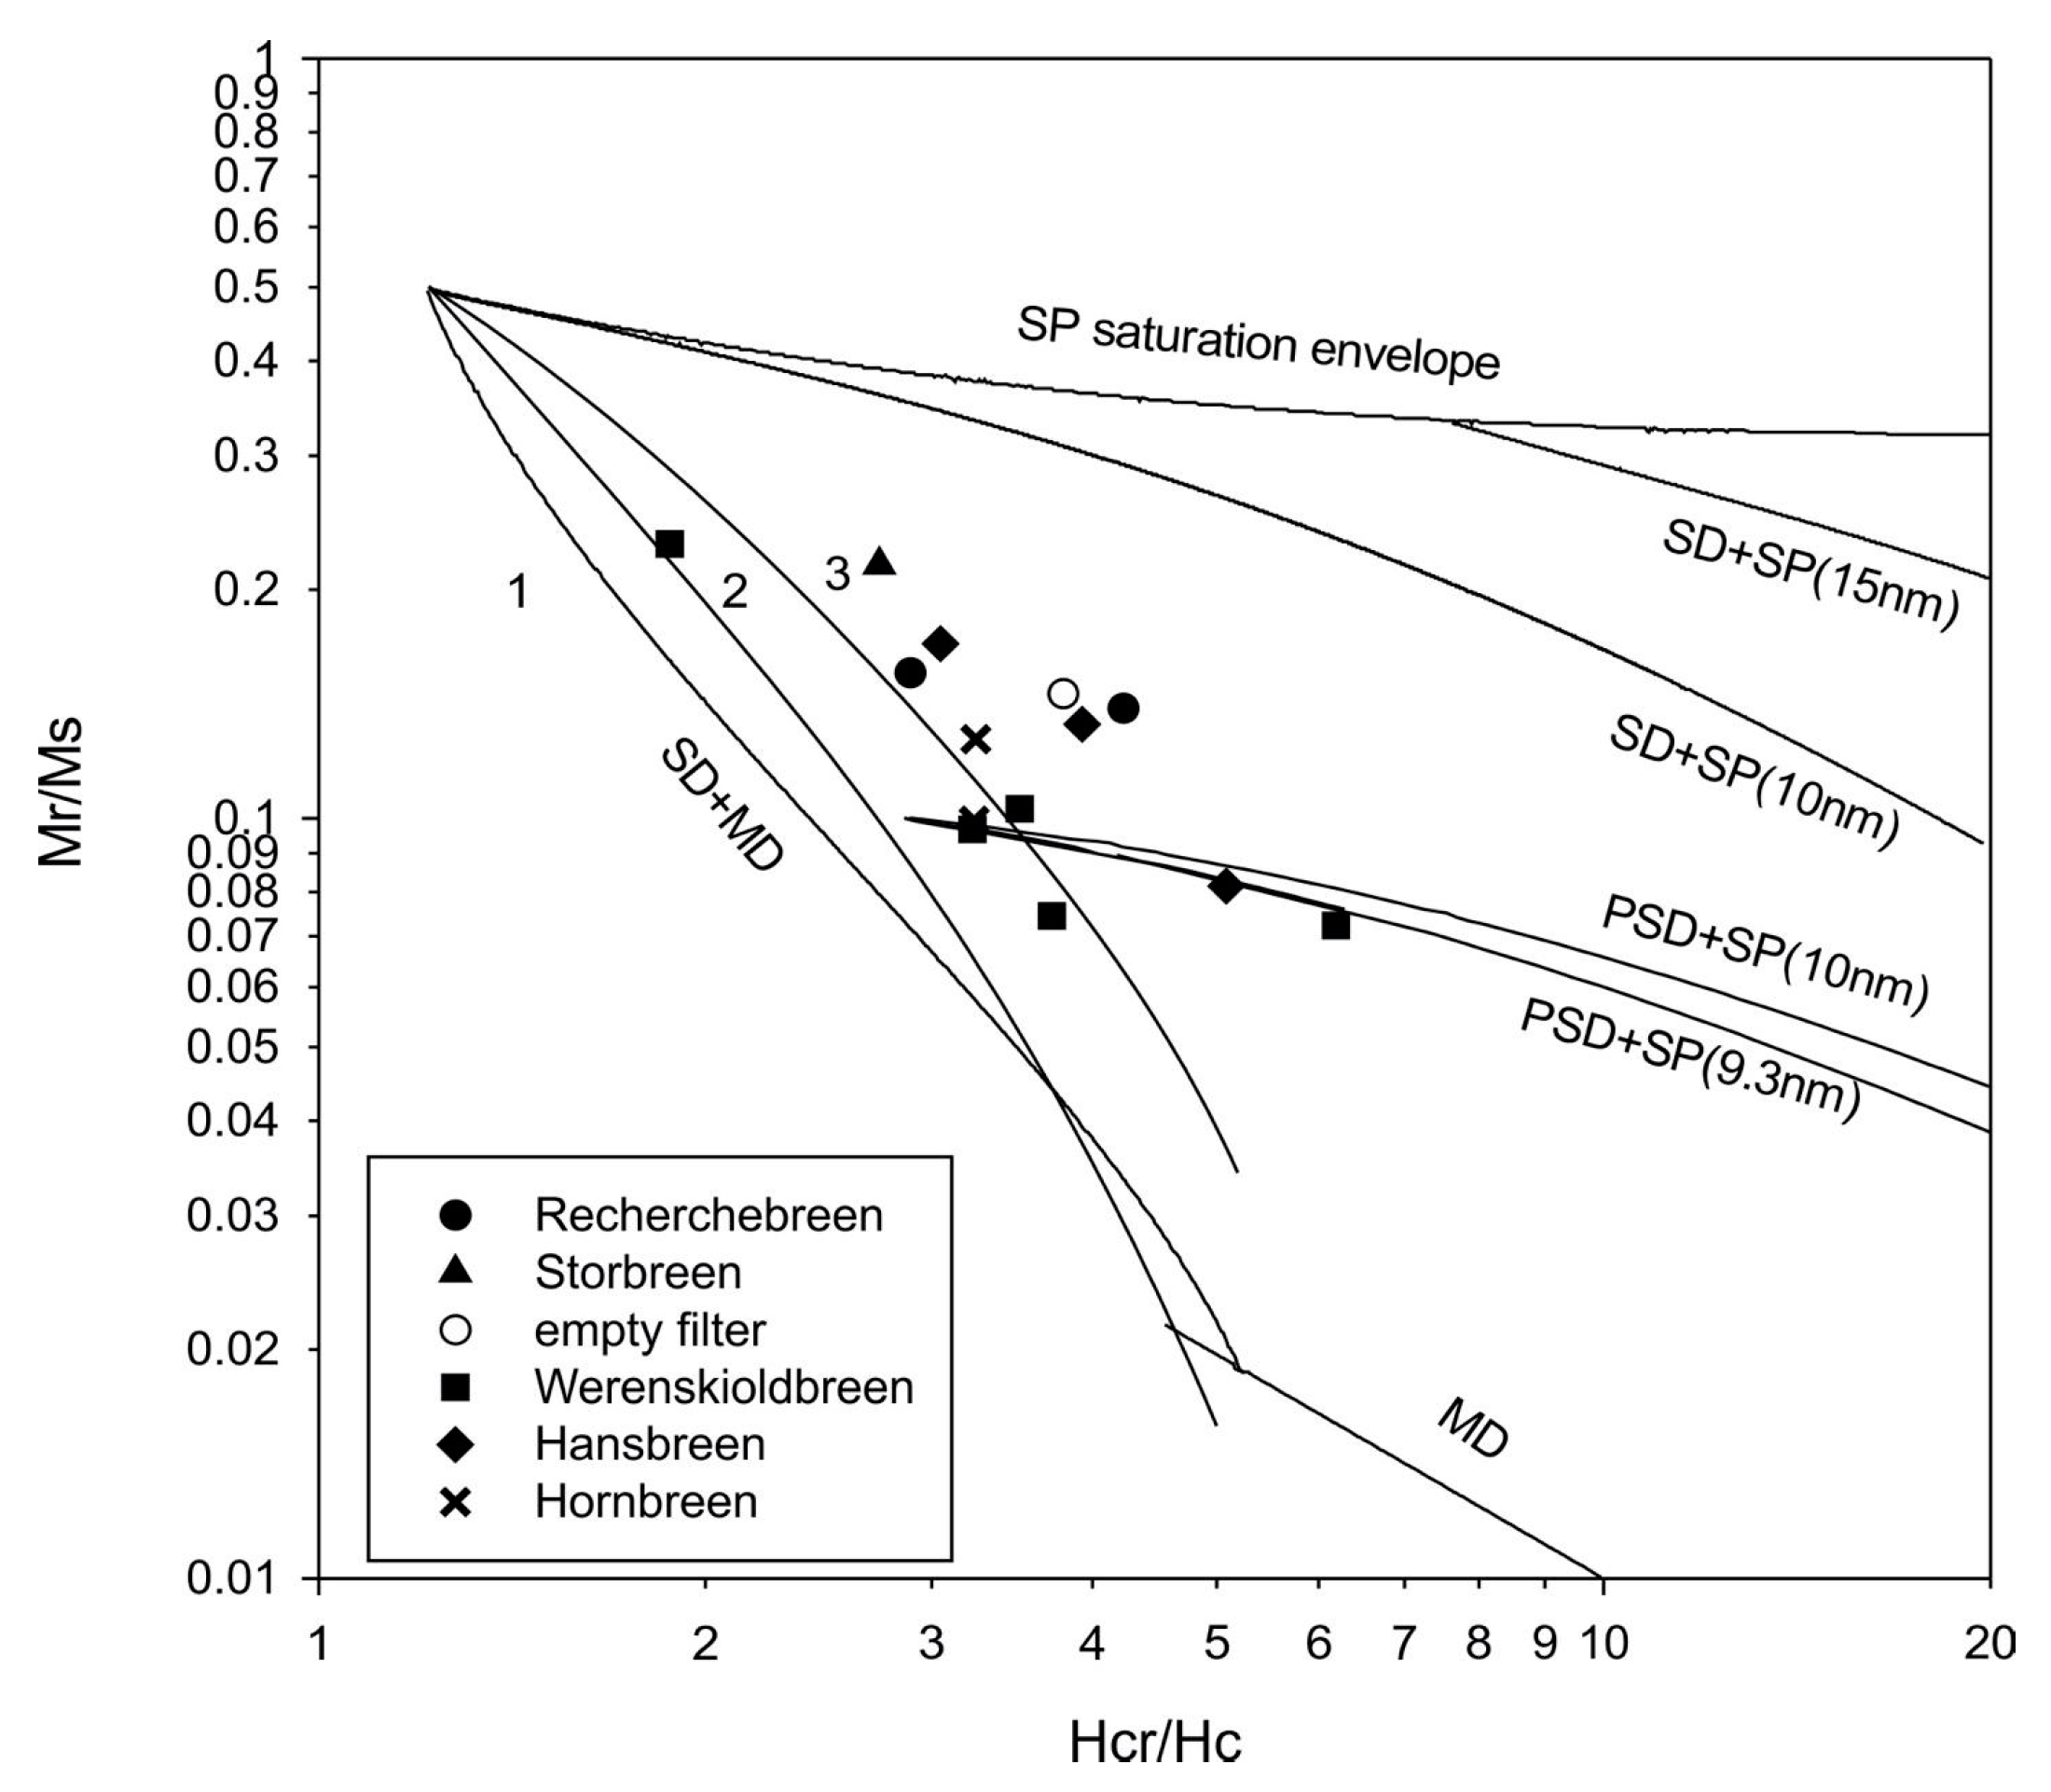
4.2.2. Hysteresis Parameters

Magnetic hysteresis studies indicate that the concentration of para-, dia- and ferromagnetic phases in the cryodust is variable even within the same long ice-core (Hornbreen (Flatbreen) H6/1–H6/4). Variation in the concentration of magnetic grains along the core implies temporal changes in the dust supply, although time bracketing for sedimentation rates is difficult to assess for lack of time constraints.
In general, three types of cryodust can be distinguished on a basis of the predominant contribution of the mineral grains to magnetic properties (see Table 2): A—diamagnetic type, B—paramagnetic type and C—ferromagnetic type. Ferromagnetic dust is overwhelmingly present in all cores, making a natural background for variable concentrations of paramagnetic and diamagnetic fractions. Such variation may be dependent on local bedrock exposed to weathering. Good examples are the cores from Werenskioldbreen, compared with those from Storbreen and Hornbreen (Flatbreen). The former includes higher diamagnetic fractions, consistent with proximity to exposures of the Carboniferous–Permian carbonates (note that CaCO3 is diamagnetic, while phases such as clay minerals and pyrite are paramagnetic) of the Kapp Starostin Formation and the Hyrnefjellet Formation [46].

4.3. Dust Source Areas

4.3.1. Sedimentological Indicators

Dust particles are poorly sorted, coarse and irregular in shape, indicating limited transport. Grain sizes within the aerosol range, spanning from a few up to 60 µm, are common. Larger grains, up to ca. 100 µm are also present (Figure 2 and Figure 4), and they were probably transported by extremely strong winds from mountain exposures surrounding the glaciers.

4.3.2. Geochemical Indicators

Chemical analysis indicates a Silurian age for most of the dated monazite (Figure 8). The nearest area with rock exposures of this age is the Nordaustlandet (Figure 1) [47]. Although direct transport from the source area is possible, we also allow for stepwise transportation of the monazite grains, with temporal settling at intermediate grounds/places. Interestingly, a few monazite grains yielded Proterozoic ages, dated 1.35 Ga (see Figure 8D), 1.6 Ga and 1.8 Ga. These grains could be derived from the sedimentary protoliths of the Isbjørnhamna schists, which contain detrital grains of Paleoproterozoic zircons [44].
Erosion of the Svalbard mountain ranges is the most probable source of dust deposited on and preserved in the local glaciers, although we cannot exclude external sources located in Scandinavia, Greenland or the Canadian Arctic. Minerals and glass fragments diagnostic of rocks from tholeiitic volcanics, as would have been derived from Icelandic eruptions (see References [8]), were not observed. This may indicate that the sources of dust in our study do not include volcanic aerosols of Icelandic origin. Consequently, the cryodust in this study was probably deposited during a period lacking in volcanic eruptions.

4.3.3. Magnetic Indicators

The likelihood of local (in the sense of Svalbard archipelago) sources of cryodust can be supported by the predominance of magnetite among magnetic phases, with only a trace presence of hematite (if any), and an apparent lack of Fe-hydroxides. Unlike in ice samples from Greenland and Antarctica [42,43], no noticeable traces of high-coercivity grains, such hematite or goethite, were found. Such a magnetite-dominant assemblage also contrasts with the predominance of goethite and hematite in the dust of the subtropical/tropical zones (e.g., see References [41,48,49,50,51]). Goethite is the dominant Fe-hydroxide in cryoconite holes of glaciers on the Tibetan Plateau, supplied by the wind from the Tibetan desert [52]. In the polar zone, a low temperature and generally dry climate (i.e., limited concentrations of the water vapour in the atmosphere) hamper the process of oxidation from Fe2+ (ferrous, FeII) to Fe3+ (ferric, FeIII; see Reference [53] for a comprehensive discussion), preventing magnetite grains from oxidizing into goethite or hematite. Additionally, pyrite grains in the cryodust do not exhibit evidence of oxidation (Figure 3).
The poverty of FeIII magnetic phases in the cryodust points to a lack of the cross-latitudinal influx, constraining source areas to the Arctic zone (i.e., within polar convection cells). We propose that magnetite in the cryodust originated from Svalbard itself. Indeed, there are many sedimentary and/or igneous rocks exposed around Southern Spitsbergen that could be sources of magnetite [54,55,56,57,58,59]. Magnetite has also been found in the exposed Triassic rocks of Eastern Edgeøya [60]. The latter area is particularly likely as a source area for dust over Southern Spitsbergen, due to its easterly position relative to the sampling sites (Figure 1) and the dominance of easterly winds [61,62,63]. Edgeøya Island (Botneheia Fm) may be also a potential source area for framboids of iron sulfide [61] identified in SEM images (Figure 3). Moreover, flakes of carbon in the core sample from Storbreen (Figure 4) could be sourced from the Botneheia Formation, which is strongly enriched in organic carbon occurring in the form of kerogen and syngenetic bitumen [64].
Concerning the presence of hematite, one potential source could be the Devonian (Old Red) sandstones of Dicksonfjorden [65], which are currently exposed to weathering.
All of these premises speak in favor of local-to-regional (in the scale of Svalbard) aeolian transport, with main areas located to the East and to the Nord from the coring sites, at Edgeøya and Nordaustlandet areas, respectively. Easterly winds prevail on Svalbard at both local [66,67,68] and archipelago scales [69], with wind speeds capable of transporting dust particles on a regional scale [70]. Some identified mineral phases (silicates and carbonates, all essentially diamagnetic), are light in color, contributing less to the glacier albedo than dark materials, such as Fe-oxides, pyrite grains and BCP. We note that the cryodust of Werenskioldbreen is enriched in diamagnetic phases, in contrast to Recherchebreen, Storbreen and, partly, to Hansbreen (Table 2). Questions of how strongly cryodust contributes to the mass balance of glaciers by lowering their albedo [71,72,73,74] and the effects of cryodust on the rheological properties of ice are certainly worthy of further study. Particularly, the latter issue remains essentially unexplored, except in some cases of small planetary bodies [75].

5. Conclusions

  • The mineral fraction of aerosols (here defined as cryodust, < 6.10−5 m in size) deposited in glaciers of the Southern Spitsbergen includes an assemblage of common rock-forming phases accompanied by heavy minerals, such as monazite and zircon.
  • Despite a low concentration in ice cores, sources of cryodust can be determined by a combination of geochemical, geochronological and/or magnetic methods.
  • Chemical dating by electron microprobe analysis was effective for monazite grains as small as 20 µm, and yielded syn-Caledonian ages (429–423 Ma), pointing to nearby Nordaustlandet (NE Svalbard) as a possible source area, where a Caledonian orogenic belt is exposed to weathering.
  • Magnetic analyses of the cryodust demonstrated the predominance of magnetite and an apparent lack the of FeIII-bearing minerals that are more characteristic of low-latitude weathering zones, indicating a lack of cross-latitudinal, far-distance transport of aerosols.
  • Magnetite in association with pyrite and prevailing easterly winds suggest near-distance transport from the exposed Triassic rocks of the western part of Edgeøya.
  • The presence of intact and non-oxidized framboids of pyrite may point to an origin in local cryoconite holes.

Author Contributions

M.L. (Marek Lewandowski), conceptualization, core acquisition, magnetic analyses, interpretation, writing, editing and reviewing; M.A.K., acquisition, analysis and interpretation of geochemical and geochronological data, as well as writing select parts of the manuscript; T.W., magnetic analysis, interpretation and writing select parts of the manuscript; A.N., core acquisition, and provision, cryodust extraction and writing select parts of the manuscript; B.B., selection of glacial sampling sites, core acquisition, provision, investigation, editing, reviewing and visualization; M.L. (Michał Laska), selection of glacial sampling sites, core acquisition, provision, investigation and visualization; B.L., writing select parts of the manuscript, editing and reviewing. All authors have read and agree to the published version of the manuscript.

Funding

M.L., M.Q., T.W., A.N. and B.L. were supported by the Institute of Geophysics, Polish Academy of Sciences (IG PAS), within statutory activity No. 3841/E-41/S/2020 of the Ministry of Science and Higher Education of Poland. We acknowledge the support of EPOS-PL (No POIR.04.02.00-14-A003/16), co-financed by the European Union from the funds of the European Regional Development Fund (ERDF) to the laboratory facilities used in the study at IG PAS. Glacier cores were collected thanks to the financial support of the Research Council of Norway (Arctic Field Grant 2018 No. 282538, RiS ID: 10917) and the Centre for Polar Studies (the Leading National Research Centre in Earth Sciences for 2014–2018) funding, No. 03/KNOW2/2014.

Acknowledgments

The assistance of Anna Zagórska from Institute of Geological Sciences Polish Academy of Sciences with sample preparation is highly appreciated. Patrik Konečný from the State Geological Institute in Bratislava and Jakub Kotowski from the University of Warsaw are thanked for assistance with electron microprobe analysis and imaging, respectively. We thank Kajetan Ogłaza (a student from Geology Department of the University of Warsaw) for support with sample preparation and laboratory experiments at IG PAS. We also thank Aleksander Uszczyk, Tomasz Budzik and Łukasz Małarzewski for their invaluable assistance in the field. The Polish Polar Station Hornsund (PPSH) provided field equipment, access to chemical laboratory and full accommodation. The Centre for Polar Studies and the University of Silesia in Katowice provided field equipment. Thanks are due to two anonymous reviewers improved a quality of the manuscript by their critical but kind assessment and suggestions. Daniel J. Dunkley is thanked for improving English.

Conflicts of Interest

The authors declare that the research was conducted in the absence of any commercial or financial relationships that could be construed as a potential conflict of interest.

Appendix A

Details of Geochemical Procedures and Methods

An accelerating voltage of 15 kV was used, with a probe current of 200 nA. The line measured, standard used, counting time and detection limit for each element are presented in Table A1 Difficulties introduced by line interferences among REE, Th, Pb and U were dealt with, in the case of strong peak overlaps, by choosing alternative lines, usually of lower intensity. Remaining interferences were resolved by empirically measured correction factors [76]. PbMα was preferably measured over PbMβ, due to higher intensity and resolvable interferences. To obtain correct Pb estimates, a critical interference of YLγ2,3 on PbMα had to be corrected. An interference at PbMα position results from the combined effect of ThMζ1 and ThMζ2 lines. This interference is relevant in case of high Th monazites. Uranium measured on UMβ also suffers from interference with the Th lines ThMγ, ThM5-P3 and ThM4-O2. Moreover, the background position on the higher wavelength side is affected by the presence of a Th-M5 absorption edge. Consequently, background intensity is measured on the lower wavelength side of UMβ and a slope factor 0.888 is used to extrapolate the background at the line position. In the chemical dating method, U analyzed in monazite is converted into the hypothetical equivalent of Th with respect to production of radiogenic Pb. is represented by Th* (Table A1).
Table A1. Chemical dating of monazite from Storbreen and Recherchebreen glaciers. All measured values are given in weight %. See text for further explanation. Th* is the sum of measured Th and hypothetical Th.
LabelThUPbYAge
(Ma)
Error
(Ma, 2σ)
Th*
StorbreenSIC4_mnz13.260.1220.0780.3908436383.5
SIC4_mnz20.6010.0450.0190.33454251750.71
SIC4_mnz33.750.0820.0820.1929423343.8
SIC4_mnz44.710.3460.3781.358136534.55.6
RecherchebreenRIC3_mnz1-14.560.1900.1080.6591423274.9
RIC3_mnz2-13.090.1780.0561.176256363.5
RIC3_mnz3-14.240.2640.4270.66391780424.9
RIC3_mnz3-24.150.2080.3730.76711644424.6
RIC3_mnz4-11.220.0570.0340.3451468911.3
RIC3_mnz1-24.250.1770.1050.5828445294.6
RIC3_mnz53.410.1040.0820.5562439373.5
RIC3_mnz61.710.0490.0430.3691445721.8

Appendix B

Appendix B.1. Details of Magnetic Procedures and Methods

Measurements of κ for an empty filter and 15 filters with dust residues were performed in a magnetic field of 200 A/m at 976 Hz. Filters were placed in the standard plastic holder, and the previously determined κ of the holder was subtracted automatically. Due to the weak κ of samples, at least four measurements were performed for each filter, and results were averaged to obtain raw magnetic κ value un-normalized for the sample volume.
For magnetic hysteresis properties, square pieces of the original filters, roughly 3 by 3 mm and weighing 1–2 mg, were used. Due to the very low mass of such filter pieces, the real mass of dust residue at the sample was not determined, and mass data were not used for calculations and normalization. The pieces were wrapped in plastic foil, to avoid loss or contamination of dust. A Micromag AGM 2900-02 magnetometer from Princeton Measurements Company (USA) with 2-inch coils and field up to 1.4 T was used to determine the hysteresis parameters of filter samples, as well as the backfield coercivity of the remanence and isothermal remanence curves at room temperature.
Initial magnetization curves and hysteresis loops were obtained for samples weighing 1–2 mg in a magnetic field of up to 500 mT (398 kA/m). After the subtraction of the signal from the diamagnetic quartz holder, the resultant curves were processed with Micromag AGM software, to determine high-field linear response (paramagnetic or diamagnetic) and to calculate the parameters of the remaining ferromagnetic component loop. The high-field slope value was calculated to assess the paramagnetic contribution to susceptibility, and the initial slope value was used to evaluate the ferromagnetic contribution to susceptibility.
In addition, hysteresis curves were processed with Hystlab software [39], to smooth data, and slightly corrected Ms, Mr and Hc values were obtained (difference of up to 10% of their value). For two samples with very noisy hysteresis curves (H6/3 and W1), the use of Hystlab software was not effective.

Appendix B.2. Additional Figures and Tables

Appendix B.2.1. Magnetic Susceptibility Data

Table A2. Magnetic susceptibility data and bulk magnetic susceptibility (κ) of the filter with dust and for dust residue are listed; mass specific susceptibility (χ) for dust residue is listed.
LocationSample NameMass (10−6 kg) of FilterMass of Residue (10−6kg)κ - Bulk Susceptibility of Filter with Residue (SI vol.)κ - Bulk Susceptibility of Residue (SI vol.)χ Susceptibility per Mass m3/kg
FlatbreenFIC2106.728.61.420 × 10−61.450 × 10−65.065 × 10−7
FIC3115.0636.69.130 × 10−79.460 × 10−72.584 × 10−7
HansbreenH6/1100.221.91.333 × 10−61.369 × 10−66.262 × 10−7
H6/290.612.31.018 × 10−61.104 × 10−69.005 × 10−7
H6/387.59.19.421 × 10−81.296 × 10−71.418 × 10−7
H6/489.411.18.742 × 10−79.095 × 10−78.211 × 10−7
Recherche-breenRIC2121.543.12.720 × 10−73.050 × 10−77.073 × 10−8
RIC388.510.17.850 × 10−77.902 × 10−77.811 × 10−7
StorbreenSIC2-SIC4120.742.37.098 × 10−67.346 × 10−61.736 × 10−6
Werenskiold-breenW3110.932.56.270 × 10−66.300 × 10−61.937 × 10−6
W489.911.51.510 × 10−61.540 × 10−61.339 × 10−6
W187.28.87.030 × 10−77.889 × 10−78.934 × 10−7
W296.117.71.650 × 10−61.680 × 10−69.469 × 10−7
W5107.228.93.590 × 10−63.620 × 10−61.255 × 10−6
W792.614.31.113 × 10−61.199 × 10−68.387 × 10−7
empty filter78.4 −8.588 × 10⁻⁸ −1.096 × 10⁻⁸

Appendix B.2.2. Magnetic Hysteresis Data

Table A3. For signal after para-/diamagnetic slope correction: coercivity (Hc), magnetic remanence moment (Mr), saturation moment (Ms), the coercivity of remanence; data not normalized per mass/volume. Initial slope parameters for an initial magnetization curve to calculate the contribution of para-/dia- and ferromagnetic components for low field susceptibility. Location of samples according to Table 2. Data for Hc, Mr and Ms were obtained after processing with Hystlab software [39]; Hcr data were calculated with the AGM magnetometer software.
SampleHc (kA/m)Mr (nAm2)Ms (nAm2)Hcr (kA/m)Mr/MsHcr/HcInitial Slope (10−15 m3)Initial Ferro (10−15m3)Initial Para/dia (10−15m3)Para/diaInitial Ferro NormalizedInitial Para/dia Normalized
empty filter8.000.201.3530.370.153.8012.513.5−1.0dia1.08−0.08
FIC28.001.4814.9025.890.103.24157.0150.66.4para0.960.04
FIC38.401.9715.5027.270.133.25186.4175.510.9para0.940.06
H6/110.640.150.8532.430.173.0520.38.312.0para0.410.59
H6/27.360.100.7728.920.133.9327.97.020.8para0.250.75
H6/3n/a0.08−0.2138.53----14.9−1.816.7para−0.121.12
H6/45.040.121.5125.630.085.0922.913.79.2para0.600.40
RIC210.400.402.6030.020.162.8919.928.6−8.6dia1.43−0.43
RIC36.880.795.6329.090.144.2361.263.4−2.2dia1.04−0.04
SIC2-SIC413.8442.27198.0037.790.222.732423.02205.0218.0para0.910.09
W44.400.355.7918.050.064.1054.962.4−7.4dia1.14−0.14
W1n/a0.06−0.1746.51----−3.1−0.7−2.4dia−0.23−0.77
W22.649.76135.0016.340.076.191.71.9−0.2dia1.12−0.12
W35.045.7377.0018.750.073.72855.1820.234.9para0.960.04
W57.681.5015.5024.790.103.23191.7156.135.6para0.810.19
W77.120.898.60250.103.5174.898.0−23.3dia1.31−0.31
SIC2-SIC4 (ht)7.4440.20175,0013.960.231.883383.03438.0−55.0dia1.02−0.02

References

  1. Bullard, J.E.; Baddock, M.; Bradwell, T.; Crusius, J.; Darlington, E.; Gaiero, D.; Gassó, S.; Gisladottir, G.; Hodgkins, R.; McCulloch, R.; et al. High-latitude dust in the Earth system. Rev. Geophys. 2016, 54, 447–485. [Google Scholar] [CrossRef] [Green Version]
  2. Groot Zwaaftink, C.D.; Grythe, H.; Skov, H.; Stohl, A. Substantial contribution of northern high-latitude sources to mineral dust in the Arctic. J. Geophys. Res. D Atmos. 2016, 121, 13678–13697. [Google Scholar] [CrossRef]
  3. Harrison, S.P.; Kohfeld, K.E.; Roelandt, C.; Claquin, T. The role of dust in climate changes today, at the last glacial maximum and in the future. Earth-Sci. Rev. 2001, 54, 43–80. [Google Scholar] [CrossRef]
  4. Wegner, A.; Fischer, H.; Delmonte, B.; Petit, J.; Erhardt, T.; Ruth, U.; Svensson, A.; Vinther, B.; Miller, H. The role of seasonality of mineral dust concentration and size on glacial/interglacial dust changes in the EPICA Dronning Maud Land ice core. J. Geophys. Res. D: Atmos. 2015, 120, 9916–9931. [Google Scholar] [CrossRef] [Green Version]
  5. Rasmussen, S.O.; Seierstad, I.K.; Andersen, K.K.; Bigler, M.; Dahl-Jensen, D.; Johnsen, S.J. Synchronization of the NGRIP, GRIP, and GISP2 ice cores across MIS 2 and palaeoclimatic implications. Quat. Sci. Rev. 2008, 27, 18–28. [Google Scholar] [CrossRef] [Green Version]
  6. Zawierucha, K.; Baccolo, G.; Di Mauro, B.; Nawrot, A.; Szczuciński, W.; Kalińska, E. Micromorphological features of mineral matter from cryoconite holes on Arctic (Svalbard) and alpine (the Alps, the Caucasus) glaciers. Polar Sci. 2019, 22, 100482. [Google Scholar] [CrossRef]
  7. Kekonen, T.; Moore, J.; Perämäki, P.; Martma, T. The Icelandic Laki volcanic tephra layer in the Lomonosovfonna ice core, Svalbard. Polar Res. 2005, 24, 33–40. [Google Scholar] [CrossRef]
  8. Moroni, B.; Arnalds, O.; Dagsson-Waldhauserová, P.; Crocchianti, S.; Vivani, R.; Cappelletti, D. Mineralogical and Chemical Records of Icelandic Dust Sources Upon Ny-Ålesund (Svalbard Islands). Front. Earth Sci. 2018, 6, 187. [Google Scholar] [CrossRef]
  9. Stohl, A.; Berg, T.; Burkhart, J.F.; Fjǽraa, A.M.; Forster, C.; Herber, A.; Hov, Ø.; Lunder, C.; McMillan, W.W.; Oltmans, S.; et al. Arctic smoke—Record high air pollution levels in the European Arctic due to agricultural fires in Eastern Europe in spring 2006. Atmos. Chem. Phys. 2007, 7, 511–534. [Google Scholar] [CrossRef] [Green Version]
  10. Long, C.M.; Nascarella, M.A.; Valberg, P.A. Carbon black vs. black carbon and other airborne materials containing elemental carbon: Physical and chemical distinctions. Environ. Pollut. 2013, 181, 271–286. [Google Scholar] [CrossRef] [Green Version]
  11. Ohata, S.; Moteki, N.; Schwarz, J.; Fahey, D.; Kondo, Y. Evaluation of a Method to Measure Black Carbon Particles Suspended in Rainwater and Snow Samples. Aerosol Sci. Technol. 2013, 47, 1073–1082. [Google Scholar] [CrossRef]
  12. Spolaor, A.; Barbaro, E.; Mazzola, M.; Viola, A.P.; Lisok, J.; Obleitner, F.; Markowicz, K.M.; Cappelletti, D. Determination of black carbon and nanoparticles along glaciers in the Spitsbergen (Svalbard) region exploiting a mobile platform. Atmos. Environ. 2017, 170, 184–196. [Google Scholar] [CrossRef]
  13. Osmont, D.; Wendl, I.A.; Schmidely, L.; Sigl, M.; Vega, C.; Isaksson, E.; Schwikowski, M. An 800-year high-resolution black carbon ice core record from Lomonosovfonna, Svalbard. Atmos. Chem. Phys. 2018, 18, 12777–12795. [Google Scholar] [CrossRef] [Green Version]
  14. Nakazawa, F.; Fujita, K.; Takeuchi, N.; Fujiki, T.; Uetake, J.; Aizen, V.; Nakawo, M. Dating of seasonal snow/firn accumulation layers using pollen analysis. J. Glaciol. 2005, 51, 483–490. [Google Scholar] [CrossRef] [Green Version]
  15. Zawierucha, K.; Buda, J.; Azzoni, R.S.; Niśkiewicz, M.; Franzetti, A.; Ambrosini, R. Water bears dominated cryoconite hole ecosystems: Densities, habitat preferences and physiological adaptations of Tardigrada on an alpine glacier. Aquat. Ecol. 2019, 53, 543–556. [Google Scholar] [CrossRef] [Green Version]
  16. Bond, T.C.; Doherty, S.J.; Fahey, D.W.; Forster, P.M.; Berntsen, T.; DeAngelo, B.J.; Flanner, M.G.; Ghan, S.; Kärcher, B.; Koch, D.; et al. Bounding the role of black carbon in the climate system: A scientific assessment. J. Geophys. Res. D Atmos. 2013, 118, 5380–5552. [Google Scholar] [CrossRef]
  17. Gul, C.; Puppala, S.P.; Kang, S.; Adhikary, B.; Zhang, Y.; Ali, S.; Yang, L.; Li, X. Concentrations and source regions of light-absorbing particles in snow/ice in northern Pakistan and their impact on snow albedo. Atmos. Chem. Phys. 2018, 18, 4981–5000. [Google Scholar] [CrossRef] [Green Version]
  18. Sarangi, C.; Qian, Y.; Rittger, K.; Ruby Leung, L.; Chand, D.; Bormann, K.J.; Painter, T.H. Dust dominates high-altitude snow darkening and melt over high-mountain Asia. Nat. Clim. Chang. 2020, 10, 1045–1051. [Google Scholar] [CrossRef]
  19. Hagen, J.O.; Kohler, J.; Melvold, K.; Winther, J.-G. Glaciers in Svalbard: Mass balance, runoff and freshwater flux. Polar Res. 2003, 22, 145–159. [Google Scholar] [CrossRef] [Green Version]
  20. Semb, A.; Braekkan, R.; Joranger, E. Major ions in Spitsbergen snow samples. Geophys. Res. Lett. 1984, 11, 445–448. [Google Scholar] [CrossRef]
  21. Kekonen, T.; Moore, J.; Perämäki, P.; Mulvaney, R.; Isaksson, E.; Pohjola, V.; van de Wal, R.S.W. The 800 year long ion record from the Lomonosovfonna (Svalbard) ice core. J. Geophys. Res. D Atmos. 2005, 110. [Google Scholar] [CrossRef] [Green Version]
  22. Nawrot, A.P.; Migała, K.; Luks, B.; Pakszys, P.; Głowacki, P. Chemistry of snow cover and acidic snowfall during a season with a high level of air pollution on the Hans Glacier, Spitsbergen. Polar Sci. 2016, 10, 249–261. [Google Scholar] [CrossRef]
  23. Stachnik, Ł.; Majchrowska, E.; Yde, J.C.; Nawrot, A.P.; Cichała-Kamrowska, K.; Ignatiuk, D.; Piechota, A. Chemical denudation and the role of sulfide oxidation at Werenskioldbreen, Svalbard. J. Hydrol. 2016, 538, 177–193. [Google Scholar] [CrossRef] [Green Version]
  24. Simões, J.C. Environmental Interpretation from Svalbard Ice Cores. Ph.D. Thesis, University of Cambridge, Cambridge, UK, 1990. [Google Scholar]
  25. Dobrowolski, A.B. Historia Naturalna Lodu (The Natural History of Ice); Kasa Pomocy im. Dr. J. Mianowskiego: Warszawa, Poland, 1923. [Google Scholar]
  26. Rachlewicz, G. Paraglacial Modifications of Glacial Sediments Over Millennial to Decadal Time-Scales in the High Arctic (Billefjorden, Central Spitsbergen, Svalbard). Quaest. Geogr. 2010, 29, 59–67. [Google Scholar] [CrossRef] [Green Version]
  27. van der Meij, W.M.; Temme, A.J.A.M.; de Kleijn, C.M.F.J.J.; Reimann, T.; Heuvelink, G.B.M.; Zwoliński, Z.; Rachlewicz, G.; Rymer, K.; Sommer, M. Arctic soil development on a series of marine terraces on central Spitsbergen, Svalbard: A combined geochronology, fieldwork and modelling approach. SOIL 2016, 2, 221–240. [Google Scholar] [CrossRef] [Green Version]
  28. Rymer, K. Aeolian activity in central Spitsbergen (Ebba Valley) in the years 2012–2017. In Proceedings of the XXXVII Polar Symposium “Polar Change—Global Change”, Poznan, Poland, 7–10 June 2018; p. 61. [Google Scholar]
  29. Czeppe, Z. Przebieg Głównych procesów morfogenetycznych w południowo-zachodnim Spitsbergenie; Zeszyty Naukowe, U.J., Geograficzne, P., Eds.; Uniwersytet Jagielloński: Kraków, Poland, 1966; Volume 13. [Google Scholar]
  30. Kavan, J.; Láska, K.; Nawrot, A.; Wawrzyniak, T. High Latitude Dust transport altitude pattern revealed from deposition on snow, Svalbard. Atmosphere. accepted.
  31. Błaszczyk, M.; Jania, J.A.; Kolondra, L. Fluctuations of tidewater glaciers in Hornsund Fjord (Southern Svalbard) since the beginning of the 20th century. Pol. Polar Res. 2013, 34, 327–352. [Google Scholar] [CrossRef]
  32. Laska, M.; Barzycka, B.; Luks, B. Melting Characteristics of Snow Cover on Tidewater Glaciers in Hornsund Fjord, Svalbard. Water 2017, 9, 804. [Google Scholar] [CrossRef]
  33. Aleinikoff, J.N.; Schenck, W.S.; Plank, M.O.; Srogi, L.; Fanning, C.M.; Kamo, S.L.; Bosbyshell, H. Deciphering igneous and metamorphic events in high-grade rocks of the Wilmington Complex, Delaware: Morphology, cathodoluminescence and backscattered electron zoning, and SHRIMP U-Pb geochronology of zircon and monazite. Geol. Soc. Am. Bull. 2006, 118, 39–64. [Google Scholar] [CrossRef]
  34. Konečný, P.; Siman, P.; Holický, I.; Janák, M.; Kollárová, V. Metodika datovania monazite pomocou elektrónového mikroanalyzátora. Miner. Slovaca 2004, 36, 225–235. [Google Scholar]
  35. Konečný, P.; Kusiak, M.A.; Dunkley, D.J. Improving U-Th-Pb electron microprobe dating using monazite age references. Chem. Geol. 2018, 484, 22–35. [Google Scholar] [CrossRef]
  36. Montel, J.-M.; Foret, S.; Veschambre, M.; Nicollet, C.; Provost, A. Electron microprobe dating of monazite. Chem. Geol. 1996, 131, 37–53. [Google Scholar] [CrossRef]
  37. Kusiak, M.A.; Dunkley, D.J.; Whitehouse, M.J.; Wilde, S.A.; Sałacińska, A.; Konečný, P.; Szopa, K.; Gawęda, A.; Chew, D. Peak to post-peak thermal history of the Saglek Block of Labrador: A multiphase and multi-instrumental approach to geochronology. Chem. Geol. 2018, 484, 210–223. [Google Scholar] [CrossRef] [Green Version]
  38. Majka, J.; Be’eri-Shlevin, Y.; Gee, D.G.; Ladenberger, A.; Claesson, S.; Konecny, P.; Klonowska, I. Multiple monazite growth in the Åreskutan migmatite: Evidence for a polymetamorphic Late Ordovician to Late Silurian evolution in the Seve Nappe Complex of west-central Jamtland, Sweden. J. Geosci. 2012, 57, 3–23. [Google Scholar] [CrossRef] [Green Version]
  39. Paterson, G.A.; Zhao, X.; Jackson, M.; Heslop, D. Measuring, Processing, and Analyzing Hysteresis Data. Geochem. Geophys. Geosyst. 2018, 19, 1925–1945. [Google Scholar] [CrossRef]
  40. Dunlop, D.J. Theory and application of the Day plot (Mrs/Ms versus Hcr/Hc) 1. Theoretical curves and tests using titanomagnetite data. J. Geophys. Res. [Solid Earth] 2002, 107, EPM 4-1–EPM 4-22. [Google Scholar] [CrossRef] [Green Version]
  41. Oldfield, F.; Chiverrell, R.C.; Lyons, R.; Williams, E.; Shen, Z.; Bristow, C.; Bloemendal, J.; Torrent, J.; Boyle, J.F. Discriminating dusts and dusts sources using magnetic properties and hematite:Goethite ratios of surface materials and dust from North Africa, the Atlantic and Barbados. Aeolian Res. 2014, 13, 91–104. [Google Scholar] [CrossRef] [Green Version]
  42. Lanci, L.; Delmonte, B.; Kent, D.V.; Maggi, V.; Biscaye, P.E.; Petit, J.-R. Magnetization of polar ice: A measurement of terrestrial dust and extraterrestrial fallout. Quat. Sci. Rev. 2012, 33, 20–31. [Google Scholar] [CrossRef] [Green Version]
  43. Lanci, L.; Delmonte, B.; Salvatore, M.C.; Baroni, C. Insight Into Provenance and Variability of Atmospheric Dust in Antarctic Ice Cores During the Late Pleistocene From Magnetic Measurements. Front Earth Sci. 2020, 8, 258. [Google Scholar] [CrossRef]
  44. Balašov, J.A.; Peucat, J.J.; Teben’kov, A.M.; Ohta, Y.; Larionov, A.N.; Sirotkin, A.N. Additional Rb-Sr and single-grain zircon datings of Caledonian granitoid rocks from Albert I Land, northwest Spitsbergen. Polar Res. 1996, 15, 153–165. [Google Scholar] [CrossRef]
  45. Sawłowicz, Z. Framboids: From Their Origin to Application. Prace Mineralogiczne; Wydawnictwo oddziałuPAN w Krakowie: Kraków, Poland, 2000; Volume 88, p. 80. [Google Scholar]
  46. Birkenmajer, K.; Jania, J.; Pulina, M. Geological Map of the Hornsund Area; Uniwersytet Śląski: Katowice, Poland, 1990. [Google Scholar]
  47. Johansson, Å.; Maluski, H.; Gee, D.G. Ar-Ar dating of Caledonian and Grenvillian rocks from northeasternmost Svalbard-evidence of two stages of Caledonian tectonothermal activity in the high Arctic? Nor. J. Geol. Nor. Geol. Foren. 2001, 81, 263–281. [Google Scholar]
  48. Larrasoaña, J.C.; Roberts, A.P.; Liu, Q.; Lyons, R.; Oldfield, F.; Rohling, E.J.; Heslop, D. Source-to-sink magnetic properties of NE Saharan dust in Eastern Mediterranean marine sediments: Review and paleoenvironmental implications. Front Earth Sci. Chin. 2015, 3, 19. [Google Scholar] [CrossRef]
  49. Moskowitz, B.M.; Reynolds, R.L.; Goldstein, H.L.; Berquó, T.S.; Kokaly, R.F.; Bristow, C.S. Iron oxide minerals in dust-source sediments from the Bodélé Depression, Chad: Implications for radiative properties and Fe bioavailability of dust plumes from the Sahara. Aeolian Res. 2016, 22, 93–106. [Google Scholar] [CrossRef] [Green Version]
  50. Rodriguez-Navarro, C.; di Lorenzo, F.; Elert, K. Mineralogy and physicochemical features of Saharan dust wet deposited in the Iberian Peninsula during an extreme red rain event. Atmos. Chem. Phys. 2018, 18, 10089–10122. [Google Scholar] [CrossRef] [Green Version]
  51. Kandler, K.; Schneiders, K.; Heuser, J.; Waza, A.; Aryasree, S.; Althausen, D.; Hofer, J.; Abdullaev, S.F.; Makhmudov, A.N. Differences and Similarities of Central Asian, African, and Arctic Dust Composition from a Single Particle Perspective. Atmos. 2020, 11, 269. [Google Scholar] [CrossRef] [Green Version]
  52. Cong, Z.; Gao, S.; Zhao, W.; Wang, X.; Wu, G.; Zhang, Y.; Kang, S.; Liu, Y.; Ji, J. Iron oxides in the cryoconite of glaciers on the Tibetan Plateau: Abundance, speciation and implications. Cryosphere 2018, 12, 3177–3186. [Google Scholar] [CrossRef] [Green Version]
  53. Raiswell, R.; Hawkings, J.; Elsenousy, A.; Death, R.; Tranter, M.; Wadham, J. Iron in Glacial Systems: Speciation, Reactivity, Freezing Behavior, and Alteration During Transport. Front Earth Sci. Chin. 2018, 6, 222. [Google Scholar] [CrossRef] [Green Version]
  54. Agard, P.; Labrousse, L.; Elvevold, S.; Lepvrier, C. Discovery of Paleozoic Fe-Mg carpholite in Motalafjella, Svalbard Caledonides: A milestone for subduction-zone gradients. Geol. 2005, 33, 761–764. [Google Scholar] [CrossRef] [Green Version]
  55. Burzyński, M.; Michalski, K.; Nejbert, K.; Domańska-Siuda, J.; Manby, G. High-resolution mineralogical and rock magnetic study of ferromagnetic phases in metabasites from Oscar II Land, Western Spitsbergen—Towards reliable model linking mineralogical and palaeomagnetic data. Geophys. J. Int. 2017, 210, 390–405. [Google Scholar] [CrossRef]
  56. Michalski, K.; Lewandowski, M.; Manby, G. New palaeomagnetic, petrographic and 40Ar/39Ar data to test palaeogeographic reconstructions of Caledonide Svalbard. Geol. Mag. 2012, 149, 696–721. [Google Scholar] [CrossRef]
  57. Michalski, K.; Nejbert, K.; Domańska−Siuda, J.; Manby, G. New palaeomagnetic data from metamorphosed carbonates of Western Oscar II Land, Western Spitsbergen. Pol. Polar Res. 2014, 35, 553–592. [Google Scholar] [CrossRef] [Green Version]
  58. Michalski, K. Palaeomagnetism of metacarbonates and fracture fills of Kongsfjorden islands (western Spitsbergen): Towards a better understanding of late-to post-Caledonian tectonic rotations. Pol. Polar Res. 2018, 39, 51–75. [Google Scholar]
  59. Dudzisz, K.; Michalski, K.; Szaniawski, R.; Nejbert, K.; Manby, G. Palaeomagnetic, rock-magnetic and mineralogical investigations of the Lower Triassic Vardebukta Formation from the southern part of the West Spitsbergen Fold and Thrust Belt. Geol. Mag. 2019, 156, 620–638. [Google Scholar] [CrossRef]
  60. Lewandowski, M.; Szaniawski, R.; Krajewski, K.P. Dating reductive fluids flow by means of paleomagnetic data; example from the Triassic sandstones of the southern Spitsbergen. In Proceedings of the Abstracts of the 35th International Geological Congress, Cape Town, South Africa, 27 August–4 September 2016; p. 937. [Google Scholar]
  61. Grabiec, M.; Leszkiewicz, J.; Głowacki, P.; Jania, J. Distribution of snow accumulation on some glaciers of Spitsbergen. Pol. Polar Res. 2006, 27, 309–326. [Google Scholar]
  62. Dörnbrack, A.; Stachlewska, I.S.; Ritter, C.; Neuber, R. Aerosol distribution around Svalbard during intense easterly winds. Atmos. Chem. Phys. 2010, 10, 1473–1490. [Google Scholar] [CrossRef] [Green Version]
  63. Grabiec, M. Stan i współczesne zmiany systemów lodowcowych południowego Spitsbergenu w świetle badań metodami radarowymi; Prace Naukowe Uniwersytetu Śląskiego w Katowicach; Wydawnictwo Uniwersytetu Śląskiego: Katowice, Poland, 2017; Volume 3536, ISBN 9788322630143. [Google Scholar]
  64. Krajewski, K.P. The Botneheia Formation (Middle Triassic) in Edgeøya and Barentsøya, Svalbard: Lithostratigraphy, facies, phosphogenesis, paleoenvironment. Pol. Polar Res. 2008, 29, 319–364. [Google Scholar]
  65. Løvlie, R.; Torsvik, T.; Jelenska, M.; Levandowski, M. Evidence for detrital remanent magnetization carried by hematite in Devonian red beds from Spitsbergen; palaeomagnetic implications. Geophys. J.R.astr.Soc. 1984, 79, 573–588. [Google Scholar] [CrossRef] [Green Version]
  66. Cisek, M.; Makuch, P.; Petelski, T. Comparison of meteorological conditions in Svalbard fjords: Hornsund and Kongsfjorden. Oceanologia 2017, 59, 413–421. [Google Scholar] [CrossRef]
  67. Sulikowska, A.; Ziaja, W.; Wypych, A.; Mitka, K.; Maciejowski, W.; Ostafin, K. Summer weather conditions in 2005 and 2016 on the western and eastern coasts of south Spitsbergen. Pol. Polar Res. 2018, 39, 127–144. [Google Scholar] [CrossRef]
  68. Wawrzyniak, T.; Majerska, M.; Osuch, M. Hydrometeorological dataset (2014–2019) from the High Arctic unglaciated catchment Fuglebekken (Svalbard). Hydrol. Process. 2020. [Google Scholar] [CrossRef]
  69. Hanssen-Bauer, I.; Førland, E.J.; Hisdal, H.; Mayer, S.; Sandø, A.B.; Sorteberg, A. Climate in Svalbard 2100—A Knowledge Base for Climate Adaptation; NCCS report; Miljødirektoratet: Trondheim, Norway, 2019.
  70. Kok, J.F.; Parteli, E.J.R.; Michaels, T.I.; Karam, D.B. The physics of wind-blown sand and dust. Rep. Prog. Phys. 2012, 75, 106901. [Google Scholar] [CrossRef] [PubMed] [Green Version]
  71. Lambert, F.; Kug, J.-S.; Park, R.J.; Mahowald, N.; Winckler, G.; Abe-Ouchi, A.; O’ishi, R.; Takemura, T.; Lee, J.-H. The role of mineral-dust aerosols in polar temperature amplification. Nat. Clim. Chang. 2013, 3, 487–491. [Google Scholar] [CrossRef]
  72. Goelles, T.; Bøggild, C.E. Albedo reduction of ice caused by dust and black carbon accumulation: A model applied to the K-transect, West Greenland. J. Glaciol. 2017, 63, 1063–1076. [Google Scholar] [CrossRef] [Green Version]
  73. Zhang, Y.; Kang, S.; Cong, Z.; Schmale, J.; Sprenger, M.; Li, C.; Yang, W.; Gao, T.; Sillanpää, M.; Li, X.; et al. Light-absorbing impurities enhance glacier albedo reduction in the southeastern Tibetan plateau. J. Geophys. Res. D Atmos. 2017, 122, 6915–6933. [Google Scholar] [CrossRef]
  74. Lewis, G.; Osterberg, E.C.; Hawley, R.L.; Marshall, H.P.; Birkel, S.D.; Dibb, J.E.; Koffman, B.G.; Ferris, D.G.; Tedesco, M. Effects of Mineral Dust and Black Carbon on Albedo in the Western Greenland Ice Sheet Percolation Zone. In Proceedings of the AGU Fall Meeting Abstracts, Washington, DC, USA, 10–14 December 2018; Volume 2018, p. C31A-05. [Google Scholar]
  75. Durham, W.B.; Stern, L.A. Rheological Properties of Water Ice—Applications to Satellites of the Outer Planets. Annu. Rev. Earth Planet. Sci. 2001, 29, 295–330. [Google Scholar] [CrossRef] [Green Version]
  76. Åmli, R.; Griffin, W.L. Microprobe analysis of REE Minerals using empirical correction factors. Am. Mineral. 1975, 60, 599–606. [Google Scholar]
Figure 1. Map with coring sites (see Table 1 and Table 2 for details). Red dots mark cores investigated in this study. Source: Map data © Norwegian Polar Institute, version: September 2017.
Atmosphere 11 01325 g001
Figure 2. (A) Cryodust in a back-scattered electron (BSE) image of the dust sample from Recherchebreen. A micrometeorite (Ni+Fe, see also Figure 3) and a zircon grain are visible in sector (B) (see Figure 3 for details). Sample RIC 3.
Atmosphere 11 01325 g002
Figure 3. A close-up BSE image of the micrometeorite grain in Figure 2, with EDS analysis (below). The blurry image is due to extremely small grain-size, taken at the lower limit of SEM resolution. Sample RIC 3.
Atmosphere 11 01325 g003
Figure 4. Cryodust in a secondary electron image of uncoated dust sample SIC2-SIC4 from Storbreen. SEM. Particles of elemental carbon (BCPs) are shown circled. Sample SIC 4.
Atmosphere 11 01325 g004
Figure 5. Framboidal pyrite (above) with EDS analysis (below). Microcrystallites are close to the limit of SEM resolution. The star indicates a peak of the C which is coming from the carbon coating of the sample. Sample RIC 3.
Atmosphere 11 01325 g005
Figure 6. A close-up BSE image of the zircon grain (above) and EDS analysis (below). The star indicates a peak of the C which is coming from the carbon coating of the sample. Sample RIC 3.
Atmosphere 11 01325 g006aAtmosphere 11 01325 g006b
Figure 7. A close-up BSE image of a monazite grain (above, white phase) and EDS analysis (below). Sample RIC 3.
Atmosphere 11 01325 g007
Figure 8. Dated monazite grains from Recherchebreen (AD) and Storbreen ((E,F), the position of the grain in the background SEM image is encircled). Five of six analyzed grains yielded Silurian ages, with one monazite grain of mid-Mesoproterozoic age. Scale bars are shown.
Atmosphere 11 01325 g008
Figure 9. (a) Mass of residues collected on filters (see Table 2 for sample details). (b) Bulk magnetic susceptibility κ for residues. (c) Mass specific susceptibility χ (m3/kg); EF—empty filter.
Atmosphere 11 01325 g009
Figure 10. Changes in magnetic susceptibility during heating–cooling cycles (20–700 °C). Red—heating curves; blue—cooling curves. (a) Curve for an empty fresh filter; (bp) curves for dust residues, with the signal from the empty filter subtracted. Data from a KLY5/CS4 device (Agico, Brno, Czech Republic).
Atmosphere 11 01325 g010
Figure 11. Hysteresis data for an empty filter placed in the quartz holder; (a) the whole hysteresis loop, with peak field of 500 mT; (b) after slope correction, ferromagnetic contribution to the hysteresis loop, high field linear component removed (here diamagnetic); (c) backfield data—Hcr—coercivity of remanence value after DC magnetization at the field of 500 mT; (d) isothermal remanence magnetization (IRM) acquisition curve after prior DC demagnetization of the sample with peak 500 mT field. Data plotted after removing the signal of the quartz holder.
Atmosphere 11 01325 g011
Figure 12. Hysteresis loops for all samples (each identified by symbols)—before slope correction: (a) data for an empty filter (EF), (b) for W1 dominant diamagnetic phase, (ce) dominant ferromagnetic phase and (fi) dominant paramagnetic phase.
Atmosphere 11 01325 g012
Figure 13. A comparison of the contribution of ferro-, para-, diamagnetic phases to initial susceptibility (normalized by initial slope value for uncorrected curve). Samples W1 and H6/3 do not yield realistic values for the ferromagnetic phase due to very weak signals. EF, empty filter.
Atmosphere 11 01325 g013
Figure 14. Remanence curves for dust residues: (a) example of IRM acquisition curve (H6/2 sample)—fast saturation with a low H, specific for a low-coercivity phase; (b) example of a backfield curve, Hcr value is determined (H6/2 sample); (c) distribution of Hcr values (heated SIC2-SIC4 sample shown on the far right—see also Table A3, Appendix B).
Atmosphere 11 01325 g014
Figure 15. Day–Dunlop plot for empty filter and dust residues (Mr/Ms vs. Hcr/Hc ratios [40]). The theoretical mixture lines for SP, SD–SP, PSD–SP and SD–MD magnetite after Reference [40] are drawn.
Atmosphere 11 01325 g015
Table 1. Selected details for glaciers sampled in this study. ELA, Equilibrium Line Altitude.
GlacierArea (km2)Slope (°)Mean Elevation (m a.s.l.)ELA (m a.s.l.)
Recherchebreen120.23.6430555
Hornbreen (Flatbreen)176.21.3289398
Storbreen196.51.3287383
Werenskioldbreen27.13.7358475
Hansbreen53.81.7291342
Table 2. Sample names and coordinates of the coring sites. Fe classes are determined subjectively, to illustrate proportion of ferrous to ferric minerals in the dust samples as interpreted from magnetic susceptibility κ (L denotes low κ; H denotes high κ). Coordinates in Universal Transverse Mercator (UTM) 33X.
GlacierNameXYFe Class
diaparaferro
RecherchebreenRIC28,590,996497,999L H
RIC38,588,426505,117 LH
Hornbreen
(Flatbreen)
FIC28,567,866545,461 LH
FIC38,568,521545,461 LH
StorbreenSIC28,571,862522,493 LH
SIC48,569,458527,542 LH
WerenskioldbreenW18,556,674512,219too weak
W28,554,873510,970L H
W38,558,594510,424 LH
W48,557,076510,049L H
W58,554,458509,747 LH
W78,555,045507,838L H
HansbreenH6 (H6/1, H6/2, H6/3, H6/4)855,6118515,814 LL
Publisher’s Note: MDPI stays neutral with regard to jurisdictional claims in published maps and institutional affiliations.

