High Latitude Dust Transport Altitude Pattern Revealed from Deposition on Snow, Svalbard


1
Department of Geography, Faculty of Science, Masaryk University, Kotlářská 2, 611 37 Brno, Czech Republic
2
Centre for Polar Ecology, Faculty of Science, University of South Bohemia, Na Zlaté Stoce 3, 370 05 České Budějovice, Czech Republic
3
Institute of Geophysics, Polish Academy of Sciences, 64 Księcia Janusza Str., 01-452 Warsaw, Poland
4
forScience Foundation, ul. Przy Skarpie 70/47, 87-100 Toruń, Poland
*
Author to whom correspondence should be addressed.
Atmosphere 2020, 11(12), 1318; https://doi.org/10.3390/atmos11121318
Submission received: 28 September 2020
/
Revised: 27 November 2020
/
Accepted: 1 December 2020
/
Published: 6 December 2020
(This article belongs to the Special Issue Long-Range Transport of Dust over the High-Latitude Regions)
Abstract
:High Latitude Dust (HLD) deposition in the surface snow layer in two distant locations in Svalbard (Hornsund and Pyramiden) were collected during the June/July 2019 field campaign and examined in the laboratory. Despite the differences in their climate and topography, both locations are characterised by very similar spatial patterns of the deposition. On the one hand, strong linear negative relationship between the altitude of the sample taken and its concentration was found in low altitude (below 300 m a.s.l.), suggesting a strong influence of local HLD sources. On the other hand, almost constant concentrations were found at higher elevated sampling sites (above 300 m a.s.l.). This suggests a predominantly long-range transport in high altitude areas. The importance of local sources in the lower altitude corresponds well with the generally higher concentrations of HLD in the Pyramiden area. This region has a drier, continental climate and more deglaciated bare land surfaces, which favour more sediment to be uplifted in comparison with the more maritime climate of Hornsund area in the southern part of Svalbard. The spatial division between the local and long-range transport is supported by the proportion of certain lithophile elements in the altitude gradient.
1. Introduction
The importance of High Latitude Dust (HLD) sources within the world climate system was recognised recently. The contribution of the HLD to the overall aeolian budget is estimated to be 2–5% [1]. The importance of the HLD source areas is growing due to the deglaciation of vast areas filled with available glaciofluvial material. Another consequence of ongoing climate warming is the prolongation of the snow-free season [2,3] and the consequent drying of the bare surface, especially at the end of the summer season. Increasing dust transport and deposition is also a major factor of enhanced Greenland ice sheet melt [4].
On one hand, there is growing evidence that the long-range transport of mineral particles is reaching remote areas of the High Arctic, such as Svalbard (e.g., [5]). On the other hand, the complex terrain of Svalbard has also been identified as an important HLD source for the Arctic apart from the well-known volcanic emissions from Iceland (e.g., [6,7,8]). Dörnbrack et al. [9] reported the deposited fluvial sediments being especially activated at the end of the summer season. The floodplain as a major HLD source was identified also by Bullard and Austin [10] in Greenland or by Wittmann et al. [11] in Iceland. Deposition of mineral material on the surface of local glaciers might enhance the melting of glaciers (e.g., [12,13,14]), as it causes positive radiative forcing and enhanced melting due to the reduction of surface albedo. Microorganisms and their interactions with mineral material affect the glacier surface properties significantly as well [15,16]. Such material deposited on the glacier surface is later released back to the glaciofluvial system during the melting period [17]. In the case of such redeposition, the formerly long-range transported material is becoming a local HLD source. Apart from the natural sources of dust, the anthropogenic dust sources from coal mining activities [9] and increased shipping [18] were recently identified across the Arctic.
The long-range transport of mineral particles to Svalbard was studied especially in the northern part of the archipelago, which is to say in Ny-Ålesund (e.g., [19,20,21,22]). In contrast, there are only scarce observations from other parts of Svalbard [6]. Lewandowski et al. [23] observed dust deposition in the glacier superficial layer around Hornsund. Nawrot et al. [24] reported long-range transport of pollutants deposition in Hornsund, which originates from fires on the border of Russia and western Kazakhstan. Aamas et al. [25] described the influence of local industrial sources on the deposition of carbon around the coal mining infrastructure in Longyearbyen and Svea. Gallet et al. [26] published the results of particulate organic and elemental carbon in snow collected in different Svalbard locations.
In this research, the two different areas, like Billefjorden (Pyramiden) and Hornsund (Ariekammen) were compared. Both are situated at the Svalbard archipelago, which is experiencing significant deglaciation [27]. The central Svalbard region experienced dramatic glacier retreat [28] and volume loss [29] since the Little Ice Age leaving vast areas of glacial deposits for transformation by fluvial and slope processes (e.g., [30]). The deglaciated areas are quickly colonised by pioneer species of lichens, mosses, and vascular plants (e.g., [31,32]). Local glaciers are retreating in an accelerated rate in the last decades (e.g., [33,34]). The Hornsund area experienced a similar pattern of glacier retreat even though most of the glaciers in the region are marine-terminating type [35]. A small Ariebreen valley glacier close to the sampling site, which has lost more than half of its areal extent since 1936 and more than 75% of its volume [36]. Between 1936 and 2011 the average retreat for the Ariebreen glacier was approximately 7 m per year [37]. The much larger tidewater glacier, Hansbreen, retreats 40 m per year [38]. The retreat dynamics of the eastern part of the Hornsund region tidewater glaciers is summarised in Strzelecki et al. [39]. The largest area of the newly exposed land in the Hornsund region connected with the retreat of tidewater glaciers can be noted in the eastern part of the fjord. This region, called Brepolen, is located approximately 30 km from Ariekammen and its new bare surface has only a minor or nor effect for the uplift of mineral particles by the aeolian processes.
This study aims to describe the altitude pattern of HLD deposition in the snow in two regions of Svalbard (Figure 1A) with different topoclimatic conditions. Additionally, we distinguished local HLD sources and long-range transport using the relationship of deposition rate and altitude, the relative abundance of main and trace lithophile elements and analysis of local atmospheric conditions.
Two distant locations in Svalbard were chosen to enable the intercomparison of altitude HLD deposition pattern and the effects of different climatic and topographic conditions. Ariekammen mountain ridge is located in the close vicinity of the Polish Polar Station Hornsund in the southern part of Spitsbergen (Figure 1B), where the marine influence of the Greenland Sea is direct and therefore higher than in Pyramiden, located in the central part of the island, at the head of Billefjord which cuts deeply into the land, and experiences more continental and dry climate [40,41,42].
1.1. Hornsund
Ariekammen (77.00′ N, 15.31′ E) is a mountain ridge located in southernmost Wedel Jarlsberg Land with peaks reaching 513 m a.s.l.. The slope incline is between 13° and 46° to the south and southeast. The mountain is located approximately 1 km to the northwest from Isbjornhamna Bay and the Hornsundfjord. The foot of the slope of Ariekammen Ridge is covered by soils which are characterized by the high content of silt and clay fractions as well as Al2O3, Fe2O3, and K2O [43]. The higher parts of the hillside are covered by bare rocks, stones and patches of tundra. The coastal slopes, including the Ariekammen, are inhabited by planktivorous little auks (ca. 15,000 breeding pairs) colonies which bring nutrients to the ecosystem [44]. The average snow cover on the coastal plain south of Ariekammen, called Fuglebergsletta, occurs for 244 days of the year and reaches a maximum depth of 43 cm at the end of April [45].
Relatively to the other parts of the Arctic, air temperatures in SW Spitsbergen are the highest at this latitude [46]. The air temperature in the Hornsund area is strongly influenced by the West Spitsbergen Current, which carries warm (3–6 °C) and salty (>35‰) Atlantic waters. The specific maritime and mild climatic conditions at Hornsund station are also influenced by local and regional factors as the orography, presence of glaciers and location near the seashore. The climatic variables such as air temperature, humidity, and precipitation vary significantly around the Hornsund Fjord [47] and across the Svalbard archipelago [3,48].
1.2. Pyramiden
The Pyramiden sampling site is located on the western coast of Petuniabukta where the northern branch of Billefjorden terminates. Pyramiden (78°40.481′ N, 16°21.038′ E) is a mountain ridge with a peak at 935 m a.s.l. and the eastern slope incline is in between 25°–35° towards Petuniabukta. The foot of the Pyramiden slope is formed by a raised marine terraces with stable old soils covered by plants, including vascular plants such as Polygonum viviparum, Salix polaris, Carex rupestris, and Dryas octopetala [49]. The higher part of hillside (>100 m a.s.l.) is covered by regolith material with patches of a biological soil crust, and rock outcrops [50,51]. In Petuniabukta, seasonal sea ice, mainly as fast ice or open drift ice, occurs from December to May/June [52].
The mean annual air temperatures in the study area range from −3.7 °C near the coast to −8.4 °C in high elevated sites, such as the top of Mumien Peak, located 3 km north off the Pyramiden Peak [53]. The low-situated site of Petuniabukta has a short summer with the mean monthly air temperatures being above 0 °C from June to September, reaching a maximum of 15 °C in July [40]. The meteorological observations from the Petuniabukta marine terrace (2010–2012) showed that the prevailing wind directions are mainly in the southern and northern sectors [40], while the strongest winds occur from the northeast from the Ragnarbreen valley [54].
2. Materials and Methods
2.1. Snow Sampling
Snow samples were taken on the altitude gradient on the slopes of the Ariekammen and Pyramiden mountains. For that purpose, the continuous snowfields (from top of the gradient down to the slope base) were chosen (Figure 2A,B). The sample at each location consisted of four subsamples (100 mm deep, 70 mm in diameter) taken from the upper 100 mm snow layer. The individual subsamples were extracted with a plastic sampler of given dimensions with 1-m distance from the centre of the sampling spot (to form a cross). Such a sampling design was applied to avoid the effect of spatial variability of the deposition. These four subsamples were merged and one single sample from each sampling site (altitude) was obtained. The merged sample was later processed in the laboratory. There were 7 sampling sites at each location (Table 1). The snow from Ariekammen was sampled on 26 June 2019, while snow from Pyramiden was sampled on 4 July 2019.
2.2. Snow Density and HLD Deposition Estimation
The snow samples were processed at the Hornsund Polish Polar Station chemical laboratory and Adam Mickiewicz University Polar Station right after the field sampling. The snow samples were melted, weighed, and the water volume calculated. The snow density was calculated based on the known snow sampling volume (1.54 dm3) and the volume of melted water. The melted samples were later filtered with the use of pre-weighted Whatman 0.45 µm membrane WCN filters of 47 mm diameter. The filters were later dried (2 h in 80 °C in case of Ariekammen samples; in ambient temperature in case of Pyramiden samples) and weighed after the drying to obtain the sample weight. The Radwag WAS 60/C/2 laboratory scale (0.0001 g resolution) was used at Hornsund lab and Radwag AS 310 R.2 laboratory scale (0.0001 g resolution) in case of the Pyramiden samples. The sample weight was a result of the difference between the pre-weighed filters and the dried filters containing the sample. Empty wet control filters were used to check for accuracy of the drying process both for Ariekammen and Pyramiden samples. Five blank control filters were used at each locality to assess the procedure uncertainty. The standard deviation of the difference between pre-weighed filters and filters weighed after drying was 0.0005 g for Pyramiden samples and 0.0003 g for Ariekammen samples, respectively. This control procedure eliminated possible measurement errors that might have arisen from different drying processes and enable to assess the uncertainty of drying and weighting procedure. The uncertainty arising from the drying procedure varies between 0.12 and 1.13% in the case of Pyramiden samples and between 0.19–4.15% in the case of Ariekammen. The uncertainty is higher in the case of samples with a low amount of sediment captured where the filter itself accounts for the majority of the weight. The amount of sediment captured on the filter was later recalculated with the use of known sample weight and sampling area to obtain the HLD deposition rate (g m−2).
2.3. Sediment Composition
The sediment captured on the 0.45 µm filters was analysed for the elemental composition with the use of X-ray fluorescence (XRF) spectrophotometry. XRF measurements of dried sediments were conducted using a portable Innov-X System DELTA analyser. Each sample was analysed three times for a 90-s measurement period in the soil-geochem mode. The measurements were averaged and the average values were used in further analyses. The results were validated by the analysis of certified reference material CH-4 (Natural Resources Canada).
2.4. Meteorological Observations
The data from the meteorological site at the Polish Polar Station Hornsund (WMO 01003) was used to present atmospheric conditions. Inter-seasonal weather fluctuations are determined by the changing Arctic climate system and atmospheric circulation. The sensors of the automatic Vaisala station listed in Table 2 are installed on the meteorological mast, situated 160 m SW of the main station building. The detailed description of meteorological variables was presented by Wawrzyniak and Osuch [46].
The observations from two automatic weather stations were used at the Pyramiden sampling site. The stations are located approximately 3 km north of the slope of Pyramiden, where the sampling sites were located. The near-sea level station on the marine terrace represents the atmospheric conditions at the bottom of the valley, whereas the station situated on the top of the Mumien peak represents the free atmosphere conditions without a great influence of the local topography [54]. The list of meteorological parameters and sensors used in both locations is given in Table 2.
3. Results
3.1. HLD Deposition
The negative correlation between HLD concentration and altitude was found at both localities. The slope of the correlation is similar; however, the concentrations are significantly higher in case of Pyramiden mountain. On the other hand, there is a similar pattern of deposition which is characterised by the abrupt shift of the deposition rate at the altitude of approximately 300 m a.s.l.. From that altitude upwards the concentration is almost constant (Figure 3). It reaches the values around 3 g m−2 in case of Pyramiden and approximately 0.6 g m−2. The maximum deposition rate was found at the lowest site of Pyramiden profile where it reached 24.6 g m−2 at the altitude 12 m a.s.l.. The highest deposition rate found in the Ariekammen study site was 10.4 g m−2 at the altitude 48 m a.s.l.
3.2. Main and Trace Element Proportions
The higher proportions of lithophile elements (Si, Ca, Fe) were found in the samples from Pyramiden mountain, whereas a higher proportion of Cl (as a possible proxy for ocean derived long-range transported aerosols) was found in case of Ariekammen sampling site. This is also expressed in the Si/Cl ratio which is of one order higher in case of Pyramiden samples (Table 3). No clear dependencies of elemental composition on altitude were found in contrast with the clear correlation of the HLD deposition rate.
3.3. Atmospheric Properties
From 1 March to 4 July 2019 (Figure 4), the mean daily air temperatures were −2.6, −4.7, and −9.1 °C for Hornsund, Terrace, and Mumien stations, respectively. The highest daily temperature was found at Terrace (11.9 °C) and Hornsund (9.5 °C). Mumien was the coldest site, with a temperature ranging from −29.1 °C to 8.3°C. Daily mean air temperatures varied from negative to positive several times during studied period at Terrace and Hornsund; however, air temperature at Mumien was <0 °C until 11 June 2019. The mean daily ground temperatures were −1.6 at Hornsund and −5.9 °C at Terrace in the entire period. Small differences of 2 °C were found when comparing air temperatures between Hornsund and Terrace, while ground temperatures showed differences up to 4.3 °C. Active layer thawing linked with the occurrence of positive ground temperatures at 15–20 cm depth were recorded at Hornsund on 1 June 2019 (day 152) and 15 June 2019 (day 166) at Terrace. The highest ground temperature was observed at Hornsund (12.0 °C) on 22 June 2019 (day 173). The large differences in atmospheric moisture were found between low-situated locations and mountain sites, with mean daily relative humidity ranging from 74.7% and 80.9% (Hornsund, Terrace) to 97.9% at the top of Mumien Peak. At this site, the relative humidity frequently reached 95–100%, meaning cloud cover occurrence at this altitude.
Figure 4 shows a large variability of surface wind speed among all the sites. Mean wind speed during the studied period reached 5.9, 4.7, and 3.6 m s−1 for Hornsund, Terrace and Mumien, respectively. The maximum wind speed at the given sites ranged between 13.2, 12.0, and 14.3 m s−1 for given stations. The main wind direction at Hornsund was easterly, which occurred for 25.1% of the entire period (Figure 5). In the Pyramiden area, the prevailing wind directions at Terrace and Mumien stations were observed from northern (18.2%) and southwestern (14.9%) sectors, respectively. The wind speed >10 m s−1 was observed at Hornsund more frequently (13 days) than at the top of Mumien Peak (5 days). The highest wind speed was recorded at Hornsund during east-northeast wind, while in Pyramiden area the strongest wind occurred in higher parts of hillslope and mountain ridges during southwest advection.
The observations of cloud base height at Hornsund Polish Polar Station (1 March–26 June 2019) revealed three most frequent situations. The cloud base at 800 m a.s.l. was the most frequent (20% of the time), the second most frequent cloud base height was 300 m a.s.l. (16.5% of the time), the 1000 m a.s.l. being the third with 10.5% frequency (Figure 6). The 300 m altitude cloud base height was also often accompanied by precipitation. The other situations did not exceed 10% of occurrence.
4. Discussion
The highly variable seasonal deposition rate ranging from 0.7 g m−2 to 24.5 g m−2 depending on the sampling site altitude found at the two sampling localities corresponds well with similar sites around the Arctic, where the bare surface is exposed. Wittmann et al. [11] found the annual deposition rate of 20.5 g m−2 yr−1 on Brúarjökull, Iceland. The annual deposition values of up to ∼400 g m−2 yr−1 on Icelandic glaciers were reported by Arnalds et al. [55], even though Wittmann et al. [11] considered the values overestimated. Despite the fact that Antarctica is almost completely covered by an ice sheet, there are several major dust source areas with an exposed bare surface resembling the environment of Svalbard. Similar values were found in one of the most important Antarctic dust source areas—the Dry Valleys—where Šabacká et al. [56] reported deposition rate of 8.5–289 g m−2 yr−1. Lancaster [57] reported only 0.66 g m−2 yr−1. Kavan et al. [58] found a deposition rate in the snow on glaciers of James Ross Island ranging between 11.4–64.0 g m−2. It is necessary to keep in mind that the deposition rate reported in this study from Svalbard does not cover the whole year. It includes only the snow season and completely excludes the major dust season at the end of the summer (August), where probably most of the local material is transported. This underestimates the overall deposition rate when comparing with other Arctic sites. However, it might help to distinguish the local and long-range source of the material in the altitude profile. It is worth mentioning that most of the recent studies deal with the chemistry of snow or more specifically deposition of black carbon, heavy metals, hydrocarbons or other organic pollutants and no special attention is paid to the total amount of deposited material.
The background values that are constant above the threshold of 300 m a.s.l. very likely reflect the long-range transport of mineral material transported in the higher levels of the atmosphere. The threshold level of 300 m a.s.l. corresponds well with the frequent observation of cloud base height at this altitude (Figure 6) often accompanied by snowfall or rain events. A similar pattern of atmospheric boundary layer structure is characteristic of the Pyramiden area, where Bednorz and Kolendowicz [59] observed summer Stratus clouds base within a height of 100–300 m. This is supported by Ambrožová and Láska [53] who reported significant differences in the near-surface lapse rates between 136 and 455 m a.s.l., which are linked with frequent air temperature inversions, especially during the spring months as a result of surface cooling from snow and sea ice. Barbaro et al. [60] analysed the snow chemistry on selected glaciers of Svalbard and found similar altitude patterns of deposition. The spatial correlation patterns between Na+ and δ18O suggested that high elevated locations (typically above 600 m a.s.l.) are influenced by long-range transport of aerosols. The general trend of long-range transport being more important in high elevated zones is in good correspondence with findings of the presented study. Groot Zwaaftink et al. [61] reported the dominance of local sources in the Arctic usually in the autumn whereas the long-range transport and deposition occurred more often in spring. The importance of long-range transport in high elevation areas was observed e.g., in McMurdo Dry Valleys [62]. Lancaster [57] reported a clear negative correlation of sediment flux and altitude from the same area. The sediment flux was increasing with the distance from the sea as well. A negative correlation of HLD deposition and altitude was also found on glaciers in James Ross Island, Antarctica [58].
The estimated snow density varied between 0.44–0.59 in case of Ariekammen and 0.45–0.57 g cm−3 in case of Pyramiden. The Ariekammen exhibited slightly lower values in higher altitudes, whereas no visible trend was detected in case of Pyramiden mountain slope. The lacking altitude pattern in case of Pyramiden could be explained by sampling later in the melt season, when the surface snow layer already experienced important melting even in high positioned sampling sites. The differences in snow density are however on the limit of snow density estimation uncertainty [63] as well as the natural variability of snow and do not allow any detailed interpretation.
The elemental composition of the samples suggests the higher importance of local sources in the case of Pyramiden site especially due to the relatively higher abundance of Si and lower abundance of Cl. This corresponds well with the characteristics of both regions—Hornsund area has wet maritime climate compared to the dry continental climate of central Svalbard (e.g., [40,41,42]).
Local wind conditions are favourable for a high deposition rate on the slopes of the Pyramiden mountain and in the close vicinity [64]. The dominant northern wind recorded at the Pyramiden-Terrace station can uplift mineral particles from the vast glacier forefields of Hørbye, Sven, and Ferdinand glaciers (Figure 7), where a large amount of glacial and glaciofluvial material is available [65]. The slopes of the mountain are also partly covered by fine sediment material. The frequent dust storms were also recorded in the adjacent Ebba Valley [66]. The dominant east-northeast wind direction in case of Ariekammen site is likely connected to the neighbouring Hans glacier and these winds could be considered as katabatic. There is almost no place for uplifting mineral particles from the surface as the glacier is marine-terminating thus without any significant basal moraine or until plain. The higher deposition rate was found in Pyramiden mountain despite the fact, that there are higher average wind speed and more frequent high wind speed events in case of Hornsund area. It suggests that the wind direction together with local surface conditions are crucial for activating local HLD sources.
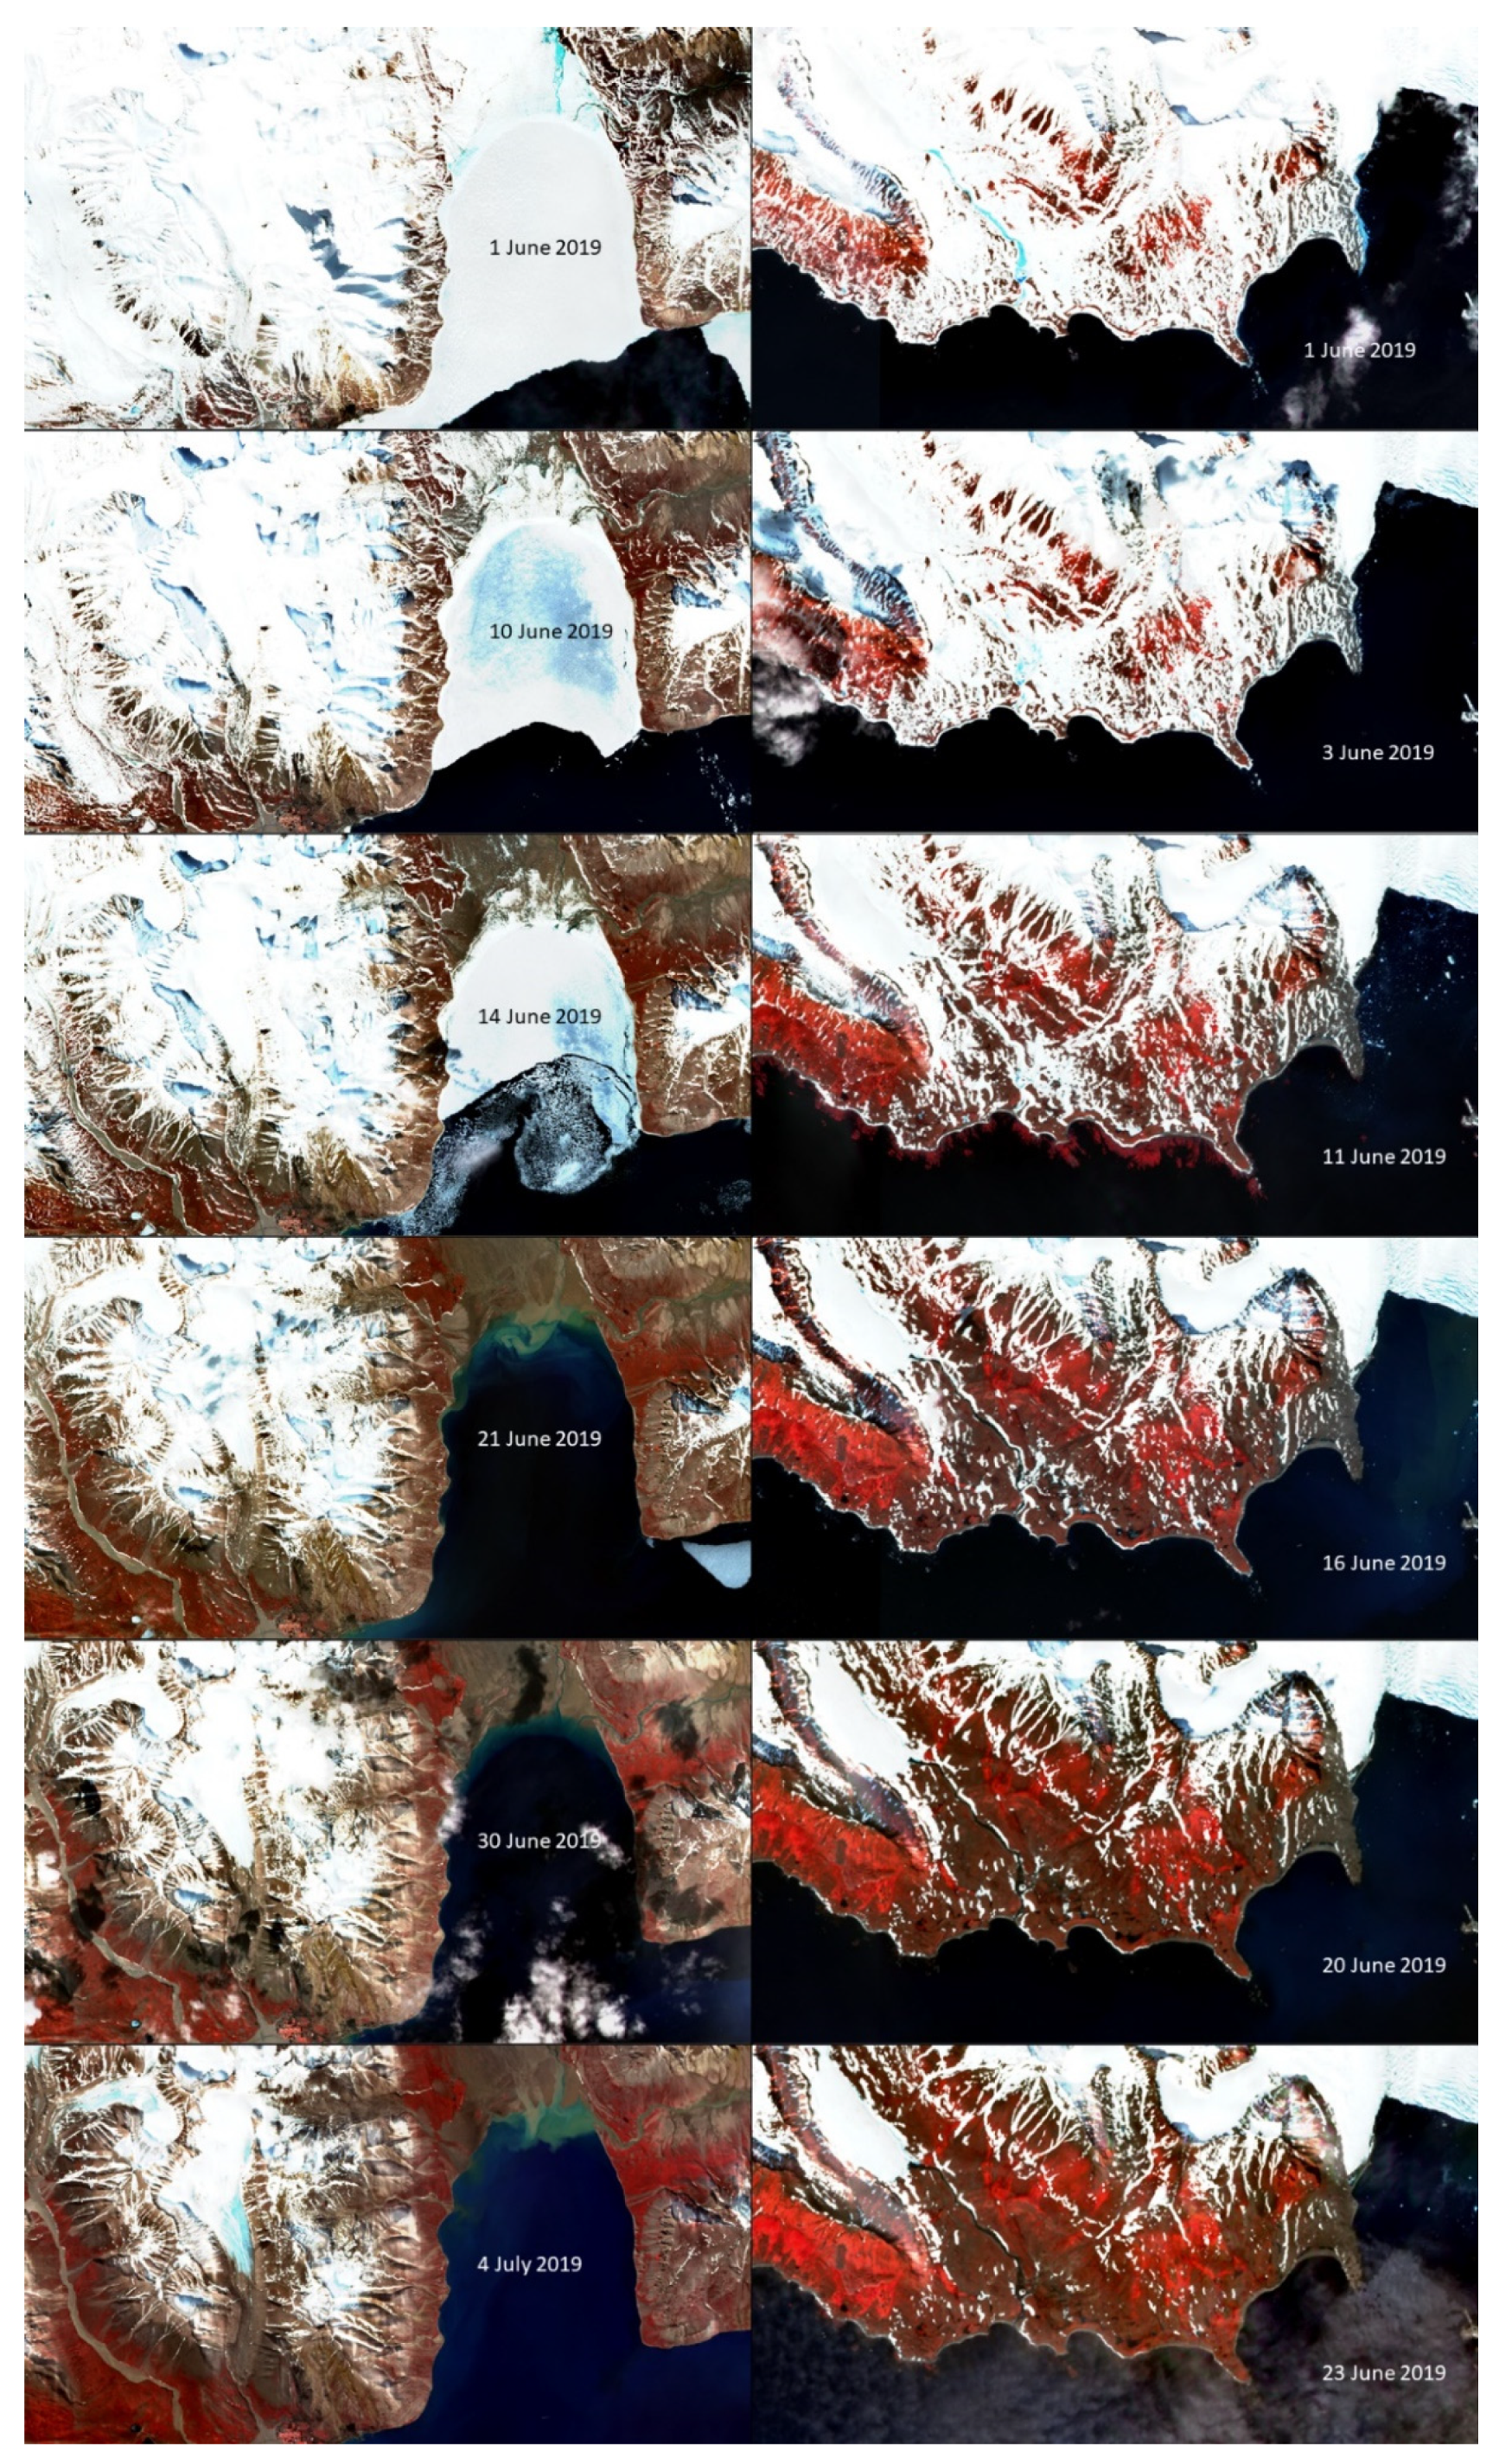
Figure 8 represents the available Sentinel satellite images for the period from 1 June 2019 to 23 June 2019 and from 1 June to 4 July 2019 for Hornsund and Pyramiden, respectively. In the beginning of June, the Pyramiden mountain was covered with snow, with only the lower part of the slope and the coastal area being mostly free from snow. Until 4 July 2019, snow cover was only present at the summit, on the Elsa glacier and in the gullies. A similar situation occurred on the Ariekammen mountain and surrounding area were the snow covered almost all the locality. Only the steepest slopes were snow-free. At the 23 June 2019 snow cover remained at the summit and in the main gully where the samples were collected. It is therefore clear that bare surface available for uplift of the mineral material was only available for a 2–3 weeks before the sampling. The short duration of the snow free surface in the vicinity of the sampling sites is also supported by below zero ground temperatures (Figure 4). The frozen ground effectively prevented the uplift of mineral particles even shortly after the snow cover has melted. On this basis, it is likely that local dust sources were active only 2–3 weeks before the sampling campaign.
5. Conclusions
The HLD deposition on snow from two contrasting regions of Svalbard was compared. More continental and dry central Svalbard (Pyramiden sampling site) experienced a higher deposition rate (9.3 g m−2 in average) in comparison with the maritime Hornsund region–Ariekammen (3.8 g m−2 on average). Sampling in an altitude profile revealed a clear negative correlation between the deposition rate and altitude. This pattern is clear up to the altitude of approximately 300 m a.s.l., from where upwards the deposition rate is constant. This suggests the influence of local sources in the lower atmosphere levels, whereas the high elevation sites were dominated by a long-range transport with a quasi-constant deposition rate (approximately 3 g m−2 in Pyramiden and <1 g m−2 in Ariekammen, respectively).
Author Contributions
J.K. was responsible for study design, field work and lab analysis. K.L. and T.W. provided the background meteorological data. All co-authors (J.K., K.L., T.W. and A.N.) took part in manuscript writing. All authors have read and agreed to the published version of the manuscript.
Funding
The fieldwork of J.K. was carried out thanks to the financial support of the InterAct project n. 387 ”GlacSedRun”. J.K. was also financially supported by the project of the Masaryk University ARCTOS MU (MUNI/G/1540/2019). K.L. was supported by the Czech Polar Research Infrastructure project (LM2015078) and ECOPOLARIS (CZ.02.1.01/0.0/0.0/16_013/0001708). A.N. and T.W. were supported by the Institute of Geophysics, Polish Academy of Sciences within statutory activities no. 3841/E-41/S/2020 of the Ministry of Science and Higher Education of Poland.
Acknowledgments
We would like to acknowledge the help of the staff of the Polish Polar Station Hornsund and the Adam Mickiewicz University Polar Station in Petuniabukta and Veronika Kavanová for the help during the field campaign. The help of Steve Riley with language editing is also acknowledged.
Conflicts of Interest
The authors declare no conflict of interest.
References
- Bullard, J.E.; Baddock, M.; Bradwell, T.; Crusius, J.; Darlington, E.; Gaiero, D.; Gassó, S.; Gisladottir, G.; Hodgkins, R.; McCulloch, R.; et al. High-latitude dust in the earth system. Rev. Geophys. 2016, 54, 447–485. [Google Scholar] [CrossRef] [Green Version]
- Maturilli, M.; Herber, A.; Kӧnig-Langlo, G. Surface radiation climatology for Ny-Ålesund, Svalbard (78.9° N), basic observations for trend detection. Theor. Appl. Climatol. 2015, 120, 331–339. [Google Scholar] [CrossRef] [Green Version]
- Osuch, M.; Wawrzyniak, T. Variations and changes in snow depth at meteorological stations Barentsburg and Hornsund (Spitsbergen). Ann. Glaciol. 2017, 58, 11–20. [Google Scholar] [CrossRef] [Green Version]
- Dumont, M.; Brun, E.; Picard, G.; Michou, M.; Libois, Q.; Petit, J.R.; Geyer, M.; Morin, S.; Josse, B. Contribution of light-absorbing impurities in snow to Greenland’s darkening since 2009. Nat. Geosci. 2014, 7, 509–512. [Google Scholar] [CrossRef]
- Moroni, B.; Arnalds, O.; Dagsson-Waldhauserová, P.; Crocchianti, S.; Vivani, R.; Cappelletti, D. Mineralogical and Chemical Records of Icelandic Dust Sources Upon Ny-Ålesund (Svalbard Islands). Front. Earth Sci. 2018, 6, 187. [Google Scholar] [CrossRef]
- Karasiński, G.; Posyniak, M.; Bloch, M.; Sobolewski, P.; Małarzewski, L.; Soroka, J. Lidar observations of volcanic dust over Polish Polar Station at Hornsund after eruptions of Eyjafjallajökull and Grímsvötn. Acta Geophys. 2014, 62, 316–339. [Google Scholar] [CrossRef]
- Arnalds, O.; Dagsson-Waldhauserová, P.; Olafsson, H. The Icelandic volcanic aeolian environment: Processes and impacts—A review. Aeolian Res. 2016, 20, 176–195. [Google Scholar] [CrossRef] [Green Version]
- Baddock, M.C.; Mockford, T.; Bullard, J.E.; Thorsteinsson, T. Pathways of high-latitude dust in the North Atlantic. Earth Planet. Sci. Lett. 2017, 459, 170–182. [Google Scholar] [CrossRef] [Green Version]
- Dörnbrack, A.; Stachlewska, I.S.; Ritter, C.; Neuber, R. Aerosol distribution around Svalbard during intense easterly winds. Atmos. Chem. Phys. 2010, 10, 1473–1490. [Google Scholar] [CrossRef] [Green Version]
- Bullard, J.E.; Austin, M.J. Dust generation on a proglacial floodplain, West Greenland. Aeolian Res. 2011, 3, 43–54. [Google Scholar] [CrossRef] [Green Version]
- Wittmann, M.; Groot Zwaaftink, C.D.; Steffensen Schmidt, L.; Guðmundsson, S.; Pálsson, F.; Arnalds, O.; Björnsson, H.; Thorsteinsson, T.; Stohl, A. Impact of dust deposition on the albedo of Vatnajökull ice cap, Iceland. Cryosphere 2017, 11, 741–754. [Google Scholar] [CrossRef] [Green Version]
- Kaspari, S.; McKenzies-Skiles, S.; Delaney, I.; Dixon, D.; Painter, T.H. Accelerated glacier melt on Snow Dome, Mount Olympus, Washington, USA, due to deposition of black carbon and mineral dust from wildfire. JGR Atmos. 2015, 120, 2793–2807. [Google Scholar] [CrossRef] [Green Version]
- Li, X.; Kang, S.; He, X.; Qu, B.; Tripathee, L.; Jing, Z.; Paudyal, R.; Li, Y.; Zhang, Y.; Yan, F.; et al. Light-absorbing impurities accelerate glacier melt in the Central Tibetan Plateau. Sci. Total Environ. 2017, 587–588, 482–490. [Google Scholar] [CrossRef] [PubMed]
- Zawierucha, K.; Baccolo, G.; Di Mauro, B.; Nawrot, A.; Szczuciński, W.; Kalińska, E. Micromorphological features of mineral matter from cryoconite holes on Arctic (Svalbard) and alpine (the Alps, the Caucasus) glaciers. Polar Sci. 2019, 22, 100482. [Google Scholar] [CrossRef]
- Stibal, M.; Šabacká, M.; Žárský, J. Biological processes on glacier and ice sheet surfaces. Nat. Geosci. 2012, 5, 771–774. [Google Scholar] [CrossRef]
- Zawierucha, K.; Ostrowska, M.; Vonnahme, T.R.; Devetter, M.; Nawrot, A.P.; Lehmann, S.; Kolicka, M. Diversity and distribution of Tardigrada in Arctic cryoconite holes. J. Limnol. 2016, 75, 545–559. [Google Scholar] [CrossRef] [Green Version]
- Zawierucha, K.; Buda, J.; Nawrot, A. Extreme weather event results in the removal of invertebrates from cryoconite holes on an Arctic valley glacier (Longyearbreen, Svalbard). Ecol. Res. 2019, 34, 370–379. [Google Scholar] [CrossRef]
- Aliabadi, A.A.; Staebler, R.M.; Sharma, S. Air quality monitoring in communities of the Canadian Arctic during the high shipping season with a focus on local and marine pollution. Atmos. Chem. Phys. 2015, 15, 2651–2673. [Google Scholar] [CrossRef] [Green Version]
- Weinbruch, S.; Wiesemann, D.; Ebert, M.; Schütze, K.; Kallenborn, R.; Strӧm, J. Chemical composition and sources of aerosol particles at Zeppelin Mountain (Ny Ålesund, Svalbard): An electron microscopy study. Atmos. Environ. 2012, 49, 142–150. [Google Scholar] [CrossRef]
- Moroni, B.; Capelleti, D.; Ferrero, L.; Crocchianti, S.; Busetto, M.; Mazzola, M.; Becagli, S.; Traversi, R.; Udisti, R. Local vs. long-range sources of aerosol particles upon Ny-Ålesund (Svalbard Islands): Mineral chemistry and geochemical records. Rend. Lincei 2016, 27, 115–127. [Google Scholar] [CrossRef]
- Moroni, B.; Capelleti, D.; Crocchianti, S.; Becagli, S.; Caiazzo, L.; Traversi, R.; Udisti, R.; Mazzola, M.; Markowicz, K.; Ritter, C.; et al. Morphochemical characteristics and mixing state of long range transported wildfire particles at Ny-Ålesund (Svalbard Islands). Atmos. Environ. 2017, 156, 135–145. [Google Scholar] [CrossRef]
- Moroni, B.; Ritter, C.; Crocchianti, S.; Markowicz, K.; Mazzola, M.; Becagli, S.; Traversi, R.; Krejci, R.; Tunved, P.; Capelleti, D. Individual Particle Characteristics, Optical Properties and Evolution of an Extreme Long-Range Transported Biomass Burning Event in the European Arctic (Ny-Ålesund, Svalbard Islands). JGR Atmos. 2020, 125. [Google Scholar] [CrossRef]
- Lewandowski, M.; Kusiak, A.M.; Werner, T.; Nawrot, A.; Barzycka, B.; Laska, M.; Luks, B. Seeking the Sources of Dust: Geochemical and Magnetic Studies on ”Cryodust” in Glacial Cores from Southern Spitsbergen (Svalbard, Norway). Atmosphere 2020, 11. (accepted). [Google Scholar]
- Nawrot, A.; Migała, K.; Luks, B.; Pakszys, P.; Głowacki, P. Chemistry of snow cover and acidic snowfall during a season with a high level of air pollution on the Hans Glacier, Spitsbergen. Polar Sci. 2016, 10, 249–261. [Google Scholar] [CrossRef]
- Aamaas, B.; Bøggild, C.E.; Stordal, F.; Berntsen, T.; Holmén, K.; Strùm, J. Elemental carbon deposition to Svalbard snow from Norwegian settlements and long-range transport. Tellus B Chem. Phys. Meteorol. 2011, 63, 340–351. [Google Scholar] [CrossRef]
- Gallet, J.C.; Zdanowicz, C.; Björkman, M.P.; Larose, C.; Schuler, T.V.; Luks, B.; Koziol, K.; Spolaor, A.; Barbaro, E.; Martma, T.; et al. Particulate organic and elemental carbon in Svalbard snow, 2007–18. PANGAEA 2020. [Google Scholar] [CrossRef]
- Schuler, T.V.; Kohler, J.; Elagina, N.; Hagen, J.O.M.; Hodson, A.J.; Jania, J.A.; Kӓӓb, A.M.; Luks, B.; Malecki, J.; Moholdt, G.; et al. Reconciling Svalbard Glacier Mass Balance. Front. Earth Sci. 2020, 8. [Google Scholar] [CrossRef]
- Rachlewicz, G.; Szczucinski, W.; Ewertowski, M. Post-“Little Ice Age” retreat rates of glaciers around Billefjorden in central Spitsbergen, Svalbard. Pol. Polar Res. 2007, 28, 159–186. [Google Scholar]
- Kavan, J. Early twentieth century evolution of Ferdinand glacier, Svalbard, based on historic photographs and structure-from-motion technique. Geogr. Ann. Ser. A Phys. Geogr. 2020, 102, 57–67. [Google Scholar] [CrossRef]
- Strzelecki, M.C.; Long, J.A.; Lloyd, J.M.; Malecki, J.; Zagórski, P.; Pawlowski, L.; Jaskólski, M.W. The role of rapid glacier retreat and landscape transformation in controlling the post-Little Ice Age evolution of paraglacial coasts in central Spitsbergen (Billefjorden, Svalbard). Land Degrad. Dev. 2018, 29, 1962–1978. [Google Scholar] [CrossRef]
- Těšitel, J.; Těšitelová, T.; Bernardová, A.; Janková Drdová, E.; Lučanová, M.; Klimešová, J. Demographic population structure and fungal associations of plants colonizing High Arctic glacier forelands, Petuniabukta, Svalbard. Polar Res. 2014, 33. [Google Scholar] [CrossRef] [Green Version]
- Wietrzyk-Pełka, P.; Cykowska-Marzencka, B.; Maruo, F.; Szymański, W.; Węgrzyn, M.H. Mosses and liverworts in the glacier forelands and mature tundra of Svalbard (High Arctic): Diversity, ecology, and community composition. Pol. Polar Res. 2020, 41, 151–186. [Google Scholar] [CrossRef]
- Małecki, J. Elevation and volume changes of seven Dickson Land glaciers, Svalbard, 1960–1990–2009. Polar Res. 2013, 32. [Google Scholar] [CrossRef]
- Procházková, B.; Engel, Z.; Tomíček, J. Geometric changes of three glaciers in Dickson Land, central Spitsbergen, during the period 1990–2015. Polar Sci. 2019, 20, 129–135. [Google Scholar] [CrossRef]
- Błaszczyk, M.; Jania, J.A.; Kolondra, L. Fluctuations of tidewater glaciers in Hornsund Fiord (Southern Svalbard) since the beginning of the 20th century. Pol. Polar Res. 2013, 34, 327–352. [Google Scholar] [CrossRef]
- Laparazan, J.; Petlicki, M.; Navarro, F.; Machío, F.; Puczko, D.; Glowacki, P.; Nawrot, A. Ice volume changes (1936–1990–2007) and ground-penetrating radar studies of Ariebreen, Hornsund, Spitsbergen. Polar Res. 2013, 32. [Google Scholar] [CrossRef] [Green Version]
- Owczarek, P.; Nawrot, A.; Migała, K.; Malik, I.; Korabiewski, B. Floodplain responses to contemporary climate change in small High-Arctic basins (Svalbard, Norway). Boreas 2014, 43, 384–402. [Google Scholar] [CrossRef]
- Ćwiąkała, J.; Moskalik, M.; Forwick, M.; Szczuciński, W.; Wojtysiak, K.; Giżejewski, J. Submarine geomorphology at the front of retreating tidewater glacier Hansbreen, Hornsund Fjord, south-west Spitsbergen. J. Maps 2018, 14, 123–134. [Google Scholar] [CrossRef]
- Strzelecki, M.C.; Szczuciński, W.; Dominiczak, A.; Zagórski, P.; Dudek, J.; Knight, J. New fjords, new coasts, new landscapes: The geomorphology of paraglacial coasts formed after recent glacier retreat in Brepollen (Hornsund, southern Svalbard). Earth Surf. Process. Landf. 2020, 45, 1325–1334. [Google Scholar] [CrossRef] [Green Version]
- Láska, K.; Witoszová, D.; Prošek, P. Weather patterns of the coastal zone of Petuniabukta, central Spitsbergen in the period 2008–2010. Pol. Polar Res. 2012, 33, 297. [Google Scholar] [CrossRef]
- Przybylak, R.; Arazny, A.; Nordli, O.; Finkelnburg, R.; Kejna, M.; Budzik, T.; Migala, K.; Sikora, S.; Puczko, D.; Rymer, K.; et al. Spatial distribution of air temperature on Svalbard during 1 year with campaign measurements. Int. J. Climatol. 2014, 34, 3702–3719. [Google Scholar] [CrossRef]
- Osuch, M.; Wawrzyniak, T. Inter- and intra-annual changes of air temperature and precipitation in western Spitsbergen. Int. J. Climatol. 2017, 37, 3082–3097. [Google Scholar] [CrossRef]
- Szymański, W.; Siwek, J.; Waścińska, J.; Wojtuń, B. Texture and geochemistry of surface horizons of Arctic soils from a non-glaciated catchment, SW Spitsbergen. Pol. Polar Res. 2016, 37, 361–377. [Google Scholar] [CrossRef]
- Jakubas, D.; Zmudczynska, K.; Wojczulanis-Jakubas, K.; Stempniewicz, L. Faeces deposition and numbers of vertebrate herbivores in the vicinity of planktivorous and piscivorous seabird colonies in Hornsund, Spitsbergen. Pol. Polar Res. 2008, 29, 45–58. [Google Scholar]
- Kępski, D.; Luks, B.; Migała, K.; Wawrzyniak, T.; Westermann, S.; Wojtuń, B. Terrestrial Remote Sensing of Snowmelt in a Diverse High-Arctic Tundra Environment Using Time-Lapse Imagery. Remote Sens. 2017, 9, 733. [Google Scholar] [CrossRef] [Green Version]
- Wawrzyniak, T.; Osuch, M. A 40-year High Arctic climatological dataset of the Polish Polar Station Hornsund (SW Spitsbergen, Svalbard). Earth Syst. Sci. Data 2020, 12, 805–815. [Google Scholar] [CrossRef] [Green Version]
- Araźny, A.; Przybylak, R.; Wyszyński, P.; Wawrzyniak, T.; Nawrot, A.; Budzik, T. Spatial variations in air temperature and humidity over Hornsund fjord (Spitsbergen) from 1 July 2014 to 30 June 2015. Geogr. Ann. Ser. A Phys. Geogr. 2018, 100, 27–43. [Google Scholar] [CrossRef]
- Nordli, Ø.; Przybylak, R.; Ogilvie, A.E.J.; Isaksen, K. Long-term temperature trends and variability on Spitsbergen: The extended Svalbard Airport temperature series, 1898–2012. Polar Res. 2014, 33, 21349. [Google Scholar] [CrossRef] [Green Version]
- Prach, K.; Klimesova, J.; Kosnar, J.; Redcenko, O.; Hais, M. Variability of contemporary vegetation around Petuniabukta, central Spitsbergen. Pol. Polar Res. 2012, 33, 383–394. [Google Scholar] [CrossRef]
- Hanáček, M.; Nývlt, D.; Flašar, J.; Stacke, V.; Mida, P.; Lehejček, J.; Tóthová, G.; Břežný, M.; Procházková, B.; Uxa, T.; et al. New methods to reconstruct clast transport history in different glacial sedimentary environments: Case study for Old Red sandstone clasts from polythermal Hørbyebreen and Bertilbreen valley glaciers, Central Svalbard. Czech Polar Rep. 2013, 3, 107–129. [Google Scholar] [CrossRef]
- Pushkareva, E.; Wilmotte, A.; Láska, K.; Elster, J. Comparison of Microphototrophic Communities Living in Different Soil Environments in the High Arctic. Front. Ecol. Evol. 2019, 7, 393. [Google Scholar] [CrossRef] [Green Version]
- Nilsen, F.; Cottier, F.; Skogseth, R.; Mattsson, S. Fjord–shelf exchanges controlled by ice and brine production: The interannual variation of Atlantic Water in Isfjorden, Svalbard. Cont. Shelf Res. 2008, 28, 1838–1853. [Google Scholar] [CrossRef]
- Ambrožová, K.; Láska, K. Air temperature variability in the vertical profile over the coastal area of Petuniabukta, central Spitsbergen. Pol. Polar Res. 2017, 38, 41–60. [Google Scholar] [CrossRef] [Green Version]
- Láska, K.; Chládová, Z.; Hošek, J. High-resolution numerical simulation of summer wind field comparing WRF boundary-layer parametrizations over complex Arctic topography: Case study from central Spitsbergen. Meteorol. Z. 2017, 26, 391–408. [Google Scholar] [CrossRef]
- Arnalds, O.; Olafsson, H.; Dagsson-Waldhauserova, P. Quantification of iron-rich volcanogenic dust emissions and deposition over the ocean from Icelandic dust sources. Biogeosciences 2014, 11, 6623–6632. [Google Scholar] [CrossRef] [Green Version]
- Šabacká, M.; Priscu, J.C.; Basagic, H.J.; Fountain, A.G.; Wall, D.H.; Virginia, R.A.; Greenwood, M.C. Aeolian flux of biotic and abiotic material in Taylor Valley, Antarctica. Geomorphology 2012, 155–156, 102–111. [Google Scholar] [CrossRef]
- Lancaster, N. Flux of eolian sediment in the McMurdo Dry Valleys, Antarctica: A preliminary assessment. Arct. Antarct. Alpine Res. 2002, 34, 318–323. [Google Scholar] [CrossRef]
- Kavan, J.; Nývlt, D.; Láska, K.; Engel, Z.; Kňažková, M. High-latitude dust deposition in snow on the glaciers of James Ross Island, Antarctica. Earth Surf. Process. Landf. 2020, 45, 1569–1578. [Google Scholar] [CrossRef]
- Bednorz, E.; Kolendowicz, L. Summer 2009 thermal and bioclimatic conditions in Ebba Valley, central Spitsbergen. Pol. Polar Res. 2010, 31, 327–348. [Google Scholar] [CrossRef] [Green Version]
- Barbaro, E.; Koziol, K.; Bjӧrkman, M.P.; Carmen, P.V.; Zdanowicz, C.; Martma, T.; Gallet, J.C.; Kepski, D.; Larose, C.; Luks, B.; et al. Measurement report: Spatial variations in snowpack ionic chemistry and water stable 2 isotopes across Svalbard. Atmos. Chem. Phys. Discuss. 2020. [Google Scholar] [CrossRef]
- Groot Zwaaftink, C.D.; Grythe, H.; Skov, A.; Stohl, A. Substantial contribution of northern high-latitude sources to mineral dust in the Arctic. JGR Atmos. 2016, 121, 13678–13697. [Google Scholar] [CrossRef] [PubMed]
- Diaz, M.A.; Welch, S.A.; Sheets, J.M.; Welch, K.A.; Khan, A.L.; Adams, B.J.; McKnight, D.M.; Cary, S.C.; Lyons, W.B. Geochemistry of aeolian material from the McMurdo Dry Valleys, Antarctica: Insights into Southern Hemisphere dust sources. Earth Planet. Sci. Lett. 2020, 547, 116460. [Google Scholar] [CrossRef]
- Conger, S.M.; McClung, D.M. Comparison of density cutters for snow profile observations. J. Glaciol. 2009, 55, 163–169. [Google Scholar] [CrossRef] [Green Version]
- Borysiak, J.; Pleskot, K.; Rachlewicz, G. Dryas aeolian landforms in Arctic deflationary tundra, central Spitsbergen. Pol. Polar Res. 2020, 41, 41–68. [Google Scholar] [CrossRef]
- Evans, D.J.A.; Strzelecki, M.; Milledge, D.G.; Orton, C. Hørbyebreen polythermal glacial landsystem, Svalbard. J. Maps 2012, 8, 146–156. [Google Scholar] [CrossRef] [Green Version]
- Strzelecki, M.C.; Long, A.J. Tales from an Arctic Beach, Little Shells and Return to the Past—Petuniabukta 2010 Fieldwork, Billefjorden, Svalbard. J. Coast. Res. 2020, 101, 339–345. [Google Scholar] [CrossRef]
Figure 1.
Location of Svalbard archipelago (red) (A); Svalbard with the two study sites marked with a red rectangle (B); Sentinel 2 image of the Pyramiden study site taken on 4 July 2019 with the study area in E marked with a red rectangle (C); Sentinel 2 image of the Ariekammen study site taken on 23 June 2019 with the study area in F marked with a red rectangle (D); detailed topography of the sampling sites on the Pyramiden mountain with sampling sites marked in yellow rectangles (DEM from 2009–NPI) (E); and detailed topography and sampling sites on the slope of the Ariekammen mountain with sampling sites marked in yellow rectangles (DEM from 1990–NPI) (F).

Figure 2.
Ariekammen (A) and Pyramiden (B) sampling sites with the continuous snowfields from where the samples were taken—marked with red arrows (photos by J. Kavan).
Figure 2.
Ariekammen (A) and Pyramiden (B) sampling sites with the continuous snowfields from where the samples were taken—marked with red arrows (photos by J. Kavan).
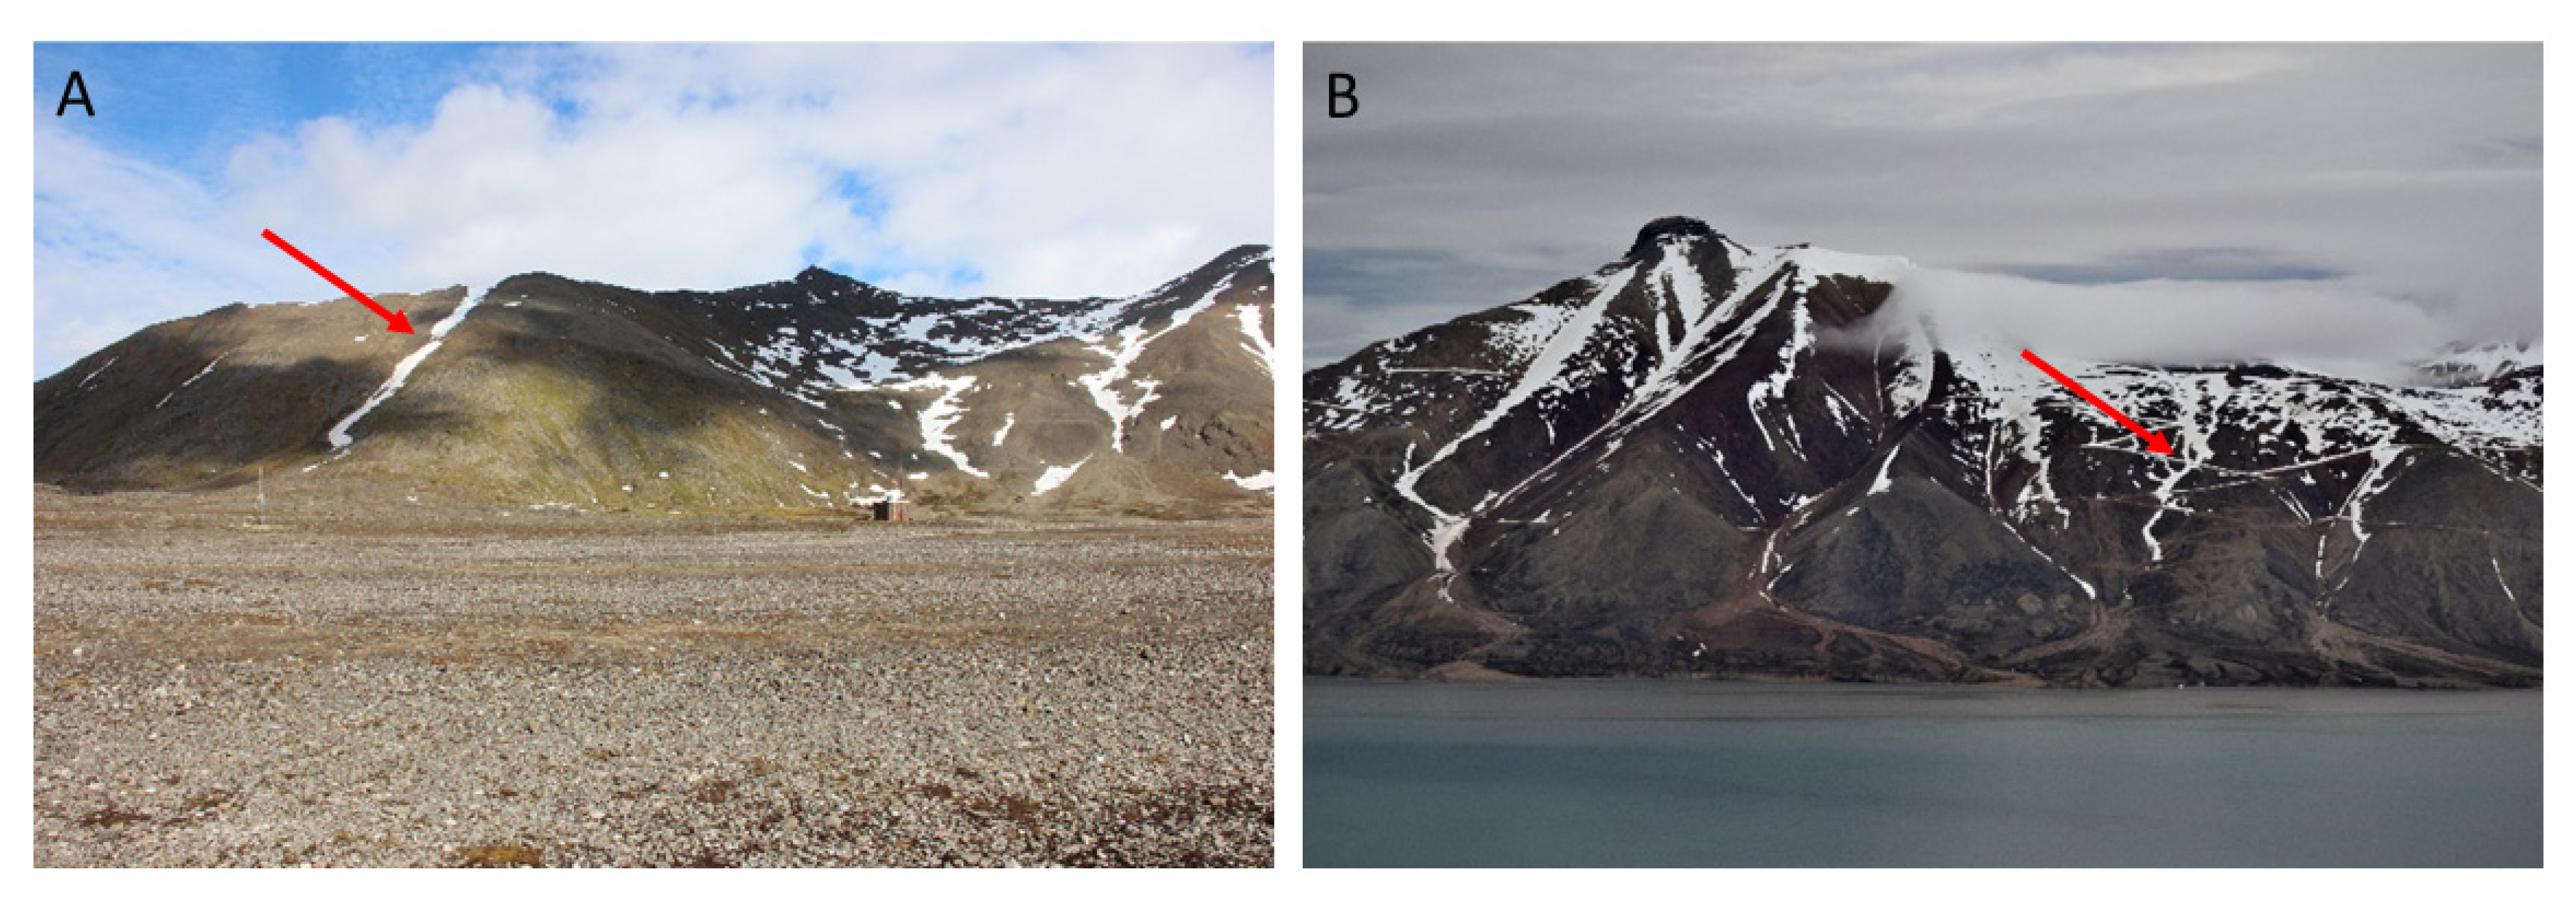
Figure 3.
High Latitude Dust (HLD) deposition on the mountain slopes of Ariekammen and Pyramiden collected from the surface snow layer on 26 June (Ariekammen) and 4 July 2019 (Pyramiden); the relationship between altitude and deposition is highlighted with the trend lines.
Figure 3.
High Latitude Dust (HLD) deposition on the mountain slopes of Ariekammen and Pyramiden collected from the surface snow layer on 26 June (Ariekammen) and 4 July 2019 (Pyramiden); the relationship between altitude and deposition is highlighted with the trend lines.
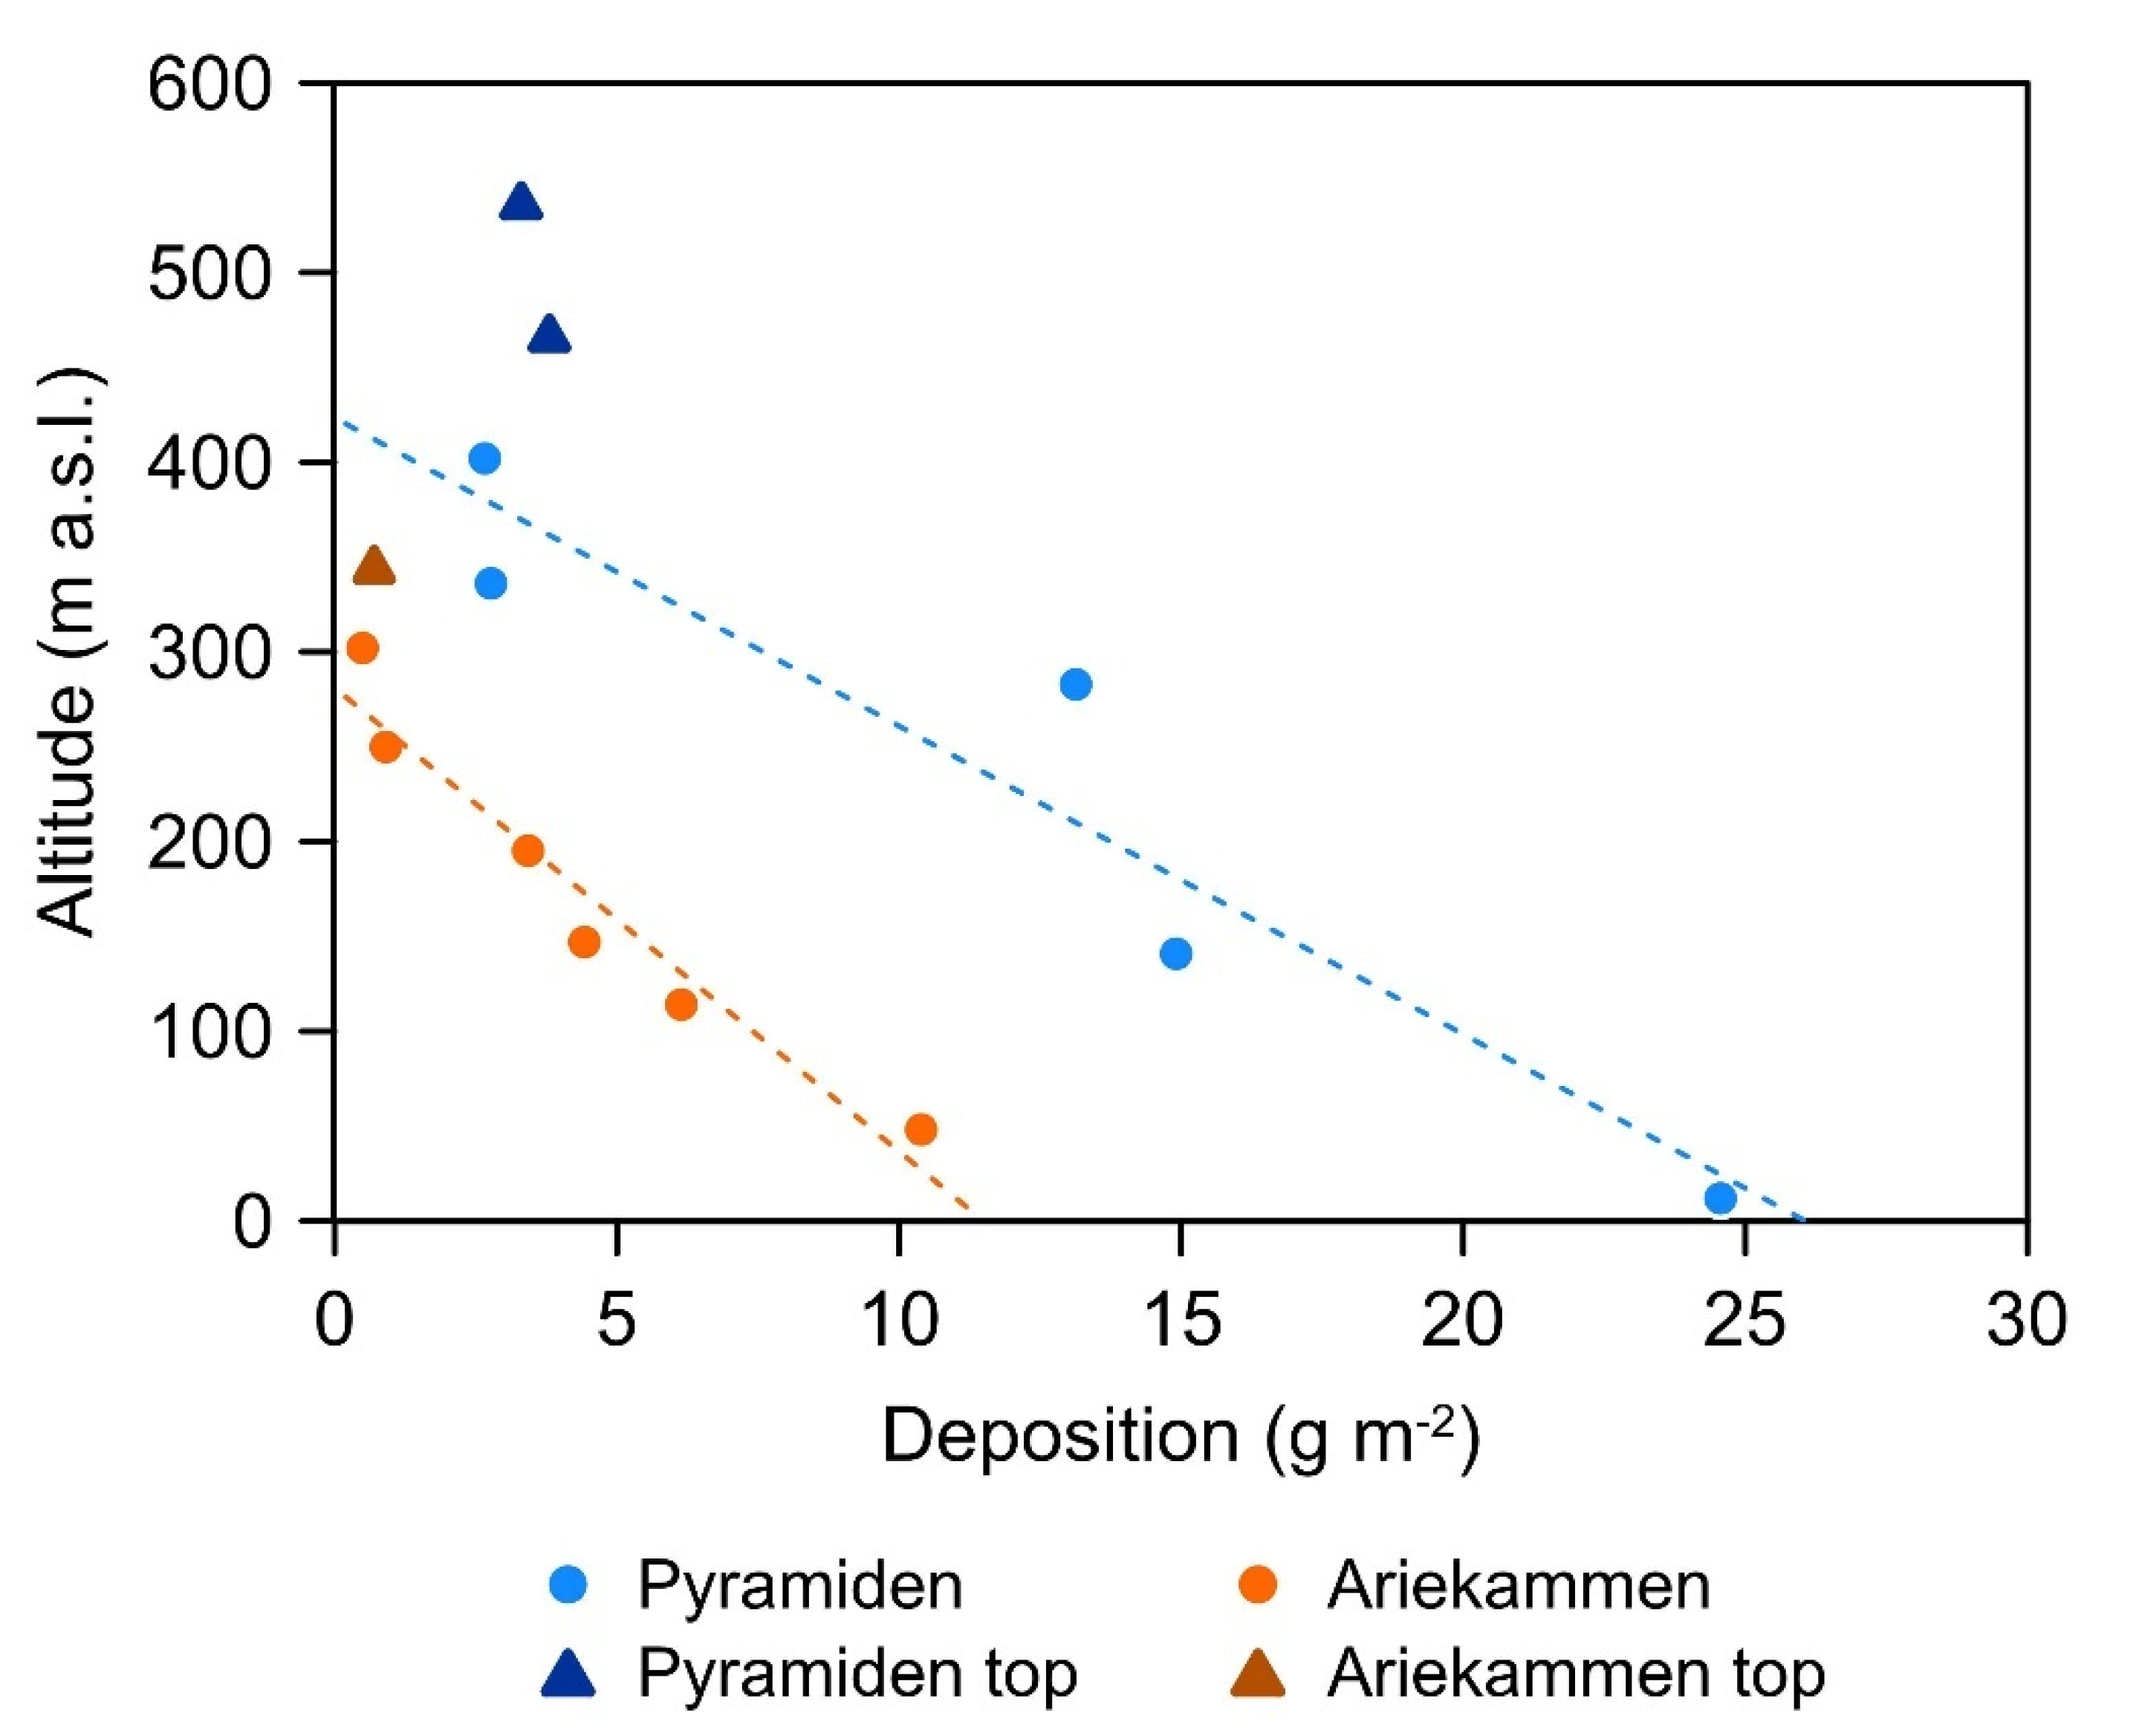
Figure 4.
Basic meteorological parameters for both Hornsund and Pyramiden sampling sites recorded in the period 1 March–4 July 2019 (day 60–185).
Figure 4.
Basic meteorological parameters for both Hornsund and Pyramiden sampling sites recorded in the period 1 March–4 July 2019 (day 60–185).
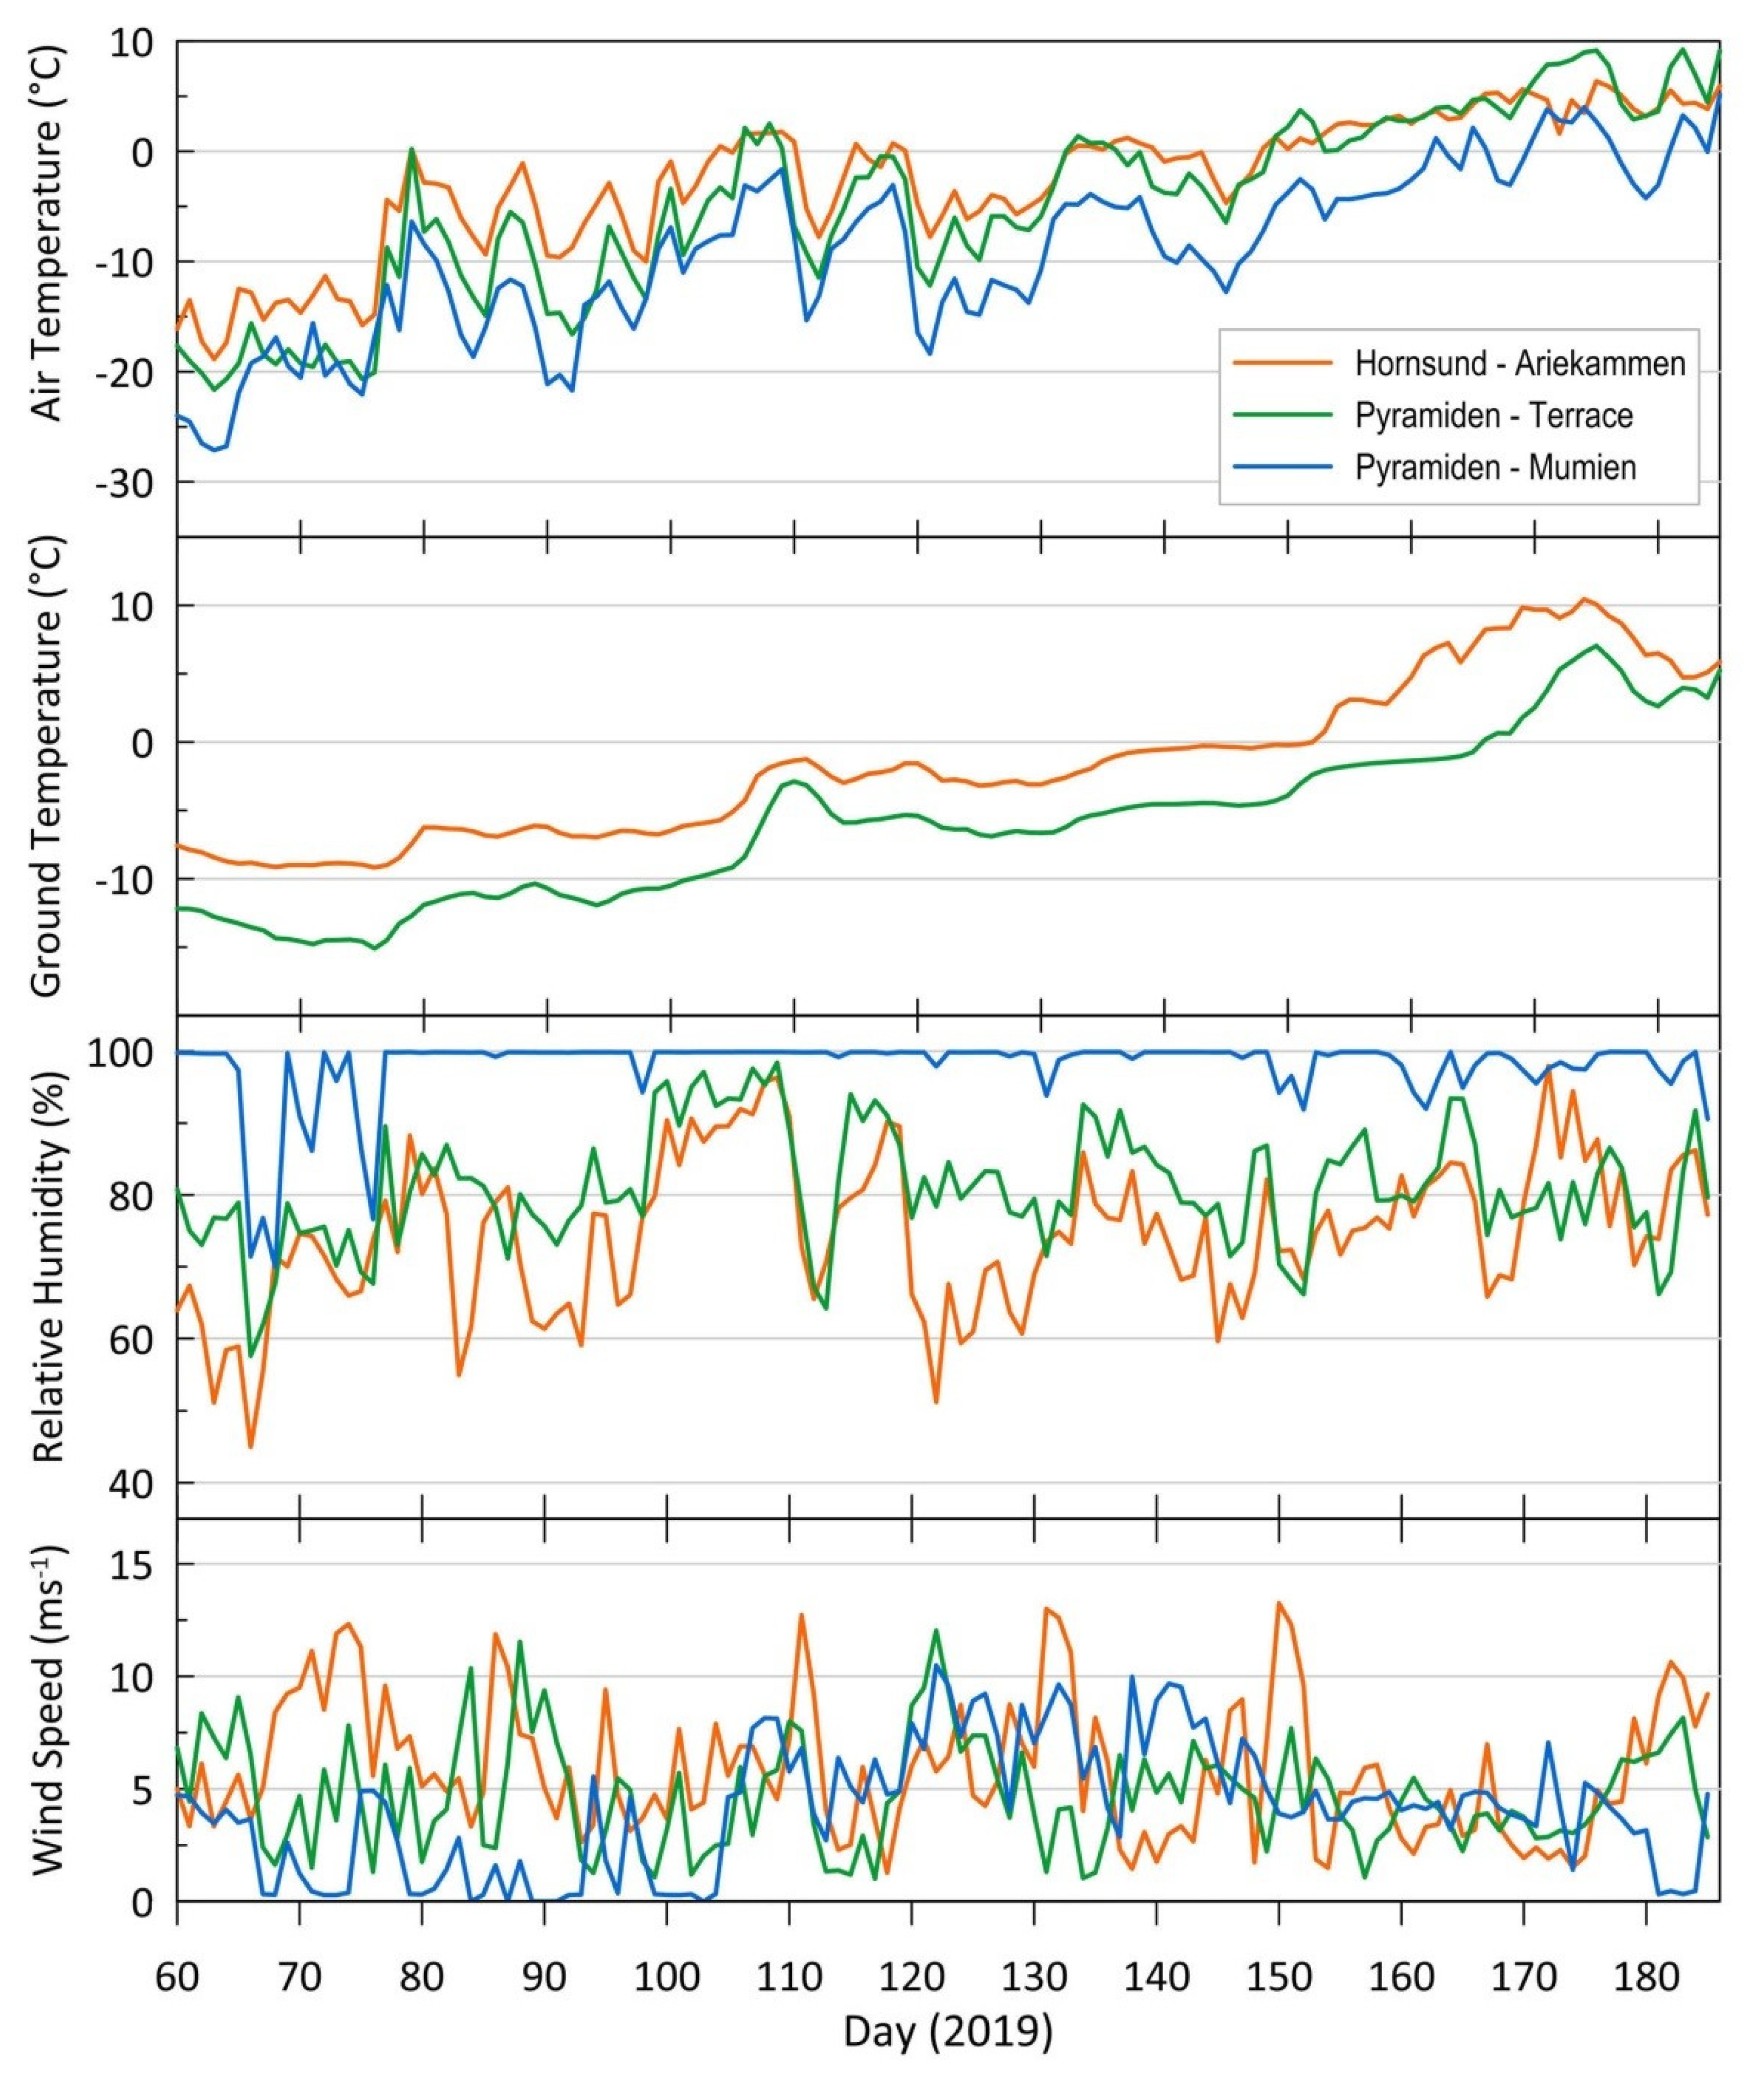
Figure 5.
Wind roses based on observed surface winds plotted in their exact positions within the study areas–Hornsund (A), Petuniabukta (B); Detailed wind roses at Hornsund (10 m a.s.l.), Terrace station near Pyramiden (14 m a.s.l.) and top of the Mumien Peak (764 m a.s.l.) next to the Pyramiden mountain (C) in the period 1 March–4 July 2019.

Figure 6.
Cloud base height frequencies at Hornsund in the period 1 March–26 June 2019.

Figure 7.
Uplift of fine mineral material in the forefield of the Sven glacier (Petuniabukta) (photo by T. Wawrzyniak).
Figure 7.
Uplift of fine mineral material in the forefield of the Sven glacier (Petuniabukta) (photo by T. Wawrzyniak).
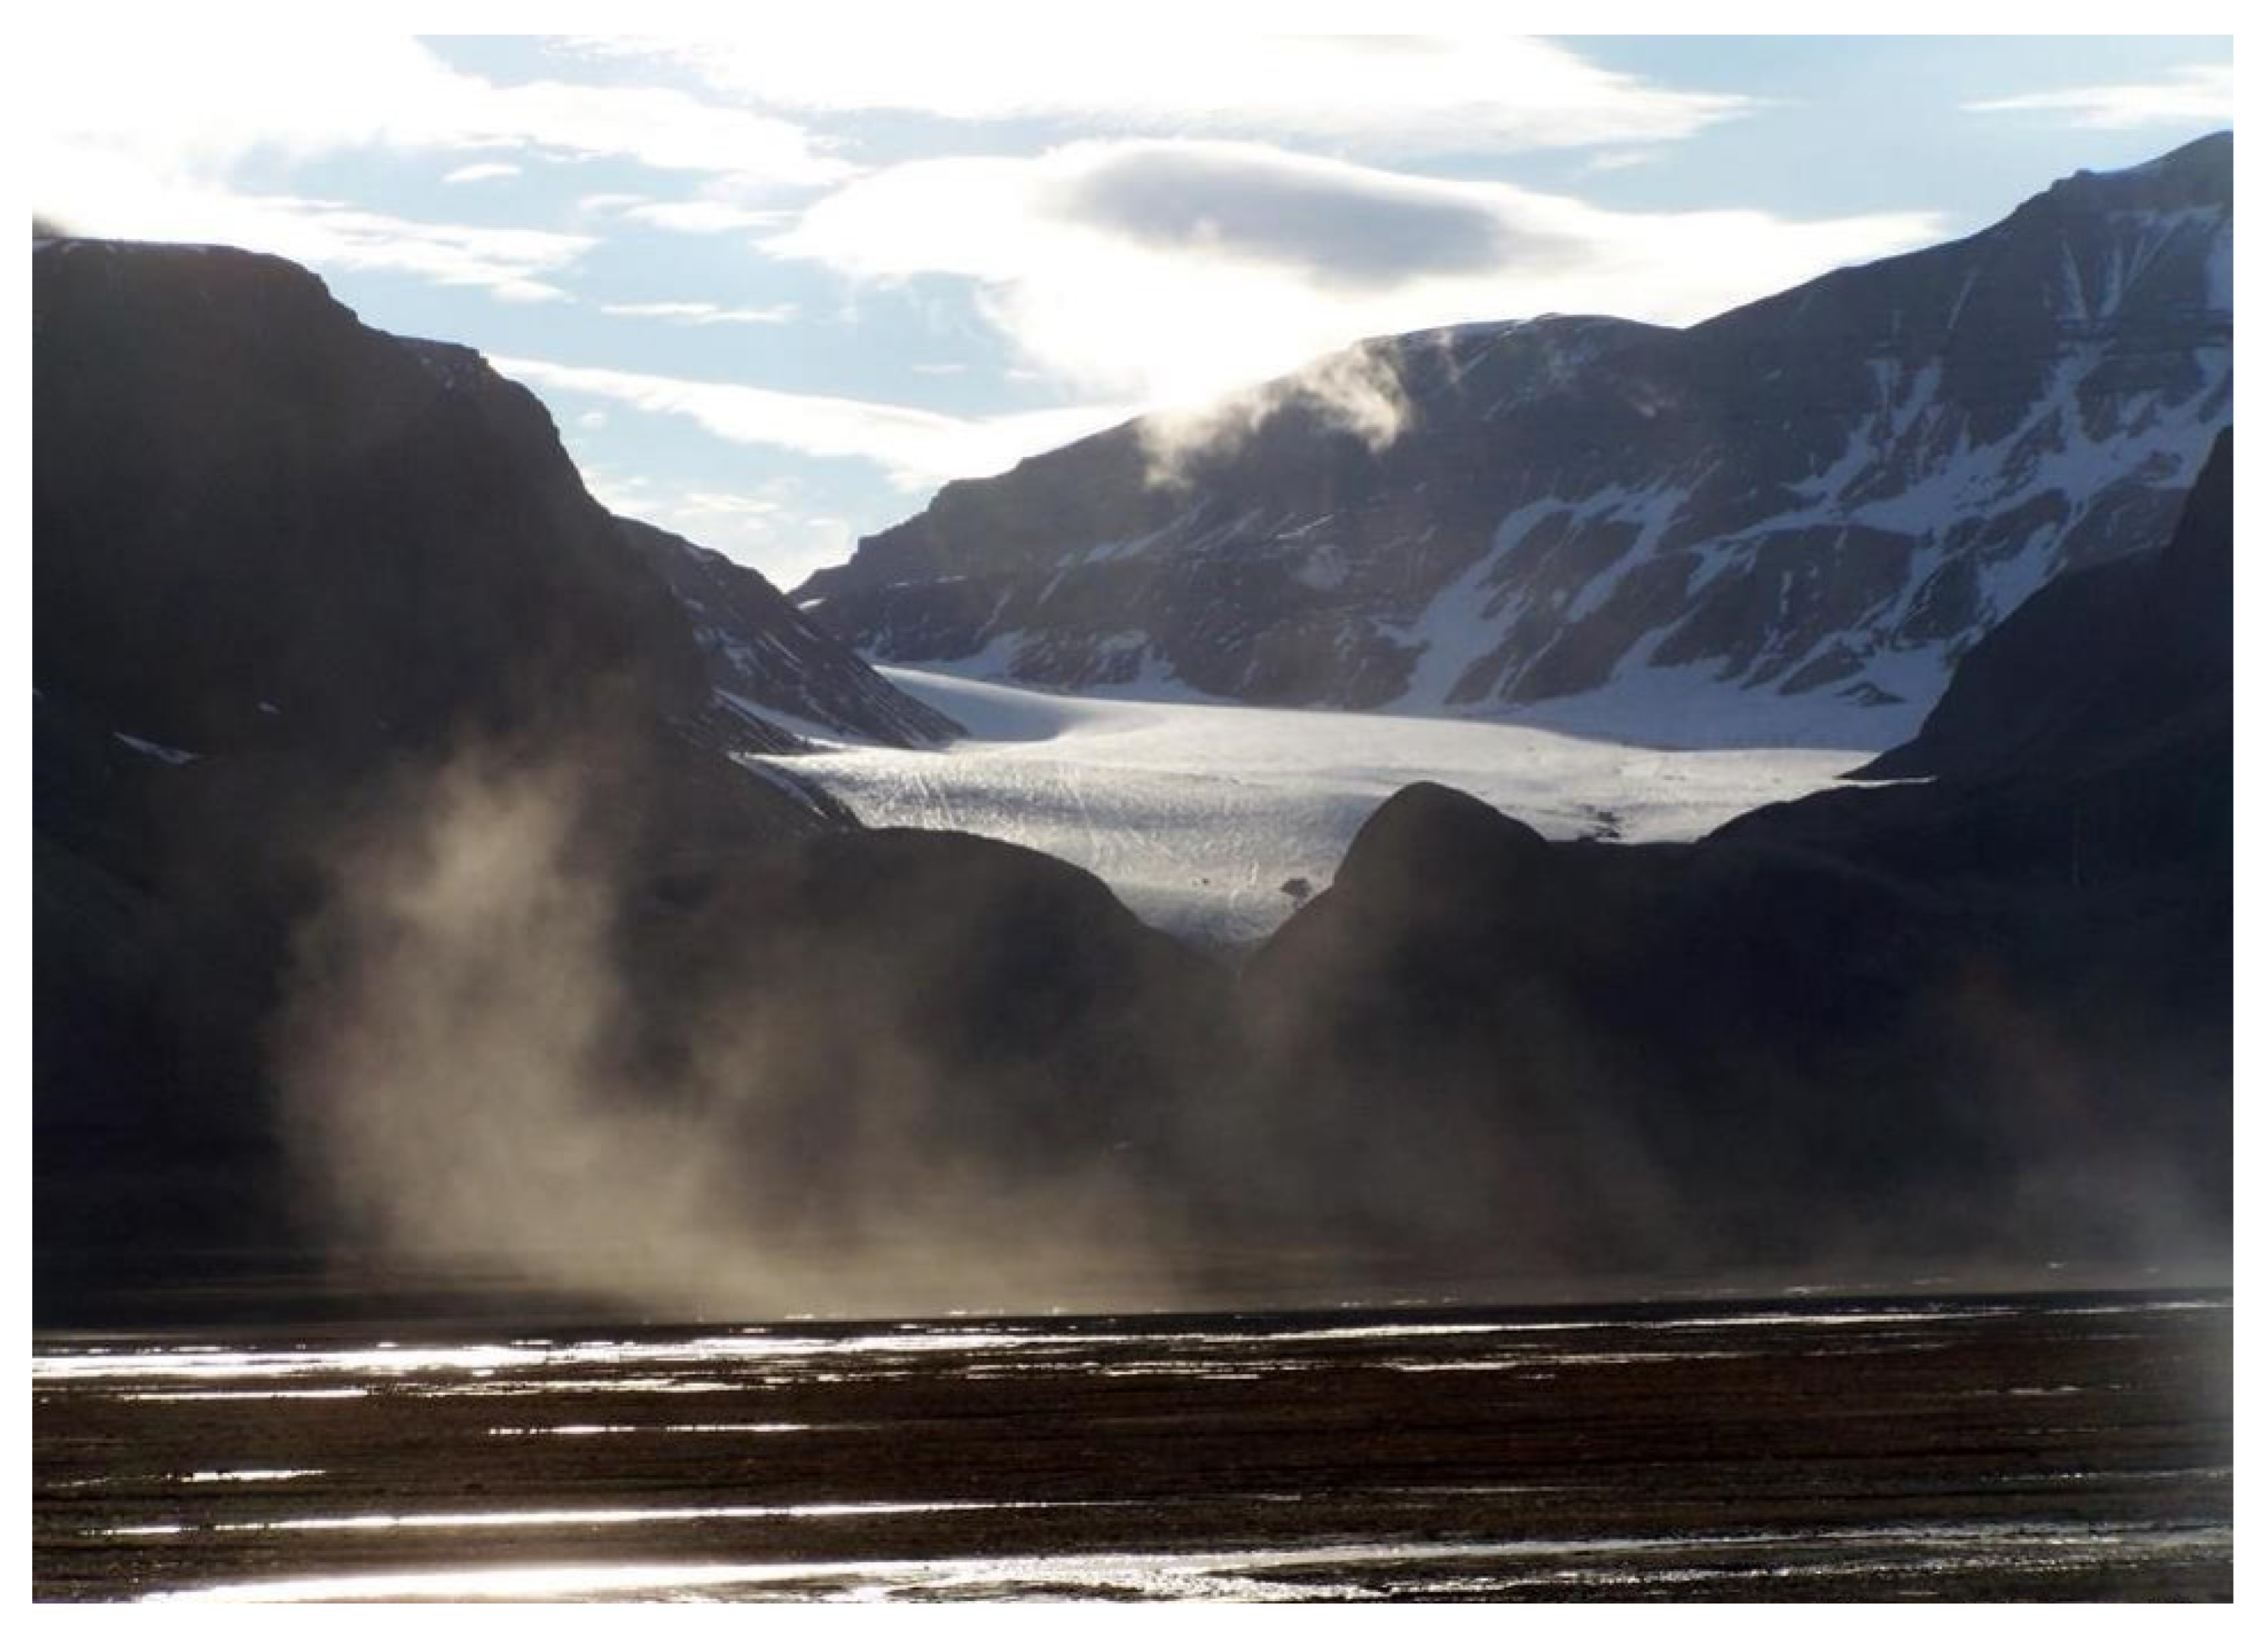
Figure 8.
Sentinel satellite images illustrating retreat of snow cover on both study locations several weeks before the sampling has been made.
Figure 8.
Sentinel satellite images illustrating retreat of snow cover on both study locations several weeks before the sampling has been made.

Table 1.
Sampling sites characteristics.
| Ariekammen | ||||||
|---|---|---|---|---|---|---|
| date | 26 June 2019 | |||||
| Sample ID | latitude | longitude | altitude (m a.s.l.) | snow density (g cm−3) | melted water volume (l) | sediment concentration (g m−2) * |
| Arie 1 | 77° 00.815′ | 15° 30.984′ | 346 | 0.49 | 0.75 | 0.70 |
| Arie 2 | 77° 00.757′ | 15° 31.001′ | 302 | 0.44 | 0.67 | 0.49 |
| Arie 3 | 77° 00.710′ | 15° 31.140′ | 250 | 0.49 | 0.76 | 0.91 |
| Arie 4 | 77° 00.667′ | 15° 31.247′ | 195 | 0.53 | 0.81 | 3.42 |
| Arie 5 | 77° 00.632′ | 15° 31.274′ | 147 | 0.54 | 0.83 | 4.43 |
| Arie 6 | 77° 00.600′ | 15° 31.319′ | 114 | 0.58 | 0.89 | 6.14 |
| Arie 7 | 77° 00.508′ | 15° 31.519′ | 48 | 0.59 | 0.91 | 10.39 |
| Pyramiden | ||||||
| date | 4 July 2019 | |||||
| Sample ID | latitude | longitude | altitude (m a.s.l.) | snow density (g cm−3) | melted water volume (l) | sediment concentration (g m−2) * |
| Pyr 1 | 78° 41.101′ | 16° 22.989′ | 538 | 0.53 | 0.82 | 3.30 |
| Pyr 2 | 78° 41.077′ | 16° 23.462′ | 468 | 0.53 | 0.82 | 3.81 |
| Pyr 3 | 78° 41.051′ | 16° 23.820′ | 402 | 0.50 | 0.77 | 2.66 |
| Pyr 4 | 78° 41.015′ | 16° 24.170′ | 336 | 0.57 | 0.87 | 2.77 |
| Pyr 5 | 78° 40.989′ | 16° 24.481′ | 283 | 0.53 | 0.81 | 13.14 |
| Pyr 6 | 78° 40.934′ | 16° 25.405′ | 141 | 0.45 | 0.70 | 14.92 |
| Pyr 7 | 78° 41.074′ | 16° 27.145′ | 12 | 0.54 | 0.83 | 24.56 |
* the sediment deposition uncertainty arising from the drying process varies between 0.12 and 1.13% in the case of Pyramiden samples and between 0.19–4.15% in the case of Ariekammen.
Table 2.
Meteorological parameters measured in Hornsund and Pyramiden sampling sites.
| Hornsund | ||
|---|---|---|
| location | N 77.00035° E 15.53674° | |
| altitude | 10 m a.s.l. | |
| variable | sensor | height/depth |
| air temperature | HMP155 | 2 m a.g.l. |
| ground temperature | PT100/8 | −0.2 m |
| relative humidity | HMP155 | 2 m a.g.l. |
| wind speed | Vaisala WMT702 | 10 m a.g.l. |
| wind direction | Vaisala WMT702 | 10 m a.g.l. |
| cloud base height | manual observation | |
| Pyramiden-terrace station | ||
| location | N 78.71060° E 16.46059° | |
| altitude | 14 m a.s.l. | |
| variable | sensor | height/depth |
| air temperature | EMS33H | 2 m a.g.l. |
| ground temperature | PT100/8 | −0.2 m |
| relative humidity | EMS33H | 2 m a.g.l. |
| wind speed | MetOne 034B | 6 m a.g.l. |
| wind direction | MetOne 034B | 6 m a.g.l. |
| Pyramiden-Mumien station | ||
| location | N 78.70021° E 16.31638° | |
| altitude | 764 m a.s.l. | |
| variable | sensor | height/depth |
| air temperature | EMS33H | 2 m a.g.l. |
| ground temperature | ||
| relative humidity | EMS33H | 2 m a.g.l. |
| wind speed | MetOne 034B | 3 m a.g.l. |
| wind direction | MetOne 034B | 3 m a.g.l. |
Table 3.
Elemental composition of the sediment samples (in ppm) from Ariekammen and Pyramiden sampling sites; accompanied with Si/Cl ratio.
Table 3.
Elemental composition of the sediment samples (in ppm) from Ariekammen and Pyramiden sampling sites; accompanied with Si/Cl ratio.
| Sample ID. | Altitude | Si | Ca | Fe | Sr | Zr | Cl | Si/Cl |
|---|---|---|---|---|---|---|---|---|
| Arie 1 | 346 | 35,527.45 | 17,535.63 | 5591.19 | 11.46 | 13.40 | 87,185.83 | 0.41 |
| Arie 2 | 302 | 25,206.99 | 14,504.48 | 1524.64 | 7.99 | 10.48 | 120,173.77 | 0.21 |
| Arie 3 | 250 | 31,735.19 | 16,000.67 | 3347.44 | 7.49 | 13.33 | 109,335.93 | 0.29 |
| Arie 4 | 195 | 40,261.13 | 18,762.51 | 6818.82 | 17.02 | 12.53 | 75,324.28 | 0.53 |
| Arie 5 | 147 | 27,658.96 | 15,577.55 | 140.73 | 5.94 | 9.66 | 120,469.78 | 0.23 |
| Arie 6 | 114 | 43,909.46 | 16,342.59 | 1084.03 | 6.74 | 10.28 | 112,958.65 | 0.39 |
| Arie 7 | 48 | 33,987.21 | 17,620.37 | 5719.63 | 11.21 | 14.11 | 123,931.74 | 0.27 |
| sample ID | altitude | Si | Ca | Fe | Sr | Zr | Cl | Si/Cl |
| Pyr 1 | 538 | 83,923.06 | 44,008.52 | 15,012.82 | 14.38 | 25.16 | 65,231.74 | 1.29 |
| Pyr 2 | 468 | 131,277.49 | 49,174.46 | 25,515.10 | 21.63 | 40.22 | 33,653.26 | 3.90 |
| Pyr 3 | 402 | 118,449.13 | 38,302.62 | 22,119.44 | 20.97 | 47.92 | 47,749.67 | 2.48 |
| Pyr 4 | 336 | 76,141.49 | 39,493.15 | 13,722.49 | 15.83 | 28.83 | 70,748.88 | 1.08 |
| Pyr 5 | 283 | 120,432.14 | 54,083.85 | 21,212.57 | 17.36 | 51.43 | 35,132.70 | 3.43 |
| Pyr 6 | 141 | 92,032.48 | 117,957.89 | 43,413.83 | 61.53 | 168.94 | ||
| Pyr 7 | 12 | 62,264.92 | 78,181.74 | 36,727.99 | 68.53 | 158.69 | 8103.41 | 7.68 |
Publisher’s Note: MDPI stays neutral with regard to jurisdictional claims in published maps and institutional affiliations. |
© 2020 by the authors. Licensee MDPI, Basel, Switzerland. This article is an open access article distributed under the terms and conditions of the Creative Commons Attribution (CC BY) license (http://creativecommons.org/licenses/by/4.0/).
Share and Cite
MDPI and ACS Style
Kavan, J.; Láska, K.; Nawrot, A.; Wawrzyniak, T. High Latitude Dust Transport Altitude Pattern Revealed from Deposition on Snow, Svalbard. Atmosphere 2020, 11, 1318. https://doi.org/10.3390/atmos11121318
AMA Style
Kavan J, Láska K, Nawrot A, Wawrzyniak T. High Latitude Dust Transport Altitude Pattern Revealed from Deposition on Snow, Svalbard. Atmosphere. 2020; 11(12):1318. https://doi.org/10.3390/atmos11121318
Chicago/Turabian StyleKavan, Jan, Kamil Láska, Adam Nawrot, and Tomasz Wawrzyniak. 2020. "High Latitude Dust Transport Altitude Pattern Revealed from Deposition on Snow, Svalbard" Atmosphere 11, no. 12: 1318. https://doi.org/10.3390/atmos11121318
Note that from the first issue of 2016, this journal uses article numbers instead of page numbers. See further details here.