Multiyear Typology of Long-Range Transported Aerosols over Europe

 ,
,  and
and 
Abstract
:1. Introduction
2. Data and Methodology
2.1. Observational Data
2.2. Neural Network Aerosol Typing Algorithm Based on Lidar Data: NATALI Software
2.3. Clusterization Based on Typical Atmospheric Circulation
3. Results
3.1. Optical Characteristics of Aerosols over Europe
3.2. Aerosol Types over Europe
4. Conclusions
Supplementary Materials
Author Contributions
Funding
Acknowledgments
Conflicts of Interest
References
- Wang, H.; Xie, X.; Liu, X. On the Robustness of the Weakening Effect of Anthropogenic Aerosols on the East Asian Summer Monsoon with Multimodel Results. Adv. Meteorol. 2015, 2015, 397395. [Google Scholar] [CrossRef]
- Farahat, A. Comparative analysis of MODIS, MISR, and AERONET climatology over the Middle East and North Africa. Ann. Geophys. 2019, 37, 49–64. [Google Scholar] [CrossRef] [Green Version]
- Siomos, N.; Balis, D.S.; Voudouri, K.A.; Giannakaki, E.; Filioglou, M.; Amiridis, V.; Papayannis, A.; Fragkos, K. Are EARLINET and AERONET climatologies consistent? The case of Thessaloniki, Greece. Atmos. Chem. Phys. 2018, 18, 11885–11903. [Google Scholar] [CrossRef] [Green Version]
- Georgoulias, A.K.; Alexandri, G.; Kourtidis, K.A.; Lelieveld, J.; Zanis, P.; Pöschl, U.; Levy, R.; Amiridis, V.; Marinou, E.; Tsikerdekis, A. Spatiotemporal variability and contribution of different aerosol types to the aerosol optical depth over the Eastern Mediterranean. Atmos. Chem. Phys. 2016, 16, 13853–13884. [Google Scholar] [CrossRef] [PubMed] [Green Version]
- Wandinger, U.; Freudenthaler, V.; Baars, H.; Amodeo, A.; Engelmann, R.; Mattis, I.; Groß, S.; Pappalardo, G.; Giunta, A.; D’Amico, G.; et al. EARLINET instrument intercomparison campaigns: Overview on strategy and results. Atmos. Meas. Tech. 2016, 9, 1001–1023. [Google Scholar] [CrossRef]
- Pappalardo, G.; Amodeo, A.; Apituley, A.; Comeron, A.; Freudenthaler, V.; Linné, H.; Ansmann, A.; Bösenberg, J.; D’Amico, G.; Mattis, I.; et al. EARLINET: Towards an advanced sustainable European aerosol lidar network. Atmos. Meas. Tech. 2014, 7, 2389–2409. [Google Scholar] [CrossRef]
- Burton, S.P.; Ferrare, R.A.; Vaughan, M.A.; Omar, A.H.; Rogers, R.R.; Hostetler, C.A.; Hair, J.W. Aerosol classification from airborne HSRL and comparisons with the CALIPSO vertical feature mask. Atmos. Meas. Tech. 2013, 6, 1397–1412. [Google Scholar] [CrossRef] [Green Version]
- Groß, S.; Esselborn, M.; Weinzierl, B.; Wirth, M.; Fix, A.; Petzold, A. Aerosol classification by airborne high spectral resolution lidar observations. Atmos. Chem. Phys. 2013, 13, 2487–2505. [Google Scholar] [CrossRef] [Green Version]
- Papagiannopoulos, N.; Mona, L.; Amodeo, A.; D’Amico, G.; Gumà Claramunt, P.; Pappalardo, G.; Alados-Arboledas, L.; Guerrero-Rascado, J.L.; Amiridis, V.; Kokkalis, P.; et al. An automatic observation-based aerosol typing method for EARLINET. Atmos. Chem. Phys. 2018, 18, 15879–15901. [Google Scholar] [CrossRef] [Green Version]
- Wandinger, U.; Baars, H.; Engelmann, R.; Hünerbein, A.; Horn, S.; Kanitz, T.; Donovan, D.; van Zadelhoff, G.-J.; Daou, D.; Fischer, J.; et al. HETEAC: The Aerosol Classification Model for EarthCARE. EPJ Web Conf. 2016, 119, 01004. [Google Scholar] [CrossRef] [Green Version]
- Holben, B.N.; Eck, T.F.; Slutsker, I.; Tanre, D.; Buis, J.P.; Setzer, A.; Vermote, E.; Reagan, J.A.; Kaufman, Y.; Nakajima, T.; et al. AERONET—A federated instrument network and data archive for aerosol characterization. Remote Sens. Environ. 1998, 66, 1–16. [Google Scholar] [CrossRef]
- Giles, D.M.; Sinyuk, A.; Sorokin, M.G.; Schafer, J.S.; Smirnov, A.; Slutsker, I.; Eck, T.F.; Holben, B.N.; Lewis, J.R.; Campbell, J.R.; et al. Advancements in the Aerosol Robotic Network (AERONET) Version 3 database – automated near-real-time quality control algorithm with improved cloud screening for Sun photometer aerosol optical depth (AOD) measurements. Atmos. Meas. Tech. 2019, 12, 169–209. [Google Scholar] [CrossRef]
- Giles, D.M.; Holben, B.N.; Eck, T.F.; Sinyuk, A.; Smirnov, A.; Slutsker, I.; Dickerson, R.; Thompson, A.; Schafer, J. An analysis of AERONET aerosol absorption properties and classifications representative of aerosol source regions. J. Geophys. Res. Atmos. 2012. [Google Scholar] [CrossRef]
- Shin, S.-K.; Tesche, M.; Noh, Y.; Müller, D. Aerosol-type classification based on AERONET version 3 inversion products. Atmos. Meas. Tech. Discuss. 2019, 12, 3789–3803. [Google Scholar] [CrossRef] [Green Version]
- Tan, F.; Lim, H.S.; Abdullah, K.; Yoon, T.L.; Holben, B. AERONET data–based determination of aerosol types. Atmos. Pollut. Res. 2015, 6, 682–695. [Google Scholar] [CrossRef]
- Russell, P.B.; Bergstrom, R.W.; Shinozuka, Y.; Clarke, A.D.; DeCarlo, P.F.; Jimenez, J.L.; Livingston, J.M.; Redemann, J.; Dubovik, O.; Strawa, A. Absorption Angstrom Exponent in AERONET and related data as an indicator of aerosol composition. Atmos. Chem. Phys. 2010, 10, 1155–1169. [Google Scholar] [CrossRef] [Green Version]
- Eck, T.F.; Holben, B.N.; Reid, J.S.; Sinyuk, A.; Hyer, E.J.; O’Neill, N.T.; Shaw, G.E.; Vande Castle, J.R.; Chapin, F.S.; Dubovik, O.; et al. Optical properties of boreal region biomass burning aerosols in central Alaska and seasonal variation of aerosol optical depth at an Arctic coastal site. J. Geophys. Res. 2009, 114, D11201. [Google Scholar] [CrossRef]
- Nemuc, A.; Vasilescu, J.; Talianu, C.; Belegante, L.; Nicolae, D. Assessment of aerosol’s mass concentrations from measured linear particle depolarization ratio (vertically resolved) and simulations. Atmos. Meas. Tech. 2013, 6, 3243–3255. [Google Scholar] [CrossRef]
- Groß, S.; Freudenthaler, V.; Wirth, M.; Weinzierl, B. Towards an aerosol classification scheme for future EarthCARE lidar observations and implications for research needs. Atmos. Sci. Lett. 2015, 16, 77–82. [Google Scholar] [CrossRef]
- Nicolae, D.; Vasilescu, J.; Talianu, C.; Binietoglou, I.; Nicolae, V.; Andrei, S.; Antonescu, B. A neural network aerosol-typing algorithm based on lidar data. Atmos. Chem. Phys. 2018, 18, 14511–14537. [Google Scholar] [CrossRef] [Green Version]
- Mamun, M.M.; Müller, D. Retrieval of Intensive Aerosol Microphysical Parameters from Multiwavelength Raman/HSRL Lidar: Feasibility Study with Artificial Neural Networks. Atmos. Meas. Tech. Discuss. 2016. [Google Scholar] [CrossRef]
- Lanzaco, B.L.; Olcese, L.E.; Palancar, G.G.; Toselli, B.M. An Improved Aerosol Optical Depth Map Based on Machine-Learning and MODIS Data: Development and Application in South America. Aerosol. Air. Qual. Res. 2017, 17, 1623–1636. [Google Scholar] [CrossRef] [Green Version]
- Gangwar, R.K.; Mathur, A.K.; Gohil, B.S.; Basu, S. Neural Network Based Retrieval of Atmospheric Temperature Profile Using AMSU-A Observations. Int. J. Atmos. Sci. 2014, 2014, 763060. [Google Scholar] [CrossRef]
- EARLINET. EARLINET Data Portal. Available online: https://data.earlinet.org/earlinet/login.zul;jsessionid=AA323AC6D1261F5B01BF3203A131CA84 (accessed on 1 April 2019).
- AERONET. Available online: https://aeronet.gsfc.nasa.gov/cgi-bin/draw_map_display_aod_v3 (accessed on 1 April 2019).
- Ansmann, A.; Riebesell, M.; Wandinger, U.; Weitkamp, C.; Voss, E.; Lahmann, W.; Michaelis, W. Combined raman elastic-backscatter LIDAR for vertical profiling of moisture, aerosol extinction, backscatter, and LIDAR ratio. Appl. Phys. B 1992, 55, 18–28. [Google Scholar] [CrossRef]
- Fernald, F.G. Analysis of atmospheric lidar observations: Some comments. Appl. Opt. 1984, 23, 652–653. [Google Scholar] [CrossRef] [PubMed]
- Klett, J.D. Stable analytical inversion solution for processing lidar returns. Appl. Opt. 1981, 20, 211–220. [Google Scholar] [CrossRef] [Green Version]
- Freudenthaler, V. About the effects of polarising optics on lidar signals and the Δ90 calibration. Atmos. Meas. Tech. 2016, 9, 4181–4255. [Google Scholar] [CrossRef]
- Belegante, L.; Bravo-Aranda, J.A.; Freudenthaler, V.; Nicolae, D.; Nemuc, A.; Ene, D.; Alados-Arboledas, L.; Amodeo, A.; Pappalardo, G.; D’Amico, G.; et al. Experimental techniques for the calibration of lidar depolarization channels in EARLINET. Atmos. Meas. Tech. 2018, 11, 1119–1141. [Google Scholar] [CrossRef] [Green Version]
- D’Amico, G.; Amodeo, A.; Baars, H.; Binietoglou, I.; Freudenthaler, V.; Mattis, I.; Wandinger, U.; Pappalardo, G. EARLINET Single Calculus Chain—Overview on methodology and strategy. Atmos. Meas. Tech. 2015, 8, 4891–4916. [Google Scholar]
- Dubovik, O.; King, M.D. A flexible inversion algorithm for retrieval of aerosol optical properties from Sun and sky radiance measurements. J. Geophys. Res. 2000, 105, 20673–20696. [Google Scholar] [CrossRef] [Green Version]
- Dubovik, O.; Holben, B.N.; Eck, T.F.; Smirnov, A.; Kaufman, Y.J.; King, M.D.; Tanre, D.; Slutsker, I. Variability of absorption and optical properties of key aerosol types observed in worldwide locations. J. Atmos. Sci. 2002, 59, 590–608. [Google Scholar] [CrossRef]
- Soni, K.; Singh, S.; Bano, T.; Tanwar, R.S.; Nath, S. Wavelength Dependence of the Aerosol Angstrom Exponent and Its Implications Over Delhi, India. Aerosol. Sci. Tech. 2011, 45, 1488–1498. [Google Scholar] [CrossRef]
- Belegante, L.; Nicolae, D.; Nemuc, A.; Talianu, C.; Derognat, C. Retrieval of the boundary layer height from active and passive remote sensors. Comparison with a NWP model. Acta Geophys. 2014, 62, 276–289. [Google Scholar] [CrossRef]
- Beck, C.; Jacobeit, J.; Jones, P.D. Frequency and within-type variations of large-scale circulation types and their effects on low-frequency climate variability in Central Europe since 1780. Int. J. Climatol. 2007, 27, 473–491. [Google Scholar] [CrossRef]
- Tveito, O.E.; Huth, R. Circulation-type classifications in Europe: Results of the COST 733 Action. Int. J. Climatol. 2016, 36, 2671–2672. [Google Scholar] [CrossRef]
- Philipp, A.; Beck, C.; Huth, R.; Jacobeit, J. Development and comparison of circulation type classifications using the COST 733 dataset and software. Int. J. Climatol. 2016, 36, 2673–2691. [Google Scholar] [CrossRef]
- Dee, D.P.; Uppala, S.M.; Simmons, A.J.; Berrisford, P.; Poli, P.; Kobayashi, S.; Andrae, U.; Balmaseda, M.A.; Balsamo, G.; Bauer, P.; et al. The ERA-Interim reanalysis: Configuration and performance of the data assimilation system. Q. J. Roy. Meteor. Soc. 2011, 137, 553–597. [Google Scholar] [CrossRef]
- Muller, D.; Mattis, I.; Ansmann, A.; Wandinger, U.; Ritter, C.; Kaiser, D. Multiwavelength Raman lidar observations of particle growth during long-range transport of forest-fire smoke in the free troposphere. Geophys. Res. Lett. 2007, 34, L05803. [Google Scholar] [CrossRef]
- Schuster, G.L.; Dubovik, O.; Holben, B.N. Angstrom exponent and bimodal aerosol size distributions. J. Geophys. Res. 2006, 111, D07207. [Google Scholar] [CrossRef]
- Cao, N.; Yang, S.; Cao, S.; Yang, S.; Shen, J. Accuracy calculation for lidar ratio and aerosol size distribution by dual-wavelength lidar. Appl. Phys. A 2019, 125, 590. [Google Scholar] [CrossRef]
- Chubarova, N.Y.; Poliukhov, A.A.; Gorlova, I.D. Long-term variability of aerosol optical thickness in Eastern Europe over 2001–2014 according to the measurements at the Moscow MSU MO AERONET site with additional cloud and NO2 correction. Atmos. Meas. Tech. 2016, 9, 313–334. [Google Scholar] [CrossRef]
- Nicolae, D.; Nemuc, A.; Müller, D.; Talianu, C.; Vasilescu, J.; Belegante, L.; Kolgotin, A. Characterization of fresh and aged biomass burning events using multiwavelength Raman lidar and mass spectrometry. J. Geophys. Res. 2013, 118, 2956–2965. [Google Scholar] [CrossRef]
- Galytska, E.; Danylevsky, V.; Hommel, R.; Burrows, J.P. Increased aerosol content in the atmosphere over Ukraine during summer 2010. Atmos. Meas. Tech. 2018, 11, 2101–2118. [Google Scholar] [CrossRef] [Green Version]
- Cachorro, V.E.; Toledano, C.; Prats, N.; Sorribas, M.; Mogo, S.; Berjón, A.; Torres, B.; Rodrigo, R.; de la Rosa, J.; DeFrutos, A.M. The strongest desert dust intrusion mixed with smoke over the Iberian Peninsula registered with Sun photometry. J. Geophys. Res. 2008, 113, D14S04. [Google Scholar] [CrossRef]
- Ortiz-Amezcua, P.; Guerrero-Rascado, J.L.; Granados-Muñoz, M.J.; Benavent-Oltra, J.A.; Böckmann, C.; Samaras, S.; Stachlewska, I.S.; Janicka, Ł.; Baars, H.; Bohlmann, S.; et al. Microphysical characterization of long-range transported biomass burning particles from North America at three EARLINET stations. Atmos. Chem. Phys. 2017, 17, 5931–5946. [Google Scholar] [CrossRef] [Green Version]
- Suchara, I.; Sucharova, J. Distribution of Sulphur and Heavy Metals in Forest Floor Humus of the Czech Republic. Water. Air Soil Pollut. 2002, 136, 289–316. [Google Scholar] [CrossRef]
- Ancellet, G.; Pelon, J.; Totems, J.; Chazette, P.; Bazureau, A.; Sicard, M.; Di Iorio, T.; Dulac, F.; Mallet, M. Long-range transport and mixing of aerosol sources during the 2013 North American biomass burning episode: Analysis of multiple lidar observations in the western Mediterranean basin. Atmos. Chem. Phys. 2016, 16, 4725–4742. [Google Scholar] [CrossRef]
- Chazette, P.; Totems, J.; Ancellet, G.; Pelon, J.; Sicard, M. Temporal consistency of lidar observations during aerosol transport events in the framework of the ChArMEx/ADRIMED campaign at Minorca in June 2013. Atmos. Chem. Phys. 2016, 16, 2863–2875. [Google Scholar] [CrossRef] [Green Version]
- Brocchi, V.; Krysztofiak, G.; Catoire, V.; Guth, J.; Marécal, V.; Zbinden, R.; El Amraoui, L.; Dulac, F.; Ricaud, P. Intercontinental transport of biomass burning pollutants over the Mediterranean Basin during the summer 2014 ChArMEx-GLAM airborne campaign. Atmos. Chem. Phys. 2018, 18, 6887–6906. [Google Scholar] [CrossRef] [Green Version]
- Janika, L.; Stachlewska, I.S.; Veselovskii, I.; Baars, H. Temporal variations in optical and microphysical properties of mineral dust and biomass burning aerosol derived from daytime Raman lidar observations over Warsaw, Poland. Atmos. Environ. 2017, 169, 162–174. [Google Scholar] [CrossRef]
- Janicka, L.; Stachlewska, I.S. Properties of biomass burning aerosol mixtures derived at fine temporal and spatial scales from Raman lidar measurements: Part I optical properties. Atmos. Chem. Phys. Discuss. 2019. in review. [Google Scholar] [CrossRef]
- Martinsson, J.; Monteil, G.; Sporre, M.K.; Kaldal Hansen, A.M.; Kristensson, A.; Eriksson Stenström, K.; Swietlicki, E.; Glasius, M. Exploring sources of biogenic secondary organic aerosol compounds using chemical analysis and the FLEXPART model. Atmos. Chem. Phys. 2017, 17, 11025–11040. [Google Scholar] [CrossRef] [Green Version]
- Vaughan, G.; Draude, A.P.; Ricketts, H.M.A.; Schultz, D.M.; Adam, M.; Sugier, J.; Wareing, D.P. Transport of Canadian forest fire smoke over the UK as observed by lidar. Atmos. Chem. Phys. 2018, 18, 11375–11388. [Google Scholar] [CrossRef] [Green Version]
- Hu, Q.; Goloub, P.; Veselovskii, I.; Bravo-Aranda, J.-A.; Popovici, I.E.; Podvin, T.; Haeffelin, M.; Lopatin, A.; Dubovik, O.; Pietras, C.; et al. Long-range-transported Canadian smoke plumes in the lower stratosphere over northern France. Atmos. Chem. Phys. 2019, 19, 1173–1193. [Google Scholar] [Green Version]
- Talianu, C.; Seibert, P. Analysis of sulfate aerosols over Austria: A case study. Atmos. Chem. Phys. 2019, 19, 6235–6250. [Google Scholar] [CrossRef]
- Vieno, M.; Heal, M.R.; Twigg, M.M.; MacKenzie, I.A.; Braban, C.F.; Lingard, J.J.N.; Ritchie, S.; Beck, R.C.; Moring, A.; Ots, R.; et al. The UK particulate matter air pollution episode of March–April 2014: More than Saharan dust. Environ. Res. Lett. 2016, 11, 044004. [Google Scholar] [CrossRef]
- Nunes, L.; Álvarez-González, J.; Alberdi, I.; Silva, V.; Rocha, V.; Castro Rego, F. Analysis of the occurrence of wildfires in the Iberian Peninsula based on harmonised data from national forest inventories. Ann. For. Sci. 2019, 76, 27. [Google Scholar] [CrossRef] [Green Version]
- Cachorro, V.E.; Burgos, M.A.; Mateos, D.; Toledano, C.; Bennouna, Y.; Torres, B.; de Frutos, Á.M.; Herguedas, Á. Inventory of African desert dust events in the north-central Iberian Peninsula in 2003–2014 based on sun-photometer–AERONET and particulate-mass–EMEP data. Atmos. Chem. Phys. 2016, 16, 8227–8248. [Google Scholar] [CrossRef]
- Granados-Muñoz, M.J.; Navas-Guzmán, F.; Guerrero-Rascado, J.L.; Bravo-Aranda, J.A.; Binietoglou, I.; Pereira, S.N.; Basart, S.; Baldasano, J.M.; Belegante, L.; Chaikovsky, A.; et al. Profiling of aerosol microphysical properties at several EARLINET/AERONET sites during the July 2012 ChArMEx/EMEP campaign. Atmos. Chem. Phys. 2016, 16, 7043–7066. [Google Scholar] [CrossRef] [Green Version]
- Mortier, A.; Goloub, P.; Podvin, T.; Deroo, C.; Chaikovsky, A.; Ajtai, N.; Blarel, L.; Tanre, D.; Derimian, Y. Detection and characterization of volcanic ash plumes over Lille during the Eyjafjallajökull eruption. Atmos. Chem. Phys. 2013, 13, 3705–3720. [Google Scholar] [CrossRef]
- Turco, M.; von Hardenberg, J.; AghaKouchak, A.; Llasat, M.C.; Provenzale, A.; Trigo, R. On the key role of droughts in the dynamics of summer fires in Mediterranean Europe. Sci. Rep. 2017, 7, 81. [Google Scholar] [CrossRef] [PubMed]
- Hanel, M.; Rakovec, O.; Markonis, Y.; Máca, P.; Samaniego, L.; Kyselý, J.; Kumar, R. Revisiting the recent European droughts from a long-term perspective. Sci. Rep. 2018, 8, 9499. [Google Scholar] [CrossRef] [PubMed]
- Russo, S.; Sillmann, J.; Fischer, E. Top ten European heatwaves since 1950 and their occurrence in the coming decades. Environ. Res. Lett. 2015, 10, 124003. [Google Scholar] [CrossRef]
- Ionita, M.; Tallaksen, L.M.; Kingston, D.G.; Stagge, J.H.; Laaha, G.; van Lanen, H.A.J.; Scholz, P.; Chelcea, S.M.; Haslinger, K. The European 2015 drought from a climatological perspective. Hydrol. Earth Syst. Sci. 2017, 21, 1397–1419. [Google Scholar] [CrossRef] [Green Version]
- DIRECTIVE (EU) 2016/2284 OF THE EUROPEAN PARLIAMENT AND OF THE COUNCIL on the reduction of national emissions of certain atmospheric pollutants, amending Directive 2003/35/EC and repealing Directive 2001/81/EC. Available online: https://eur-lex.europa.eu/legal-content/EN/ALL/?uri=CELEX%3A32016L2284 (accessed on 9 August 2019).
- DIRECTIVE (EU) 2015/2193 OF THE EUROPEAN PARLIAMENT AND OF THE COUNCIL on the limitation of emissions of certain pollutants into the air from medium combustion plants. Available online: https://eur-lex.europa.eu/legal-content/EN/TXT/?uri=CELEX%3A32015L2193 (accessed on 9 August 2019).
- Provençal, S.; Pavel Kishcha, P.; da Silva, A.M.; Elhacham, E.; Alpert, P. AOD distributions and trends of major aerosol species over a selection of the world’s most populated cities based on the 1st Version of NASA’s MERRA Aerosol Reanalysis. Urban. Clim. 2017, 20, 168–191. [Google Scholar] [CrossRef]
- Markowicz, K.; Pakszys, P.; Ritter, C.; Zielinski, T.; Udisti, R.; Cappelletti, D.; Mazzola, M.; Shiobara, M.; Lynch, P.; Zawadzka, O.; et al. Impact of North American intense fires on aerosol optical properties measured over the European Arctic in July 2015. J. Geophys. Res. Atmos. 2016, 121, 14487–14512. [Google Scholar] [CrossRef]


| Station | Longitude (E) | Latitude (N) | Altitude (m a.s.l.) | Number of Data Points from Photometer (Monthly Means) | Number of Profiles from Lidar | Number of Layers from Lidar | Number of QA Layers from Lidar |
|---|---|---|---|---|---|---|---|
| Athens | 23.78 | 37.96 | 212 | 128 | 63 | 302 | 37 |
| Barcelona | 2.12 | 41.393 | 115 | 132 | 2 | 9 | 2 |
| Bucharest | 26.029 | 44.348 | 93 | 132 | 227 | 880 | 126 |
| Cabaw | 4.93 | 51.97 | 0 | 132 | 37 | 213 | 26 |
| Evora | −7.9115 | 38.5678 | 293 | 132 | 205 | 851 | 101 |
| Granada | −3.605 | 37.164 | 680 | 132 | 120 | 679 | 106 |
| Hohenpeissenberg | 11.0119 | 47.8019 | 974 | 69 | 33 | 157 | 17 |
| Ispra | 8.6167 | 45.8167 | 209 | 132 | 17 | 121 | 10 |
| Kuopio | 27.55 | 62.7333 | 190 | 129 | 84 | 194 | 15 |
| Lecce | 18.1 | 40.333 | 30 | 132 | 16 | 66 | 0 |
| Leipzig | 12.433 | 51.35 | 90 | 132 | 62 | 284 | 62 |
| Maisach | 11.258 | 48.209 | 516 | 132 | 5 | 15 | 4 |
| Melpitz | 12.93 | 51.53 | 84 | 23 | 6 | 18 | 4 |
| Naples | 14.183 | 40.838 | 118 | 33 | 8 | 32 | 5 |
| Potenza | 15.72 | 40.6 | 720 | 132 | 137 | 702 | 153 |
| Thessaloniki | 22.95 | 40.63 | 50 | 132 | 70 | 202 | 111 |
| Warsaw | 20.98 | 52.21 | 112 | 11 | 37 | 232 | 29 |
| Total | 1845 | 1129 | 4957 | 808 |
| Aerosol Type | Source | Particle Characteristics |
|---|---|---|
| Continental | Land surfaces | Medium size, medium spherical, medium absorbing |
| Dust | Desert surfaces | Large, nonspherical, medium absorbing |
| Continental polluted | Industrial sites | Small, spherical, highly absorbing |
| Marine | Sea surface | Large, aspherical, nonabsorbing |
| Smoke | Vegetation fires | Small, spherical, highly absorbing |
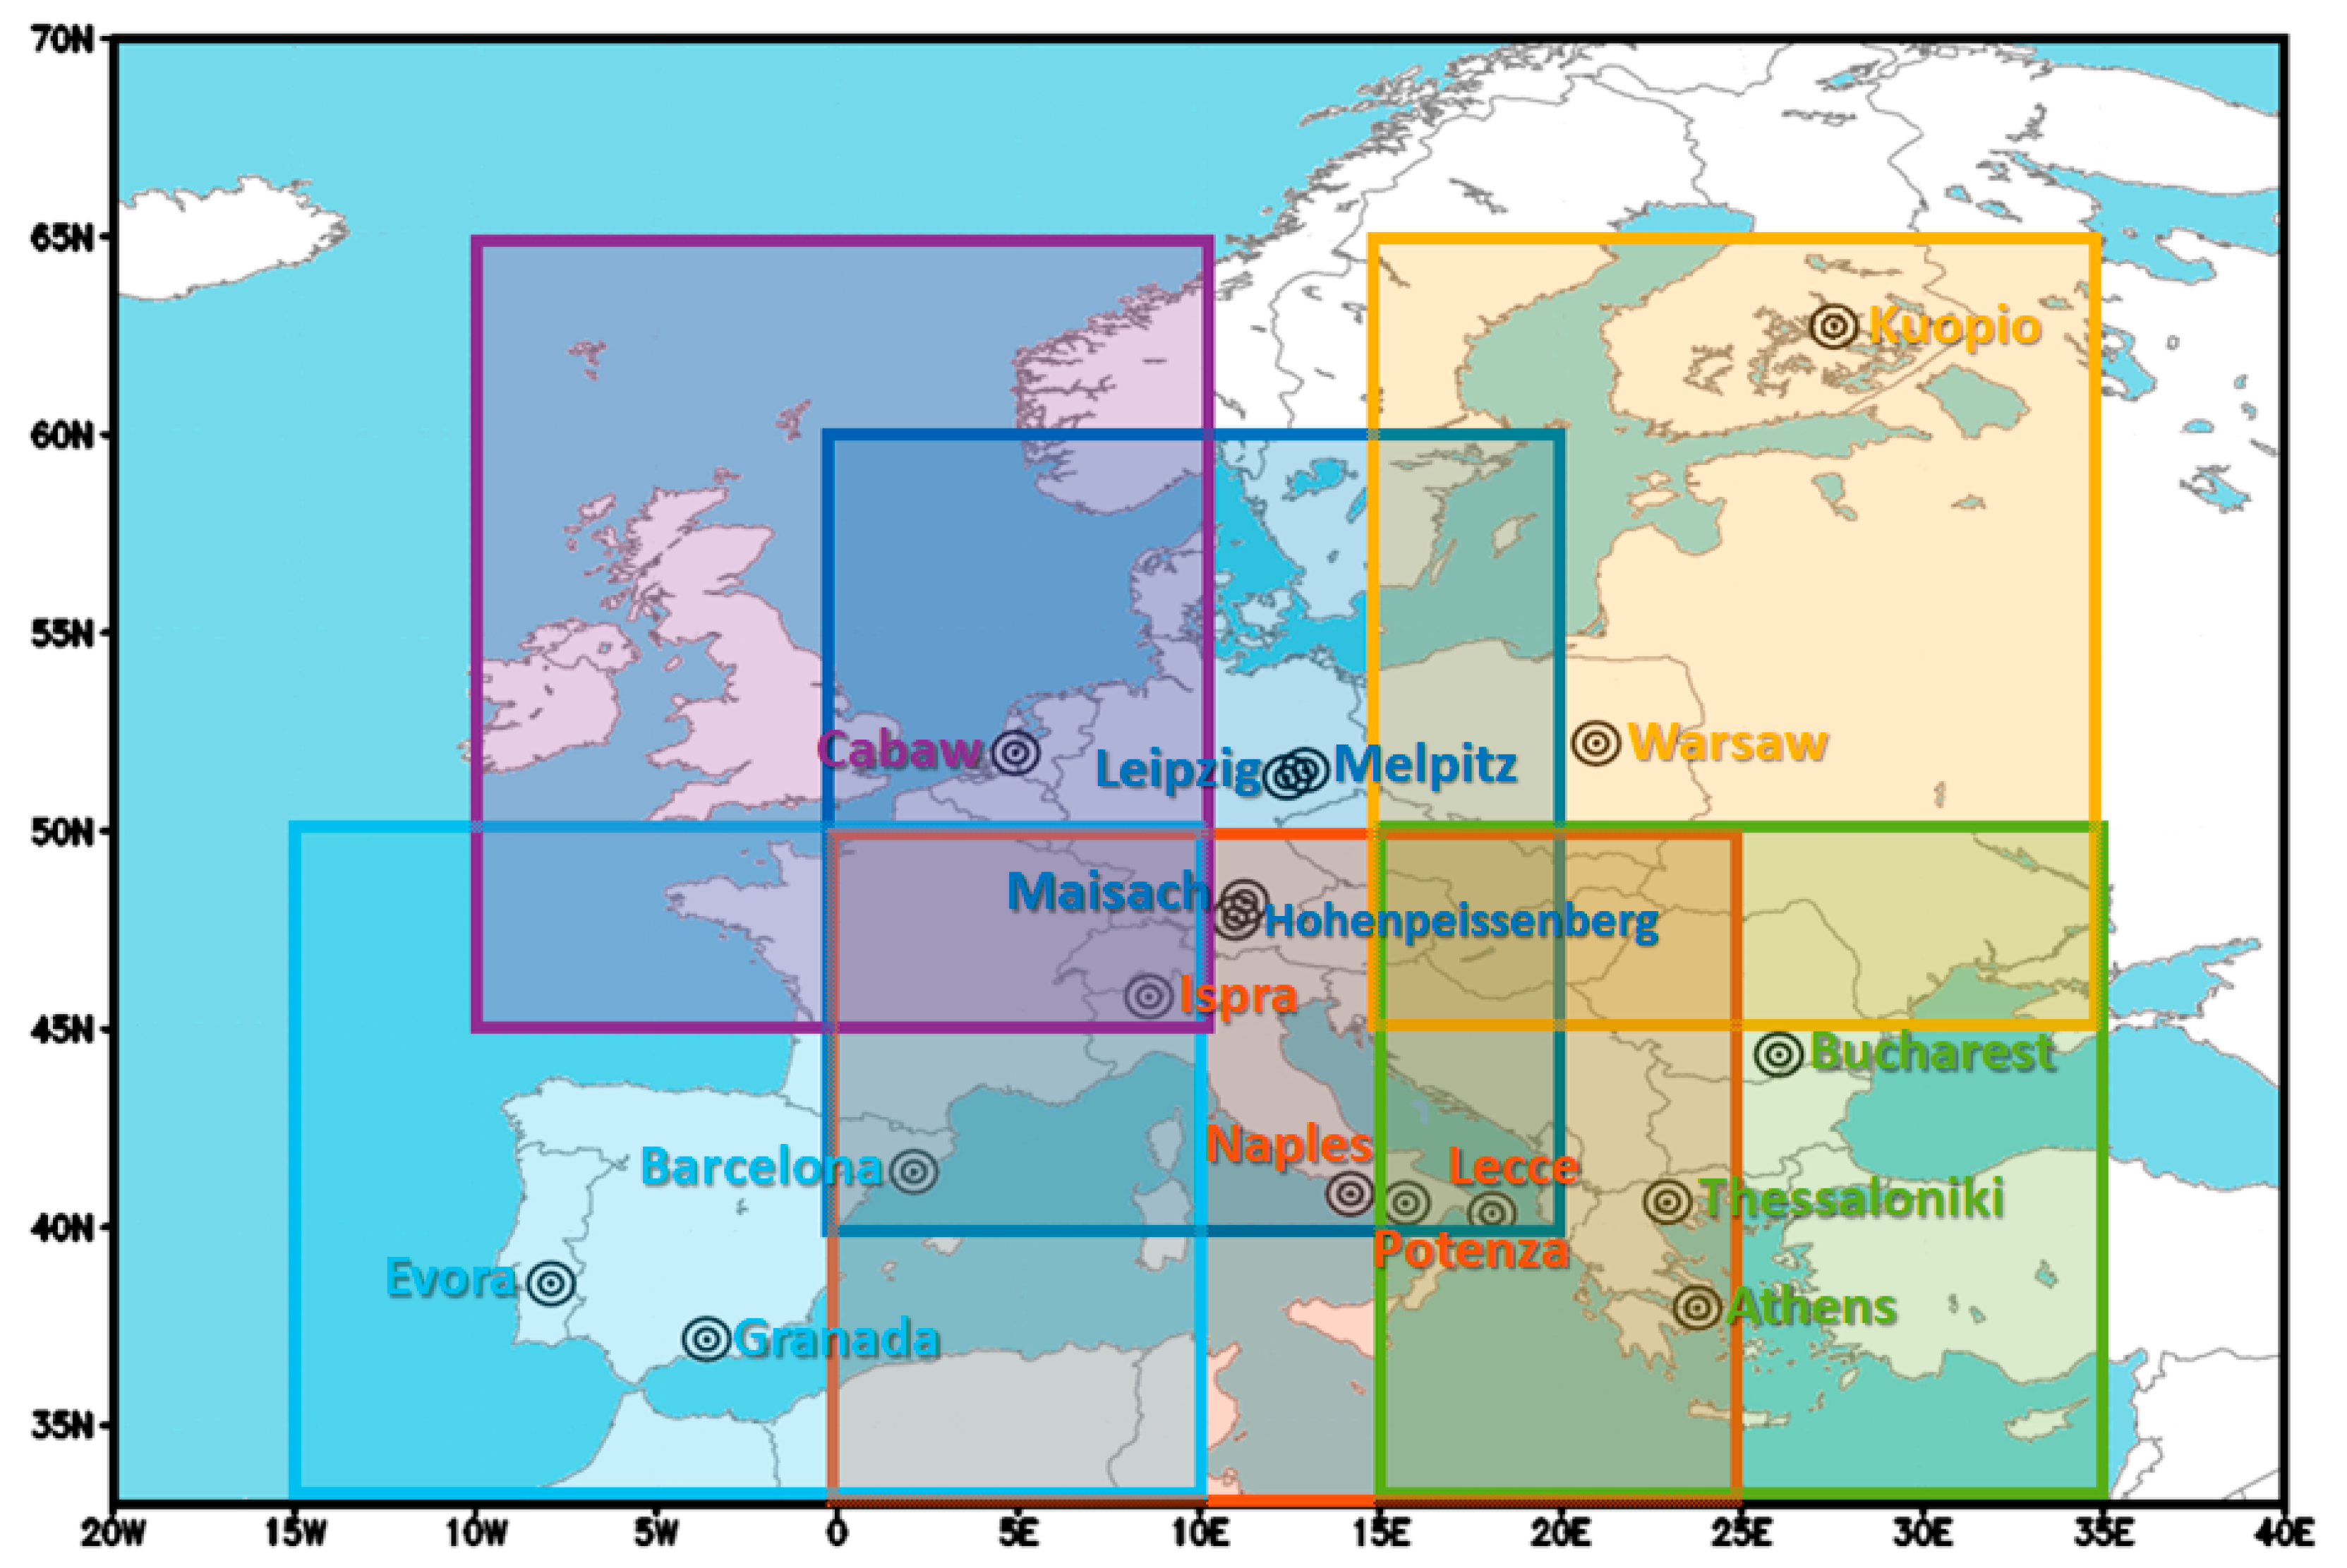
| Cluster | Spatial Extent (lon/lat) | Stations |
|---|---|---|
| Central | 0°–20° E/40°–60° N | Hohenspeissenberg, Leipzig, Maisach, and Melpitz |
| Southeast | 15°–35° E/30°–50° N | Athens, Bucharest, and Thessaloniki |
| Mediterranean | 5°–25° E/30°–50° N | Ispra, Lecce, Naples, and Potenza |
| Southwest | 15° W–10° E/30°–50° N | Barcelona, Evora, and Granada |
| Northwest | 10° W–10° E/45°–65° N | Cabaw |
| Northeast | 15°–35° E/45°–65° N | Kuopio and Warsaw |
| Parameter | Mean Value and Standard Deviation |
|---|---|
| Angstrom exponent (355/532 nm) | 1.18 ± 0.14 |
| Color index (355/532 nm) | 1.31 ± 0.13 |
| Color index (532/1064 nm) | 0.93 ± 0.08 |
| Lidar ratio (355 nm) | 62 ± 3 sr |
| Lidar ratio (532 nm) | 67 ± 4 sr |
© 2019 by the authors. Licensee MDPI, Basel, Switzerland. This article is an open access article distributed under the terms and conditions of the Creative Commons Attribution (CC BY) license (http://creativecommons.org/licenses/by/4.0/).
Share and Cite
Nicolae, V.; Talianu, C.; Andrei, S.; Antonescu, B.; Ene, D.; Nicolae, D.; Dandocsi, A.; Toader, V.-E.; Ștefan, S.; Savu, T.; et al. Multiyear Typology of Long-Range Transported Aerosols over Europe. Atmosphere 2019, 10, 482. https://doi.org/10.3390/atmos10090482
Nicolae V, Talianu C, Andrei S, Antonescu B, Ene D, Nicolae D, Dandocsi A, Toader V-E, Ștefan S, Savu T, et al. Multiyear Typology of Long-Range Transported Aerosols over Europe. Atmosphere. 2019; 10(9):482. https://doi.org/10.3390/atmos10090482
Chicago/Turabian StyleNicolae, Victor, Camelia Talianu, Simona Andrei, Bogdan Antonescu, Dragoș Ene, Doina Nicolae, Alexandru Dandocsi, Victorin-Emilian Toader, Sabina Ștefan, Tom Savu, and et al. 2019. "Multiyear Typology of Long-Range Transported Aerosols over Europe" Atmosphere 10, no. 9: 482. https://doi.org/10.3390/atmos10090482