The 21st Century Coal Question: China, India, Development, and Climate Change


Department of Marine Sciences, Texas A&M University Galveston Campus, Galveston, TX 77554, USA
*
Author to whom correspondence should be addressed.
Atmosphere 2019, 10(8), 476; https://doi.org/10.3390/atmos10080476
Submission received: 11 July 2019
/
Revised: 13 August 2019
/
Accepted: 16 August 2019
/
Published: 20 August 2019
(This article belongs to the Special Issue Household Cooking and Space Heating: Effects on Air Pollution, Climate Change, and Human Health)
Abstract
:China and India are not only the two most populous nations on Earth, they are also two of the most rapidly growing economies. Historically, economic and social development have been subsidized by cheap and abundant fossil-fuels. Climate change from fossil-fuel emissions has resulted in the need to reduce fossil-fuel emissions in order to avoid catastrophic warming. If climate goals are achieved, China and India will have been the first major economies to develop via renewable energy sources. In this article, we examine the factors of projected population growth, available fossil-fuel reserves, and renewable energy installations required to develop scenarios in which both China and India may increase per capita energy consumption while remaining on trach to meet ambitious climate goals. Here, we show that China and India will have to expand their renewable energy infrastructure at unprecedented rates in order to support both population growth and development goals. In the larger scope of the literature, we recommend community-based approaches to microgrid and cookstove development in both China and India.
1. Introduction
In 1865, Jevons published ‘The Coal Question: An Inquiry Concerning the Progress of the Nation, and the Probable Exhaustion of Our Coal Mines’ [1]. The coal question in his work related to the possibility that the United Kingdom might someday run out of coal to fuel the ongoing Industrial Revolution. In fact, coal production in the United Kingdom peaked in 1913, and the last deep coal mine there closed in 2015, with only minor surface mining still occurring. Though coal is a non-renewable and finite resource, the 21st century coal question may better be focused on the climate change implications of combusting fossil fuels. Coal is, after all, the most carbon intensive globally-utilized fuel. Thus, in the face of climate change and a slow transition to a renewable energy infrastructure, are the developing nations (particularly those with large populations) arriving late to the table for cheap, rapid economic development?
As a more detailed understanding of fossil-fuel emissions develops, serious concerns continue to arise [2]. From 1870–2010, 1890 gigatonnes of carbon dioxide equivalent (GtCO2) were emitted globally [3]. Another 229 GtCO2 were emitted from 2011–2017 [4]. The Intergovernmental Panel on Climate Change (IPCC) warns that catastrophic climate change impacts are likely if these emissions surpass 2900 GtCO2 [5]. The December 2015 UN climate summit (COP21) was a major step towards binding agreements to limit global temperature rise to 1.5–2.0 °C above pre-industrial levels by limiting the use of fossil fuels. Prior to the summit, every nation submitted an intended nationally determined contribution (INDC) stating the goals of the country for reducing greenhouse gas emissions. However, the majority of INDCs only cover the time period of 2015–2030. We are interested here in the entirety of the 21st century.
Yet, all this understood, the most developed economies in the world have been built on cheap fossil fuel energy [6]. The threat of global climate change and projected global population growth will require the development of careful energy strategies and policies. In 2017, the world’s share of renewable energy sources (RES) and hydropower production reached only eleven percent of global total energy production. Over half of total global RES production was in Europe and the United States.
Furthermore, Europe, the United States, and the Russian Federation were among the first to industrialize [7] and are in a favorable position to transition away from coal. However, China and India represent the world’s most populated and fastest developing countries. In 2017, the two nations’ combined 2.75 billion inhabitants represented 36% of the world total [8], they consumed 163 exajoules (EJ) of energy, or 29% of the world’s total consumption [4], and they emitted 12 gigatonnes of CO2 equivalent, or 35% of global emissions [4]. It is clear that any discussion of global sustainability must include an analysis of these two nations. This paper is an evaluation of the world’s two most populous nations’ potential role in 21st century energy demand. Our approach is similar to that of Jones and Warner [9], scaled now to a national-level. It may be considered a partner study to our previous work with sub-Saharan Africa.
Our primary interest is climate change in the pursuit of per capita energy consumption growth among these large populations. In 2017, per capita energy consumption was 93 gigajoules (GJ) per person in China and 24 GJ/person in India. The 2017 world average consumption was 75 GJ/person. China is both the most populous and the most carbon emitting country in the world [4,8]. India is on track to overtake China’s population by 2024 [8] to 2030 [10]. Both China and India are members of the Group of Twenty (G20) major economies forum. These 20 nations represent the world’s largest economies and account for roughly 90% of global GDP and 80% of global trade [11]. The countries are also members of the BRICS nations (Brazil, Russia, India, China, and South Africa). These nations are characterized by large populations, relatively rich resource reserves, and development toward becoming more influential in world economic affairs [12]. Inclusion in both of these groups indicates that the two nations are among the closest to achieving developed economic status.
Both of these nations show strong linear correlation between fossil fuel energy production and population growth since 1981 (R2China = 0.781, R2India = 0.981). China became a net energy importer in 1992 and India has been a net importer since before 1970. In 2017, Chinese energy consumption was fuelled by 86% fossil fuels, 2% nuclear, and 12% renewable energy. India’s consumption was 92% fossil fuels, 1% nuclear, and 7% renewable energy [4]. The two most competitive sources of (relatively) carbon-free energy are nuclear and hydropower. Combined, these sources provide 11% of total global energy consumption, 10% in China, and 5% in India [4].
The following statistics are sourced from the ‘2018 BP Statistical Review of World Energy’ [4]. The proven reserves of fossil fuels in China total 4120 EJ (92% of which is coal). The reserves-to-production ratio (R/P) is 18 years for oil, 39 years for coal, and 37 years for natural gas. Proven fossil fuel reserves in India are estimated at 1721 EJ (97% coal). The ratio of remaining reserves to the most cent year’s production (R/P) of oil is 14 years, 136 years for coal, and 44 years for natural gas. R/P ratios assume current energy consumption rates, such that when the reserve runs out, production declines instantly from the current value to zero. However, the logistic decay curve [13] depicts a more realistic slowdown of production as the reserve is produced.
Coal is the primary energy source for both of the focus nations. China derives 60% of its total energy consumption from coal and India, 56% [4]. In contrast, 15% of total energy consumption in the US and 14% in the EU is derived from coal. In 2017, 245 tonnes of coal were mined around the world every second [4]. Coal production has increased six-fold in China since 1981 [4]. China was the number one coal producer in the world in 2017 (at nearly five times the production of number two, the United States), Australia was the third highest producer, and India was the number four producer [4]. Carbon dioxide emissions from coal are estimated at 94.6 tCO2 per terrajoule (1012 J) produced [4]. In 2017, China and India contributed 35% of total global carbon emissions. The United States, European Union, and Russian Federation were responsible for an additional 30%.
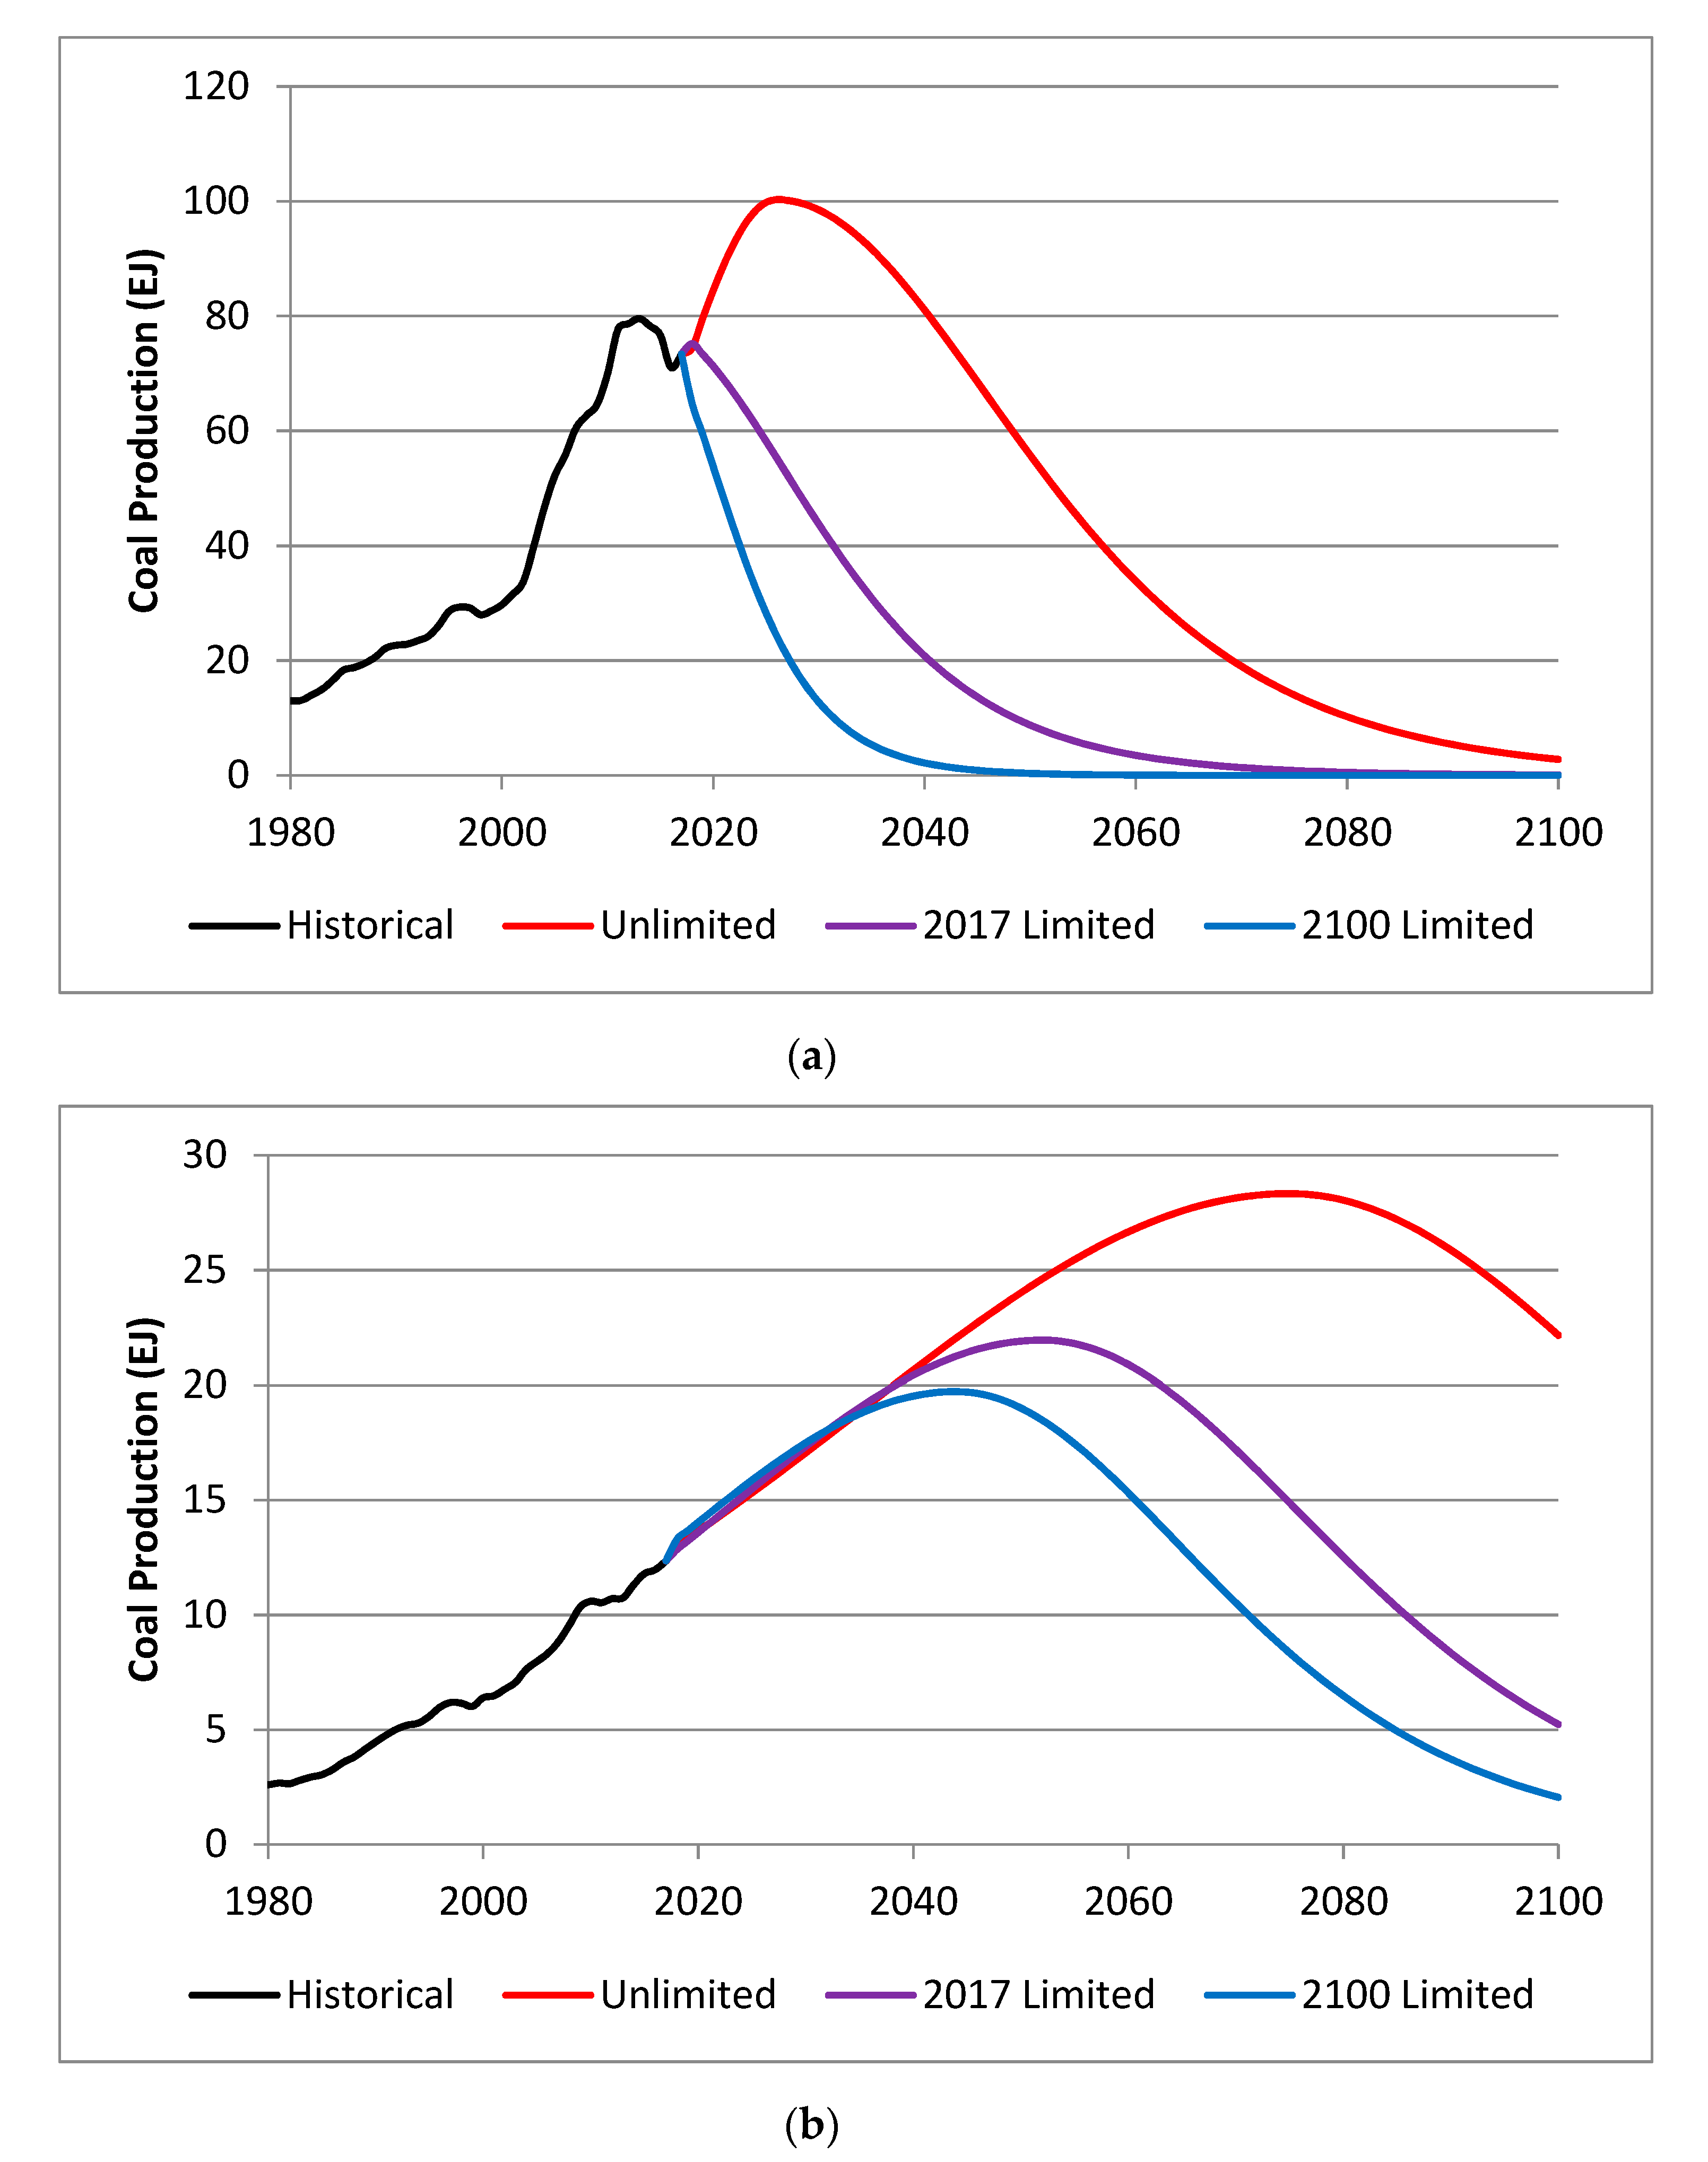
Estimates [9,14,15] suggest that global fossil fuel production will peak and begin to decline between 2030 and 2050. Coal is the most abundant of the non-renewable fuels; however, Wang et al. [16] reviewed eight estimates of peak coal in China (ranging from 2010–2039) and derived their own estimate that production will peak in 2027. India produces much less coal than China; however, production has been increasing at about four percent per year since 1950 [4]. Warner and Jones [17] projected that coal production in the South Asia region (in which India is the only major coal producer) will peak near 25 EJ in 2057.
The 12th five year plan (2011–2015) in China was the first to incorporate economic development goals to consider carbon emissions [18]. In response to the 2009 COP15 meeting in Copenhagen, China set a goal of 40–45% reduction of greenhouse gas emissions from the 2005 level by 2020 [19]. According to BP [4] the 2014 emissions were 54% higher than 2005, implying an unachievable 75% reduction from 2014 to 2020 to meet that goal. China recognizes that their economic growth and development is dependent on the availability of cheap energy [20], and as such their intended nationally determined contribution (INDC) for the 2015 COP21 climate summit in Paris stated an understanding of the risks of climate change and set a goal of peaking in carbon emissions while increasing their non-fossil fuel share of energy consumption from 12% in 2017 to 20% by 2030 [21].
The government structure of India creates a more complex geo-economic transition focused more on securing future energy supplies than on cooperating towards global goals [22]. India’s INDC stressed the difference between consumption and emission rates in India and the developed world, noted the importance of energy consumption to improving a nation’s human development index (HDI, a statistic that factors in life expectancy, income, education, etc.), and repeatedly noted the pressures of providing a “dignified life” for its populace [23]. It is important to note that the INDCs from both China and India stress the responsibility of the developed nations and their own status as developing economies. In all, realistic climate concerns dictate that carbon emissions in China will have to peak by 2030 and by 2040 in India [24].
In addition to domestic energy production, development and population have an impact on energy consumption. Increasing GDP alone is not sufficient for improving the quality of life at the national or global level [25]. A recent study suggests that for every percent of GDP growth in Hebei Province, China, electricity demand grows 0.84% [26]. The electrification of non-agricultural homes was found to increase household incomes in India by nearly 30% from 1994–2005 [27]. Causality studies have found evidence that the growth in energy consumption was related to economic growth in India from 1950–1996 [28]. Increased coal consumption was also found to cause GDP growth in India from 1970–2011 in a more recent study [29].
The demographic transition theory suggests that underdeveloped economies initially benefit from unrestricted population growth and eventually develop an economy that benefits from restricted population growth [30]. The result of the demographic transition is a slowing of the population growth rate toward an equilibrium or declining trend in the fertility rate to the replacement level of 2.1 births per woman [31]. It is evidenced in India that there has been a trend towards “quality over quantity” in regard to ensuring education for children over family size [32]. The female literacy rate is estimated at 92.7% in China (total fertility rate of 1.60 births per woman in 2010–2015) and 59.3% in India (2.44 births per woman in 2010–2015) [33].
2. Experiments
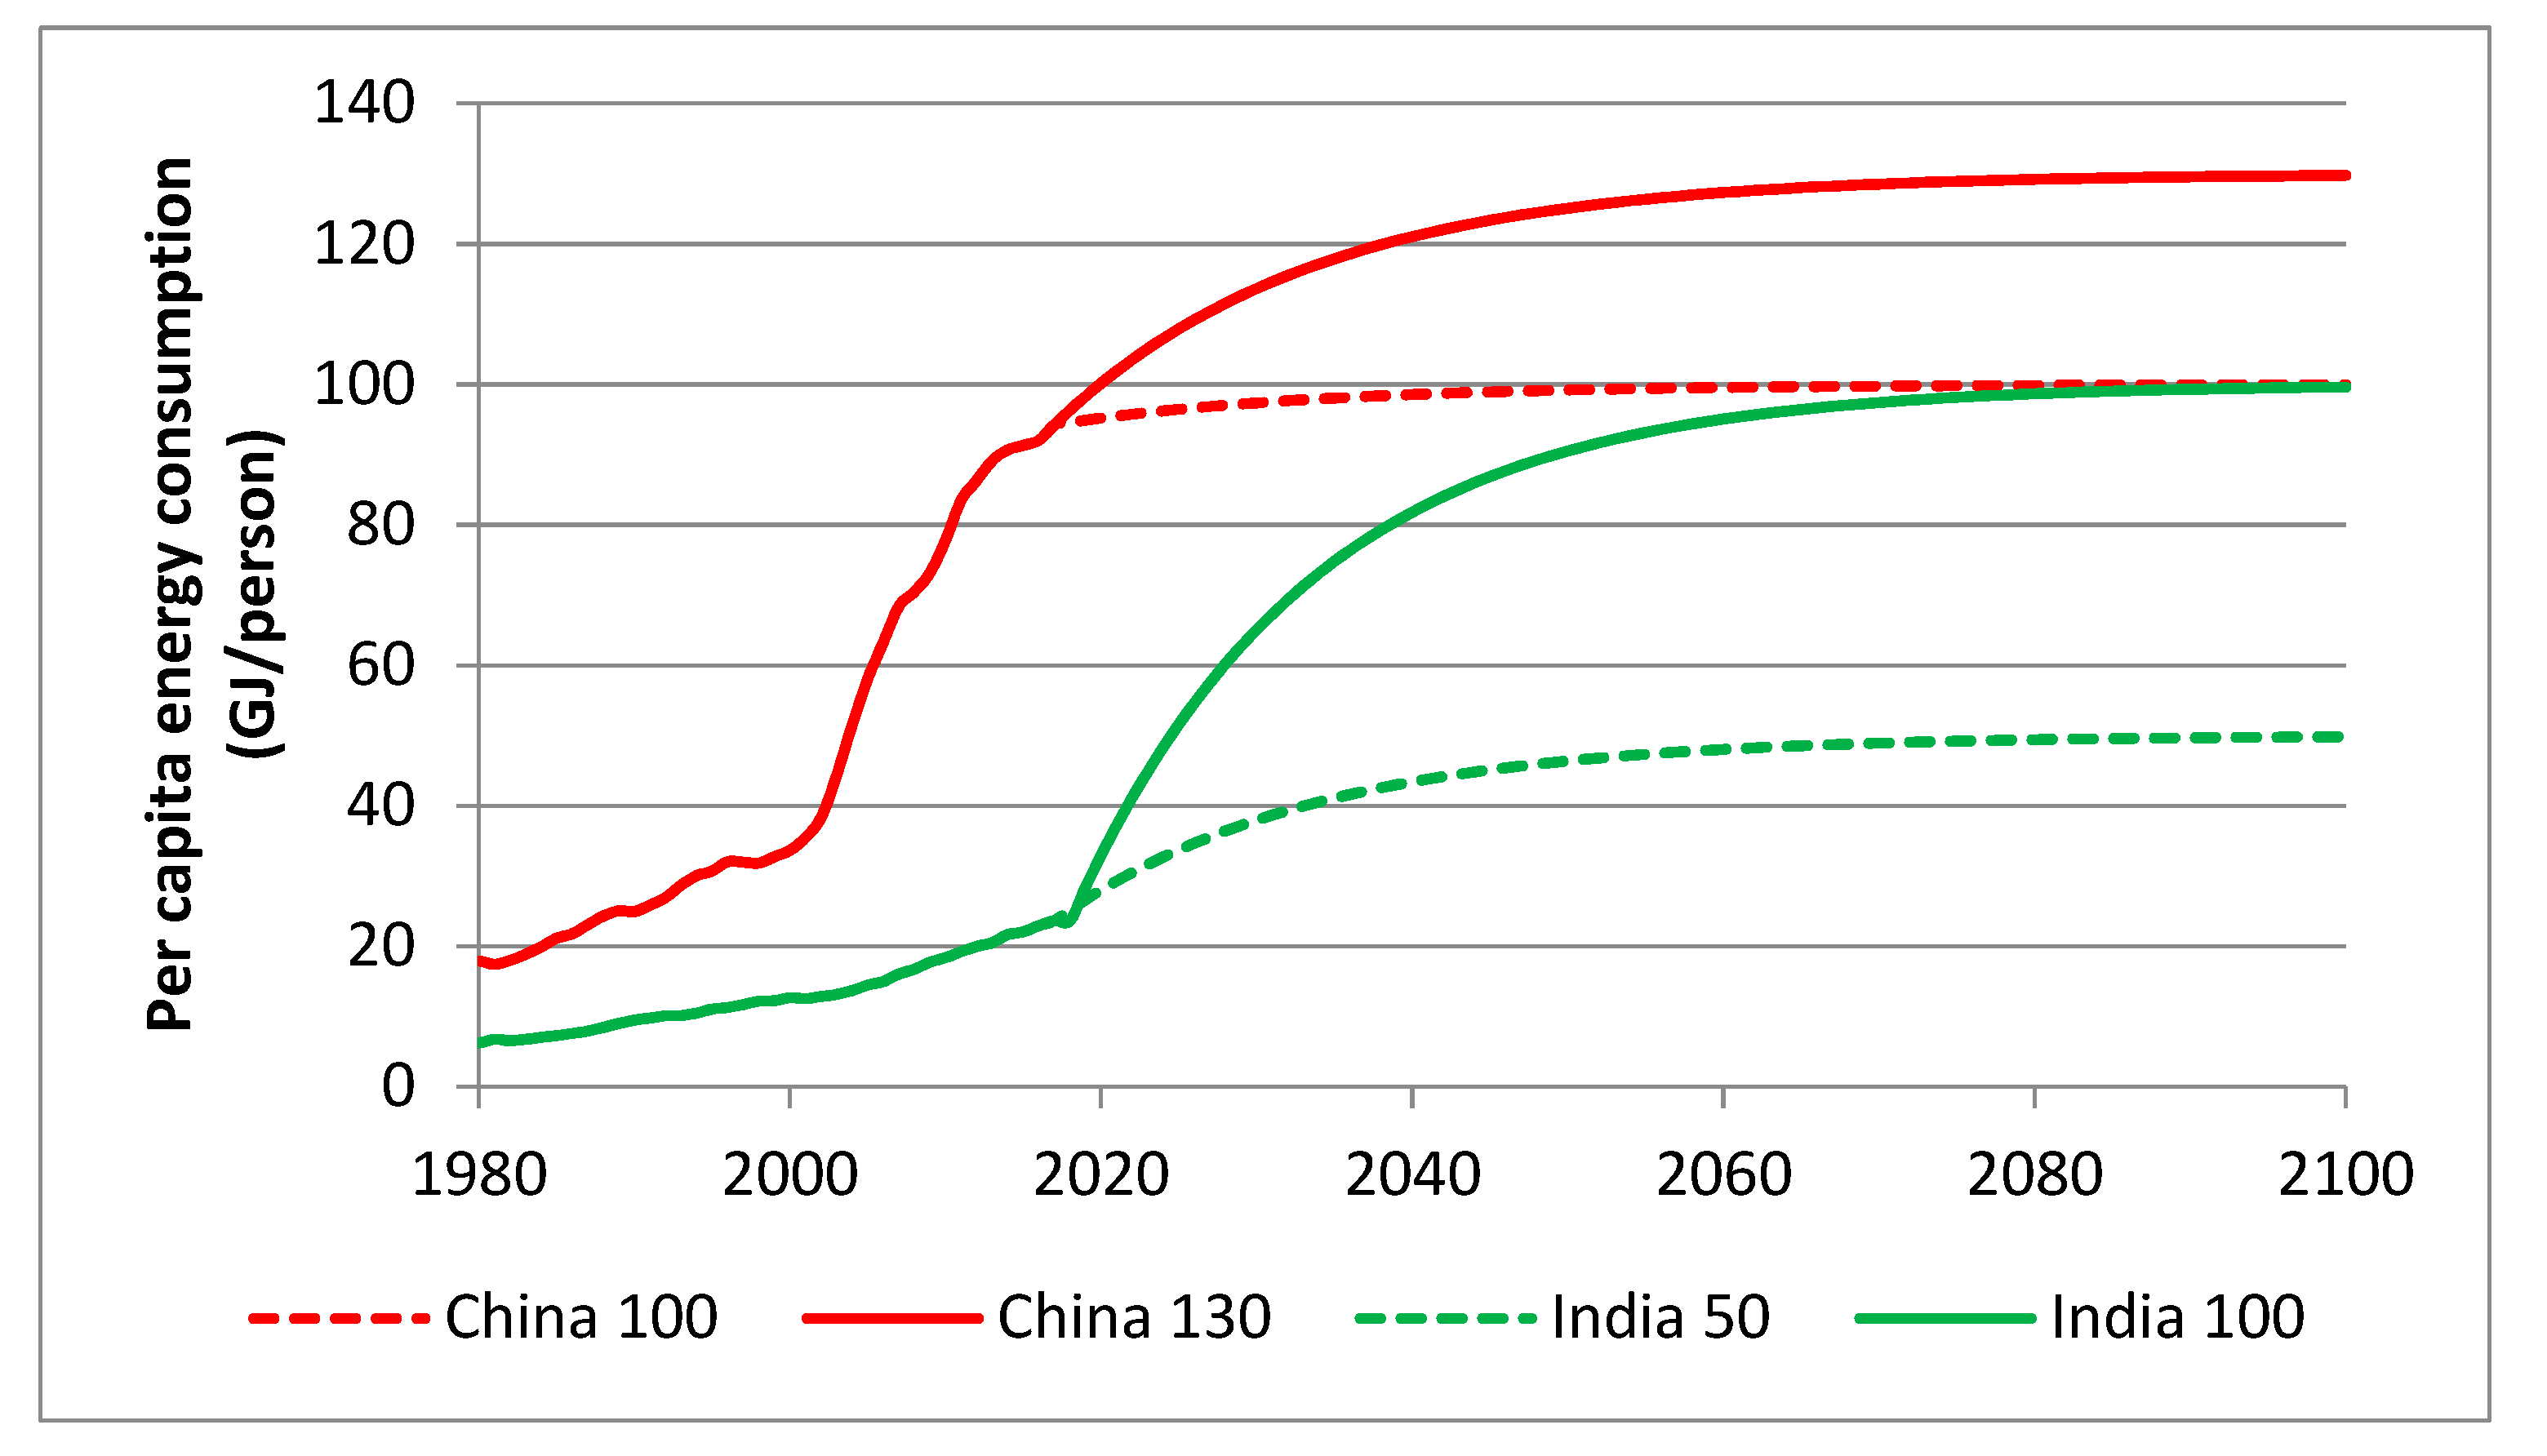
In this paper we examine four per capita energy consumption benchmarks for the year 2100: 50 and 100 GJ/person for India (currently 24 GJ/person), and 100 and 130 GJ/person for China (currently 94 GJ/person). The 130 GJ/person benchmark for China is close to the 2017 European Union consumption rate of 139 GJ/person. It has been suggested that one means of increasing a nation’s quality of life indices is to increase per capita energy availability. Lambert et al. [34] suggested an ideal range of 100–150 GJ/person, citing significant increases in national quality of life indices at consumption rates greater than 100 GJ/person and no significant improvements at rates greater than 150 GJ/person. The 50 GJ/person benchmark for India represents a doubling of per capita energy consumption and the 100 GJ/person benchmark is again based on the low-end estimate in Lambert et al.
We begin by identifying some basic model parameters. The 2017 UN population projections provide high, medium, and low fertility estimates for each year from 2017–2100 [8]. We used the medium fertility estimates in our models. Next, we projected the trends for each of the four benchmark per capita energy consumption scenarios from China and India’s current values. We used the von Bertalanffy growth curve [35] rather than the full logistic growth curve used in Jones and Warner [9] to provide yearly estimates from 2017–2100, as the von Bertalanffy growth curve provides a smooth rise in per capita consumption rather than the abrupt initial growth and saturation of the logistic s-shaped curve. The growth rates for each scenario was adjusted such that the scenario values were reached at the year 2100. Energy demand throughout the century was estimated by applying the projected per capita energy consumptions to each year’s UN population estimate. The projections of per capita energy consumption in China and India are shown in Figure 1.
Next, we examined the internal resources, available and necessary, of both countries to meet the projected energy demand. The coal production models are based in the statistics found in BP [4]. These coal production values extend back to 1981. Coal production values before 1981 are from Rutledge [36]. Future production of coal was modeled using a standard variant of the standard logistic function [13,37], and assuming that every exajoule of proven coal, oil, and natural gas is used. This modeling does not account for future advances in extraction techniques. These estimates are combined with production data from BP [4] and Rutledge [36] to generate estimates of the ultimate recoverable resource (URR) and model coal production throughout the century. CO2 emissions were calculated using the emissions values provided in BP [4].
Next, we applied two speculative CO2 emissions plans: the remaining allowable CO2 emissions weighted via the 2017 and the 2100 populations. Again, from 1870–2010, 1890 GtCO2 were emitted [3]. According to BP [4], from 2011–2017, another 229 GtCO2 was released. This leaves 781 GtCO2 global emissions to be released from 2018–2100 in order to remain below 2 °C warming. Oil and natural gas production were left unchanged from the base model and coal production was curbed to the maximum allowable CO2 emission level for each year. Coal production curves were checked against historic data and run from 1900 to 2200 to ensure that the model did not eventually overdraw the reserve estimates. The model continues by examining the RES growth required to satisfy the climate-based coal limitations. Oil, natural gas, nuclear, and hydropower production were modeled using the same techniques as Jones and Warner [9].
3. Results
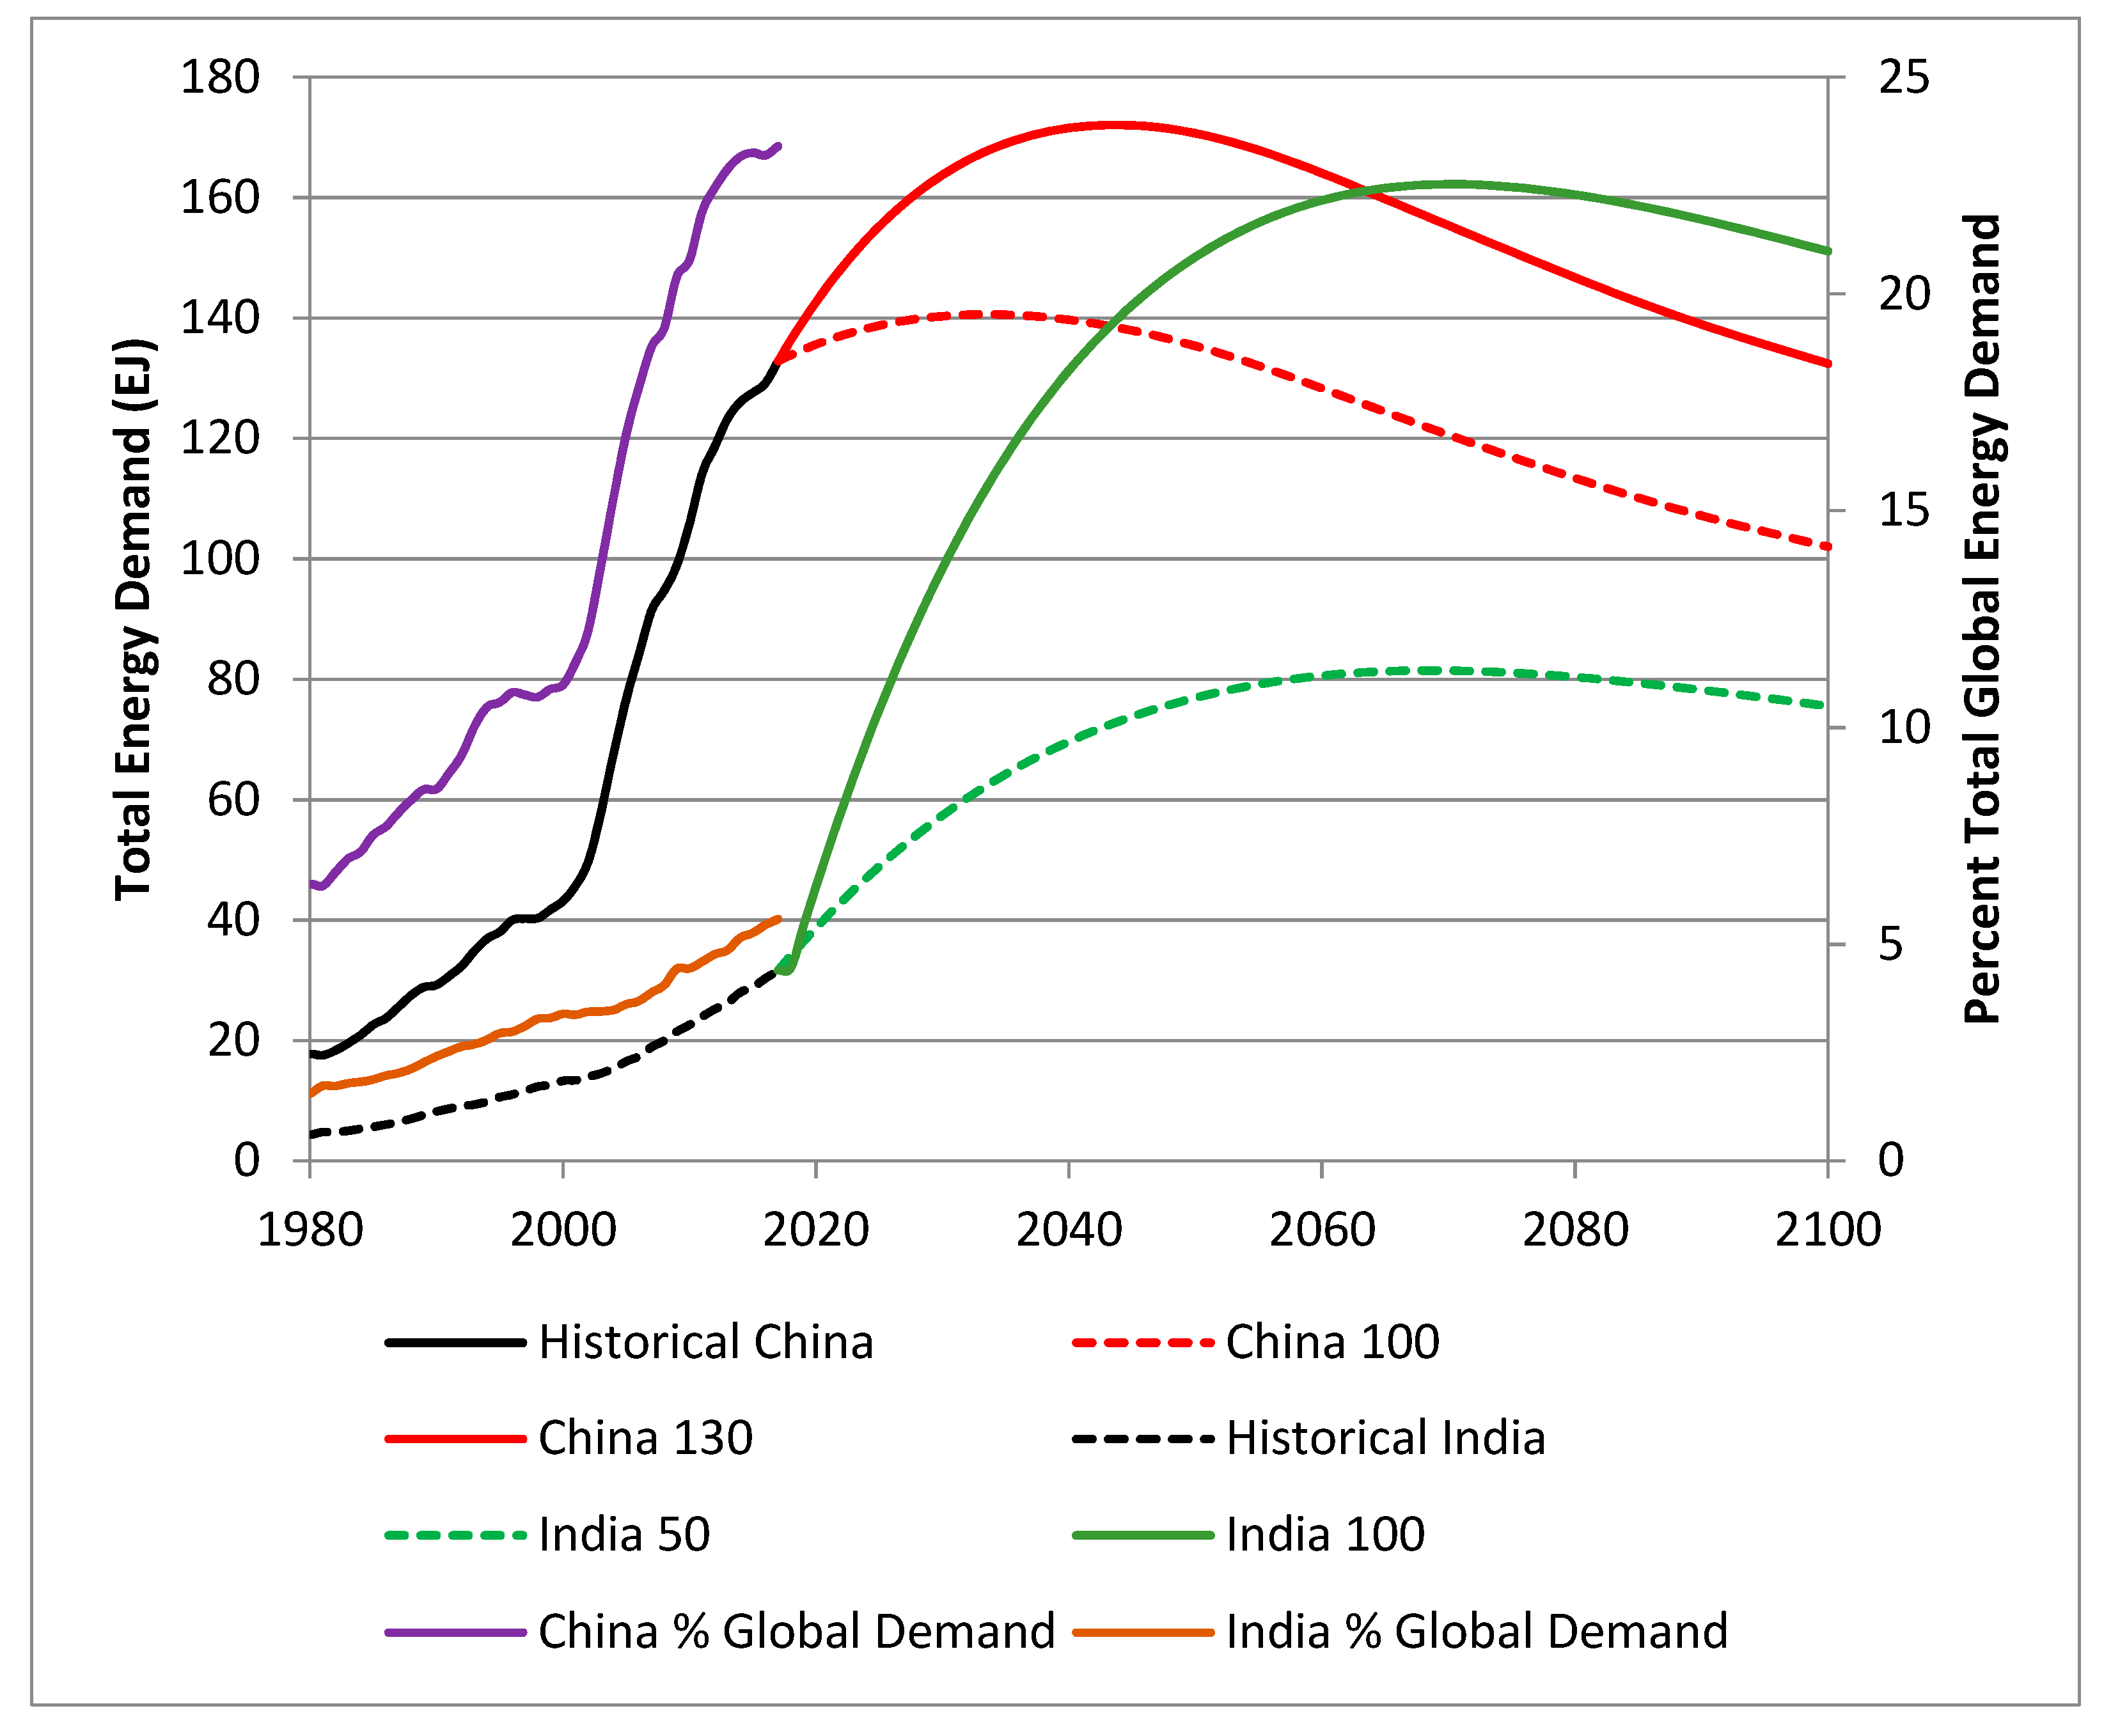
The medium fertility population projection estimates that 1.02 billion people will live in China in 2100 and that 1.52 billion people will live in India. The resultant energy demand projections are in Figure 2. Chinese energy demand in 2030 ranges from 140–164 EJ, and from 102–132 EJ in 2100. Energy demand is between 57 and 98 EJ in 2030 and 76–151 in 2100 for India. Figure 2 charts the energy demand for China and India.
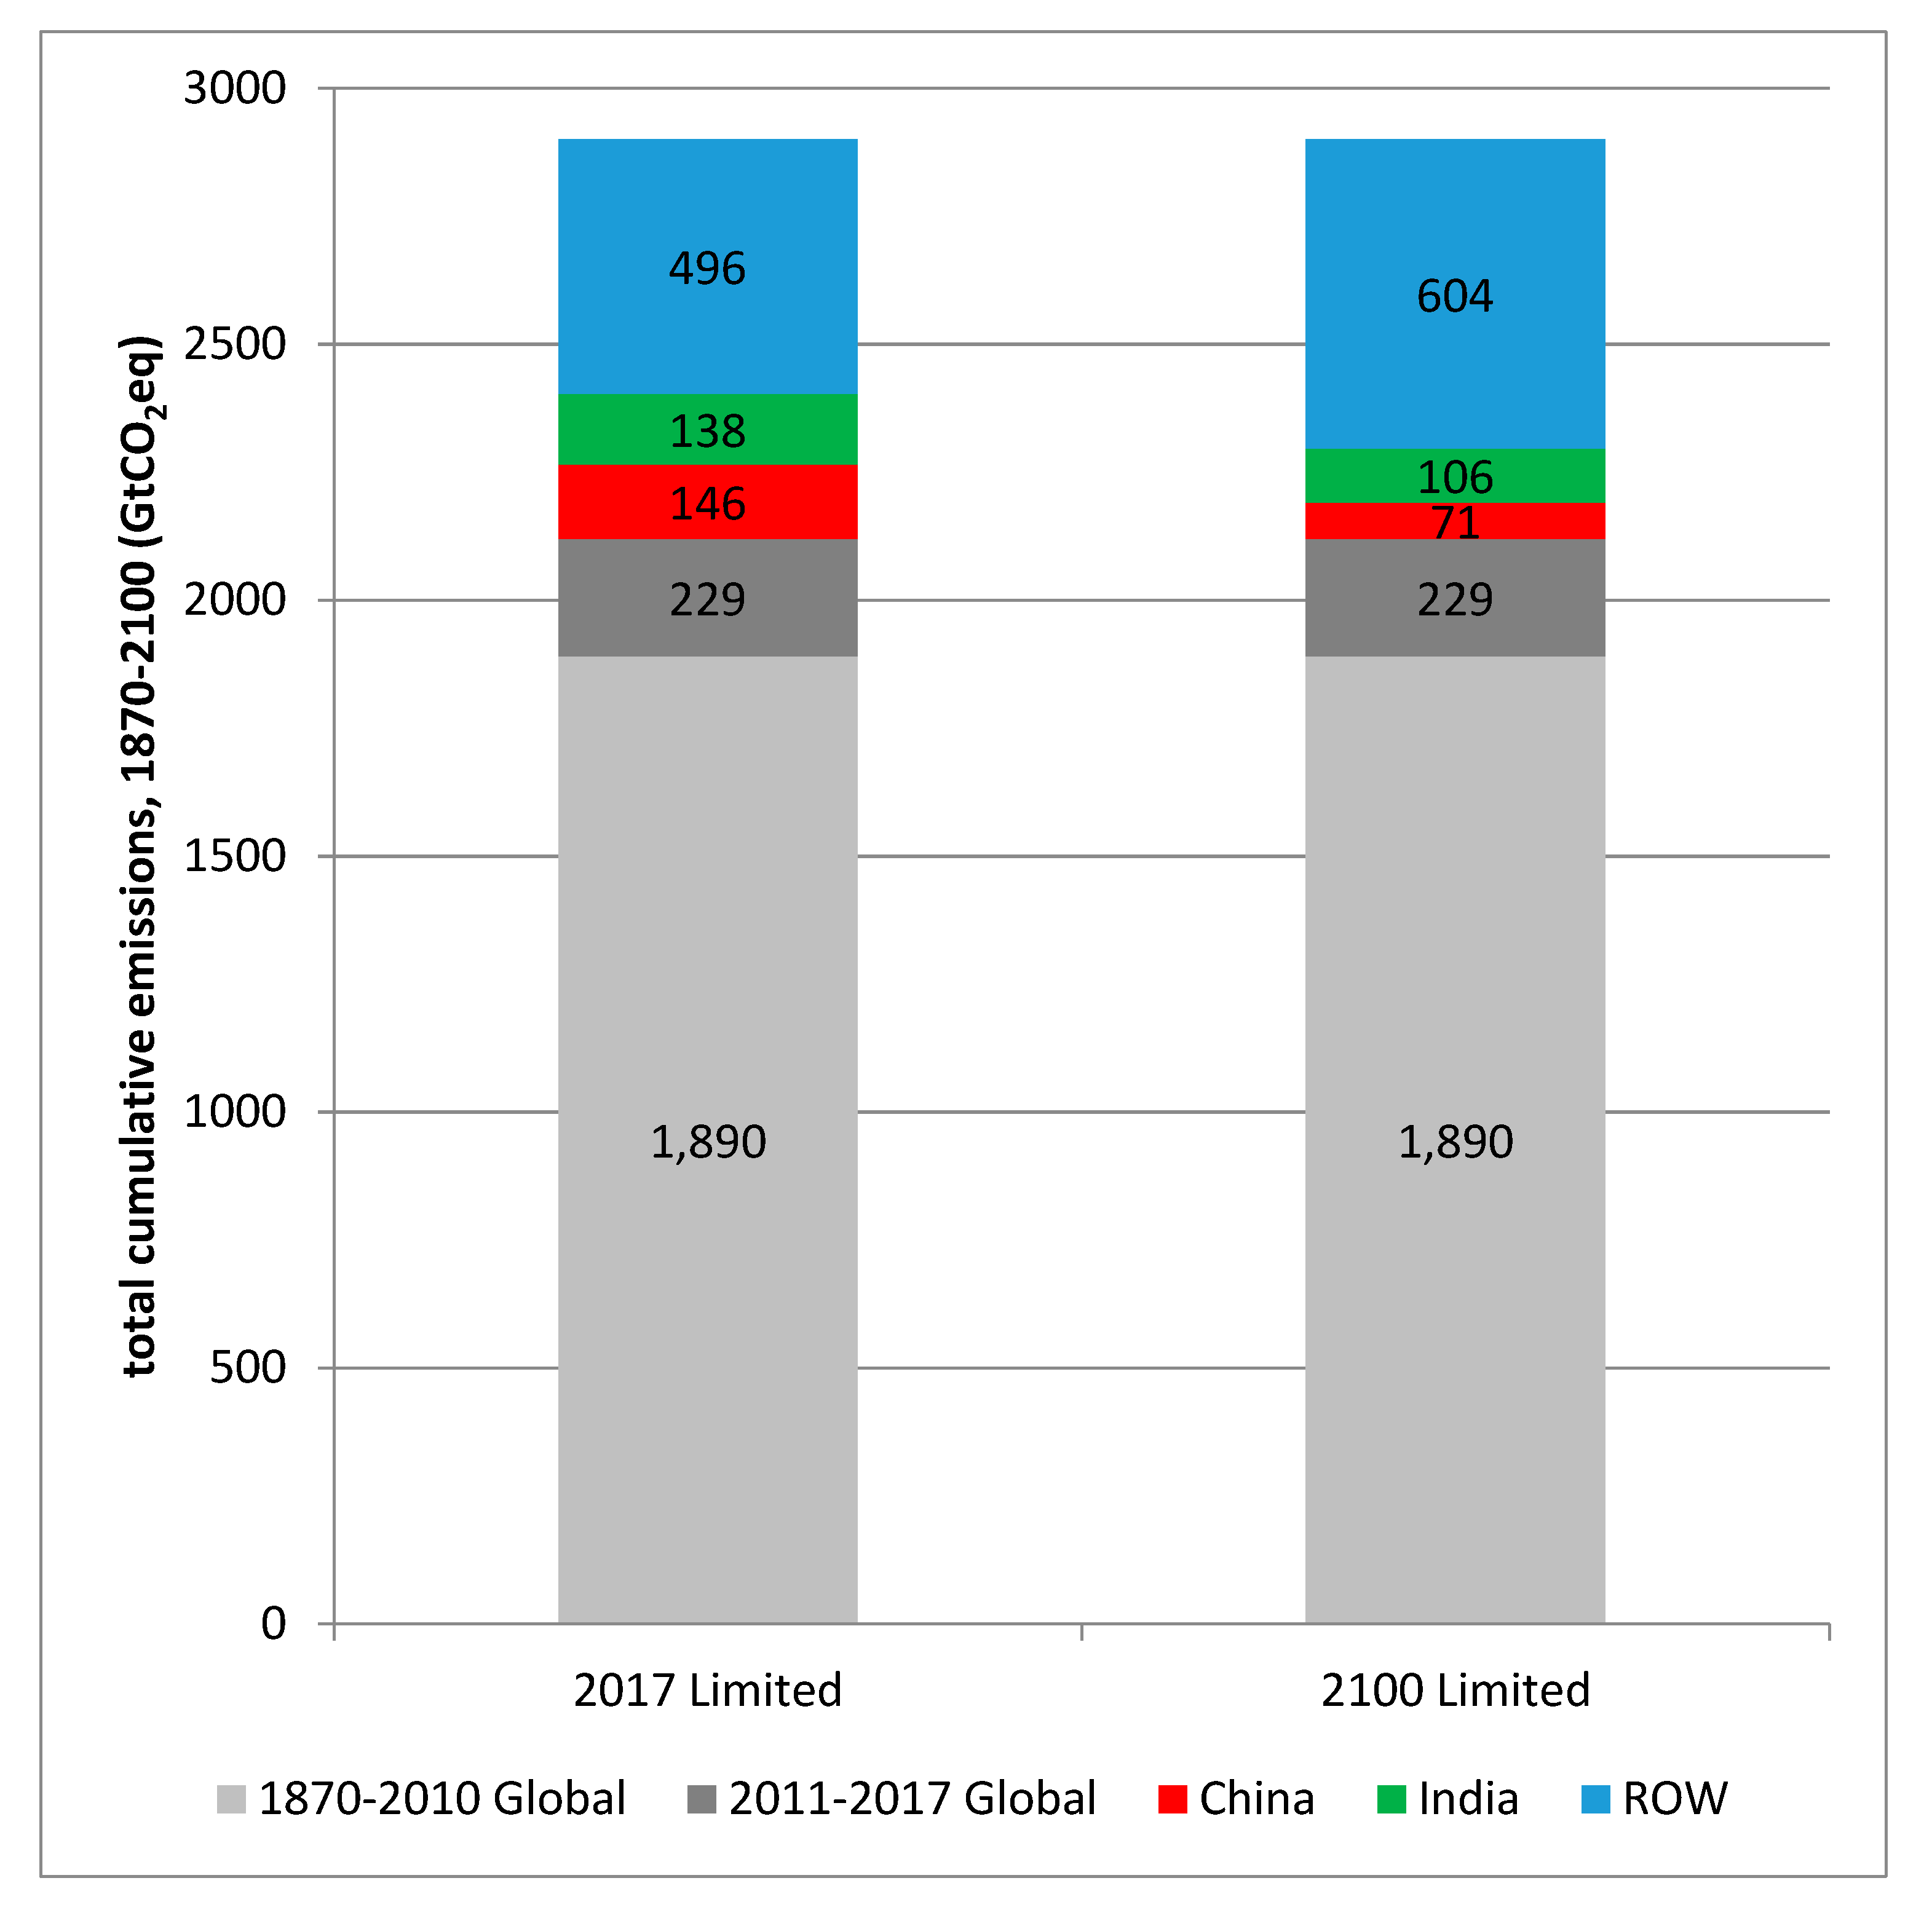
In order to emit fewer than 2900 GtCO2 from 1870–2100, total global emissions must remain below 780 GtCO2 from 2018–2100. For simplicity, we assumed an apolitical and impartial, per capita global carbon allowance for the remaining emissions allowance. According to the most recent UN population projections, China comprises 18.7% of the 2017 population and, in the medium variant, it is expected that China will represent 9.1% of the population in 2100. The same conditions indicate 17.7% of the 2017 population and 13.6% of the 2100 population in India. The largest contributor to the percentage decline in these population shares is the population growth expected in Sub-Saharan Africa (from 14% in 2017 to 36% in 2100) [8]. That population growth will result in an entirely different set of development concerns [38]. This means that China is allowed 146 GtCO2 in the 2017 population allowance and 71 GtCO2 in the 2100 population-based allowance. India is allowed 138 GtCO2 in the 2017 population allowance and 106 GtCO2 in the 2100 population-based allowance (Figure 3).
We estimate future emissions from oil and natural gas at 22 GtCO2 in China and 4 GtCO2 in India. Based on these allowances, China’s allowable coal emissions are adjusted to 124 and 50 GtCO2. India’s allowable coal emissions are adjusted to 134 and 102 GtCO2. As such, China is restricted to using about one-third of its remaining proven reserves of coal; however, the restrictions on India are much less severe in the climate-constrained scenarios. The coal production parameters are shown in Table 1.
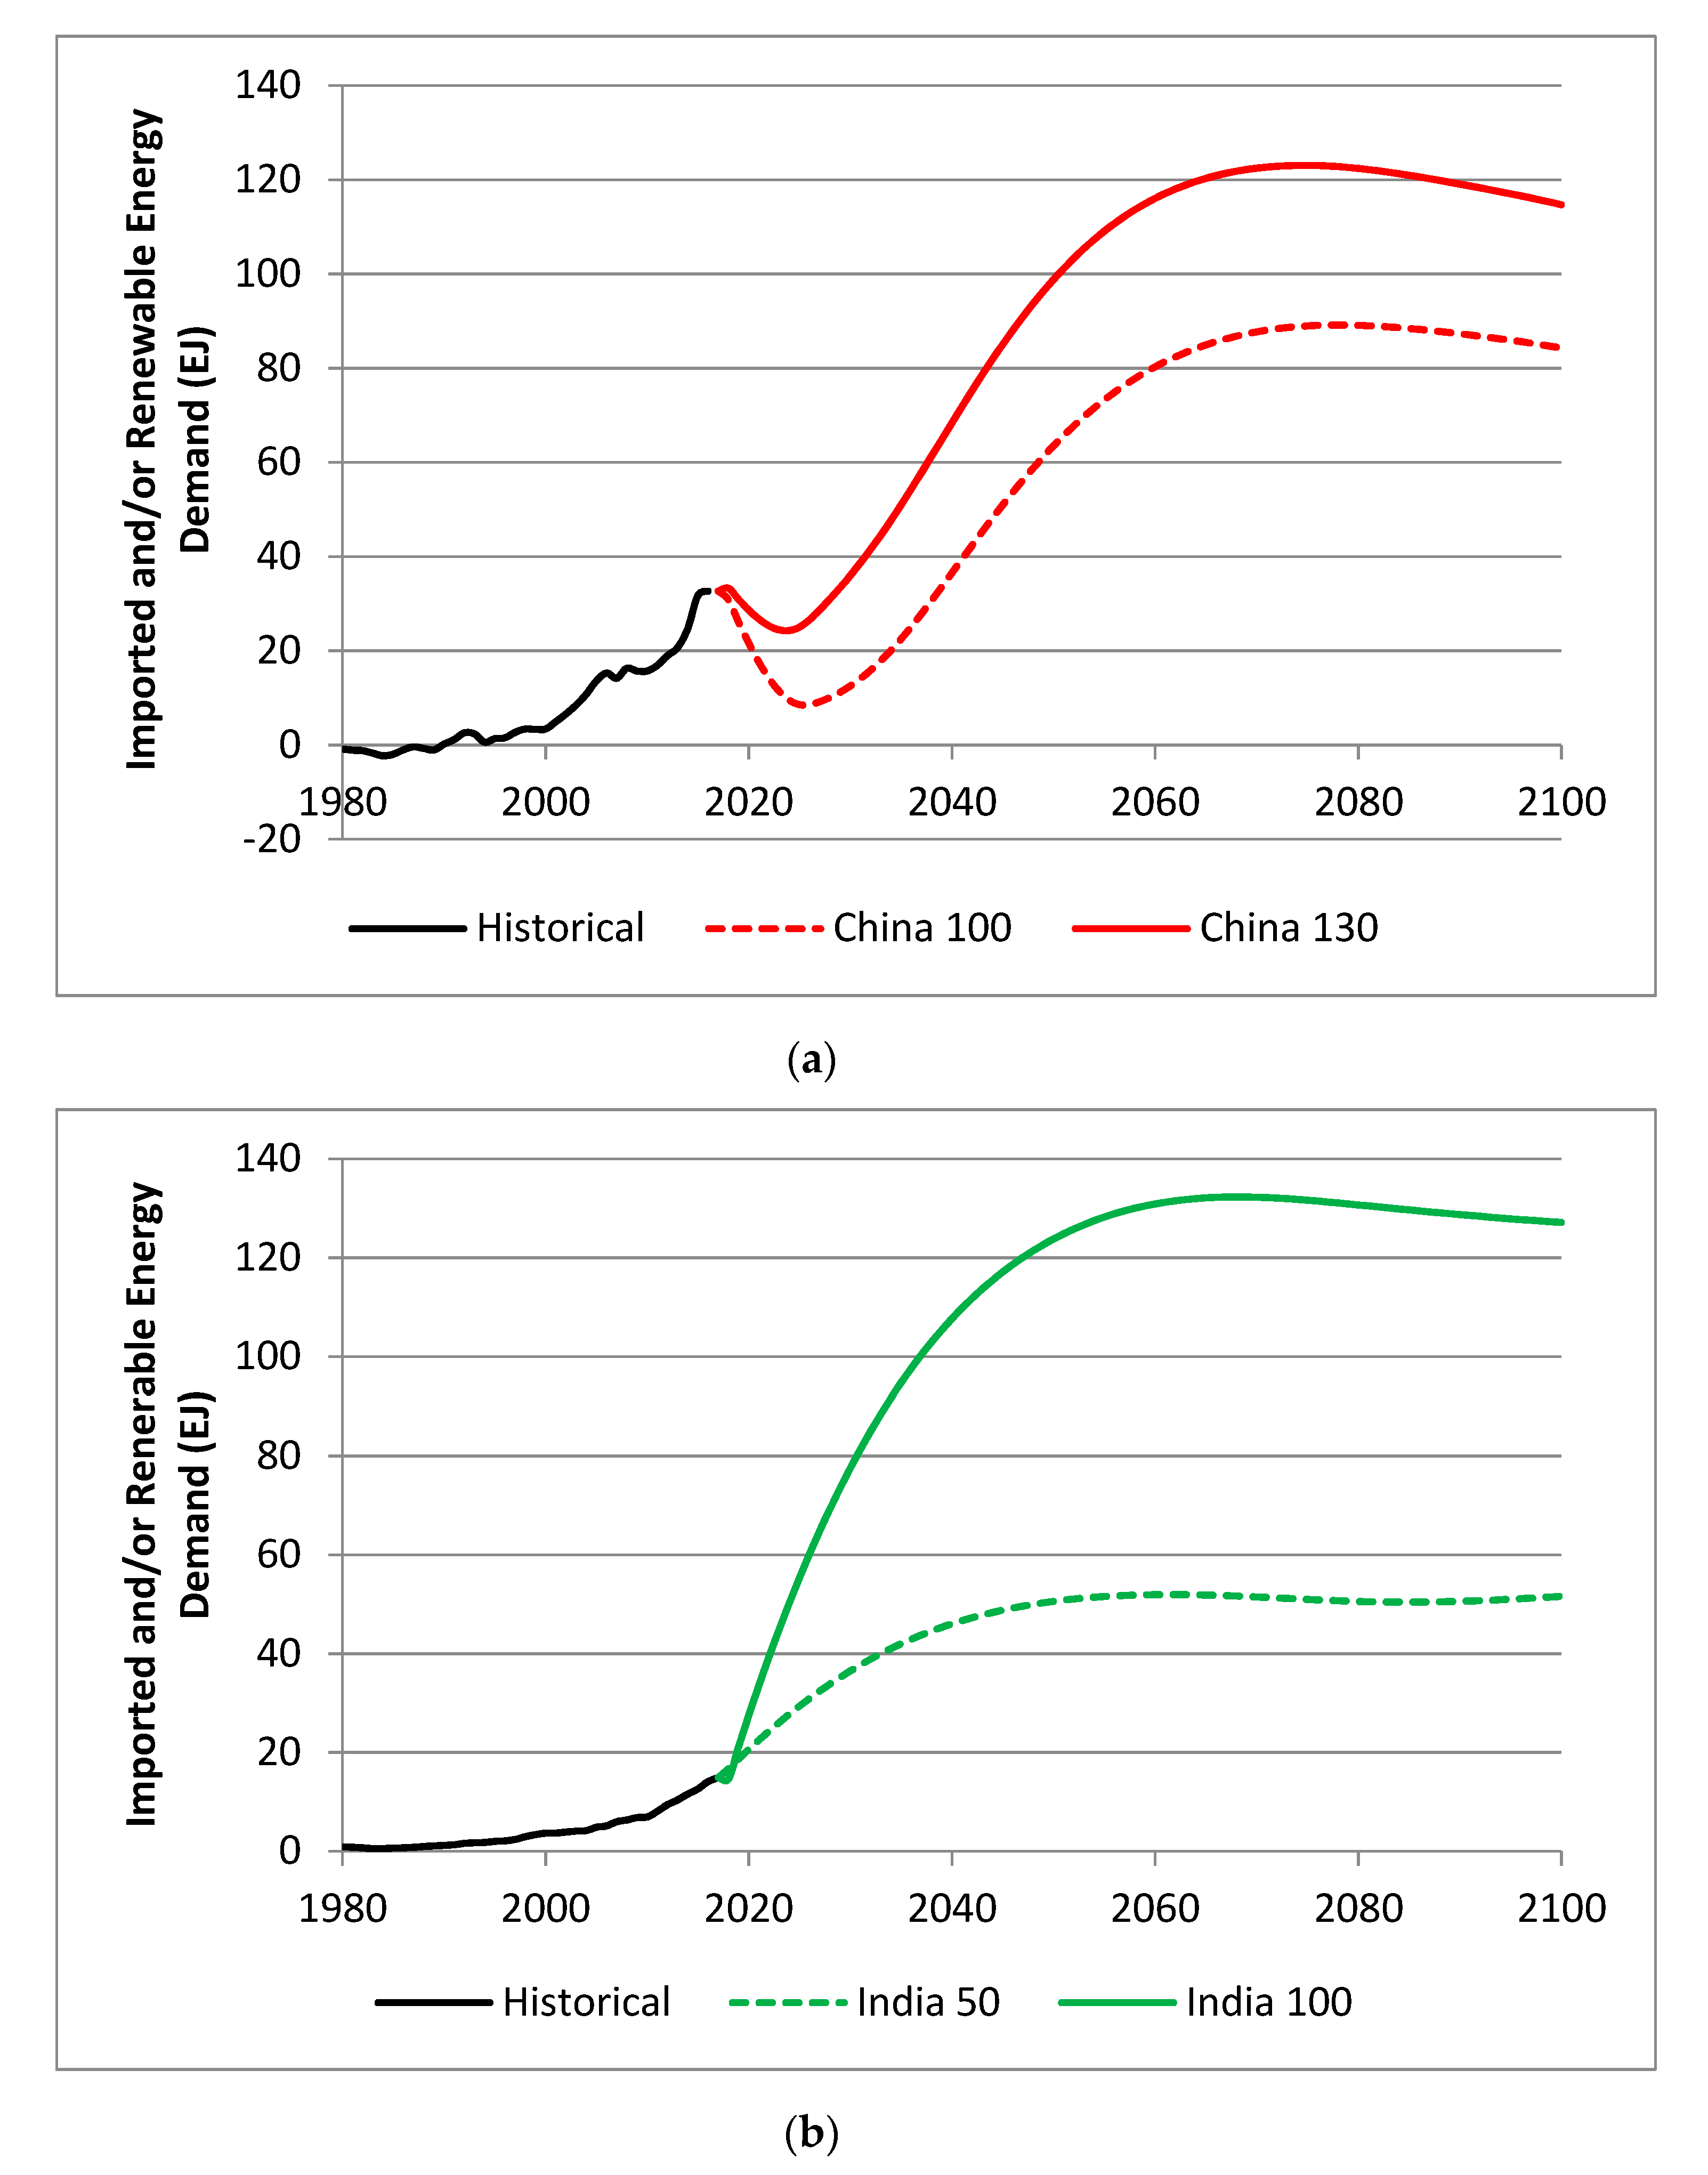
The projections for coal in the absence of climate restrictions indicate a Chinese peak in 2026 and India’s coal production peaks in 2075. The population-based coal scenarios result in China’s coal production having peaked in 2013 in both the 2017-limited and the 2100-limited scenarios. The unlimited coal production peak in China is in line with previous estimates [39]. India’s production under the two scenarios peaks in 2052 (2017-limited) and 2044 (2100-limited). The production projection for China is depicted in Figure 4a, and the production projection for India is depicted in Figure 4b. Based on the BP [4] proven coal reserves, import/RES demand for China and India from 2000–2100 are depicted in Figure 5. Non-hydro renewable energy is specified in Figure 5 because hydropower is modeled separately from the other RES. The results in Figure 5 have been backchecked for available domestic and imported resources based on our previous work [17].
Coal production in China peaks in all scenarios modeled sometime between 2013 and 2026. This result is similar to the range in Wang et al. [16] of 2010–2039. Production of the more climate-friendly natural gas (often considered a bridge fuel to a renewable infrastructure) is projected in our model to peak in 2025 and in Lin and Wang [40] to peak in 2022. Wang et al. [41] detailed the extent to which China will rely on imported natural gas to meet the fast-growing demand. India has already peaked in natural gas production and is expected to be one of the fastest growing markets for imports [42].
4. Discussion
If China and India emit the 561 additional GtCO2 modeled for them for < 2 °C warming, the total emissions remaining for the rest of the world from 2018–2100 would only total 220 GtCO2. That figure is less than seven years of emissions at the 2017 global rate. Unfortunately, growing the per capita energy consumption in China and India will require significantly more energy beyond the available domestic non-renewable reserves in each country by mid-century. In this case (and all model results for India), China and India must rely on exploiting their domestic coal reserves and securing additional energy resources. This makes it highly unlikely that they will be able to honor their INDCs and contribute to the IPCC goal of < 2 °C warming. Even as the global fossil-fuel energy market inevitably declines throughout the century (as suggested in Warner and Jones [17]), energy demand will not, and demand will become increasingly reliant on a renewable energy infrastructure.
In order to adhere to climate limitations, both China and India will have to expand their renewable energy infrastructure at unprecedented rates in order to support both population growth and development goals. Climate goals will require China and India to shift focus from economic growth to social and environmental awareness [43]. Walsh et al. [44] identified four issues that would influence China and India’s negotiation agendas surrounding the 2009 Copenhagen Accord: first, developing nations need to prioritize the alleviation of emissions or poverty; second, statistical methods should be used for negotiations; third, how to finance mitigation projects; and fourth, how to address repercussions for countries that failed to abide by their Kyoto protocol commitments. These issues were still unresolved as of the 2015 COP21. Although China and India recognize the need for renewable energy, the quality of life of their citizens and growth of the economy are more immediate concerns.
Economic development requires expansion of energy availability [45]. The Nobel Prize winning economist Robert Lucas, Jr. defined economic development as “accounting for the observed pattern, across countries and across time, in levels and rates of growth of per capita income” [46]. China and India are described by the United Nations’ ‘World Economic Situation and Prospects’ (WESP) as developing economies [47]. Developing economies are characterized by rapid economic growth and adoption of a free market system [48]. Biophysical economist Hall suggested that the term “development” is merely a euphemism for “industrialization” [49]. In a world of declining fossil-fuel energy resources [9,14,15], are China and India coming too late to the table to reach developed status?
Both nations have a keen interest in the energy market. Since 2000, China’s economy has grown nominally at 9% per annum [50], while energy consumption grew at an average of 8.2% per annum [4]. While many areas of China are well-developed, there is a great inequity in sub-regional economic and social development [51]. Energy efficiency in non-urban regions of China is variable [52]. The rapid development has relied on unsustainable and high-polluting practices [53]. India’s economy grew at ~4.5% per annum from 1950–1997, and energy consumption grew at ~8% per annum [54]. India has committed to economic development, announcing expectations to double coal consumption by 2020 [55], regardless of climate concerns [56].
Any environmental limitations on coal production would be a significant handicap on the efforts of these two nations to supply for growing energy demands. Assuming the 2017 UN medium variant population projection (1.02 billion by 2100) and the 130 GJ/person per capita energy consumption, China will consume a cumulative 12,900 EJ from 2018–2100. There is a clear need in China to address long-term strategies to limit carbon emissions while ensuring energy access [57]. The same population projection and the more modest 100 GJ/person scenario for India results in 11,400 EJ throughout the remainder of the century. Combined, these estimates would tie up 56% of the 2017 proven reserves of oil, natural gas, coal, and uranium on 23% of the projected 2100 global population. China is unlikely to ever again be a non-renewable energy exporter. In calculating the effect of carbon taxes on China and India, Massetti found that taxation alone will not be enough to reach emissions goals [58].
There are several concerns within these nations aside from energy demand and climate change. The strong economic and social development of the United States was closely correlated with energy use [59]. Similar development goals in China and India will require similarly available cheap energy options. The already monumental task of increasing per capita energy availability in China and India are only exacerbated by population growth. In China, population projections indicate a peak in population and fertility rates remaining below replacement level [8]. Per the UN medium variant, fertility rates in India do not drop below replacement level until the 2025–2030 period [8].
It is still common to hear about China’s “one child policy.” China’s post World War II population was rapidly growing, while the country was also attempting economic development [31]. China introduced the later-longer-fewer initiative in 1971 to encourage the population to get married later in life, wait longer between the birth of each child, and to generally have fewer children [60]. Fertility dropped at an unprecedented rate from six births per woman pre-1970 to 2.2 births per woman by 1980 [61]. Despite this reduction in the fertility rate, China is still feeling the effects of population growth. The population in China in 1950 was 544 million, 978 million by 1980, and 1410 million in 2017 [8].
India is expected to continue its demographic transition throughout the 21st century [61]. India was one of the first countries in the 20th century to enact family planning policies at the national level [62]. Two child families are the most desired in India [63]. Individual contraceptive education of married women in India was not shown to significantly increase contraceptive use; however, community-level female education did result in increased contraceptive use [64]. Despite improvements in basic demographic statistics, including fertility rate, child mortality and nutritional quality, India’s rate of improvement and lack of cohesive government efforts is not congruous with global quality of life goals similar to the benchmark per capita energy consumptions in this paper [65]. India’s 1950 population was 376 million, 697 million by 1980, and 1339 million in 2017 [8].
There appears to be a difference in community-level education (% of population educated) and individual-level education (duration of schooling per capita) [66]; community-level education has been shown to lead to a decline in fertility rates faster than individual-level educational statistics [67]. Community-level education is correlated with lower fertility desire and increased contraceptive use [68]. Ideal family size and desired fertility were shown to both decrease as a result of increased education in three Sub-Saharan African countries [69].
Lowering the fertility rate alone cannot solve population growth concerns. The various population control policies and gender bias toward male children have resulted in unintended consequences. Guilmoto [70] projected that the gender gap in both countries (at least 50% more males than females) will not begin to shrink until after mid-century, with at least 10% of males remaining unmarried by age 50. On 29 October, 2015 the Xinhua News Agency (XNA) in Beijing announced the replacement of the one child policy with a limit of two children per couple [71]. This decision was framed as a means to combat the inverting age structure (aging population) in China.
The Sustainable Energy for All Initiative was commenced in 2012 with the goals of ensuring universal global access to electricity, modern non-solid cooking fuels, and increasing the global share of renewable energy production by 2030 [72]. Though the percentage of the world’s population using unhealthy solid cooking fuels has decreased, population growth in the developing world has mostly kept pace, meaning that about the same total number of people since 1980 lack access to modern cooking fuels [73]. The same study reports that both China and India have made progress, though between 40–60% of the population still use unhealthy solid cooking fuels.
In discussing the Sustainable Energy for All Initiative in previous work involving Sub-Saharan Africa [38], we suggested a route that builds energy systems in developing regions via microgrids. Renewable energy microgrids have shown potential for community-based energy management [74] and scalable flexibility [75]. It is important to note that there is promise for rural community-based motivation for renewable energy-based development [76]. Perhaps most importantly, community-managed microgrids may be an important feature of removing solid-fuel cookstove dependence in both India and China. In Himalayan regions of China, carbon emissions from these cookstoves is likely underestimated by conventional laboratory experiments [77].
The increasing urbanization of China will make it difficult for China to grow its economy and reduce greenhouse gas emissions at the same time [78]. Additionally, the development gap between regions of China suggest that carbon emissions resultant of urbanization are linked to income in developed regions and linked to industrialization in less developed regions [79]. This adds to the difficulties that China will have to overcome in achieving its climate goals, as more region-specific plans must be developed. Chen and Feng [80] found that from 1978–1989, China’s high fertility rate was a negative factor toward economic growth. China’s population is also rapidly aging. The portion of the population under the age of 15 shrunk considerably between the 2000 and the 2010 census [81].
The rate of urban expansion in India has been estimated at 2–3% per year [82]. Compared with China, the urbanization of India has not been as organized, leading to underinvested cities [83]. Pandey and Seto [84] determined that urbanization in the majority rural India over the last 10 years has led to a small, yet steadily growing loss of agricultural land that could compound if the UN projections of urbanization throughout the 21st century are to be believed. Cities in India and other developing nations are also faced with rapid increase in demand for basic services such as sanitation and piped water access [85].
5. Conclusions
The question at the beginning of this paper was whether or not China and India had arrived late to the table in the fossil fuel era to achieve the economic and social benefits of countries such as the United States, in the European Union, and the Russian Federation. There is little chance that developed nations will consume less per capita either by choice or via efficiency [86]. If the 2017 populations of China and India had consumed at the American level (289 GJ/person), they would have consumed 1.3 times the 2017 total global energy production. Even without climate concerns, and using what energy might be available for import, any growth in per capita energy consumption will require immense growth in the renewable energy sector by 2030. Again, most peak energy forecasts estimate that global non-renewable energy production will peak as early as the mid-2030s.
The world is facing a conundrum: on the one hand, there is growing realization that the world is facing an existential threat of global warming/climate change and the realization that it is at best difficult [87,88,89,90] to impossible [9,38,91] to achieve. When reviewing China and India, the problem is that they are developing economies and energy is needed to move their economies to developed status. However, if developing (and developed) economies use their coal reserves to achieve economic growth, the effects on the global climate will be disastrous and perhaps existential. If we are to be good stewards of the Earth, then most of the world’s developing countries are unlikely to achieve developed status. The greatest role that these and other developing nations around the world have in climate change mitigation is one of seeking renewable means of development and not development based around fossil fuels. This is not a simple task, nor is it one that these economies can be expected to achieve on their own.
Cheap renewable energy should be the world’s primary concern as many of the other major issues facing the world can be relieved, at least in part, by sufficient access to energy [92]. In general, though environmental concern exists across income levels, increased wealth usually results in increased valuation of the environment [93]. Our previous work [38], as well as Ahmed et al. [94] suggested that up-front investments in RES now will prove more valuable than continuing to import cost-increasing fossil fuels. Implementation of energy into population projections remains an important area for further research. Demographic transitions as a result of increased per capita energy consumption in the developing world are vital to the global transition towards RES infrastructure and climate adaptation in China, India, and the rest of the world.
The 21st century coal question is not one of geologic supply, but of atmospheric capacity [95,96,97]. China and India are growing their economies, and steadily improving quality of life indices; however, these accomplishments require cheap energy (and the cheapest is coal). The true breakthrough will be achieving economic and social development without surpassing short-term climate goals (i.e., INDCs) and contributing to global efforts to achieve the long-term < 2 °C warming limit. Our findings lead us to make the following recommendations. Reducing the consumption of coal is a global issue, not limited to economic or social development status. All countries must work together towards reducing carbon emissions. Technology, education, and responsibility must be shared, regardless of national or cultural delineation. Climate goals are unachievable without cooperation from both the high energy consumers and those looking to become high consumers. Investing the remaining 781 GtCO2 in the form of the energy required to build out a global renewable energy infrastructure is more than a noble goal or political hot air. Sustainable energy for all is our only hope to limit global warming and to offer a responsible pathway for developing countries to reach developed status.
The final conclusion to the coal question is that both coal and renewable energy will be crucial throughout the 21st century. This is not just a climate change issue; it is a paired issue that requires a focused effort towards providing the energy needed to accommodate increased population and increase per capita energy availability. Developing countries are going to take the measures necessary to provide for their people even at the expense of climate concerns.
Author Contributions
The authors declare the following contributions: conceptualization, K.W. and G.J.; methodology, K.W.; validation, G.J. and K.W.; resources, G.J.; data curation, K.W.; writing—original draft preparation, K.W.; writing—review and editing, G.J.; visualization, K.W.; supervision, G.J.; project administration, G.J.
Funding
This research received no external funding.
Conflicts of Interest
The authors declare no conflict of interest.
References
- Jevons, W.S. The Coal Question: An Inquiry Concerning the Progress of the Nation, and the Probable Exhaustion of Our Coal Mines; Macmillan & Co: London, UK, 1865. [Google Scholar]
- Andres, R.J.; Boden, T.A.; Breon, F.M.; Ciais, P.; Davis, S.; Erickson, D.; Gregg, J.S.; Jacobson, A.; Marland, G.; Miller, J.; et al. A synthesis of carbon dioxide emissions from fossil-fuel combustion. Biogeosciences 2012, 9, 1845–1871. [Google Scholar] [CrossRef] [Green Version]
- Pachauri, R.K.; Allen, M.; Barros, V.; Broome, J.; Cramer, W.; Christ, R.; Church, J.; Clarke, L.; Dahe, Q.; Dasgupta, P. Climate Change 2014: Synthesis Report. Contribution of Working Groups I, II and III to the Fifth Assessment Report of the Intergovernmental Panel on Climate Change; IPCC: Geneva, Switzerland, 2014. [Google Scholar]
- British Petroleum. Statistical Review of World Energy 2018, 67th ed.; British Petroleum: London, UK, 2018. [Google Scholar]
- Randalls, S. History of the 2 °C climate target. WIREs Clim Chang. 2010, 1, 598–605. [Google Scholar] [CrossRef]
- Wrigley, E.A. Energy and the English Industrial Revolution. Philos. Trans. R. Soc. A Math. Phys. Eng. Sci. 2013, 371, 10. [Google Scholar] [CrossRef] [PubMed]
- Voigtlander, N.; Voth, H.J. Why England? Demographic factors, structural change and physical capital accumulation during the Industrial Revolution. J. Econ. Growth 2006, 11, 319–361. [Google Scholar] [CrossRef] [Green Version]
- UN DESA. UN World Population Prospects: The 2017 Revision. Available online: https://www.un.org/development/desa/publications/world-population-prospects-the-2017-revision.html (accessed on 19 August 2019).
- Jones, G.A.; Warner, K.J. The 21st century population-energy-climate nexus. Energ Policy 2016, 93, 206–212. [Google Scholar] [CrossRef]
- Gerland, P.; Raftery, A.E.; Sevcikova, H.; Li, N.; Gu, D.A.; Spoorenberg, T.; Alkema, L.; Fosdick, B.K.; Chunn, J.; Lalic, N.; et al. World population stabilization unlikely this century. Science 2014, 346, 234–237. [Google Scholar] [CrossRef] [PubMed] [Green Version]
- OECD G20. Available online: http://www.oecd.org/g20/ (accessed on 22 January 2018).
- Wilson, J.D. Resource powers? Minerals, energy and the rise of the BRICS. Third World Q. 2015, 36, 223–239. [Google Scholar] [CrossRef]
- Hubbert, M.K. Techniques of prediction as applied to the production of oil and gas. In oil and gas supply modelling; National Bureau of Standards: Gaithersburg, MD, USA, 1982. [Google Scholar]
- Maggio, G.; Cacciola, G. When will oil, natural gas, and coal peak? Fuel 2012, 98, 111–123. [Google Scholar] [CrossRef]
- Mohr, S.H.; Wang, J.; Ellem, G.; Ward, J.; Giurco, D. Projection of world fossil fuels by country. Fuel 2015, 141, 120–135. [Google Scholar] [CrossRef]
- Wang, J.L.; Feng, L.Y.; Tverberg, G.E. An analysis of China’s coal supply and its impact on China’s future economic growth. Energy Policy 2013, 57, 542–551. [Google Scholar] [CrossRef]
- Warner, K.J.; Jones, G.A. A population-induced renewable energy timeline in nine world regions. Energy Policy 2017, 101, 65–76. [Google Scholar] [CrossRef]
- Meng, M.; Niu, D.X.; Shang, W. CO2 emissions and economic development: China’s 12th five-year plan. Energy Policy 2012, 42, 468–475. [Google Scholar] [CrossRef]
- Wei, S. Letter on China’s Autonomous Domestic Mitigation Actions. Available online: https://unfccc.int/files/meetings/cop_15/copenhagen_accord/application/pdf/chinacphaccord_app2.pdf (accessed on 19 August 2019).
- Wang, L.R. Sea Lanes and Chinese National Energy Security. J. Coast. Res. 2015, 73, 572–576. [Google Scholar] [CrossRef]
- UNFCCC. Enhanced actions on climate change: China’s intended nationally determined contributions. Available online: http://www4.unfccc.int/submissions/INDC/Published%20Documents/China/1/China’s%20INDC%20-%20on%2030%20June%202015.pdf (accessed on 18 August 2019).
- Chacko, P. The New Geo-Economics of a “Rising” India: State Transformation and the Recasting of Foreign Policy. J. Contemp. Asia 2015, 45, 326–344. [Google Scholar] [CrossRef]
- UNFCCC. India’s intended nationally determined contribution: Working towards climate justice. Available online: http://www4.unfccc.int/submissions/INDC/Published%20Documents/India/1/INDIA%20INDC%20TO%20UNFCCC.pdf (accessed on 18 August 2019).
- van Ruijven, B.J.; Weitzel, M.; den Elzen, M.G.J.; Hof, A.F.; van Vuuren, D.P.; Peterson, S.; Narita, D. Emission allowances and mitigation costs of China and India resulting from different effort-sharing approaches. Energy Policy 2012, 46, 116–134. [Google Scholar] [CrossRef]
- Kubiszewski, I.; Costanza, R.; Franco, C.; Lawn, P.; Talberth, J.; Jackson, T.; Aylmer, C. Beyond GDP: Measuring and achieving global genuine progress. Ecol. Econ. 2013, 93, 57–68. [Google Scholar] [CrossRef] [Green Version]
- Zhao, H.; Fan, Y.; Li, N.; Li, F.; Hu, Y. A co-integration analysis between electricity consumption and economic development in Hebei Province. Int. J. Energy Power Eng. 2015, 4, 1–6. [Google Scholar] [CrossRef]
- Chakravorty, U.; Pelli, M.; Ural Marchand, B. Does the quality of electricity matter? Evidence from rural India. J. Econ. Behav. Organ. 2014, 107, 228–247. [Google Scholar] [CrossRef] [Green Version]
- Paul, S.; Bhattacharya, R.N. Causality between energy consumption and economic growth in India: A note on conflicting results. Energy Econ 2004, 26, 977–983. [Google Scholar] [CrossRef]
- Anhal, R. Causality between GDP, Energy and Coal Consumption in India, 1970-2011: A Non-parametric Bootstrap Approach. Int. J. Energy Econ. Policy 2013, 3, 434–446. [Google Scholar]
- Caldwell, J.C. Toward a restatement of demographic transition theory. Popul. Dev. Rev. 1976, 2, 321–366. [Google Scholar] [CrossRef]
- Hussain, A. Demographic transition in China and its implications. World Dev. 2002, 30, 1823–1834. [Google Scholar] [CrossRef]
- Bhat, P.N.M. Returning a favor: Reciprocity between female education and fertility in India. World Dev. 2002, 30, 1791–1803. [Google Scholar] [CrossRef]
- WB World Development Indicators. Available online: http://data.worldbank.org/data-catalog/world-development-indicators (accessed on 18 August 2019).
- Lambert, J.G.; Hall, C.A.S.; Balogh, S.; Gupta, A.; Arnold, M. Energy, EROI and quality of life. Energy Policy 2014, 64, 153–167. [Google Scholar] [CrossRef] [Green Version]
- von Bertalanffy, L. Untersuchungen über die Gesetzlichkeit des Wachstums. Dev. Genes Evol. 1934, 131, 613–652. [Google Scholar]
- Rutledge, D. Estimating long-term world coal production with logit and probit transforms. Int. J. Coal Geol 2011, 85, 23–33. [Google Scholar] [CrossRef] [Green Version]
- Hubbert, M.K. Drilling and production practice, 1956. In Nuclear Energy and the Fossil Fuels; American Petroleum Institute: Washington, DC, USA, 1956. [Google Scholar]
- Warner, K.; Jones, G. Energy and Population in Sub-Saharan Africa: Energy for Four Billion? Environments 2018, 5, 107. [Google Scholar] [CrossRef]
- Lin, B.-Q.; Liu, J.-H. Estimating coal production peak and trends of coal imports in China. Energy Policy 2010, 38, 512–519. [Google Scholar] [CrossRef]
- Lin, B.Q.; Wang, T. Forecasting natural gas supply in China: Production peak and import trends. Energy Policy 2012, 49, 225–233. [Google Scholar] [CrossRef]
- Wang, J.L.; Feng, L.Y.; Zhao, L.; Snowden, S. China’s natural gas: Resources, production and its impacts. Energy Policy 2013, 55, 690–698. [Google Scholar] [CrossRef]
- Darda, M.A.; Guseo, R.; Mortarino, C. Nonlinear production path and an alternative reserves estimate for South Asian natural gas. Renew. Sustain. Energy Rev. 2015, 47, 654–664. [Google Scholar] [CrossRef]
- Piovani, C.; Li, M.Q. Climate Change and the Limits to the Growth-Oriented Model of Development: The Case of China and India. Rev. Radic. Political Econ. 2013, 45, 449–455. [Google Scholar] [CrossRef]
- Walsh, S.; Tian, H.F.; Whalley, J.; Agarwal, M. China and India’s participation in global climate negotiations. Int. Environ. Agreem. -Politics Law Econ. 2011, 11, 261–273. [Google Scholar] [CrossRef]
- Asif, M.; Muneer, T. Energy supply, its demand and security issues for developed and emerging economies. Renew. Sustain. Energy Rev. 2007, 11, 1388–1413. [Google Scholar] [CrossRef]
- Lucas, R.E. On the mechanics of economic-development. J. Monet. Econ. 1988, 22, 3–42. [Google Scholar] [CrossRef]
- UN World Economic Situation and Prospects 2015. Available online: http://www.un.org/en/development/desa/policy/wesp/archive.shtml#2015 (accessed on 18 August 2019).
- Hoskisson, R.E.; Eden, L.; Lau, C.M.; Wright, M. Strategy in emerging economies. Acad. Manag. J. 2000, 43, 249–267. [Google Scholar]
- Hall, C.A. Economic development or developing economies: What are our priorities? In Ecosystem Rehabilitation; Wali, M.K., Ed.; SPB Academic Publishing: London, UK, 1992; pp. 101–126. [Google Scholar]
- Shahbaz, M.; Khan, S.; Tahir, M.I. The dynamic links between energy consumption, economic growth, financial development and trade in China: Fresh evidence from multivariate framework analysis. Energy Econ. 2013, 40, 8–21. [Google Scholar] [CrossRef]
- Chen, W.Y.; Li, H.L.; Wu, Z.X. Western China energy development and west to east energy transfer: Application of the Western China Sustainable Energy Development Model. Energy Policy 2010, 38, 7106–7120. [Google Scholar] [CrossRef]
- Hu, J.L.; Wang, S.C. Total-factor energy efficiency of regions in China. Energy Policy 2006, 34, 3206–3217. [Google Scholar] [CrossRef]
- Zhang, Z.X. China in the transition to a low-carbon economy. Energy Policy 2010, 38, 6638–6653. [Google Scholar] [CrossRef] [Green Version]
- Ghosh, S. Electricity consumption and economic growth in India. Energy Policy 2002, 30, 125–129. [Google Scholar] [CrossRef]
- Harris, G. Coal Rush in India Could Tip Balance on Climate Change. Available online: http://www.nytimes.com/2014/11/18/world/coal-rush-in-india-could-tip-balance-on-climate-change.html?_r=1 (accessed on 18 August 2019).
- Das, K.N.; Wilkes, T. India says Paris climate deal won’t affect plans to double coal output. Available online: https://www.reuters.com/article/us-climatechange-summit-india-coal-idUSKBN0TX15F20151214 (accessed on 18 August 2019).
- Wang, S.J.; Li, Q.Y.; Fang, C.L.; Zhou, C.S. The relationship between economic growth, energy consumption, and CO2 emissions: Empirical evidence from China. Sci. Total Environ. 2016, 542, 360–371. [Google Scholar] [CrossRef] [PubMed]
- Massetti, E. Carbon tax scenarios for China and India: Exploring politically feasible mitigation goals. Int. Environ. Agreem. PoliticsLaw Econ. 2011, 11, 209. [Google Scholar] [CrossRef]
- Cleveland, C.J.; Costanza, R.; Hall, C.A.S.; Kaufmann, R. Energy and the United States economy—a biophysical perspective. Science 1984, 225, 890–897. [Google Scholar] [CrossRef] [PubMed]
- Bongaarts, J.; Greenhalgh, S. An alternative to the one-child policy in China. Popul. Dev. Rev. 1985, 11, 585–617. [Google Scholar] [CrossRef]
- Kulkarni, P.M. The Population and Development Scenario in India. In Population and Reproductive Health in India: An Assessment of the Current Situation and Future Needs; Oxford University Press: Oxford, UK, 2014. [Google Scholar]
- Dreze, J.; Murthi, M. Fertility, education, and development: Evidence from India. Popul. Dev. Rev. 2001, 27, 33. [Google Scholar] [CrossRef]
- Ram, B. Fertility Decline and Family Change in India: A Demographic Perspective. J. Comp. Fam. Stud. 2012, 43, 11. [Google Scholar] [CrossRef]
- Moursund, A.; Kravdal, O. Individual and community effects of women’s education and autonomy on contraceptive use in India. Popul. Stud. 2003, 57, 285–301. [Google Scholar] [CrossRef]
- Paul, V.K.; Sachdev, H.S.; Mavalankar, D.; Ramachandran, P.; Sankar, M.J.; Bhandari, N.; Sreenivas, V.; Sundararaman, T.; Govil, D.; Osrin, D.; et al. India: Towards Universal Health Coverage 2 Reproductive health, and child health and nutrition in India: Meeting the challenge. Lancet 2011, 377, 332–349. [Google Scholar] [CrossRef]
- Caldwell, J.C. Mass education as a determinant of the timing of fertility decline. Popul. Dev. Rev. 1980, 6, 225–255. [Google Scholar] [CrossRef]
- Colleran, H.; Jasienska, G.; Nenko, I.; Galbarczyk, A.; Mace, R. Community-level education accelerates the cultural evolution of fertility decline. Proc. R. Soc. B-Biol. Sci. 2014, 281, 7. [Google Scholar] [CrossRef]
- Kravdal, O. Education and fertility in sub-Saharan Africa: Individual and community effects. Demography 2002, 39, 233–250. [Google Scholar] [CrossRef] [PubMed]
- Behrman, J.A. Does Schooling Affect Women’s Desired Fertility? Evidence From Malawi, Uganda, and Ethiopia. Demography 2015, 52, 787–809. [Google Scholar] [CrossRef] [PubMed]
- Guilmoto, C.Z. Skewed Sex Ratios at Birth and Future Marriage Squeeze in China and India, 2005–2100. Demography 2012, 49, 77–100. [Google Scholar] [CrossRef] [PubMed]
- Xinhua News Agency. Authorized Release: Eighteenth Communist Party of China Central Committee communique fifth plenary meeting. Available online: http://news.xinhuanet.com/politics/2015-10/29/c_1116983078.htm, 2015 (accessed on 18 August 2019).
- Banerjee, S.G.; Bhatia, M.; Azuela, G.E.; Jaques, I.; Sarkar, A.; Portale, E.; Bushueva, I.; Angelou, N.; Inon, J.G. Global tracking framework. In Sustainable energy for all; The World Bank: Washington, DC, USA, 2013. [Google Scholar]
- Bonjour, S.; Adair-Rohani, H.; Wolf, J.; Bruce, N.G.; Mehta, S.; Pruss-Ustun, A.; Lahiff, M.; Rehfuess, E.A.; Mishra, V.; Smith, K.R. Solid Fuel Use for Household Cooking: Country and Regional Estimates for 1980–2010. Environ. Health Perspect. 2013, 121, 784–790. [Google Scholar] [CrossRef] [PubMed]
- de Graaf, F. New Strategies For Smart Integrated Decentralised Energy Systems. Available online: https://www.metabolic.nl/projects/side-systems/ (accessed on 18 August 2019).
- Morstyn, T.; Hredzak, B.; Agelidis, V. Control Strategies for Microgrids with Distributed Energy Storage Systems: An Overview. IEEE Trans. Smart Grid 2016, 9, 3652–3666. [Google Scholar] [CrossRef]
- Bauwens, T.; Devine-Wright, P. Positive energies? An empirical study of community energy participation and attitudes to renewable energy. Energy Policy 2018, 118, 612–625. [Google Scholar] [CrossRef]
- Dang, J.; Li, C.; Li, J.; Dang, A.; Zhang, Q.; Chen, P.; Kang, S.; Dunn-Rankin, D. Emissions from Solid Fuel Cook Stoves in the HimalayaRegion. Energies 2019, 12, 1089. [Google Scholar] [CrossRef]
- Liu, Y.S.; Yan, B.; Zhou, Y. Urbanization, economic growth, and carbon dioxide emissions in China: A panel cointegration and causality analysis. J. Geogr. Sci. 2016, 26, 131–152. [Google Scholar] [CrossRef]
- Cao, Z.; Wei, J.; Chen, H.B. CO2 emissions and urbanization correlation in China based on threshold analysis. Ecol. Indic. 2016, 61, 193–201. [Google Scholar]
- Chen, B.Z.; Feng, Y. Determinants of economic growth in China: Private enterprise, education, and openness. China Econ. Rev. 2000, 11, 1–15. [Google Scholar] [CrossRef]
- Mai, Y.H.; Peng, X.J.; Chen, W. How fast is the population ageing in China? Asian Popul. Stud. 2013, 9, 216–239. [Google Scholar] [CrossRef]
- Gibson, J.; Boe-Gibson, G.; Stichbury, G. Urban land expansion in India 1992–2012. Food Policy 2015, 56, 100–113. [Google Scholar] [CrossRef]
- Dobbs, R.; Sanke, S. Comparing urbanization in China and India. McKinsey Q. 2010, 7, 1–3. [Google Scholar]
- Pandey, B.; Seto, K.C. Urbanization and agricultural land loss in India: Comparing satellite estimates with census data. J. Environ. Manag. 2015, 148, 53–66. [Google Scholar] [CrossRef] [PubMed]
- Das, P. The urban sanitation conundrum: What can community-managed programmes in India unravel? Environ. Urban. 2015, 27, 505–524. [Google Scholar] [CrossRef]
- Sorrell, S. Reducing energy demand: A review of issues, challenges and approaches. Renew. Sustain. Energy Rev. 2015, 47, 74–82. [Google Scholar] [CrossRef] [Green Version]
- Smil, V. The Long Slow Rise of Solar and Wind. Sci. Am. 2014, 310, 52–57. [Google Scholar] [CrossRef]
- Smil, V. Energy transitions: History, requirements, prospects; ABC-CLIO: Santa Barbara, CA, USA, 2010. [Google Scholar]
- Jacobson, M.Z.; Delucchi, M.A.; Bazouin, G.; Bauer, Z.A.F.; Heavey, C.C.; Fisher, E.; Morris, S.B.; Piekutowski, D.J.Y.; Vencill, T.A.; Yeskoo, T.W. 100% clean and renewable wind, water, and sunlight (WWS) all-sector energy roadmaps for the 50 United States. Energy Environ. Sci. 2015, 8, 2093–2117. [Google Scholar] [CrossRef]
- Jacobson, M.Z.; Delucchi, M.A. Providing all global energy with wind, water, and solar power, Part I: Technologies, energy resources, quantities and areas of infrastructure, and materials. Energy Policy 2011, 39, 1154–1169. [Google Scholar] [CrossRef]
- Warner, K.J.; Jones, G.A. The Climate-Independent Need for Renewable Energy in the 21st Century. Energies 2017, 10, 1197. [Google Scholar] [CrossRef]
- Smalley, R.E. Future global energy prosperity: The terawatt challenge. Mrs Bull. 2005, 30, 412–417. [Google Scholar] [CrossRef]
- Dorsch, M.T. Economic development and determinants of environmental concern. Soc. Sci. Q. 2014, 95, 960–977. [Google Scholar] [CrossRef]
- Ahmed, S.; Islam, M.T.; Karim, M.A.; Karim, N.M. Exploitation of renewable energy for sustainable development and overcoming power crisis in Bangladesh. Renew. Energy 2014, 72, 223–235. [Google Scholar] [CrossRef]
- McGlade, C.; Ekins, P. The geographical distribution of fossil fuels unused when limiting global warming to 2 °C. Nature 2015, 517, 187. [Google Scholar] [CrossRef] [PubMed]
- Arrhenius, S. On the influence of carbonic acid in the air upon the temperature of the ground. Phil. Mag. 1896, 41, 237–276. [Google Scholar] [CrossRef]
- Revelle, R.; Suess, H.E. Carbon Dioxide Exchange between Atmosphere and Ocean and the Question of an Increase of Atmospheric CO2 during the Past Decades. Tellus 1957, 9, 18–27. [Google Scholar] [CrossRef]
Figure 1.
Per capita energy scenario projections, 2017–2100. Per capita energy consumption measured in gigajoules per person (GJ/person).
Figure 1.
Per capita energy scenario projections, 2017–2100. Per capita energy consumption measured in gigajoules per person (GJ/person).
Figure 2.
Total energy demand in each population/consumption scenario for China and India. Demands are based on the 2017 UN population estimates [8]. Includes historical percentage of total global energy consumption on second axis.
Figure 2.
Total energy demand in each population/consumption scenario for China and India. Demands are based on the 2017 UN population estimates [8]. Includes historical percentage of total global energy consumption on second axis.

Figure 3.
Share of total carbon emission, limited to < 2 °C goal, 1870–2100. Includes 2017 population share-based (2017 limited) and 2100 population share-based (2100 limited) models. Climate goal limits carbon emissions to 2,900 gigatonnes of carbon dioxide equivalent (GtCO2eq) from 1870–2100, with 1890 of those emitted from 1870–2010 [3]. Global emissions from 2011–2017 totaled 229 GtCO2 [4]. Remaining 21st century carbon emissions partitioned by country based on percent of population in either 2017 or 2100, as per the medium fertility population projections [8]. ROW indicates the rest of the world.

Figure 4.
(a) Modeled coal production in China, 1980–2100; (b) Modeled coal production in India, 1980–2100.
Figure 4.
(a) Modeled coal production in China, 1980–2100; (b) Modeled coal production in India, 1980–2100.

Figure 5.
(a) Imported and/or non-hydro renewable energy demand, China 1980–2100; (b) Imported and/or non-hydro renewable energy demand, India 1980–2100. These curves represent the modeled dependency upon imported and/or non-hydro renewable energy.
Figure 5.
(a) Imported and/or non-hydro renewable energy demand, China 1980–2100; (b) Imported and/or non-hydro renewable energy demand, India 1980–2100. These curves represent the modeled dependency upon imported and/or non-hydro renewable energy.


Table 1.
Coal reserves, carbon emissions potential of said coal reserves, and percent global population per reserve scenario, year-end 2017. Coal reserves have been converted from source units into exajoules. CO2 is measured in gigatonnes of carbon dioxide equivalent. Share of global population in each country is based on the medium fertility population projection [8].
| China | |||
| Unlimited | 2017-limited | 2100-limited | |
| Coal (EJ) | 3775 | 1312 | 525 |
| Coal Peak | 2026 | 2013 | 2013 |
| CO2 (GtCO2) | 357 | 124 | 50 |
| % Population | - | 18.7 | 9.1 |
| India | |||
| Unlimited | 2017-limited | 2100-limited | |
| Coal (EJ) | 2667 | 1418 | 1073 |
| Coal Peak | 2075 | 2052 | 2044 |
| CO2 (GtCO2) | 252 | 134 | 102 |
| % Population | - | 17.7 | 13.6 |
© 2019 by the authors. Licensee MDPI, Basel, Switzerland. This article is an open access article distributed under the terms and conditions of the Creative Commons Attribution (CC BY) license (http://creativecommons.org/licenses/by/4.0/).
Share and Cite
MDPI and ACS Style
Warner, K.J.; Jones, G.A. The 21st Century Coal Question: China, India, Development, and Climate Change. Atmosphere 2019, 10, 476. https://doi.org/10.3390/atmos10080476
AMA Style
Warner KJ, Jones GA. The 21st Century Coal Question: China, India, Development, and Climate Change. Atmosphere. 2019; 10(8):476. https://doi.org/10.3390/atmos10080476
Chicago/Turabian StyleWarner, Kevin J., and Glenn A. Jones. 2019. "The 21st Century Coal Question: China, India, Development, and Climate Change" Atmosphere 10, no. 8: 476. https://doi.org/10.3390/atmos10080476
Note that from the first issue of 2016, this journal uses article numbers instead of page numbers. See further details here.