Article

Impact of Desert Dust on Air Quality: What is the Meaningfulness of Daily PM Standards in Regions Close to the Sources? The Example of Southern Tunisia

by
Christel Bouet
1,2,*,
Mohamed Taieb Labiadh
3,
Jean Louis Rajot
1,2,
Gilles Bergametti
2,
Béatrice Marticorena
2,
Thierry Henry des Tureaux
1,
Mohsen Ltifi
3,
Saâd Sekrafi
3 and
Anaïs Féron
2
1
iEES Paris (Institut d’Ecologie et des Sciences de l’Environnement de Paris), UMR IRD 242, Université Paris Est Créteil—Sorbonne Université—CNRS—INRA—Université de Paris, F-93143 Bondy, France
2
LISA (Laboratoire Interuniversitaire des Systèmes Atmosphériques), UMR CNRS 7583, Université Paris Est Créteil—Université de Paris, Institut Pierre Simon Laplace, F-94010 Créteil, France
3
IRA (Institut des Régions Arides) de Médenine, El Fjé 4119, Tunisia
*
Author to whom correspondence should be addressed.
Atmosphere 2019, 10(8), 452; https://doi.org/10.3390/atmos10080452
Submission received: 21 June 2019 / Revised: 26 July 2019 / Accepted: 29 July 2019 / Published: 6 August 2019
(This article belongs to the Special Issue Studying the Effects of Dust on Weather, Climate, and Air Pollution)

Abstract

:
Desert dust is now recognized as a major health hazard. However, there still exists a lack of measurements of desert dust atmospheric loads in regions located in the vicinity of the major desert areas, where a growing part of the world population is living. Dust emission is a sporadic and intense phenomenon so that the classical air quality standards should not be appropriate to reflect the real population exposure to desert dust. In order to give some insight to answer this question, PM10 concentrations were continuously measured at a five-minute time step in southern Tunisia from February 2014 to February 2019. The daily and annual PM10 concentrations were first discussed according to the Tunisian air quality standards: In this relatively remote area, close to dust source, these standards were respected at the annual, but no longer at the daily scale. Measurements performed at a high temporal resolution (five minutes) allowed to discriminate the different situations that led to exceed Tunisian daily standards in southern Tunisia. In particular, intense (five-minute PM10 concentrations up to more than 1500 µg m−3) and short-lived (a few hours) dust outbreaks were regularly observed. This result raises the question of the necessity of defining specific air quality standards at the sub-daily scale in countries affected by intense desert dust outbreaks.

1. Introduction

During recent decades, more and more attention has been paid to the atmospheric level of particulate matter (PM), especially for their potential impact on human health. Indeed, the fine particles can be inhaled and, according to their diameter, can enter the respiratory system up to the alveoli (e.g., [1,2,3]) so that they are now considered as a major health hazard (e.g., [4,5,6,7]).
Among them, mineral dust, also commonly referred to as desert dust because of their geographical origins, is of crucial interest as it represents about 30% to 35% of the total mass of aerosols emitted into the atmosphere every year [8]. Most of the dust emissions come from the Sahara Desert, followed by Chinese and Central Asian deserts, the Arabian Peninsula, and the Australian deserts [9]. The population living in the vicinity of these regions can be exposed to very high levels of mineral dust concentrations. Considering their physical, chemical, and biological properties, the impacts of desert dust on human health have been widely studied: Since 2010, about ten literature reviews dealing with the impact of desert dust on human health were published [9,10,11,12,13,14,15,16,17]. Indeed, since mineral dust covers a large size spectrum, ranging from some tenths of µm to 40 or 50 µm in diameter, these particles induce various impacts on human health. Particles with diameters larger than 10 µm are not inhaled, but are mainly responsible for skin and eye irritations or infections [11,15,17]. Breathable particles, those smaller than 10 µm in diameter (PM10), are frequently trapped inside the upper respiratory system, while the smallest ones are associated with respiratory disorders such as asthma, tracheitis, pneumonia, allergic rhinitis, and silicosis [11,15]. Death and injuries are also associated with transport accidents due to a reduction of the visibility during dust storms (e.g., [18]). Giannadaki et al. [19], based on a modelling study of the PM smaller than 2.5 µm in diameter (PM2.5), suggested that desert dust are responsible for a large number of premature deaths by cardiopulmonary diseases and for a significant number of deaths by lung cancer, mostly in the “dust belt” region (which is defined as an area of strong desert dust sources that extends from the west coast of North Africa, through the Middle East, South and Central Asia, to eastern China). These results was supported by the previous findings by Evans et al. [20] who used, for the first time, satellite imagery to assess the expected number of deaths due to chronic PM2.5 exposure. These authors found that the PM2.5 premature mortality in the Mediterranean region (several countries in North Africa and in the Middle East) was mainly related to the non-anthropogenic component (dust) of total PM2.5. Giannadaki et al. [19] also estimated 3.56 million as the annual years of human life lost per year associated to desert dust PM2.5 exposure.
Even if countries located in the “dust belt” region are the most impacted by desert dust, de Longueville et al. [10,21] pointed out the fact that a few epidemiological studies were conducted in this area. In particular, none of the studies listed by these authors were conducted in Africa, and only one in the Middle East. After having conducted the same type of bibliographic investigation as de Longueville et al. [10], we found that: (i) For the period October 2011–August 2017, the number of epidemiological studies focusing on the impact of desert dust on human health has significantly increased (50 studies for the period January 1999–September 2011 [10] compared to 111 for the period October 2011–August 2017); and (ii) such epidemiological studies are now conducted in the countries located in the “dust belt”—the majority of these studies concerns the Middle East (including Iran, Israel, Kuwait and Saudi Arabia), but a few of them concerned African countries (zero in the Maghreb). de Longueville et al. [10] identified two main causes to this lack of information on the effect of dust on the population living in the countries bordering the Sahara: (i) The absence of systematic particulate air pollution data (e.g., [22]); and (ii) poor-quality public health data that could be used to adequately support impact studies (e.g., [23]). The absence of systematic particulate air pollution data is still a reality when focusing on Africa: In the 2016 update of the WHO Global Urban Ambient Air Pollution Database (http://www.who.int/phe/health_topics/outdoorair/databases/cities/en/), which reports annual means of PM2.5 and PM10 concentrations measured throughout the world (2975 locations), measurements for only 52 cities located in 13 African countries are reported, including seven cities in Morocco and four cities in Tunisia.
The south of Tunisia is a region located at the northern border of the Sahara Desert. It is composed of five Governorates (Tataouine, Médenine, Gabès, Kébili, and Tozeur) representing about one million of inhabitants (i.e., 9% of the whole population of Tunisia) [24]. It is a region where soils are sandy, the precipitation scarce, and the vegetation sparse, so that wind erosion, the mechanism that produces mineral dust, is very active. Moreover, the development of mechanized agriculture has increased wind erosion during the last decades (e.g., [25]). Finally, this region is known to be one of the main pathways for air masses coming from the Sahara to the central Mediterranean Basin [26,27,28,29,30,31,32,33]. For all these reasons, dust haze is frequently observed in southern Tunisia: For the period 1965–2011, the annual mean number of days of “dusty wind” was 74 in El Borma (Governorate of Tataouine), 63 in Tozeur, 45 in Remada (Governorate of Tataouine) and in Kébili, 23 in Médenine, 20 in Gabès, and 18 in Djerba [34].
In 2007, Tunisia adopted air quality standards to ensure every citizen the right to a healthy environment and sustainable development (Law No. 2007-34 of 4 June 2007 on air quality). Standards for airborne particles (PM10 [35,36]) were defined with daily and annual limit values for health and for well-being (Table 1). Tunisian air quality standards fix an annual limit value relative to health of 80 µg m−3, which is twice higher than the European air quality standards for PM10 (40 µg m−3) and four times higher than the WHO air quality guidelines for PM10 (20 µg m−3; [37]). Considering the second air quality standard defined on the daily level, the limit value of concentration relative to health in Tunisia cannot exceed 260 µg m−3 more than once a year while in Europe, a daily mean PM10 concentration of 50 µg m−3 (as defined by the WHO and which is about 1/5 of the Tunisian daily limit) cannot be exceeded more than 35 times per year.
In this framework, a national network of air quality monitoring stations (Réseau National de Surveillance de la Qualité de l’Air (RNSQA); www.anpe.nat.tn) has been deployed. In 2011, 30 stations were already installed in the main urban and industrial sites of northern Tunisia, and seven allowed the measurement of PM10 concentrations by means of automatic beta radiation attenuation monitors [35,36]. However, none of these stations are located in the south of the country; therefore, population exposure to high desert dust atmospheric loads is not characterized. To do so, as a first step, PM10 concentration has to be monitored in a remote place, closer to dust sources and away from other sources of pollutants, especially from anthropogenic activities. This is why, in February 2014, a ground-based station dedicated to the monitoring of PM10 concentration was installed in the campus of the Institut des Régions Arides (IRA) of Médenine. At the monitoring station of El Fjé, measurements are performed with a short time step (five minutes) in order to assess, as well as possible, the high concentration periods.
In this paper, PM10 concentrations measured during the period February 2014–February 2019 at the station of El Fjé in southern Tunisia are discussed first according to the Tunisian air quality standards, but also according to the way these standards were exceeded. This allows one to conclude on the relevance of actual air quality standards used in regions downwind of active desert dust sources.

2. Materials and Methods

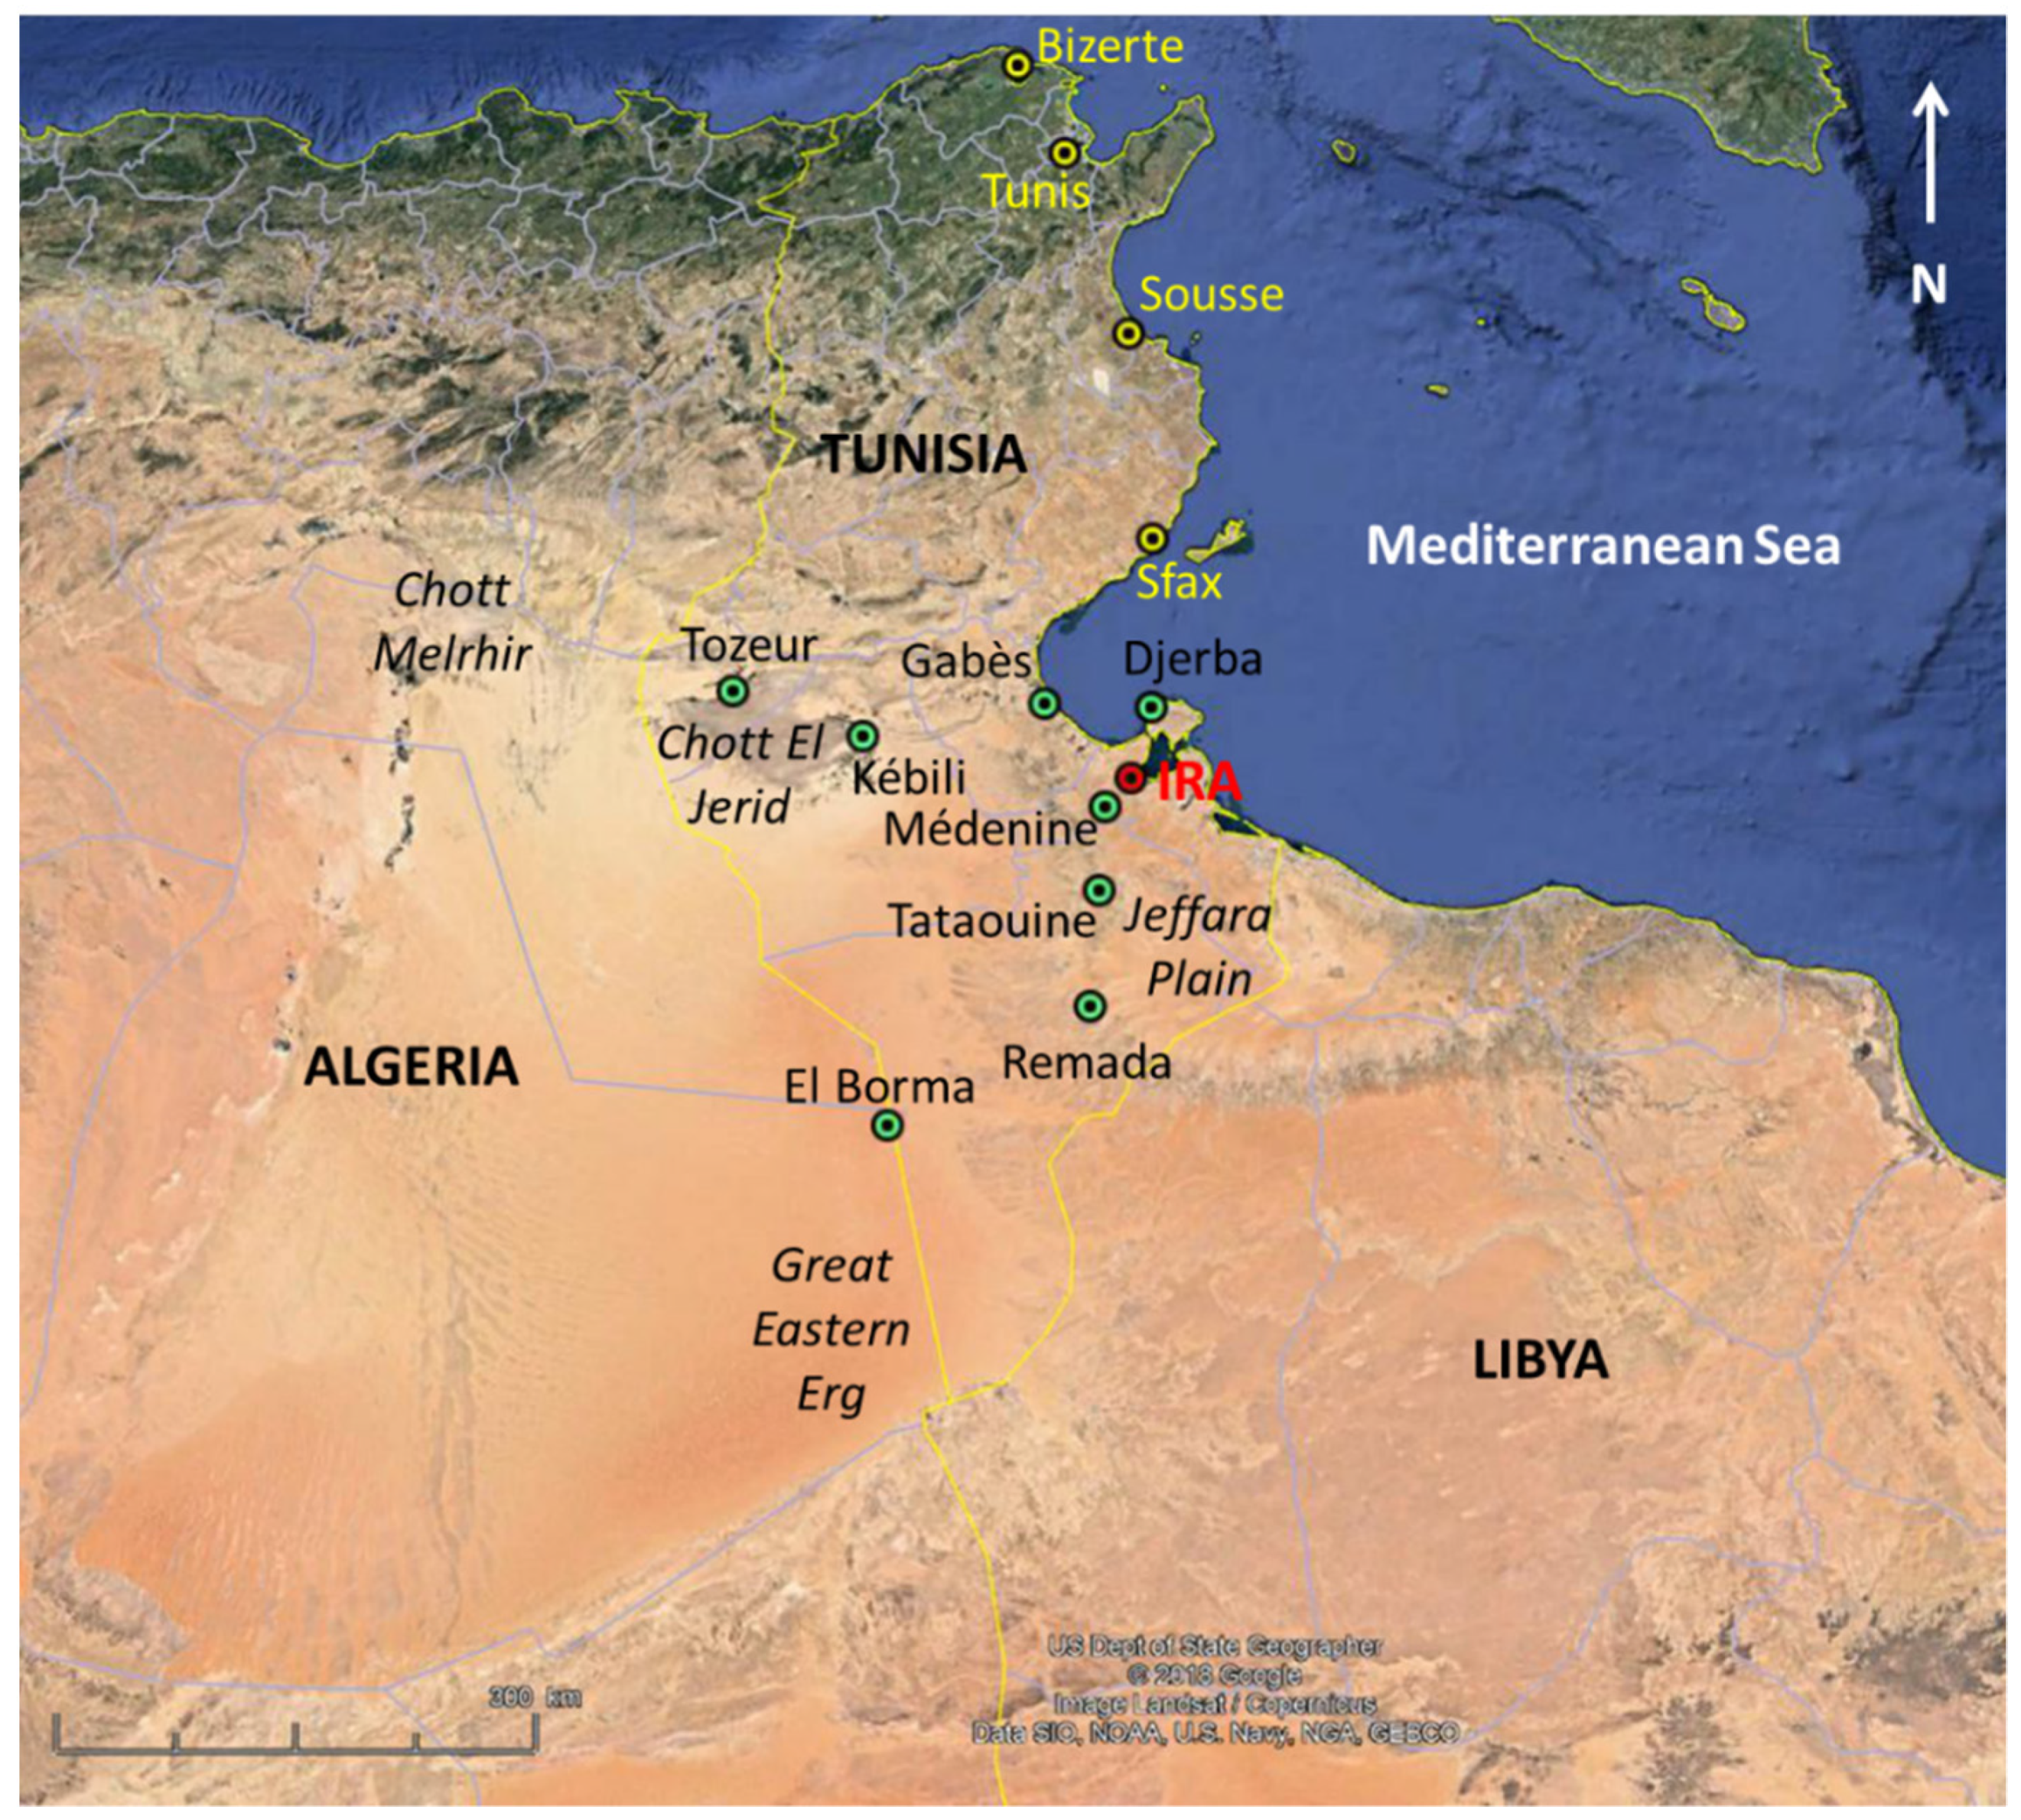
2.1. Location of the Station

The dust station is installed inside the campus of the IRA Médenine in El Fjé (33.49963N; 10.64255E), as identified by the red dot in the satellite image in Figure 1. This place is located away from any other pollutant sources, especially from anthropogenic origin (biomass burning, road traffic, etc.) and is representative of the atmospheric background of the region. Indeed, the surroundings of the station are an agricultural area, mainly dominated by olive tree plantations, the most important town, Médenine (about 70,000 inhabitants [24]), being at more than 20 km south west. The Mediterranean Sea is about 5 km to the east, and 20 km to the north, while the Matmata Mounts are about 50 km to the west. From a climatological point of view, the monitoring station is located in the north east of the Jeffara plain, in the arid part of Tunisia where mean annual rainfalls ranging between 135 and 215 mm yr−1 were recorded during the 1949–2001 period in 8 meteorological stations [38].

2.2. Instruments and Method

The monitoring station of El Fjé was set up following the model of the stations of the Sahelian Dust Transect deployed in the Sahel since 2006 ([39]; http://www.lisa.u-pec.fr/SDT/index.php?p=1), now part of the International Network to Study Deposition and Atmospheric chemistry in AFrica (INDAAF; https://indaaf.obs-mip.fr/?rubrique38). The same kind of instruments were chosen for their capability to resist severe dusty and meteorological conditions. All these instruments were installed at 2 m height from the flat roof of the higher building of the campus (i.e., about 14.5 m above the ground level).

2.2.1. PM10 Concentration

PM10 concentrations were measured using a Tapered Element Oscillating Microbalance (TEOM™ 1405 from Thermo ScientificTM, Franklin (MA), USA) equipped with a PM10 inlet (Thermo ScientificTM). This instrument, widely used in air quality networks, allows one to measure atmospheric particulate concentrations ranging from a few micrograms up to one gram per cubic meter.
The microbalance was installed in an air-conditioned room to maintain ideal conditions for the TEOM™ sensor and control units. It was positioned about 5 m vertically below the PM10 inlet. The flow rate is 3 L min−1 and the averaging time is 5 min in these operational conditions, the nominal precision of the instrument is ± 2.0 µg m−3 for 1 h averaging, and ± 1.0 µg m−3 for 24 h averaging.
The lower part of the sampling tube (60 cm length) and the measurement chamber of the TEOM™ were heated at a temperature of 50 °C in order to allow a thermal stability of the particles and the filter and to minimize water condensation interferences. This heating may induce a loss of a part of the most volatile particulate compounds, such as ammonium nitrates or condensate organic compounds [40,41]. Thus, the contribution of carbonaceous and/or anthropogenic aerosols to the PM10 concentration is probably slightly underestimated when using this type of measurement. Moreover, the heating of the sampled air can lead to negative values of PM10 concentrations when relative humidity is high, and PM10 concentrations especially low. This can be observed during intrusions of air masses coming from the sea and lightly loaded in PM.

2.2.2. Sunphotometric Measurements

A Cimel sunphotometer from the AERONET (AErosol RObotic NETwork)/PHOTONS (Photométrie pour le Traitement Opérationnel de Normalisation Satellitaire) network ([42]; http://aeronet.gsfc.nasa.gov/) was installed in July 2014 at the monitoring station. This instrument allows one to retrieve the Aerosol Optical Depth (AOD) and the corresponding Angström exponent (α) from the measurements of the direct solar radiation at 4 wavelengths (1020, 870, 675, and 440 nm) during daytime [43,44]. In this study, data of level 1.5 (i.e., quality checked data) were used because data of level 2.0 (i.e., quality checked and cloud screened data) was only available until 27 September 2018.

2.2.3. Data Selection

The monthly recovery rate ranged between 65 and nearly 100% for PM10 concentrations (see Table A1 in Appendix A), with the exception of October 2015 when the main electronic card of the TEOM™ broke down. Most of the time, missing data corresponded to particular events such as operations of maintenance on the instruments (filters changing, cleaning, control, etc.), electricity failures, or break down of the computer connections.
In order to compare to the Tunisian air quality standards, daily mean PM10 concentrations were computed. Firstly, the hourly mean PM10 concentration was computed from the 5 min measurements. Secondly, the daily mean PM10 concentration was computed from the hourly mean PM10 concentration (without accounting for the hourly negative values when there were). Considering a one-month period, 9% at a maximum (in June/July) of the hourly mean PM10 concentration were removed for the computation of the daily mean PM10 concentration because it was negative. For the rest of the year, negative values of the hourly mean PM10 concentration never accounted for more than 5% of the total values for one month.
As it was mentioned in Section 2.2.1., the cases corresponding to negative values of the hourly mean PM10 concentration were mainly cases during which PM10 concentration was low. Thus, eliminating these negative values for the computation of the daily mean PM10 concentration could generate a bias (i.e., could lead to overestimation of daily means). In a context of air quality, this could produce “false” excesses of air quality standards, and the impact of PM10 could be overestimated. In order to test the impact of the method used to compute the daily mean PM10 concentration, we replaced the negative hourly values (instead of removing them) by the nominal precision of the instrument for 1 h averaging (i.e., 2.0 µg m−3). In these conditions, the coefficient of determination R² between the daily mean PM10 concentrations computed using these two methods was 0.9995 with a slope of 0.999 for the regression line (N = 1790). In terms of air quality, a difference of 1 day over the 5-year period was observed between the two methods when estimating the number of times the limit values relative to well-being and relative to health were exceeded. As a conclusion, we can consider that removing the negative values of the hourly mean PM10 concentration for the computation of the daily mean PM10 concentration does not significantly affect the results that are presented and discussed in the present paper.

3. Results and Discussion

3.1. Tunisian Air Quality Standards

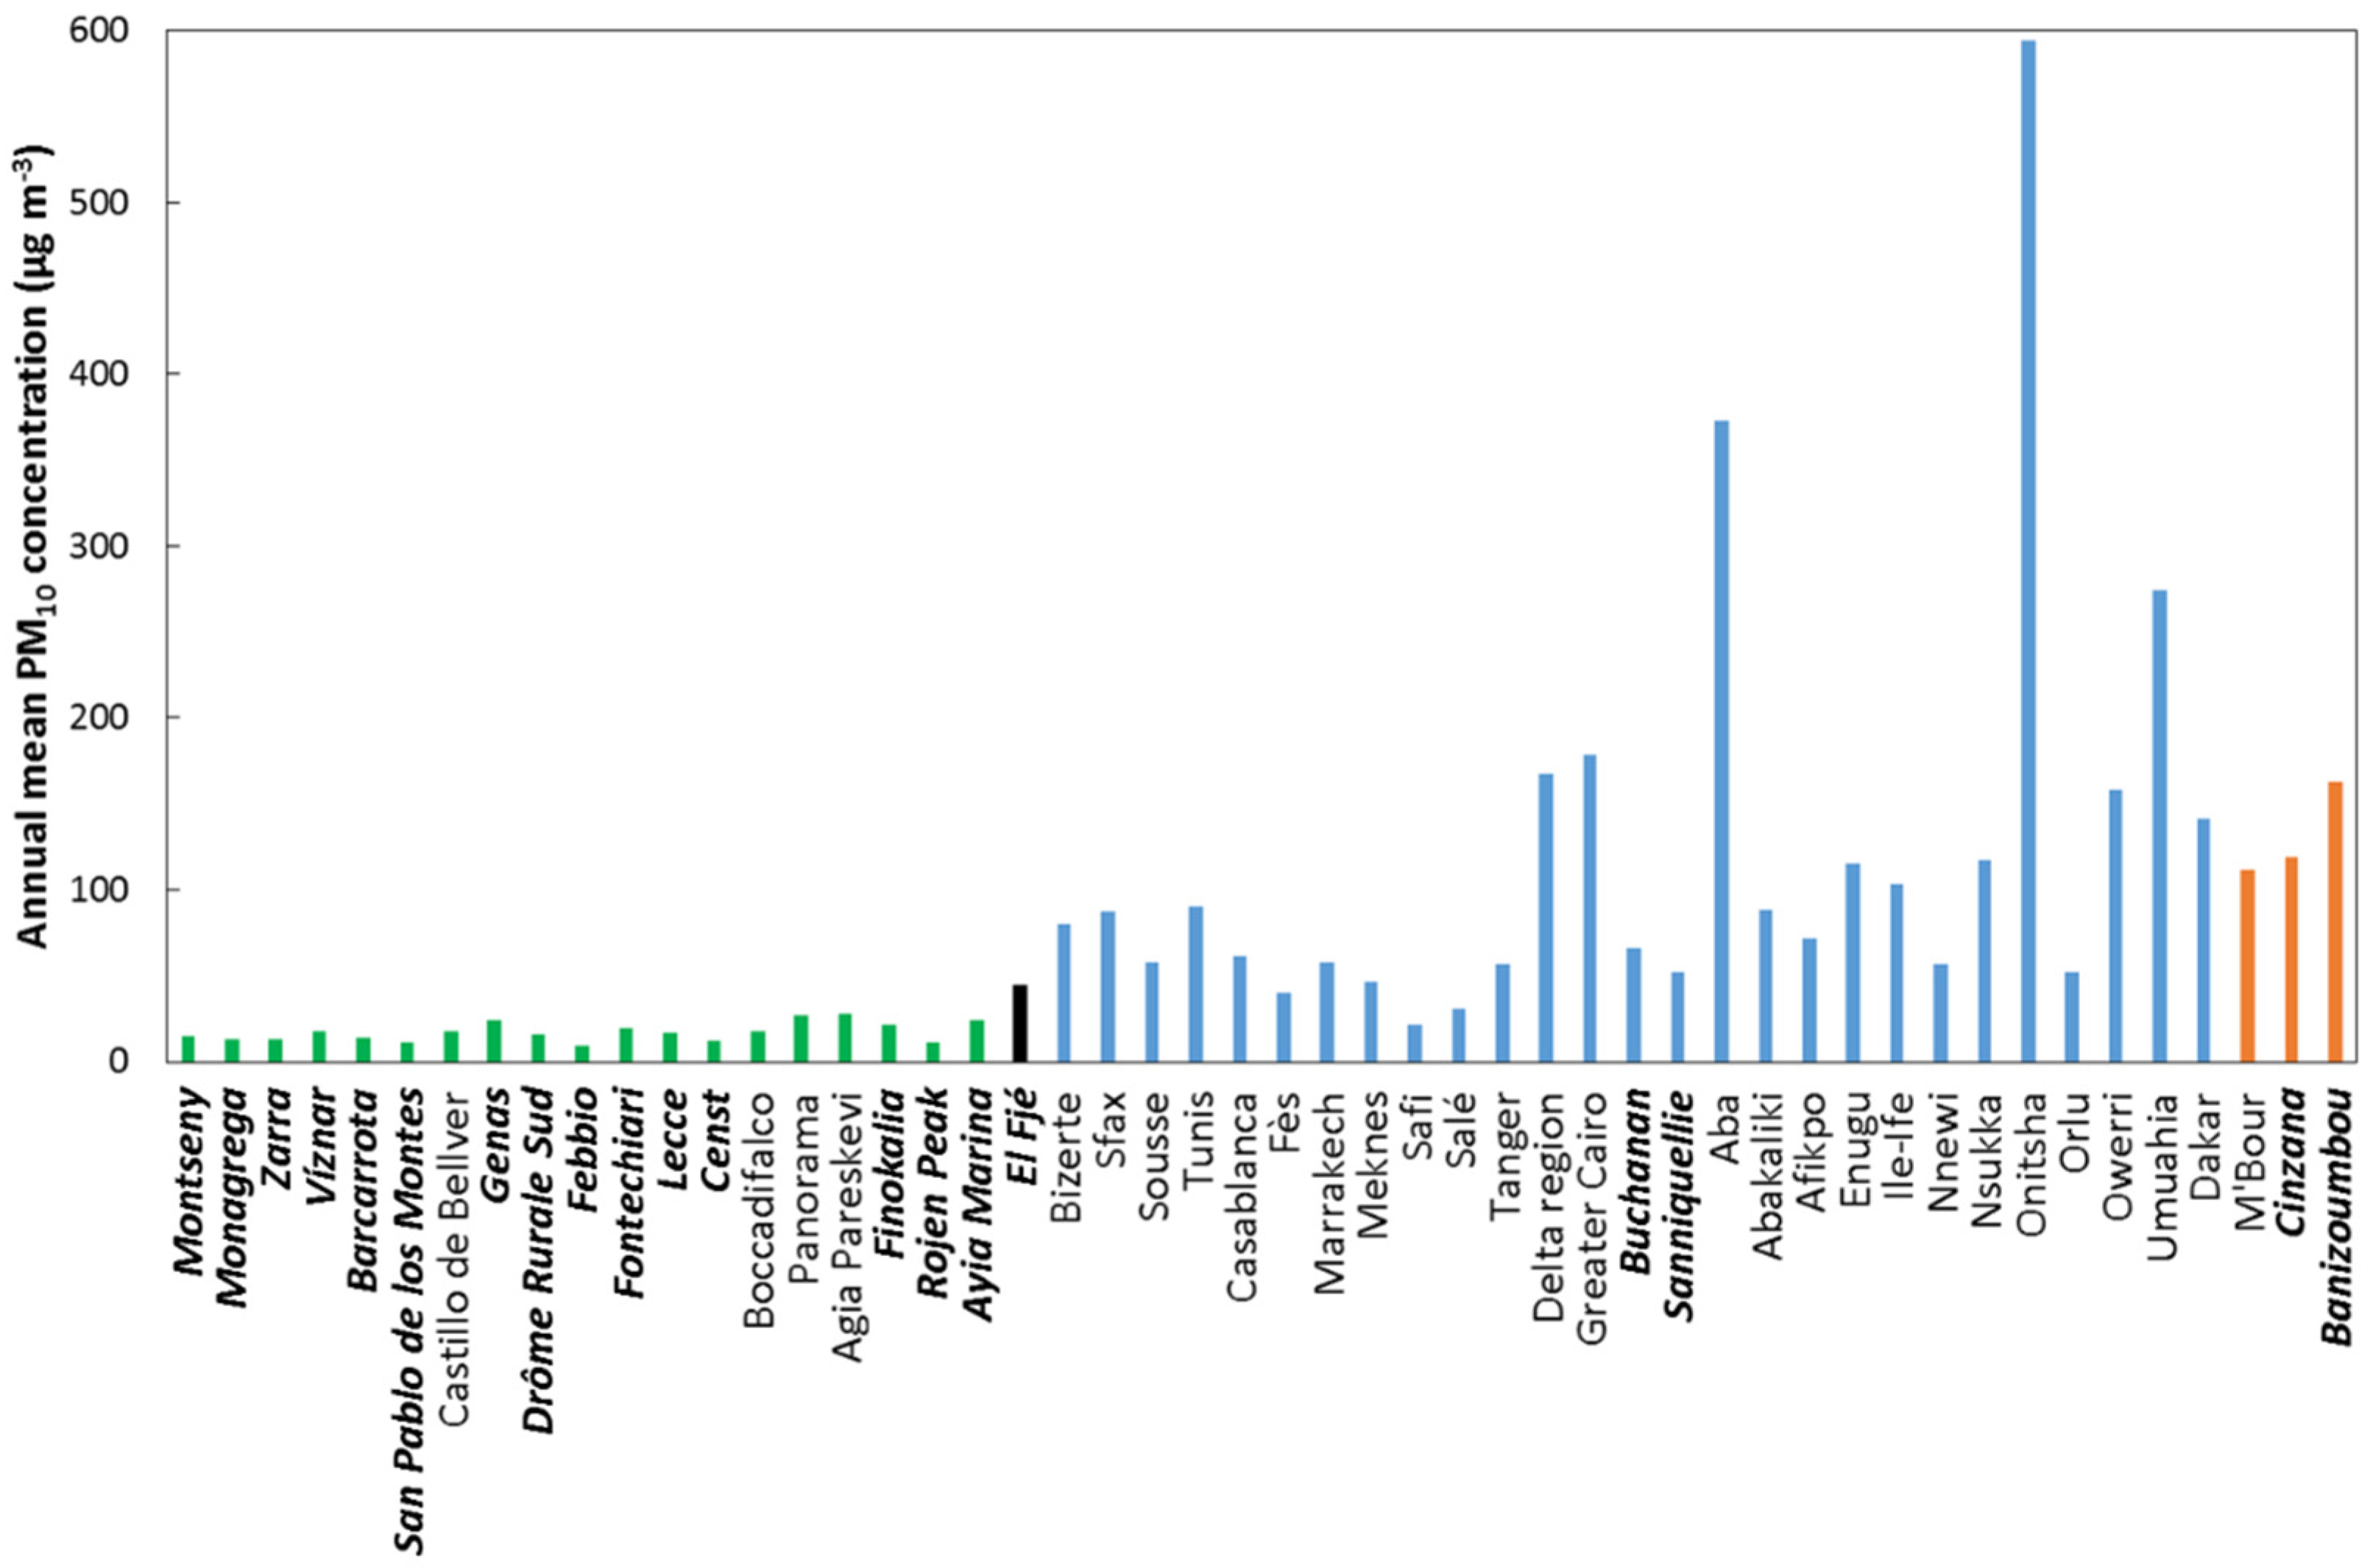
3.1.1. Annual Mean PM10 Concentrations

The annual mean concentrations of PM10 in El Fjé range between 32 and 56 µg m−3 from 2014 to 2018 (Table 2). These values are lower than 60 µg m−3 for all years respecting both the limit values relative to health and to well-being defined by Tunisian air quality standards for airborne particles (Table 1). On the other hand, for the five years, the WHO air quality guidelines for PM10 were exceeded by, at least, a factor 1.5 (Table 2).
Figure 2 presents an inventory of the most recent available measurements of annual mean PM10 concentrations in the countries downwind the Sahara and frequently impacted by Saharan dust outbreaks (i.e., North Africa, South Europe, and West Africa). Firstly, it can be noted that most of the available measurements are located in urban and suburban areas (63%): Only 20 stations (upon 116 in total) are classified as rural or regional background stations (see Table A2 in Appendix B). El Fjé appears as the unique rural station in Tunisia and, to a regional extent, in North Africa. The annual mean PM10 concentrations measured in El Fjé are low (about three times lower for 2017) compared to those measured in the northern Tunisian urban centers (except Sousse—see measurements reported for Bizerte, Sfax, and Tunis in Figure 2). On the other hand, the annual mean PM10 concentrations measured in El Fjé are 1.6 to 5 times higher than the values reported by Pey et al. [45] for south European urban centers located farther from the dust sources (Figure 2). Finally, the annual mean PM10 concentrations measured in El Fjé are 2.5 to 3.5 times lower than what can be measured at the rural stations in the Sahel (see measurements reported for Cinzana and Banizoumbou by Kaly et al. [46] in Figure 2), which suggests that southern Tunisia is not a dust source or a pathway for Saharan dust transport as important as the Sahel is.

3.1.2. Daily Mean PM10 Concentrations

The Tunisian air quality standards were no longer respected at the daily time scale in El Fjé: during the period 12 February 2014–28 February 2019, the daily limit value relative to health was exceeded 40 times (i.e., 2% of all the measured PM10 concentrations), while the daily limit value relative to well-being was exceeded 107 times (i.e., 6% of all the measured PM10 concentrations) (see Table A3 in Appendix C).
Figure 3 presents the monthly frequency of occurrence of days with daily mean PM10 concentrations greater than 120 and 260 µg m−3. Daily air quality standards were more frequently exceeded during winter (DJF) and spring (MAM), than in autumn (SON) and summer (JJA), during which it is frequently null. This seasonal cycle follows the seasonal cycle of desert dust outbreaks observed in this region, strongly suggesting that desert dust aerosols were responsible for daily air quality standards excesses. Indeed, Moulin et al. [31] reported that April was a period of intense dust uplift over North Africa because of the Sharav cyclones [47], and that the major source regions for the Mediterranean were: (i) South Tunisia around 30° N for the western central basin [26], and Libyan desert just below 30° N for the eastern central basin [48]. More recently, Fiedler et al. [49] showed that above 20° N, up to 80% of desert dust emissions was due to atmospheric depressions whose frequency over the north of Africa is the highest between March and May, and then between December and February.
Despite this obvious mean annual cycle, daily mean PM10 concentration highly varied throughout the year (Figure 4): High daily mean PM10 concentrations were frequently observed, sometimes recorded during several consecutive days, and can be greater than 1500 µg m−3 (up to 1642 µg m−3 on 22 March 2016). As a comparison, in the Sahel, where dust also dominate the background concentrations, the maximum daily PM10 concentrations were 4020 µg m−3 in Banizoumbou, 2503 µg m−3 in Cinzana, and 2250 µg m−3 in M’Bour over the period 2006–2008, and daily mean PM10 concentrations greater than 100 µg m−3 represented about 40% of all the measured daily mean PM10 concentrations [39].

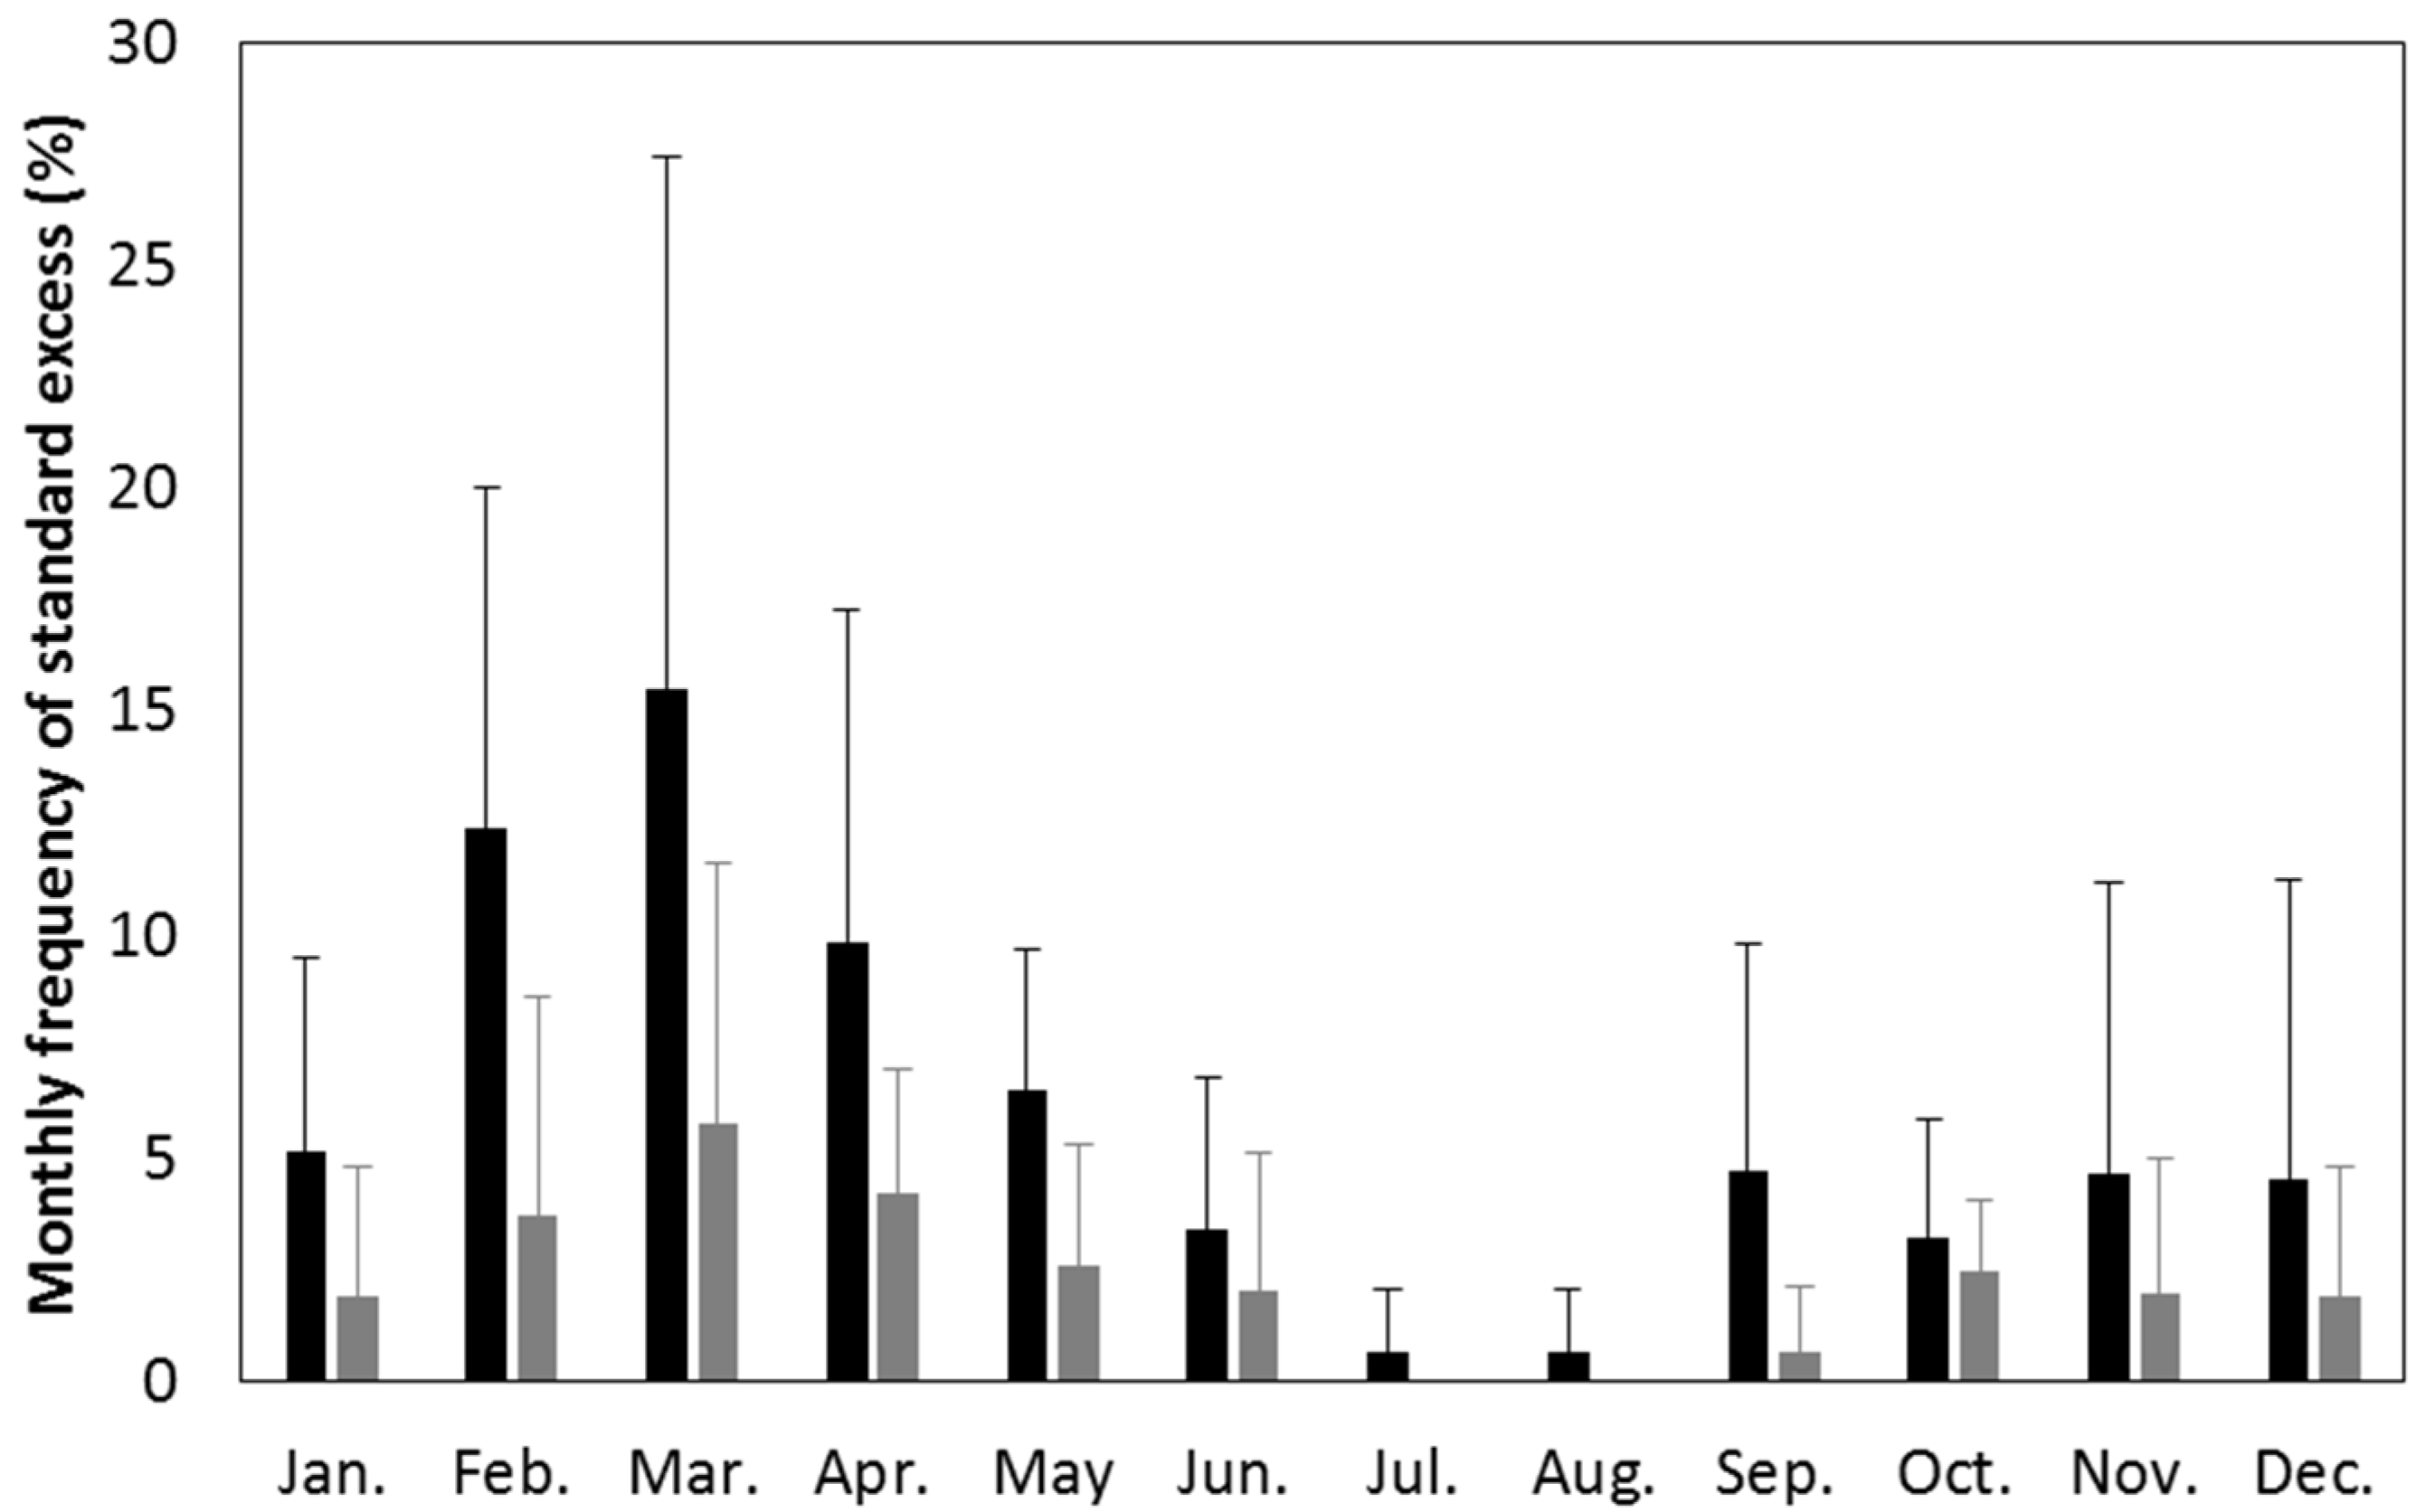
3.2. The Situations of the Excess of the Tunisian Daily Air Quality Standards

3.2.1. Nature of the Aerosol

In order to identify the type(s) of particles responsible for the 107 excesses of the Tunisian daily limit value relative to well-being, we used as an indicator the Angström exponent (440–870 nm), α440–870. Indeed, Holben et al. [50] considered that α440–870 values less than 0.4 are typical of situations dominated by coarse aerosols (sea salt, mineral dust) whereas larger α440–870 values denote the presence of submicron aerosols such as those produced by biomass burning or other combustion processes. Figure 5 reports the daily minimum α440–870 as a function of the daily mean PM10 concentration for the whole period. It can be seen that, for all days (except one) with a daily mean PM10 concentration greater than 120 µg m−3, the daily minimum α440–870 is systematically lower than 0.4, which means that AOD was strongly controlled by coarse particles. Kchih et al. [51] analyzed the composition of PM10 collected in the southern Mediterranean coast of Tunis. These authors found that in all sites where PM10 were collected, these particles were mainly composed, in mass, of crustal matter (45%–50%) and poorly of sea salt (3%–4%), which showed that aerosol chemical composition was slightly impacted by the nearby Mediterranean Sea. These results confirm that the recorded PM10 maximums in El Fjé were due to mineral dust.

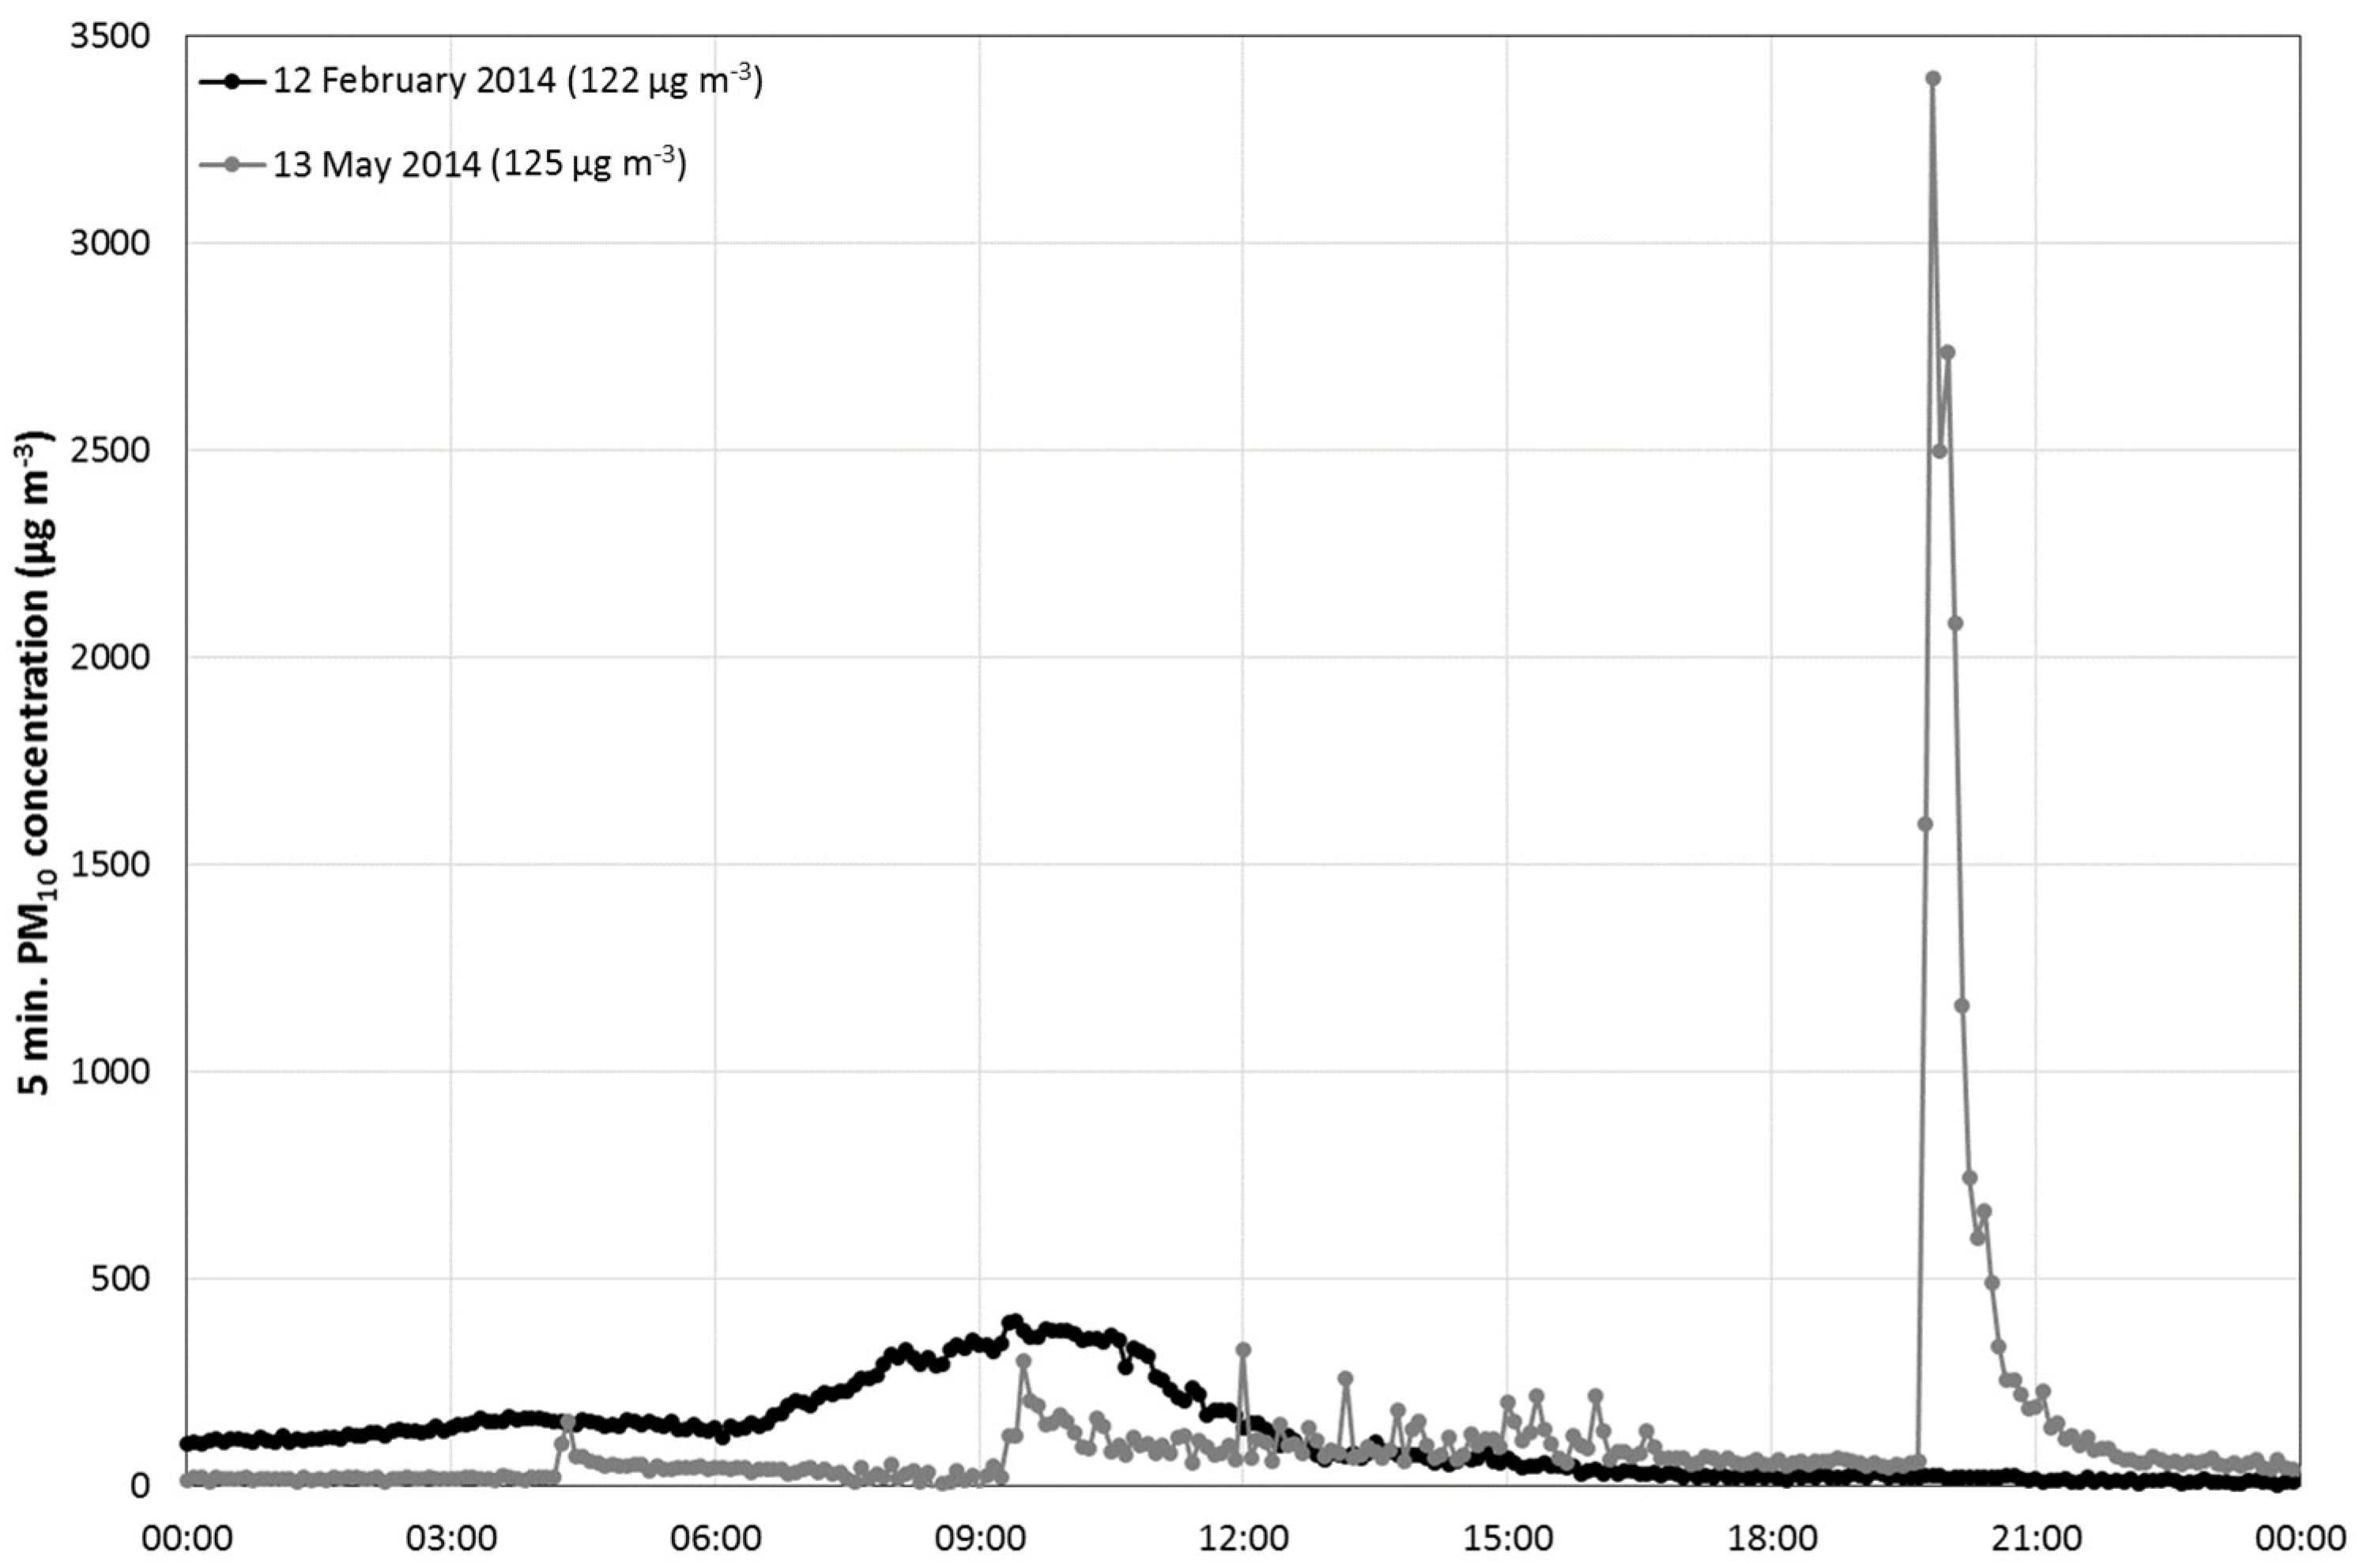
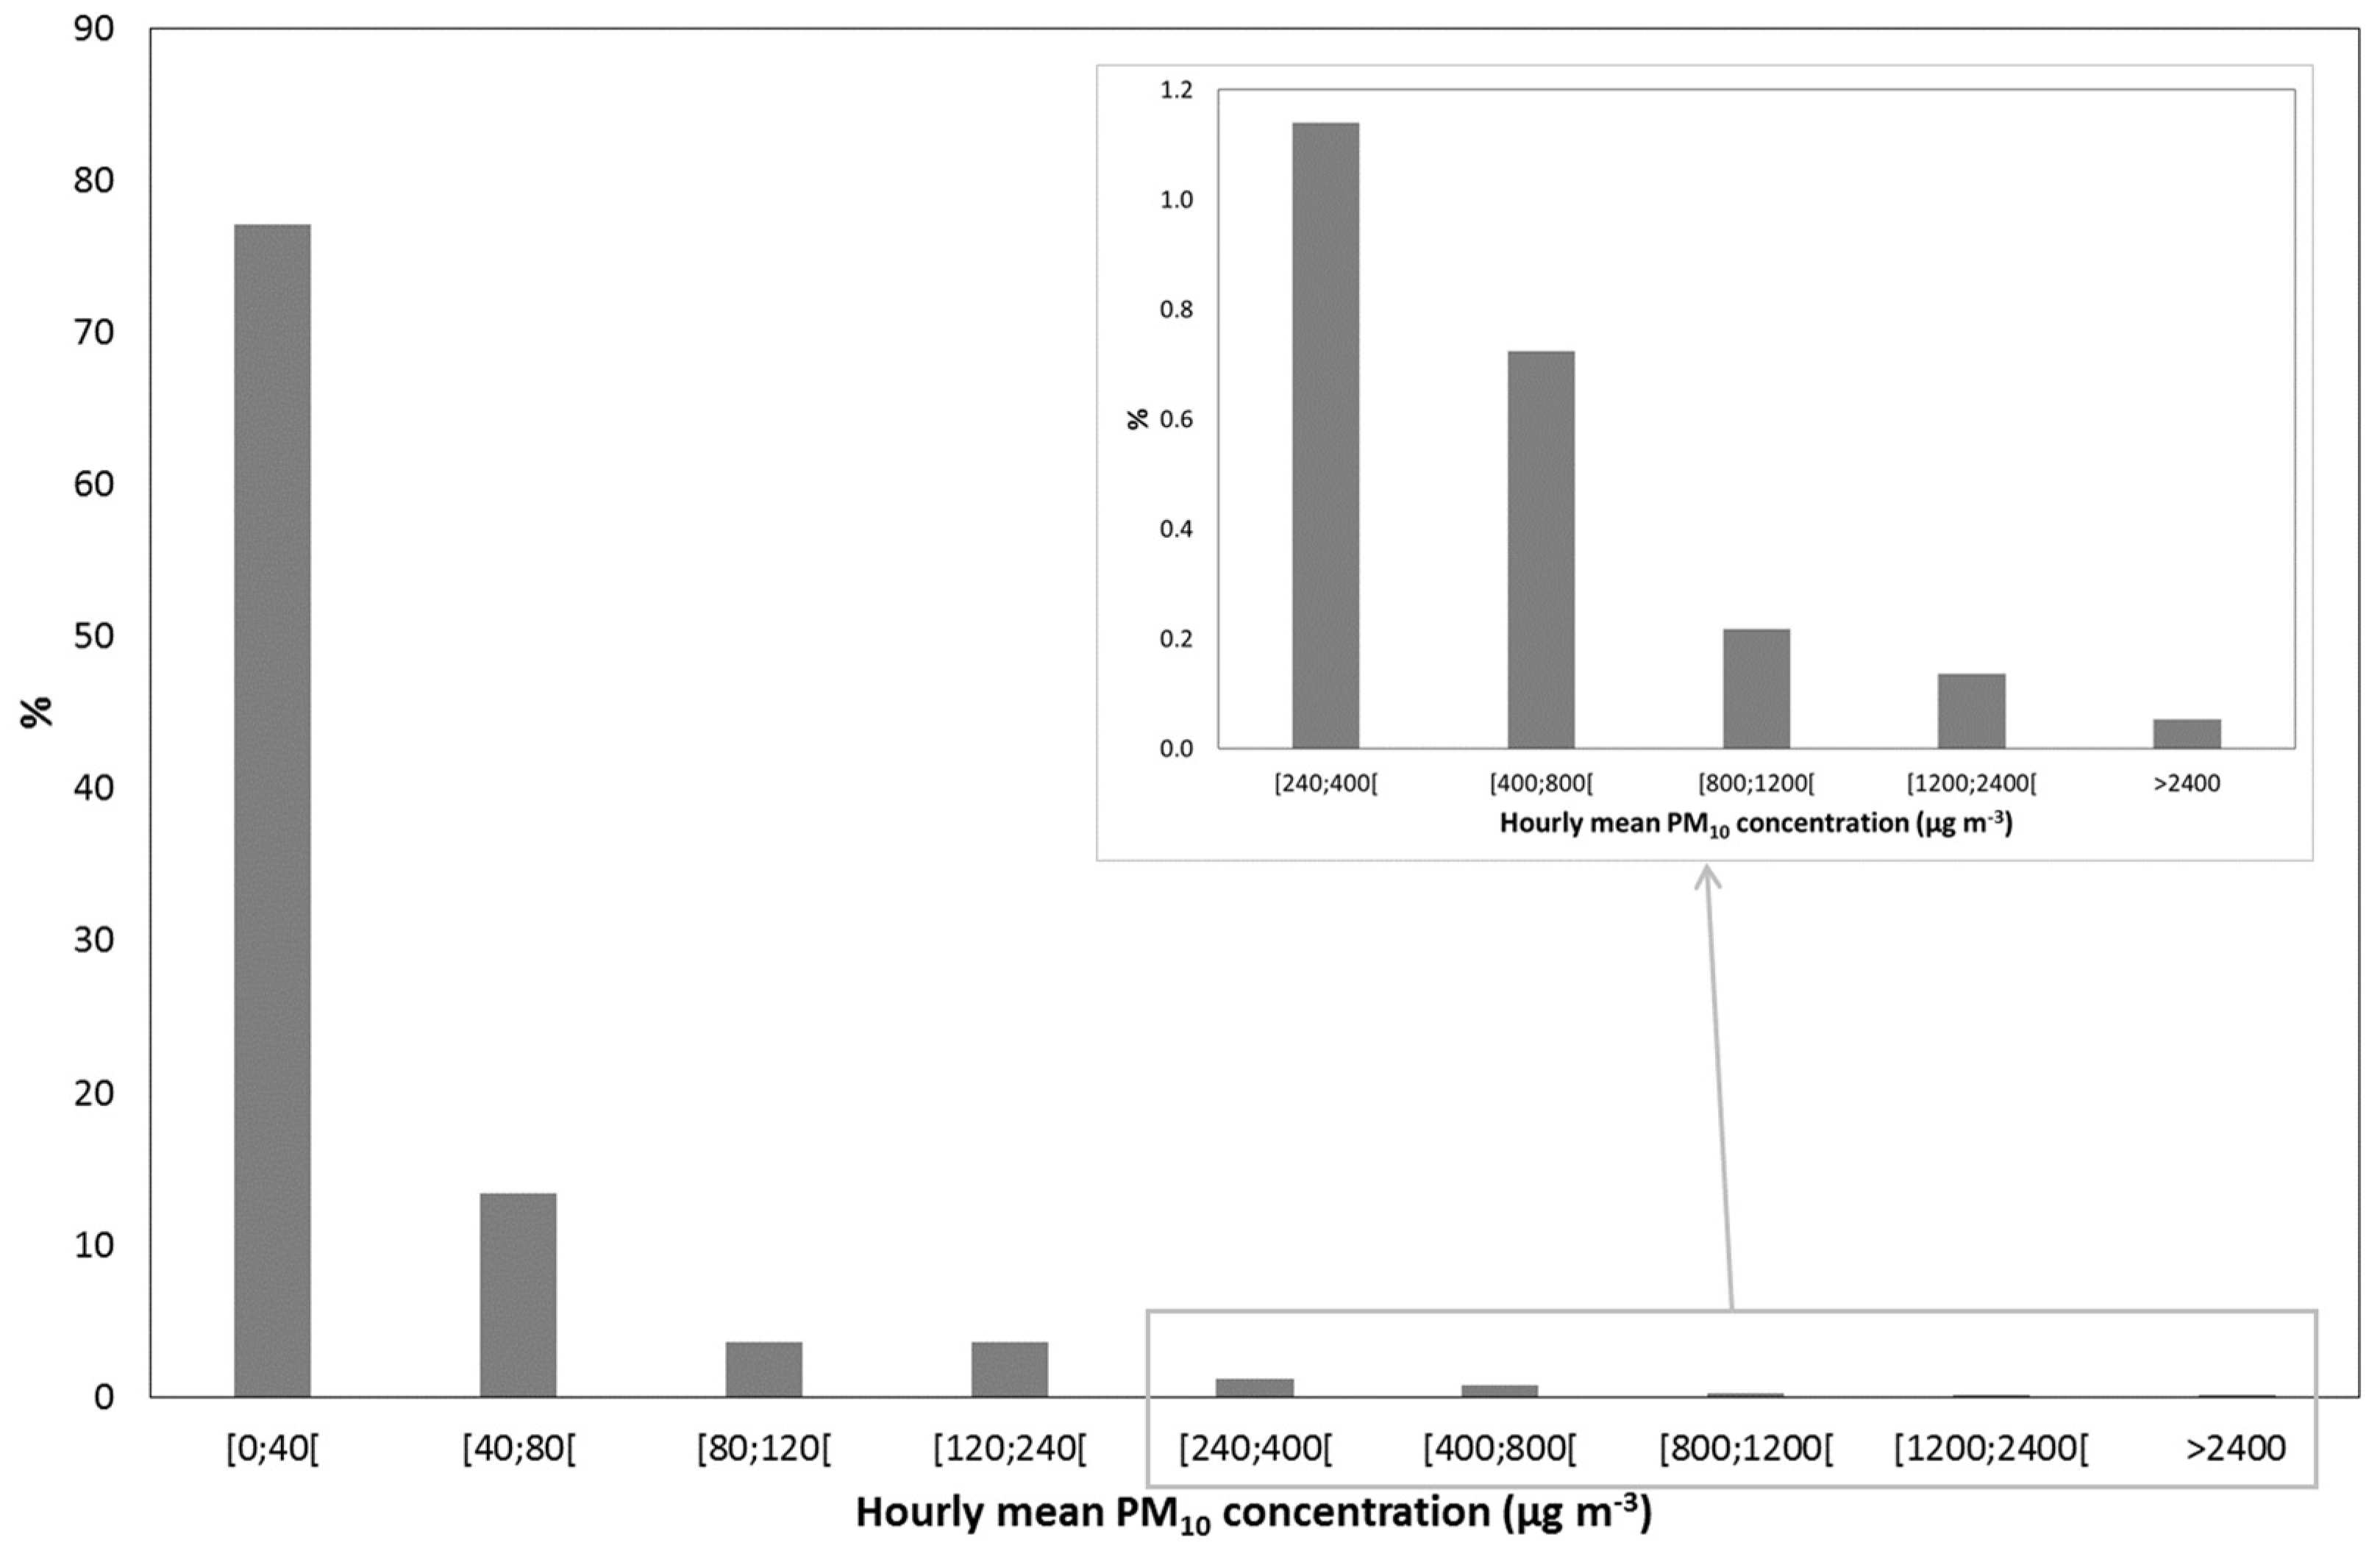
3.2.2. Sub-Daily Variability

Considering the impact of desert dust on human health, we can wonder what differences exist between a long-term exposure to high levels of PM10 concentration and a short-term exposure to very high PM10 concentration. Indeed, in extreme cases, people and animals caught in a severe dust storm may die due to suffocation [9]. For instance, a major dust storm in April 1895 in the US state of Colorado was reported to have caused the loss of 20% of the cattle in the east of the state [52]. When examining all the days with a daily mean PM10 concentration greater than 120 µg m−3, we noticed that the daily limit value can be exceeded in different ways. In order to investigate it, we searched for two days for which the daily mean PM10 concentration was greater than 120 µg m−3 and in the same order of magnitude, but during which the five-minute PM10 concentration dynamics was completely different. Because the number of days exhibiting a daily mean PM10 concentration below 260 µg m−3 represents more than a half of the days for which the daily limit value relative to well-being was exceeded, we selected, as an example, two days for which a daily mean PM10 concentration of ~125 µg m−3 was recorded—12 February 2014 and 13 May 2014.
Figure 6 presents the temporal evolution of the five-minute PM10 concentrations during these two days. In the first case, on 12 February 2014, five-minute PM10 concentrations were higher than 100 µg m−3 during more than half of the day, but never exceeding 400 µg m−3, while, in the second case, on 13 May 2014, the daily limit value relative to well-being was exceeded because of the occurrence of a peak of very high PM10 concentration (up to 3398 µg m−3 on five minutes) over a short time period (less than 1 h). Such differences in the five-minute PM10 concentration dynamics were also observed during days with higher daily mean PM10 concentrations (not shown).
The differences observed in the temporal evolution of PM10 concentrations between the two presented days can be explained by the meteorological situation (see the detailed analysis presented in Appendix D): On 12 February 2014, high PM10 concentrations measured at the station of El Fjé resulted from dust transport from the region of the Chotts in the western part of Tunisia, while, on 13 May 2014, the same PM10 level was the consequence of local wind erosion in the Jeffara plain.
These observations raise the question of the possible need to define sub-daily limits to warn populations in case of very intense dust events. Middleton [9] reported on the public information system established by the Korea Meteorological Administration (Asian dust warning system; http://web.kma.go.kr/eng/weather/asiandust/intro.jsp) to warn the population of possible health effects in case of intrusion of desert dust coming from long-range transport from China and Mongolia across the Korean peninsula. This warning system includes two levels based on the value of the hourly mean PM10 concentration: Advisory (respectively warning) when the hourly mean PM10 concentration is expected to exceed 400 µg m−3 (respectively 800 µg m−3) for over 2 h.
During the period February 2014–February 2019, in El Fjé, the hourly mean PM10 concentration was greater than 400 µg m−3 472 times, and greater than 800 µg m−3 170 times, so that the advisory level would have been triggered 360 times while the warning level would have been triggered 115 times. At a maximum, the hourly mean PM10 concentration was greater than 400 µg m−3 during 27 consecutive hours from 30/01/2015 22:00UTC to 01/02/2015 00:00UTC; during this period, the hourly mean PM10 concentration was greater than 800 µg m−3 during 20 h. Even if such situations are exceptional (at the hourly timescale, PM10 concentrations were, most of the time (77%), lower than 40 µg m−3, Figure 7), they clearly suggest that people living in this region (and more generally, those living close to dust sources) are regularly exposed during several hours to very high PM10 concentrations, exceeding by far all the air quality standards. The health consequences of such intense but relatively short exposure of the population to dust events remain to be documented and the definition of air quality standards accounting for the intermittency of dust emission should be encouraged in regions where this phenomenon strongly controls air quality.

4. Conclusions

In order to investigate the role of mineral dust on air quality in a region where this aerosol species is dominant, PM10 concentrations were measured at a five-minute time step from February 2014 to February 2019 in a remote place of southern Tunisia (El Fjé).
Simultaneous measurements of the AOD and the Angström exponent with a sunphotometer were also performed in the station of El Fjé. These complementary measurements allowed to identify the nature of the aerosols responsible for the excess of the daily Tunisian air quality standards—mineral dust.
The results showed that, on an annual basis, the Tunisian air quality standards were respected in this part of the country contrary to what was measured for the northernmost urban and industrial stations of Tunisia: Annual means of PM10 concentration recorded in El Fjé were significantly lower than those recorded in the main coastal urban centers of northern Tunisia. On the other hand, they appeared high (up to twice higher) for a rural area when compared to stations located far from dust sources (southern Europe), but low when compared to Sahelian stations. In the latter case, this suggests that southern Tunisia cannot be considered as a continuous active source of mineral dust, nor as a regular pathway for mineral dust emitted in the Sahara. On a daily basis, Tunisian air quality standards were no longer respected.
The five-minute time step of PM10 concentration measurements allowed to identify the manner these standards were exceeded. Two contrasted cases were identified: The high daily mean PM10 concentration that was measured during these days was either due to high PM10 concentrations (some thousands of µg m−3) lasting several hours or due to a brief, but very high peak of PM10 concentration (> 1000 µg m−3) over a short time period (less than 2 h). Using concomitant measurements of mean and maximum wind speed at the same time step as PM10 concentrations should give some insight on the local or regional origin of the dust responsible for the excess of air quality standards. Nevertheless, the use of back-trajectory analysis and space-borne measurements in complement would be necessary to confirm the obtained results.
The different ways daily standards were exceeded at the sub-daily scale question the fact that daily mean PM10 concentration is not the most relevant indicator to quantify population exposure to desert dust. Indeed, during the period February 2014–February 2019, in El Fjé, the hourly mean PM10 concentration was greater than 400 µg m−3 472 times, and greater than 800 µg m−3 170 times, while the daily limit value relative to health (daily mean PM10 concentration greater than 260 µg m−3) was only exceeded 40 times. As a conclusion, the definition of sub-daily indicators should be then considered at the same time as the impact of the high peaks of PM10 concentration on human health should be investigated. This would require epidemiological studies to be conducted on the association of high dust concentration at the sub-daily scale with health effect (such as irritation symptoms, hospital admission respiratory disease, hospital admission cardiovascular disease, respiratory mortality, cardiovascular mortality, or total mortality) in regions located downwind desert areas, such as the Sahara. As a first step, it should be useful to compare the respiratory and/or cardiovascular hospitalization rates in these areas with those in other urban regions in north Tunisia. Nevertheless, in the inhabited areas located downwind of deserts, atmospheric pollution due to mineral dust cannot be reduced, such as pollution due to road traffic or industries. Before precisely assessing the role of short bursts of mineral dust on public health, a simple preventive step to protect the local populations should be to set up warning systems based on existing weather and atmospheric dust load forecasts, such as the one already running in Korea. This would allow the local population to be protected during intense dust events following simple rules such as avoiding outdoor activities, wearing anti-pollution masks, etc.

Author Contributions

C.B. was the leading author of the present paper, but M.T.L., J.L.R., G.B. and B.M. actively contributed to discussions of the research, and of the manuscript. C.B. and J.L.R. corrected the paper to account for reviewers’ comments. T.H.d.T., M.L., S.S. and A.F. ensured the maintenance of the station and data acquisition. C.B. ensured data quality control.

Funding

This research received no external funding.

Acknowledgments

The authors want to thank (1) Houcine Khatteli, Director of the Institut des Régions Arides (IRA) of Médenine, for the constant support of IRA in all research related to wind erosion, and (2) the Chemistry-Aerosol Mediterranean Experiment (ChArMEx) reaserch program (http://charmex.lsce.ipsl.fr) that allowed the installation of the sunphotometer. The authors gratefully acknowledge the NOAA Air Resources Laboratory (ARL) for the provision of the HYSPLIT transport and dispersion model and READY website (http://www.ready.noaa.gov) used in this publication. MODIS data used in this study were downloaded from the Giovanni online data system, developed and maintained by the NASA GES DISC. We also acknowledge the MODIS mission scientists and associated NASA personnel for the production of the data used in this research effort.

Conflicts of Interest

The authors declare no conflicts of interest. The funders had no role in the design of the study; in the collection, analyses, or interpretation of data; in the writing of the manuscript, or in the decision to publish the results.

Appendix A

Table A1. Percentage of available data on a five-minute time step for the TEOM™, and number of days in the month where Aerosol Optical Depth (AOD) measurement is available. ND stands for “no data”.
TEOM™ (%)Photometer
(Number of Days)
February 201499ND
March 2014100ND
April 2014100ND
May 2014100ND
June 2014100ND
July 2014994
August 20147731
September 201410029
October 20149430
November 201410027
December 2014989
January 201510024
February 201510020
March 2015100ND
April 201599ND
May 20158926
June 20159430
July 20159931
August 201510028
September 20158821
October 20151726
November 201510025
December 20159930
January 20169823
February 20169925
March 20169929
April 20166529
May 20169926
June 20169916
July 20169931
August 20169931
September 20169729
October 20169931
November 20169922
December 201610027
January 201710029
February 201710028
March 20179927
April 20179923
May 20179930
June 20179729
July 20178230
August 20179931
September 20179929
October 201710028
November 20178912
December 20179926
January 201810027
February 20189920
March 201810028
April 20189928
May 20189929
June 20189929
July 20189031
August 201810030
September 20189926
October 20189916
November 20189927
December 201810031
January 20199927
February 201910018

Appendix B

Table A2. Location, type, data coverage, and source of the annual mean PM10 concentrations (in µg m−3) for each station presented in Figure 2. NA means that the type of station was not given in the original database.
RegionCountryCityType of StationYearSource
South EuropeSpainMontsenyRegional Background2002–2011 mean valuePey et al. [45]
South EuropeSpainMonagregaRegional Background2001–2011 mean valuePey et al. [45]
South EuropeSpainZarraRegional Background2001–2011 mean valuePey et al. [45]
South EuropeSpainVíznarRegional Background2001–2011 mean valuePey et al. [45]
South EuropeSpainBarcarrotaRegional Background2001–2011 mean valuePey et al. [45]
South EuropeSpainSan Pablo de los MontesRegional Background2001–2011 mean valuePey et al. [45]
South EuropeSpainCastillo de BellverSub-urban regional2001–2011 mean valuePey et al. [45]
South EuropeFranceGenasRegional Background2001–2010 mean valuePey et al. [45]
South EuropeFranceDrôme Rurale SudRegional Background2004–2010 mean valuePey et al. [45]
South EuropeItalyFebbioRegional Background2005–2010 mean valuePey et al. [45]
South EuropeItalyFontechiariRegional Background2001–2010 mean valuePey et al. [45]
South EuropeItalyLecceRegional Background2009–2010 mean valuePey et al. [45]
South EuropeItalyCenstRegional Background2005–2010 mean valuePey et al. [45]
South EuropeItalyBoccadifalcoSub-urban regional2001–2010 mean valuePey et al. [45]
South EuropeGreecePanoramaSub-urban regional2001–2010 mean valuePey et al. [45]
South EuropeGreeceAgia PareskeviSub-urban regional2001–2010 mean valuePey et al. [45]
South EuropeGreeceFinokaliaRegional Background2004–2010 mean valuePey et al. [45]
South EuropeBulgariaRojen PeakRegional Background2005–2010 mean valuePey et al. [45]
South EuropeCyprusAyia MarinaRegional Background2003–2010 mean valuePey et al. [45]
North AfricaTunisiaEl FjéRural2014–2018 mean valueThis work
North AfricaTunisiaBizerteUrban residential/traffic/commercial2010WHO GUAAP Database (2016) *
North AfricaTunisiaSfaxUrban2010WHO GUAAP Database (2016)
North AfricaTunisiaSousseUrban residential/traffic/commercial2010WHO GUAAP Database (2016)
North AfricaTunisiaTunisUrban2010WHO GUAAP Database (2016)
North AfricaMoroccoCasablanca4 stations, urban background station2013WHO GUAAP Database (2016)
North AfricaMoroccoFèsUrban background station2013WHO GUAAP Database (2016)
North AfricaMoroccoMarrakech2 stations, urban background station2012WHO GUAAP Database (2016)
North AfricaMoroccoMeknesUrban2008WHO GUAAP Database (2016)
North AfricaMoroccoSafiUrban background station2011WHO GUAAP Database (2016)
North AfricaMoroccoSaléUrban background station2011WHO GUAAP Database (2016)
North AfricaMoroccoTangerUrban background station2013WHO GUAAP Database (2016)
North AfricaEgyptDelta region14 stations2013WHO GUAAP Database (2016)
North AfricaEgyptGreater Cairo47 stations2013WHO GUAAP Database (2016)
West AfricaLiberiaBuchananRural, 500m away from community, Osris2009WHO GUAAP Database (2016)
West AfricaLiberiaSanniquellieRural, within the community, Osiris monitors2009WHO GUAAP Database (2016)
West AfricaNigeriaAbaNA2009WHO GUAAP Database (2016)
West AfricaNigeriaAbakalikiNA2009WHO GUAAP Database (2016)
West AfricaNigeriaAfikpoNA2009WHO GUAAP Database (2016)
West AfricaNigeriaEnuguNA2009WHO GUAAP Database (2016)
West AfricaNigeriaIle-IfeUniversity campus2010WHO GUAAP Database (2016)
West AfricaNigeriaNnewiNA2009WHO GUAAP Database (2016)
West AfricaNigeriaNsukkaNA2009WHO GUAAP Database (2016)
West AfricaNigeriaOnitshaNA2009WHO GUAAP Database (2016)
West AfricaNigeriaOrluNA2009WHO GUAAP Database (2016)
West AfricaNigeriaOwerriNA2009WHO GUAAP Database (2016)
West AfricaNigeriaUmuahiaNA2009WHO GUAAP Database (2016)
West AfricaSenegalDakar4 stations, traffic, urban, industrial2013WHO GUAAP Database (2016)
West AfricaSenegalM’BourCoastal/urban2006–2010 mean valueKaly et al. [46]
West AfricaMaliCinzanaRural2006–2010 mean valueKaly et al. [46]
West AfricaNigerBanizoumbouRural2006–2010 mean valueKaly et al. [46]
* 2016 update of the WHO Global Urban Ambient Air Pollution (GUAAP) Database (http://www.who.int/phe/health_topics/outdoorair/databases/cities/en/).

Appendix C

Table A3. Number of days by month with PM10 measurements (Nobs.), and with daily mean PM10 concentrations greater than 120 µg m−3 and greater than 260 µg m−3 for the period February 2014–February 2019.
MonthNobs. [ P M 10 ] daily > 120 µg m−3 [ P M 10 ] daily > 260 µg m−3
February 20141732
March 20143163
April 20143042
May 20143110
June 20142910
July 20143100
August 20142500
September 20143040
October 20143011
November 20143042
December 20143152
January 20153142
February 20152862
March 20153150
April 20153000
May 20152910
June 20152922
Juny 20153100
August 20153110
September 20152710
October 2015500
November 20153000
December 20153100
January 20163111
February 20162950
March 20163132
April 20162221
May 20163131
June 20163021
July 20163110
August 20163100
September 20163010
October 20163111
November 20163031
December 20163111
January 20173110
February 20172831
March 20173100
April 20173021
May 20173122
June 20173000
July 20172800
August 20173100
September 20173011
October 20173100
November 20173000
December 20173100
January 20183110
February 20182810
March 201831104
April 20183062
May 20183131
June 20183000
July 20182900
August 20183100
September 20183000
October 20183121
November 20183000
December 20183110
January 20193110
February 20192810

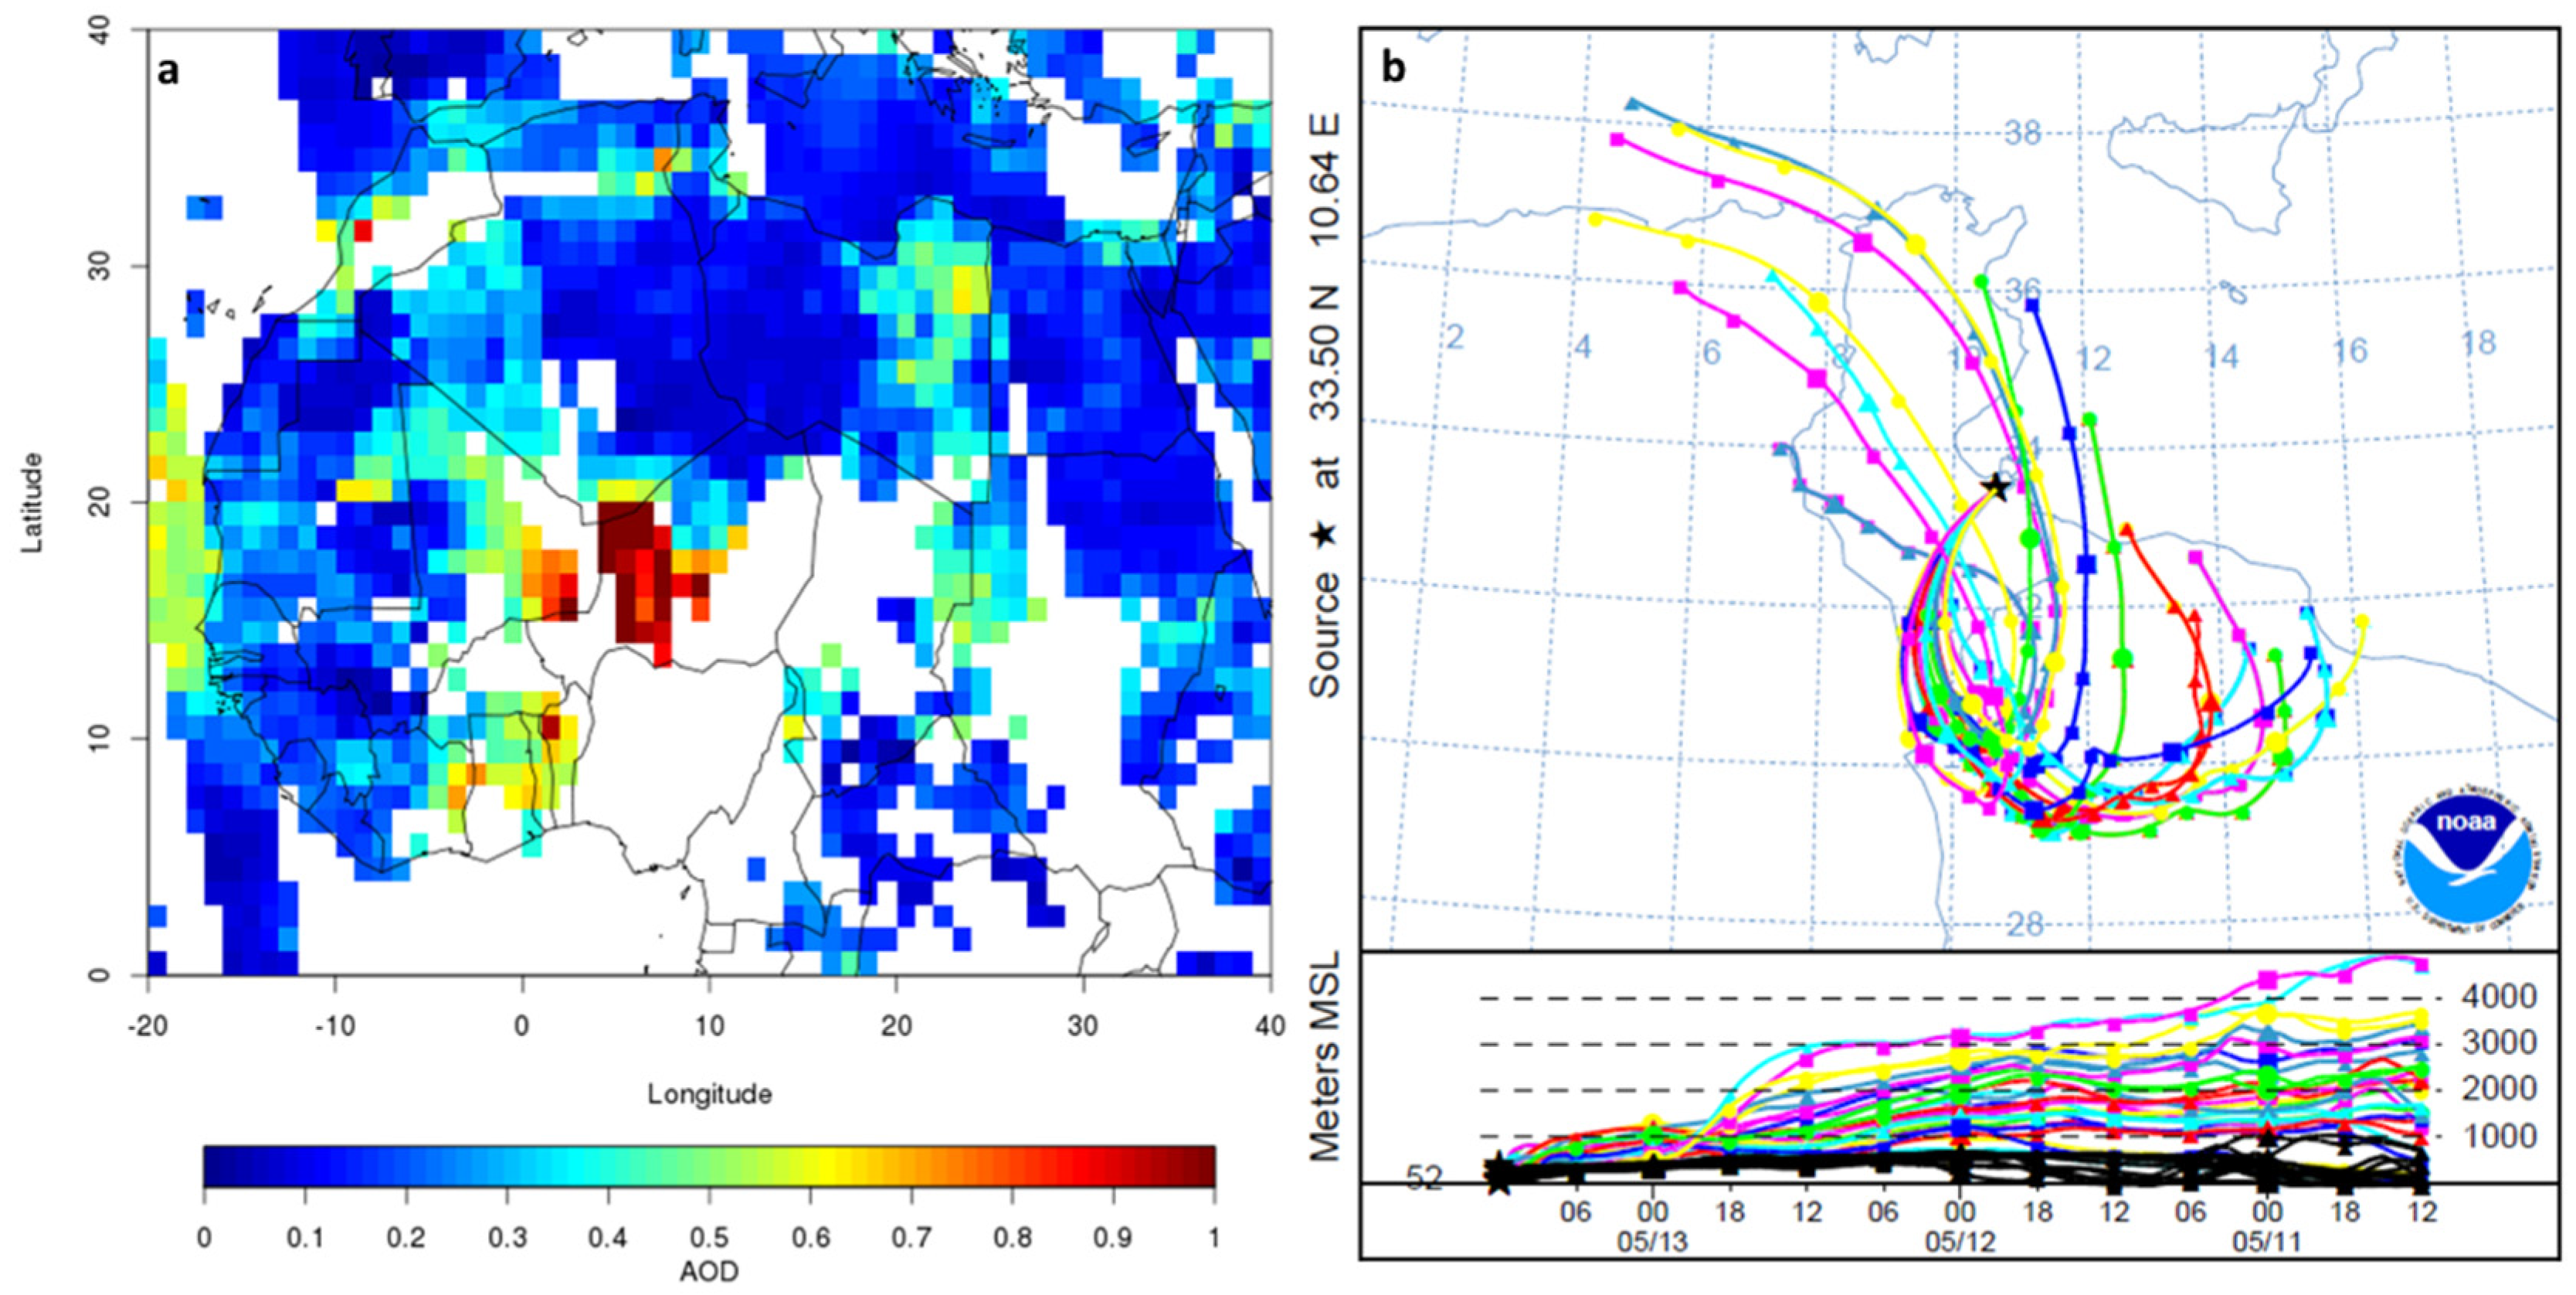
Appendix D. Detailed Analysis of the 12 February and 13 May 2014 Dust Events

At the station of El Fjé, a Gill 2D-type Windsonic anemometer (Campbell® Scientific Instruments) is also installed to measure wind speed and direction at a five-minute time step. As measurement frequency is 10 s, maximum and mean wind speed values measured during the five-minute time period are stored on a CR200 data logger (Campbell® Scientific Instruments, Shepshed, Loughborough, UK).
In order to determine the differences observed in the sub-daily variations of PM10 concentrations observed on 12 February and 13 May 2014, as a first step, the temporal evolution of the five-minute PM10 concentration and five-minute mean and maximum wind speed were analyzed (Figure A1). It can be seen that, on 12 February 2014, the increase in PM10 concentration occurred when wind speed was relatively low (below 4 m s−1 on average), which shows that dust was not produced locally. On the opposite, on 13 May 2014, the sudden increase in PM10 concentration occurred almost at the same time as wind speed increases (up to ~12 m s−1 for five-minute mean wind speed and up to ~17 m s−1 for five-minute maximum wind speed), which suggests that dust was at least partially due to local wind erosion.
Figure A1. Temporal evolution of the five-minute PM10 concentration (in µg m−3—red line) and five-minute mean (light blue line) and maximum (dark blue dashed line) wind speed (in m s−1) for (a) 12 February 2014 and (b) 13 May 2014.
Atmosphere 10 00452 g0a1
In order to confirm the regional or local origin of dust during these two days, we combined back-trajectory analysis and space-borne measurements. The origin of the air-masses was determined using the online version of the HYbrid Single Particle Lagrangian Integrated Trajectory model (HYSPLIT; [53,54]). This method is indeed widely used to determine the origin of African dust contributions to the total aerosol load (e.g., [55,56,57]) or the origin of mineral dust deposits (e.g., [33]). 72 h backward trajectories starting at 12:00UTC on both days were computed, ending at the ground level (0 m) at El Fjé, using the ensemble model (i.e., 27 backward trajectories were computed for all identified days) forced by the GDAS (Global Data Assimilation System) meteorological database at 0.5°.
In complement to the air mass trajectories, we used the AOD at 550 nm derived from the measurements of the Moderate Resolution Imaging Spectroradiometer (MODIS) on-board the Aqua satellite: 1° × 1° daily maps of the merged Dark Target/Deep Blue product available in the collection 6 MODIS aerosol products over land and ocean [58] were used to determine the most probable origin of mineral dust observed during both days. To do so, AOD maps were produced for each of the days composing the 72 h backward trajectories computed for 12 February and 13 May 2014, and the most probable origin of mineral dust corresponds to the location where the air-mass trajectory crosses near the surface a region with a high AOD.
For 12 February 2014 (Figure A2), back-trajectories indicate that the air-mass travelled close to the surface from the regions of the Chotts, located at the border between Algeria and Tunisia in the West, where AOD was high (between 0.6 and 0.8) on 11 February 2014. This analysis confirms that dust arriving at El Fjé on 12 February 2014 was not produced locally. For 13 May 2014 (Figure A3), back-trajectories arrived from the South, where AOD was low (between 0.1 and 0.2). On the other hand, AOD on 13 May 2014 was between 0.3 and 0.4 in the Jeffara plain, where the station of El Fjé is located, which confirms the local origin of the dust responsible for the high PM10 concentrations recorded during this day.
Figure A2. (a) Moderate Resolution Imaging Spectroradiometer (MODIS) (Aqua) merged Dark Target/Deep Blue AOD product at 550 nm on 11 February 2014; (b) 72 h backward trajectories ending at 1200UTC 12 February 2014, computed using the online version of the HYbrid Single Particle Lagrangian Integrated Trajectory (HYSPLIT) model from El Fjé (black star—33.50N; 10.64E), and corresponding altitudes (in m) of the air-mass along its trajectory.
Atmosphere 10 00452 g0a2
Figure A3. (a) MODIS (Aqua) merged Dark Target/Deep Blue AOD product at 550 nm on 13 May 2014; (b) 72 h-backward trajectories ending at 1200UTC 13 May 2014 computed using the online version of the HYSPLIT model from El Fjé (black star—33.50N; 10.64E), and corresponding altitudes (in m) of the air-mass along its trajectory.
Atmosphere 10 00452 g0a3

References

  1. Brunekreef, B.; Holgate, S.T. Air pollution and health. Lancet 2002, 360, 1233–1242. [Google Scholar] [CrossRef]
  2. Brunekreef, B.; Forsberg, B. Epidemiological evidence of effects of coarse airborne particles on health. Eur. Respir. J. 2005, 26, 309–318. [Google Scholar] [CrossRef] [PubMed]
  3. Heyder, J. Single particle deposition in human airways. In Physical and Chemical Characterization of Individual Airborne Particles; Spurny, K.R., Ed.; Ellis Horwood: Chichester, UK, 1986; pp. 77–85. [Google Scholar]
  4. Annesi-Maesano, I.; Forastiere, F.; Kunzli, N.; Brunekref, B.; Environment and Health Committee of the European Respiratory Society. Particulate matter, science and EU policy. Eur. Respir. J. 2007, 29, 428–431. [Google Scholar] [CrossRef] [PubMed] [Green Version]
  5. Pope, C.A. Cardiovascular Mortality and Long-Term Exposure to Particulate Air Pollution: Epidemiological Evidence of General Pathophysiological Pathways of Disease. Circulation 2003, 109, 71–77. [Google Scholar] [CrossRef]
  6. Schwartz, J. Air Pollution and Daily Mortality: A Review and Meta Analysis. Environ. Res. 1994, 64, 36–52. [Google Scholar] [CrossRef] [PubMed]
  7. World Health Organization Review of Evidence on Health Aspects of Air Pollution—REVIHAAP Project; World Health Organization: Copenhagen, Denmark, 2013.
  8. Climate Change 2013: The Physical Science Basis. Contribution of Working Group I to the Fifth Assessment Report of the Intergovernmental Panel on Climate Change; Stocker, T.F.; Qin, D.; Plattner, G.-K.; Tignor, M.; Allen, S.K.; Boschung, J.; Nauels, A.; Xia, Y.; Bex, V.; Midgley, P.M. (Eds.) Cambridge University Press: Cambridge, UK; New York, NY, USA, 2014; ISBN 978-1-107-05799-9. [Google Scholar]
  9. Middleton, N.J. Desert dust hazards: A global review. Aeolian Res. 2017, 24, 53–63. [Google Scholar] [CrossRef]
  10. De Longueville, F.; Ozer, P.; Doumbia, S.; Henry, S. Desert dust impacts on human health: An alarming worldwide reality and a need for studies in West Africa. Int. J. Biometeorol. 2013, 57, 1–19. [Google Scholar] [CrossRef]
  11. Goudie, A.S. Desert dust and human health disorders. Environ. Int. 2014, 63, 101–113. [Google Scholar] [CrossRef]
  12. Hashizume, M.; Ueda, K.; Nishiwaki, Y.; Michikawa, T.; Onozuka, D. Health effects of Asian dust events: A review of the literature. Jpn. J. Hyg. 2010, 65, 413–421. [Google Scholar] [CrossRef]
  13. Karanasiou, A.; Moreno, N.; Moreno, T.; Viana, M.; de Leeuw, F.; Querol, X. Health effects from Sahara dust episodes in Europe: Literature review and research gaps. Environ. Int. 2012, 47, 107–114. [Google Scholar] [CrossRef]
  14. Kwon, H.-J. Toxicity and health effects of Asian dust: A literature review. J. Korean Med. Assoc. 2012, 55, 234. [Google Scholar] [CrossRef]
  15. Morman, S.A.; Plumlee, G.S. The role of airborne mineral dusts in human disease. Aeolian Res. 2013, 9, 203–212. [Google Scholar] [CrossRef]
  16. Venero-Fernández, S.J. Saharan Dust Effects on Human Health: A Challenge for Cuba’s Researchers. MEDICC Rev. 2016, 18, 32–34. [Google Scholar] [PubMed]
  17. Zhang, X.; Zhao, L.; Tong, D.; Wu, G.; Dan, M.; Teng, B. A systematic review of global desert dust and associated human health effects. Atmosphere 2016, 7, 158. [Google Scholar] [CrossRef]
  18. Pauley, P.M.; Baker, N.L.; Barker, E.H. An observational Study of the “Interstate 5” Dust Storm Case. Bull. Am. Meteorol. Soc. 1996, 77, 693–720. [Google Scholar] [CrossRef]
  19. Giannadaki, D.; Pozzer, A.; Lelieveld, J. Modeled global effects of airborne desert dust on air quality and premature mortality. Atmos. Chem. Phys. 2014, 14, 957–968. [Google Scholar] [CrossRef] [Green Version]
  20. Evans, J.; van Donkelaar, A.; Martin, R.V.; Burnett, R.; Rainham, D.G.; Birkett, N.J.; Krewski, D. Estimates of global mortality attributable to particulate air pollution using satellite imagery. Environ. Res. 2013, 120, 33–42. [Google Scholar] [CrossRef]
  21. De Longueville, F.; Hountondji, Y.-C.; Henry, S.; Ozer, P. What do we know about effects of desert dust on air quality and human health in West Africa compared to other regions? Sci. Total Environ. 2010, 409, 1–8. [Google Scholar] [CrossRef] [Green Version]
  22. Baldasano, J.M.; Valera, E.; Jiménez, P. Air quality data from large cities. Sci. Total Environ. 2003, 307, 141–165. [Google Scholar] [CrossRef]
  23. Mathers, C.D.; Ma Fat, D.; Inoue, M.; Rao, C.; Lopez, A.D. Counting the dead and what they died from: An assessment of the global status of cause of death data. Bull. World Health Organ. 2005, 83, 171–177c. [Google Scholar]
  24. INS. Résultats du Recensement 2014 par Gouvernorats et Délégations; INS: Tunis, Tunisia, 2014; Volume 2. [Google Scholar]
  25. Akrimi, N.; Kardous, M.; Taamallah, H. Mouvements de sable en relation avec la nature et la vitesse de certains outils de travail du sol en zones arides (étude d’un cas pratique). Revue des Régions Arides 1993, 5, 35–57. [Google Scholar]
  26. Bergametti, G.; Gomes, L.; Remoudaki, E.; Desbois, M.; Martin, D.; Buat-Ménard, P. Present transport and deposition patterns of African dusts to the north-western Mediterranean. In Paleoclimatology and Paleometeorology: Modern and Past Patterns of Global Atmospheric Transport; NATO Science Series C; Springer Netherlands: Heidelberg, Germany, 1989; Volume 282, pp. 227–252. [Google Scholar]
  27. Guerzoni, S.; Molinaroli, E.; Chester, R. Saharan dust inputs to the western Mediterranean Sea: Depositional patterns, geochemistry and sedimentological implications. Deep Sea Res. Part II Top. Stud. Oceanogr. 1997, 44, 631–654. [Google Scholar] [CrossRef]
  28. Israelevich, P.; Ganor, E.; Alpert, P.; Kishcha, P.; Stupp, A. Predominant transport paths of Saharan dust over the Mediterranean Sea to Europe. J. Geophys. Res. Atmos. 2012, 117, D02205. [Google Scholar] [CrossRef]
  29. Marconi, M.; Sferlazzo, D.M.; Becagli, S.; Bommarito, C.; Calzolai, G.; Chiari, M.; di Sarra, A.; Ghedini, C.; Gómez-Amo, J.L.; Lucarelli, F.; et al. Saharan dust aerosol over the central Mediterranean Sea: PM10 chemical composition and concentration versus optical columnar measurements. Atmos. Chem. Phys. 2014, 14, 2039–2054. [Google Scholar] [CrossRef] [Green Version]
  30. Meloni, D.; di Sarra, A.; Monteleone, F.; Pace, G.; Piacentino, S.; Sferlazzo, D.M. Seasonal transport patterns of intense Saharan dust events at the Mediterranean island of Lampedusa. Atmos. Res. 2008, 88, 134–148. [Google Scholar] [CrossRef]
  31. Moulin, C.; Lambert, C.E.; Dayan, U.; Masson, V.; Ramonet, M.; Bousquet, P.; Legrand, M.; Balkanski, Y.J.; Guelle, W.; Marticorena, B.; et al. Satellite climatology of African dust transport in the Mediterranean atmosphere. J. Geophys. Res. Atmos. 1998, 103, 13137–13144. [Google Scholar] [CrossRef]
  32. Schepanski, K.; Mallet, M.; Heinold, B.; Ulrich, M. North African dust transport toward the western Mediterranean basin: Atmospheric controls on dust source activation and transport pathways during June–July 2013. Atmos. Chem. Phys. 2016, 16, 14147–14168. [Google Scholar] [CrossRef]
  33. Vincent, J.; Laurent, B.; Losno, R.; Bon Nguyen, E.; Roullet, P.; Sauvage, S.; Chevaillier, S.; Coddeville, P.; Ouboulmane, N.; di Sarra, A.G.; et al. Variability of mineral dust deposition in the western Mediterranean basin and south-east of France. Atmos. Chem. Phys. 2016, 16, 8749–8766. [Google Scholar] [CrossRef] [Green Version]
  34. Dahech, S.; Beltrando, G. Le vent de sable dans le Sud tunisien: Conséquences pour l’homme à Sfax. La Météorologie 2012, 79, 40–50. [Google Scholar] [CrossRef]
  35. Bouchlaghem, K.; Nsom, B.; Latrache, N.; Haj Kacem, H. Impact of Saharan dust on PM10 concentration in the Mediterranean Tunisian coasts. Atmos. Res. 2009, 92, 531–539. [Google Scholar] [CrossRef]
  36. Bouchlaghem, K.; Nsom, B. Effect of atmospheric pollutants on the air quality in Tunisia. Sci. World J. 2012, 2012, 863528. [Google Scholar] [CrossRef] [PubMed]
  37. World Health Organization. WHO Air Quality Guidelines for Particulate Matter, Ozone, Nitrogen Dioxide and Sulfur Dioxide—Global Update 2005—Summary of Risk Assessment; World Health Organization: Geneva, Switzerland, 2006. [Google Scholar]
  38. Kallel, M.R. Hydrologie de la Jeffara Tunisienne; DG-RE: Tunis, Tunisia, 2001; p. 65. [Google Scholar]
  39. Marticorena, B.; Chatenet, B.; Rajot, J.L.; Traoré, S.; Coulibaly, M.; Diallo, A.; Koné, I.; Maman, A.; NDiaye, T.; Zakou, A. Temporal variability of mineral dust concentrations over West Africa: Analyses of a pluriannual monitoring from the AMMA Sahelian Dust Transect. Atmos. Chem. Phys. 2010, 10, 8899–8915. [Google Scholar] [CrossRef]
  40. Green, D.C.; Fuller, G.W.; Baker, T. Development and validation of the volatile correction model for PM10—An empirical method for adjusting TEOM measurements for their loss of volatile particulate matter. Atmos. Environ. 2009, 43, 2132–2141. [Google Scholar] [CrossRef]
  41. Grover, B.D.; Kleinman, M.; Eatough, N.L.; Eatough, D.J.; Hopke, P.K.; Long, R.W.; Wilson, W.E.; Meyer, M.B.; Ambs, J.L. Measurement of total PM2.5 mass (nonvolatile plus semivolatile) with the Filter Dynamic Measurement System tapered element oscillating microbalance monitor. J. Geophys. Res. 2005, 110, D07S03. [Google Scholar] [CrossRef]
  42. Holben, B.N.; Eck, T.F.; Slutsker, I.; Tanré, D.; Buis, J.P.; Setzer, A.; Vermote, E.; Reagan, J.A.; Kaufman, Y.J.; Nakajima, T.; et al. AERONET—A federated instrument network and data archive for aerosol characterization. Remote Sens. Environ. 1998, 66, 1–16. [Google Scholar] [CrossRef]
  43. Dubovik, O.; Smirnov, A.; Holben, B.N.; King, M.D.; Kaufman, Y.J.; Eck, T.F.; Slutsker, I. Accuracy assessments of aerosol optical properties retrieved from Aerosol Robotic Network (AERONET) Sun and sky radiance measurements. J. Geophys. Res. 2000, 105, 9791–9806. [Google Scholar] [CrossRef] [Green Version]
  44. Dubovik, O.; King, M.D. A flexible inversion algorithm for retrieval of aerosol optical properties from Sun and sky radiance measurements. J. Geophys. Res. 2000, 105, 20673–20696. [Google Scholar] [CrossRef] [Green Version]
  45. Pey, J.; Querol, X.; Alastuey, A.; Forastiere, F.; Stafoggia, M. African dust outbreaks over the Mediterranean Basin during 2001–2011: PM10 concentrations, phenomenology and trends, and its relation with synoptic and mesoscale meteorology. Atmos. Chem. Phys. 2013, 13, 1395–1410. [Google Scholar] [CrossRef]
  46. Kaly, F.; Marticorena, B.; Chatenet, B.; Rajot, J.L.; Janicot, S.; Niang, A.; Yahi, H.; Thiria, S.; Maman, A.; Zakou, A.; et al. Variability of mineral dust concentrations over West Africa monitored by the Sahelian Dust Transect. Atmos. Res. 2015, 164–165, 226–241. [Google Scholar] [CrossRef]
  47. Alpert, P.; Neeman, B.U.; Shay-El, Y. Climatological analysis of Mediterranean cyclones using ECMWF data. Tellus A 1990, 42, 65–77. [Google Scholar] [CrossRef] [Green Version]
  48. Dayan, U.; Heffter, J.; Miller, J.; Gutman, G. Dust Intrusion Events into the Mediterranean Basin. J. Appl. Meteor. 1991, 30, 1185–1199. [Google Scholar] [CrossRef] [Green Version]
  49. Fiedler, S.; Schepanski, K.; Knippertz, P.; Heinold, B.; Tegen, I. How important are atmospheric depressions and mobile cyclones for emitting mineral dust aerosol in North Africa? Atmos. Chem. Phys. 2014, 14, 8983–9000. [Google Scholar] [CrossRef] [Green Version]
  50. Holben, B.N.; Tanré, D.; Smirnov, A.; Eck, T.F.; Slutsker, I.; Abuhassan, N.; Newcomb, W.W.; Schafer, J.S.; Chatenet, B.; Lavenu, F.; et al. An emerging ground-based aerosol climatology: Aerosol optical depth from AERONET. J. Geophys. Res. Atmos. 2001, 106, 12067–12097. [Google Scholar] [CrossRef]
  51. Kchih, H.; Perrino, C.; Cherif, S. Investigation of Desert Dust Contribution to Source Apportionment of PM10 and PM2.5 from a Southern Mediterranean Coast. Aerosol Air Qual. Res. 2015, 15, 454–464. [Google Scholar] [CrossRef] [Green Version]
  52. Idso, S.B. Dust storms. Sci. Am. 1976, 235, 108–115. [Google Scholar] [CrossRef]
  53. Rolph, G.; Stein, A.; Stunder, B. Real-time Environmental Applications and Display sYstem: READY. Environ. Model. Softw. 2017, 95, 210–228. [Google Scholar] [CrossRef]
  54. Stein, A.F.; Draxler, R.R.; Rolph, G.D.; Stunder, B.J.B.; Cohen, M.D.; Ngan, F. NOAA’s HYSPLIT Atmospheric Transport and Dispersion Modeling System. Bull. Am. Meteorol. Soc. 2015, 96, 2059–2077. [Google Scholar] [CrossRef]
  55. Escudero, M.; Stein, A.; Draxler, R.R.; Querol, X.; Alastuey, A.; Castillo, S.; Avila, A. Determination of the contribution of northern Africa dust source areas to PM10 concentrations over the central Iberian Peninsula using the Hybrid Single-Particle Lagrangian Integrated Trajectory model (HYSPLIT) model. J. Geophys. Res. 2006, 111, D06210. [Google Scholar] [CrossRef]
  56. Escudero, M.; Stein, A.F.; Draxler, R.R.; Querol, X.; Alastuey, A.; Castillo, S.; Avila, A. Source apportionment for African dust outbreaks over the Western Mediterranean using the HYSPLIT model. Atmos. Res. 2011, 99, 518–527. [Google Scholar] [CrossRef]
  57. Meloni, D.; di Sarra, A.; Biavati, G.; DeLuisi, J.J.; Monteleone, F.; Pace, G.; Piacentino, S.; Sferlazzo, D.M. Seasonal behavior of Saharan dust events at the Mediterranean island of Lampedusa in the period 1999–2005. Atmos. Environ. 2007, 41, 3041–3056. [Google Scholar] [CrossRef]
  58. Levy, R.C.; Mattoo, S.; Munchak, L.A.; Remer, L.A.; Sayer, A.M.; Patadia, F.; Hsu, N.C. The Collection 6 MODIS aerosol products over land and ocean. Atmos. Meas. Tech. 2013, 6, 2989–3034. [Google Scholar] [CrossRef] [Green Version]
Figure 1. Location of the dust monitoring station (red dot), of the stations of the Réseau National de Surveillance de la Qualité de l’Air (RNSQA) mentioned in this paper (yellow dots), of the stations of the Tunisian National Institute of Meteorology mentioned in this paper (green dots), and of some the main geomorphological features of the region (terms in italics) (adapted from a Google Earth image).
Atmosphere 10 00452 g001
Figure 2. Annual mean PM10 concentrations (in µg m−3) recorded in the countries downwind the Sahara. Colors indicate data source: Green = Pey et al. [45]; black = this study; blue = the 2016 WHO GUAAP Database; orange = Kaly et al. [46]. Details on the location, type, and data coverage is given for each station in Table A2 (Appendix B). Rural and regional background stations are identified using bold italics font.
Atmosphere 10 00452 g002
Figure 3. Percentage of days in the month with daily mean PM10 concentrations greater than 120 µg m−3 (grey bars) and 260 µg m−3 (black bars) averaged for the period February 2014–February 2019.
Atmosphere 10 00452 g003
Figure 4. Daily mean of PM10 concentration (in µg m−3; black line with dots) from 10 February 2014 to 28 February 2019. Numbers in and above the graph give the highest measured values. Grey dashed and dotted lines indicate the limit value relative to well-being (120 µg m−3) and health (260 µg m−3) according to Tunisian standards, respectively.
Atmosphere 10 00452 g004
Figure 5. Daily minimum α440–870 as a function of daily mean PM10 concentration (in µg m−3) from 24 July 2014 to 28 February 2019. Dashed and dotted lines indicate the limit value relative to well-being (120 µg m−3) and health (260 µg m−3) according to Tunisian standards, respectively.
Atmosphere 10 00452 g005
Figure 6. Five-minute PM10 concentrations (in µg m−3) on 12 February 2014 (black), and 13 May 2014 (grey). For each date, daily mean PM10 concentration is given in parenthesis.
Atmosphere 10 00452 g006
Figure 7. Percentage of time during which the hourly mean PM10 concentration was between [0;40[, [40;80[, [80;120[, [120;240[, [240;400[, [400;800[, [800;1200[, [1200;2400[ and greater than 2400 µg m−3 in El Fjé during the period February 2014–February 2019.
Atmosphere 10 00452 g007
Table 1. Tunisian ambient air standards NT 106 04 for airborne particles.
Type of AverageAuthorization of ExcessLimit Value Relative to Health (µg m−3)Limit Value Relative to Well-Being (µg m−3)
Annual-8040–60
Dailyonce a year260120
Table 2. Annual mean PM10 concentrations (in µg m−3) recorded in El Fjé from 2014 to 2018. The asterisk highlights the years for which a month of data is missing.
Year.Annual Mean PM10 Concentrations (µg m−3)
2014 *56
2015 *44
201651
201732
201842

