Abstract
The seasonal extent of the North American Monsoon (NAM) is highly variable and potentially sensitive to future climate change. Our objective was to determine how regional monsoonal patterns influence mountain precipitation near the NAM northwest boundary. Among the data we analyzed, a unique opportunity was provided by hourly observations collected on the Sheep Range (2300 m asl), in the Mojave Desert of southern Nevada, during 2011–2017. Long-term 800-m Parameter-elevation Relationships on Independent Slopes Model (PRISM) precipitation time series showed that the site is representative of mountain areas in the NAM northwest region. Based on in situ observations, we divided the water year into three seasons: cool (1 October through 31 March), early warm (1 April through last day with dewpoint <9.4 °C), and late warm (first day with dewpoint ≥9.4 °C through 30 September). Dewpoint temperature differed by about 8 °C between early warm season (mean of −6.3 °C) and late warm season (mean of 2.3 °C). According to ANCOVA model results, increasing hourly dewpoint associated with afternoon thunderstorms in the late warm season had the greatest relationship with hourly precipitation (F-value = 237.8, p-value < 0.01). Except for 2016, more precipitation fell at our study site during the late than the early warm season. Late warm season precipitation contributed the most (43–56%) to total water-year precipitation during the 2012–2015 extended drought. Southwestern USA regional composites of vertically integrated water vapor transport (IVT) suggested that water vapor in the cool and early warm season originated from the Pacific Ocean to the west, while a transition to a NAM-like pattern of northward IVT coincided with the late warm season.
1. Introduction
Large-scale precipitation patterns are projected to shift as the Earth’s atmosphere and oceans warm during the 21st century, and monsoonal precipitation is one such pattern [1]. The North American Monsoon (NAM; [2]) has been a subject of intense research in recent years, with multiple field campaigns and modeling studies (see [3] for a recent summary). Douglas et al. [4] identified one of its moisture sources when winds shift northwards on the west side of the Sierra Madre Occidental, transporting water vapor along the Gulf of California, and causing summertime precipitation that progressively moves from Central America in May to western Mexico in June [5,6]. Further east, moisture originating from the Gulf of Mexico and Caribbean Sea is forced to rise by the complex mountain landscape, and eventually is transported northward into the NAM region [2]. Some moisture may be recycled through terrestrial vegetation evapotranspiration [7], even though this hypothesis was generated from an atmospheric reanalysis, and validation field data are still lacking. Depending on the location, any combination of four major sources of moisture—Gulf of California, Gulf of Mexico, land, and the Pacific Ocean—can be responsible for the bulk of summer rainfall [3].
NAM precipitation typically arrives in the southwestern USA during early July, even though onset dates, total amounts, seasonal distribution, and affected regions can vary considerably from year to year [6]. Convective thunderstorms develop over the topographically diverse terrain of the southwestern USA, driven by influxes of low-level moisture, strong surface heating, and resulting thermodynamic instability [8]. Deep convection over the elevated topography of the region [9] can organize into mesoscale convective systems, which produce intense precipitation usually in the afternoon, but also in the evening or night, especially at lower elevations [10,11,12,13]. Moisture surges from the Gulf of California, as well as tropical Pacific cyclones originating off the southern coast of Mexico, are responsible for precipitation during late summer, especially at the northwest boundary of the NAM, where individual storms can produce a large fraction of the total monsoon rainfall in just one event [14].
Summertime precipitation linked to the NAM may also reflect thermal effects of western US snowpack on the high-pressure system located where the states of Arizona, Utah, Colorado, and New Mexico meet [15]. The duration of the winter snowpack can influence the start of the monsoon season [16,17]. Heavy winter snowpack from the previous winter may increase soil moisture and decrease surface temperatures in the summertime, thereby limiting convective energy available for monsoonal thunderstorms [18,19]. Even though the correlation between cool and warm season precipitation is generally weak and temporally unstable in paleoclimatic records, such “opposite sign” anomalies have been increasingly observed during the mid-to-late 20th century [20].
The NAM domain has been subdivided in eight regions, as defined by the North American Monsoon Experiment Forecast Forum [21]. Southern Nevada is part of region 7, which occupies the northwest boundary of the NAM region [20]. Relatively few studies have focused on NAM boundary regions compared to the core area, especially when considering the western-northwestern edge of the NAM. Our main objective was to determine how large-scale monsoonal patterns influence precipitation in mid-to-upper elevations near the NAM northwest boundary. With that goal, we quantified hourly, inter-seasonal, and inter-annual variability using three independent data sources. Among the data we analyzed, a unique opportunity was provided by hourly observations collected on a remote mountain site during 2011–2017. In our three-pronged investigation, we addressed the following questions. (1) Was our study site representative of the NAM northwest boundary based on long-term precipitation data? (2) What were the meteorological variables most closely linked to NAM precipitation at our study site? (3) Which moisture sources were likely responsible for NAM precipitation at our study site?
2. Data and Methods
2.1. Study Site and Classification of Three Seasonal Intervals
We had an opportunity to investigate monsoonal dynamics at hourly intervals thanks to an automated weather station that operated continuously since April 2011 at 2300 m asl in a remote location on the Sheep Range, ~35 km north-northwest of Las Vegas (Figure 1). This unique site is part of the Nevada Climate-ecohydrological Assessment Network (NevCAN), an observing system managed by the Nevada System of Higher Education [22]. The Sheep Range is a ‘sky-island’ within the Mojave Desert, and our site is within the Desert National Wildlife Refuge, which is managed by the US Fish and Wildlife Service. Given the relatively high elevation of our study site, vegetation is dominated by ponderosa pine (Pinus ponderosa Lawson & C. Lawson) and single-leaf pinyon pine (Pinus monophylla Torr. & Frém.), with sparse Utah juniper (Juniperus osteosperma (Torr.) Little). Shrub and herbaceous cover is almost absent. Soil type includes colluvium and/or residuum from weathered dolomite and limestone classified as loamy-skeletal, mixed, superactive, mesic Aridic Lithic Haplustolls [23].
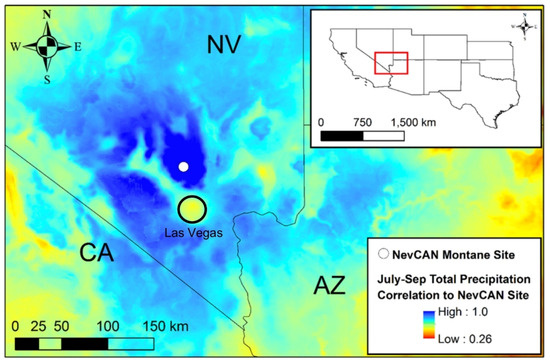
Figure 1.
Interpolated pseudo-color map of Pearson’s linear correlation between July–September total precipitation at our mountain site (solid white circle) and at each 800-m PRISM grid cell in the surrounding region during 1895–2015. All correlations were statistically significant (p-value < 0.01), with lower values usually corresponding to lower elevations, such as the Las Vegas valley (black circle).
Daily meteorological data collected at the site were obtained from the Western Regional Climate Center (https://wrcc.dri.edu/cgi-bin/rawMAIN.pl?idnes4). Weather variables included barometric pressure, precipitation, air temperature, and relative humidity at 2-m height. Soil temperature and moisture probes had been installed around the NevCAN weather station at the time of its construction, and we obtained soil temperature at 5-cm depth and soil volumetric water content (VWC) at two soil depths: 2–17 cm and 17–32 cm. High-resolution images taken at noon local time by a remotely operated camera placed at the top of the station tower were used to determine the presence of snow, as well as the last day of the year when snow was present. Vapor pressure deficit (VPD) and dewpoint temperature were calculated using formulas included in [24,25,26,27] and also provided in Appendix A.
Careful evaluation of the 2011–2017 meteorological data indicated that warm-season precipitation events occurred at the study site after average daily dewpoint temperatures reached 9.4 °C. Dewpoint thresholds have indeed been used operationally to define monsoon onset by local National Weather Service Forecast Offices in the Southwest. These thresholds can vary between locations, as Phoenix used 12.8 °C and Tucson 12.2 °C, while regional analyses have suggested 10 °C [28], but no single value is able to capture the onset of the monsoon across space and time. We used our threshold to distinguish between early warm season (pre-monsoon) and late warm season (monsoonal). Specifically, we performed seasonal analyses for the 1 April 2011 to 30 September 2017 period using three subdivisions of the water year (previous October through current September): (a) cool season (1 October through 31 March), (b) early warm season (1 April through last day with dewpoint < 9.4 °C), and (c) late warm season (first day with dewpoint ≥ 9.4 °C through 30 September). We also calculated average diurnal (or diel) cycles by season for weather and soil variables using hourly data aggregated from NevCAN measurements. These graphs normally do not include error bars (see [29] for a recent example) because their purpose is to visualize and summarize observations in an effective way, rather than to formally test for statistical significance [30]. However, in order to highlight the variability of each hourly average, and also to indicate significant differences among seasons, we added two-standard error bars above and below each mean.
2.2. Analysis of NAM-Related Variability
We first tested whether July through September precipitation at our study site is representative of precipitation variability elsewhere at the northwest boundary of the NAM. For this analysis, we purchased the 800-m grid cell version of the Parameter-elevation Relationships on Independent Slopes Model (PRISM) dataset [31]. We then extracted July–September precipitation totals during 1895–2015 for the grid cell containing the study site as well as for 475,415 other grid cells across the surrounding region. Overall temporal synchronicity was estimated using Pearson’s simple linear correlation between each grid cell precipitation and that of our study site.
We then investigated the linkage between afternoon thunderstorms occurring at the study site during the late warm season and other in-situ meteorological variables. Because the variables we considered were highly correlated, we identified relationships with precipitation using analysis of covariance (ANCOVA). Total hourly precipitation was used as predictand, whereas hourly solar radiation, air temperature, vapor pressure deficit, and dewpoint temperature were used as predictors, with each variable having its own ANCOVA. Seasons, as well as hour of the day, were considered independent categorical variables in each ANCOVA, and an interaction term was introduced between hour of the day and the meteorological variable in each model. All statistical analyses were performed using the R computing environment [32].
Finally, we evaluated whether the late warm season precipitation at the study site was indeed NAM-derived using reanalysis fields of atmospheric water vapor. Vertically integrated vapor transport (IVT, kg m−1 s−1) data were obtained from the web site maintained by NOAA Earth System Research Laboratory, Physical Sciences Division, to make available the National Centers for Environmental Prediction/National Center for Atmospheric Research (NCEP/NCAR) Reanalysis products (https://www.esrl.noaa.gov/psd/data/composites/day/derived.html). Seasonal IVT composites were then calculated and mapped to represent both the amount of water vapor in the atmosphere and the directions along which water vapor was being transported. These results were used to determine whether late warm season IVTs to the study site bore the signature northward patterns that characterize NAM conditions.
3. Results
3.1. Precipitation Patterns
Variations in July–September total precipitation during 1895–2015 at our study site were significantly correlated (p-value < 0.01) with all 475,416 PRISM grid cells used in our analysis (Figure 1). Within this region, the mid-to-upper elevations of the Sheep Range and Spring Mountains (southwest of the Sheep Range) were the most correlated locations (r > 0.8), whereas precipitation in the Las Vegas metropolitan area (south-southeast of the Sheep Range) and other low-elevation valleys were less correlated (r < 0.4; Figure 1). Because relatively high correlations (cyan to blue colors in Figure 1) were found over most of the NAM northwest sector, our site is representative of historical variations in late-warm season precipitation for most areas, and especially those covered by woody vegetation, near the northwest boundary of the NAM.
The 9.4 °C daily mean dewpoint temperature threshold was met in early July (1–5) during 2011, 2014, 2015, and 2016, while it was reached in mid-July (11–17) in 2012, 2013, and 2017 (Figure 2a, Table 1). Late warm-season precipitation, following the dewpoint temperature threshold, reached the Sheep Range in July of every year. These dates fall within the 21 June–3 August window, which is when NAM precipitation arrives in its core region [33]. Daily dewpoint temperature and precipitation were significantly correlated (p-value < 0.001) for all three seasons, with the late warm-season relationship being slightly higher (r = 0.33) than that for the cool season (r = 0.29) and early warm season (r = 0.24).
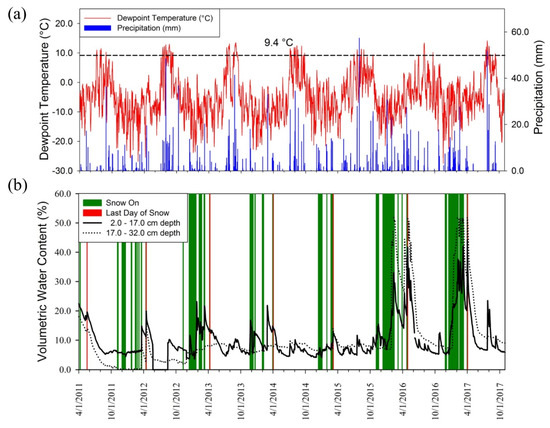
Figure 2.
Time series plots of daily environmental variables measured at our study site. (a) Average dewpoint temperature and total precipitation; a 9.4 °C threshold of dewpoint temperature was used to identify the arrival of North American Monsoon (NAM) precipitation. (b) Volumetric water content at two soil depths (2–17 cm and 17–32 cm) and days when snow was present (see text for details).

Table 1.
Summary of seasonal and water year precipitation totals (PPT) at our study site in the Sheep Range of southern Nevada (Figure 1).
A severe drought in 2012–2015 affected California as well as southern Nevada, including our study site. The number of days when snow was present for each cool season from October 2012 to March 2015 was less than for the cool seasons of October 2015 through March 2017. In concurrence, snow disappeared earlier from 2012 to 2015 (16 April 2012 to 7 March 2015) than from 2016 to 2017 (30 April 2016 to 2 April 2017) (Figure 2b). There was no significant correlation between daily precipitation and soil volumetric water content, which, however, increased substantially at both depths during the wet 2016 and 2017 water years (Figure 2b and Figure 3). Soil moisture generally remained higher at the greater depth during wet (2016–2017) and dry (2014–2015) years, whereas greater water content was observed in the shallower soil layer during most of the initial recording period (2011–2013; Figure 2b). Soil temperature varied little (data not shown) and was ≤0 °C rarely (105 days out of the 2375 included in the study period) even at the shallow (5 cm) depth we considered. All the days with average soil temperature below freezing point occurred in the cool season, with 95% of them recorded from December to February. December had an average of seven days (range from 0 to 12 days), January had average of six days (range from 0 to 21), and February had an average of three days (range from 0 to 6). No days with frozen soil were observed in February during 2015–2017, and 2017 was completely frost-free, most likely because of increased snow cover during those years (Figure 2b).
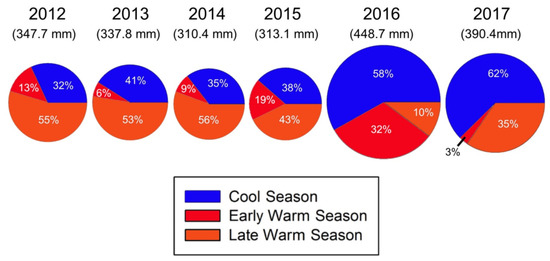
Figure 3.
Precipitation percentages at our study site for cool (1 October–31 March), early warm (1 April to the day prior to 9.4 °C dewpoint threshold), and late warm (day of 9.4 °C dewpoint threshold to 30 September) seasons of the 2012–2017 water years.
Increased snow cover from October 2015 through December 2017 corresponded to higher percentages of cool-season precipitation (Figure 3) during the 2016 (58% of total) and 2017 (62% of total) water years. The greatest contribution of early warm-season total precipitation to the water year was in 2016 (32% of total), following a wet cool season, which led to the termination of the multi-year severe drought. Increased precipitation in the 2016 cool season and early warm season was followed by reduced late warm season precipitation (10% of total; Figure 3). Except for 2016, more precipitation fell at our study site during the late warm season than the early warm season (Table 1), highlighting the NAM influence. Late warm season precipitation was relatively similar (173–190 mm) in 2012–2014, during a severe drought, but was considerably lower during the large snowpack years of 2011 (72 mm) and 2016 (46 mm), and also (albeit less so) in 2017 (135 mm). Late warm-season precipitation in fact accounted for the majority of total water-year precipitation in 2012 (55%), 2013 (53%), 2014 (56%), and 2015 (43%; Figure 3). The 2017 water year was very wet at the site, mostly due to storms originating from the Pacific Ocean that also brought record precipitation to the Sierra Nevada. While the 2017 cool season was notably wet, a large percentage of precipitation also fell during the late warm season (35%; Figure 3).
3.2. Diurnal Cycle and Relationship with Precipitation
The quality of our dataset was supported by the extremely low number of missing observations (no more than 8 out of 59,208 hourly records). Hourly precipitation was extremely variable, as shown by its large error bars (greatest during the late warm season; Figure 4a). Most precipitation in the cool and early warm season fell in the morning and afternoon, from 08:00 to 16:00 (79% of the total daily value in the cool season, with a peak at 11:00, and 74% in the early warm season; Figure 4a). In the late warm season, less precipitation (53%) fell in this interval, and mostly in the later hours, from 11:00 to 16:00 (49%, with a peak at 15:00), likely indicative of convective afternoon thunderstorms that are characteristic of NAM precipitation. A second surge of precipitation in this season fell at night, from 23:00 to 01:00 (Figure 4a), accounting for 18% of the average daily total.
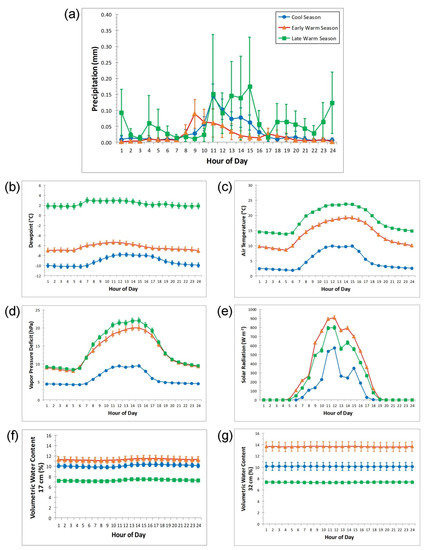
Figure 4.
Average diurnal cycles of weather and soil variables by season. The variability of each hourly value is shown by vertical bars corresponding to two standard errors above and below the mean. Meteorological variables include: (a) total precipitation, (b) dewpoint temperature, (c) air temperature, (d) vapor-pressure deficit, (e) and solar radiation. Soil variables are (f) volumetric water content (VWC) at 2–17 cm soil depth, and (g) VWC at 17–32 cm soil depth.
Dewpoint temperature differed by about 8 °C between early warm season (mean of −6.3 °C) and late warm season (mean of 2.3 °C) for every hour of the diel cycle (Figure 4b). This was the greatest difference between seasons for any of the variables we analyzed, and was also statistically significant for every hour (Figure 4b). Both dewpoint and air temperature increased significantly from cool season to early warm season to late warm season (Figure 4b,c). Early and late warm-season hourly VPD values were comparable during the night but were significantly greater in the late warm season during the morning and early afternoon (08:00–15:00). Early and late warm-season VPD were both significantly greater than cool season values (Figure 4d). Solar radiation was significantly lower during the cool season; it reached a maximum in the early warm season, and then significantly decreased in the late warm season likely due to increased cloud cover during the day (Figure 4e). Volumetric water content at both depths was quite stable during the diel cycle, and was highest in the early warm season, especially in deep soil, and lowest in the late warm season (Figure 4f,g), likely because of the seasonal balance between snowmelt infiltration and evapotranspiration.
Statistical relationships derived from the hourly dataset of meteorological variables, seasons, and hour of the day, as quantified by ANCOVA, showed that each season had a similar influence on hourly precipitation (F-values for ANCOVA models ranged from 28.9 to 29.6, p-value < 0.01). Hour of the day was not significant in any of the ANCOVAs. Dewpoint temperature had the greatest relationship with hourly precipitation (F-value = 237.8, p-value < 0.01), followed by VPD (F-value = 100.3, p-value < 0.01), solar radiation (F-value = 42.8, p-value < 0.01), and air temperature (F-value = 9.3, p-value < 0.01). The only significant interaction between hour of the day and meteorological variables was with dewpoint temperature (F-value = 4.7, p-value = 0.03). Thus, dewpoint temperature had the strongest relationship with hourly precipitation, while VPD, solar radiation, and air temperature lagged far behind.
An association between increasing dewpoint temperature and precipitation was quite evident when plotting total weekly precipitation and average weekly dewpoint temperature at our study site (Figure 5). This relationship became noisier, albeit still visible, when variables were calculated on a daily or hourly time scale (Appendix B). Individual precipitation events can be very intense and drop large rainfall amounts within short periods, as shown by a thunderstorm that produced 57 mm of precipitation in less than five hours during the afternoon of 1 August 2015 (Figure 2a).
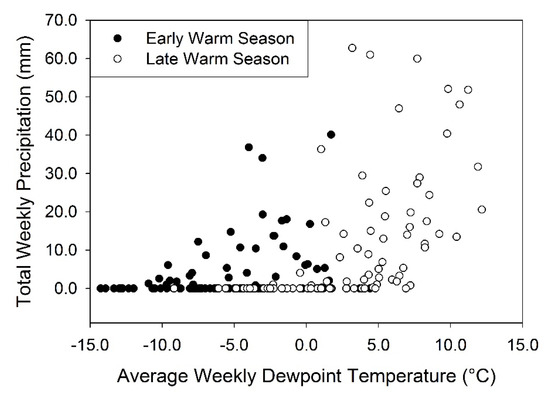
Figure 5.
Total weekly precipitation plotted against average weekly dewpoint temperature for early and late warm season at our study site. The larger precipitation events occurred during the late warm season as dewpoint temperature increased.
3.3. Analysis of Integrated Vapor Transport (IVT)
Sources of water vapor that reached the NevCAN site differed between the cool and early warm seasons versus the late warm season. Cool-season and early warm-season IVT originated over the North Pacific and resulted in precipitation at our site from Pacific frontal storms, whereas late warm-season IVT arrived from the Gulf of California and the eastern tropical Pacific (Figure 6), as expected for the NAM. The Sierra Madre Occidental appeared as a terrestrial source of IVT, possibly because of mixing of moisture due to deep convection resulting from water vapor transport from the Gulf of California and eastern Pacific. Some additional moisture may have originated from local evapotranspiration as well as from convective activity further south over Mexico [7,34], but reanalysis data are of low geographic resolution that does not distinguish such divisions well, particularly over a complex region such as northwest Mexico where few long-term reliable datasets exist [35].
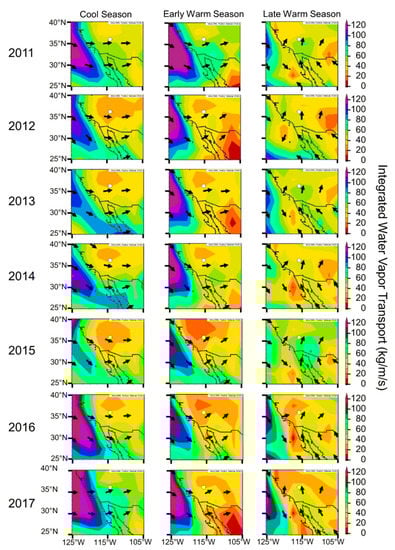
Figure 6.
Seasonal averages of integrated water vapor transport (IVT) for the 2011–2017 water years. Pseudo-color shading with overlaid vectors (arrows) was used to indicate the amount of moisture and the direction of transport. Cool-season IVT, and resulting precipitation (Figure 3), was large in 2011, 2016, and 2017, as well as for the 2015 late warm season.
The 2011, 2016, and 2017 cool seasons, which were outside the drought period, experienced greater IVT off the Pacific coast, likely associated with more frequent Pacific frontal storms resulting in greater cool-season precipitation at our site. In fact, 2016 and 2017 were the only years when cool-season precipitation was the greatest contributor to total water-year precipitation (Figure 3, Table 1). Early warm-season IVT for all years except 2011 was similar or less than for the cool season, as also reflected in decreased precipitation (Figure 3, Table 1). Late warm-season IVT composite indicated water vapor reaching southern Nevada from the south each year (Figure 6).
4. Discussion
4.1. NAM Precipitation Variability
In situ weather data are rarely available at high elevations in topographically complex regions over several years [36], but they can often generate novel insights and hypotheses on meteorological processes [37] or be used to test accuracy of interpolated datasets [38]. The continuous hourly observations, in relation to the IVT seasonal composites, provided an opportunity to assess how summertime precipitation in southern Nevada reflects the large-scale meteorology and expression of the NAM northwest extension. Local meteorological variables, especially dewpoint temperature, were correlated with the amount of precipitation falling at the study site. Therefore dewpoint temperature was appropriate to define the boundary between early and late warm-season precipitation. These findings support the National Weather Service usage of dewpoint temperature as the atmospheric variable to define the NAM onset.
The transition from early to late warm season with the arrival of NAM precipitation at our site corresponds to an increase in frequency of convective afternoon thunderstorms linked with moisture surges from the Gulf of California [39,40]. These surges are anomalous southerly flow events with the duration of a few days [41] that can generate intense precipitation [2], reaching as far as the western-northwestern NAM boundary. During strong monsoonal years, like 2015, water vapor in the late warm season associated with the NAM precipitated at the study site from afternoon convective thunderstorms. Solar radiation also decreased in diurnal cycles of the late warm season, likely because of cloud cover from afternoon thunderstorms. The arrival of afternoon convective thunderstorms begins in early-to-middle July, but the amount of precipitation that falls in each storm varies greatly. Gochis et al. [42] found that upper-to-middle elevations in the NAM core region in western Mexico have more intense and less frequent precipitation events than the highest elevations, but more frequent and less intense precipitation events than at lower elevations. These elevation-related differences in precipitation patterns are presumably responsible for the lack of correlation we uncovered between our study site and the Las Vegas valley (Figure 1). During the late warm season, Gochis et al. [42] also measured nocturnal storms, whose environmental conditions and thermodynamics have been studied by other authors [43,44,45]. Our study site, which is in the upper-to-middle elevation of the Sheep Range, displayed similar patterns. Future research could investigate monsoonal precipitation at our study site compared to other NevCAN sites to better evaluate the role of elevational differences. In addition, both local and regional NAM precipitation could be evaluated using Convective Available Potential Energy (CAPE) or other convectively important atmospheric parameters [46,47].
Regional IVT patterns indicated that precipitation regime at the study site is associated with a shift in the source region from the cool/early warm season to the late warm season. Water vapor reaching the southwestern USA during the cool season and early warm season of 2011 to 2017 originated every year from large areas in the Pacific Ocean, albeit with different strengths from one year to the next. This water-vapor transport is associated with synoptic-scale seasonal patterns of atmospheric circulation over the Pacific, e.g., variations of the North Pacific High and Aleutian Low, as well as atmospheric rivers that can strongly influence the amount of cool-season precipitation in the southwestern USA [48,49]. The transition from early to late warm season, as defined here by the 9.4 °C dewpoint threshold, coincided every year with a large-scale shift in vapor sources from the Pacific Ocean to the Gulf of California and the Sierra Madre Occidental. This shift in IVT and associated winds is one of the most characteristic meteorological patterns of the NAM [4]. Late warm-season IVT arrived at our site from the south every year from 2011 to 2017, with lower IVT values directly north and west of it. This pattern was not affected by the strength of the monsoon season in the NAM core region, which varied during these years, and also affected the amount of precipitation measured at the study site. Because NCEP reanalysis features a horizontal resolution of 2.5° × 2.5°, future research could be aimed at refining the connection between our study site and NAM circulation features, such as the Gulf of California low-level jet or the Gulf of California moisture surges, using products with smaller grid cells, including the North American regional reanalysis [50], the Modern-Era Retrospective analysis for Research and Applications, Version 2 (MERRA-2; [51]) or the European Centre for Medium-Range Weather Forecasts’ (ECMWF’s) ERA5 [52] reanalysis.
Afternoon thunderstorms associated with the NAM are crucial for maintaining the sky-island ecosystems found in the region [53], as they recharge topsoil water for biotic use after the dry early warm season. Mature ponderosa pines predominantly use winter precipitation but they are also able to exploit monsoonal precipitation to relieve summer drought stress caused by high VPD [54]. Studies conducted on ponderosa pine at our site have indicated that summertime precipitation pulses are primary drivers of stem radial expansion and growth [55]. While ecohydrological processes appear to recycle precipitation through evapotranspiration on a storm-scale [56], data from an individual location can only provide anecdotal information on such processes. For instance, the arrival of Hurricane Dolores in 2015 relieved southern Nevada from the high VPD conditions of the early warm season. The late warm-season precipitation from Hurricane Dolores was linked to the beginning of radial growth for ponderosa pine at the study site [57], and the largest precipitation event occurred about one week later.
The largest influence on soil moisture in these sky-island ecosystems is given by cool-season precipitation (Figure 2b), essentially because of snowpack melting. Soil water eventually percolates to deeper soils and is incorporated into the groundwater that flows downslope into the surrounding valleys [58]. Soil moisture recharge is lessened throughout the warm season, as shown by stable isotopic ratios measured by Ingraham et al. [59] in the adjacent Spring Mountains, and by Earman et al. [60] in Arizona and New Mexico. Stable isotope analysis has indeed been used to infer that most groundwater recharge in the southwestern US derives from snowmelt rather than warm-season precipitation [60,61]. This is supposed to happen even in areas, such as ours, where cool-season precipitation may be equal, or even less, than warm-season precipitation. It should be noted that our study site is the only location within the northwest NAM region where in situ data can be used to test the distinction in sources of groundwater recharge that has been derived from isotopic studies (see also [62]).
Variations of total July–September precipitation during 1895–2015 at the study site were well correlated with those in surrounding areas, especially at similar or higher elevations. Because monsoon precipitation is expected to be different at a ‘sky island’ location than at a lowland or basin location (such as the Las Vegas valley in this case), our results were consistent with monsoonal dynamics. We relied on the PRISM dataset because it is commonly used in the United States for studying climate change, and its impacts, even in the most prestigious journals (e.g., [63]). At the same time, every interpolated dataset is subject to potential sources of bias, and one of them was recently identified in the high-elevation SNOwpack TELemetry (SNOTEL) network, which is particularly relevant for the topographically complex landscape of the western US. SNOTEL data were found to be affected by warming artifacts and sensor biases that, when propagated into climate datasets that incorporate them, such as PRISM, have most likely amplified the “1981–2012 western U.S. elevation-dependent warming by +217 to +562%” [64]. Since we were using PRISM precipitation data, it is unlikely that such temperature bias could have produced the lower correlations between our study site and the surrounding valleys. Also, we decided to use the entire length of the PRISM record, starting in year 1895, to make the comparison less sensitive to potentially anomalous historical periods, which is always a concern when relatively few years are used. The IVT analysis suggested that water vapor associated with the NAM pattern reaches the site, and afternoon thunderstorms characteristic of NAM precipitation occurred at the site. The connection between the transition from cool- and early warm-season IVT from the Pacific Coast to the Gulf of California, the highly correlated historical trends in July–September total precipitation for the surrounding area, and the presence of afternoon convective thunderstorms provide clear evidence that our study site is highly influenced by, hence representative of, the NAM northwest boundary.
4.2. Recent Droughts and Pluvials
The 2012–2015 severe warm drought in California and Nevada has been compared to the intense droughts of the medieval climate anomaly [65], although it had shorter duration [66]. This drought was clearly reflected by the low VWC at both soil depths, which were notably drier than in either 2016 or 2017. Soil moisture is vital to the vegetation and to the iconic organisms that depend on it (e.g., desert big horn sheep and Agassiz’s desert tortoise). The low VWC during the 2012–2015 severe warm drought was linked with decreased snow cover, leading to higher soil infiltration rates earlier in the warm season because snow was melting earlier in the year.
Late warm-season precipitation was the greatest source of precipitation during the 2012–2015 drought, highlighting the importance of precipitation associated with the NAM, especially in a severe drought period. The termination of the 2012–2015 drought at the study site began with the arrival of precipitation from late warm-season water vapor originating from the Gulf of California following the warmest period we observed, during the 2015 early warm season. Water vapor originating from Hurricane Dolores off the Mexico coast, and strong thunderstorms in August 2015, brought surges of precipitation at the site. Then, a very wet 2015–2016 cool season and 2016 early warm season terminated the 2012–2015 drought. Cerezo-Mota et al. [67] found that stronger monsoon seasons may be related to a more northward, intense, and larger inter-tropical convergence zone, which could explain the intense monsoon season of 2015.
Cool seasons with more precipitation, longer snow-cover periods, and later snowpack melting allow greater opportunities for recharging soil moisture at both shallow and deep soil levels. They may also influence NAM precipitation during the following warm season [15], which may have been the case for NAM precipitation in 2016. A weak monsoon following abundant cool-season precipitation has been observed in the NAM core region, particularly in the mid-to-late 20th century, even though the dynamics of this reversal are uncertain [20,68].
5. Conclusions
Summer precipitation measured at the NevCAN site is representative of surrounding areas and NAM processes. During every year of our study, the NCEP/NCAR IVT analysis suggested that the Sheep Range falls within the northwest boundary of the NAM. This pattern was not affected by the strength of the monsoon season in the NAM core region, which was stronger in 2011, 2013, and 2015. Because the local increase in daily dewpoint temperature with the arrival of NAM-associated IVT during the late warm season had the strongest relationship to increased precipitation events at our site, daily dewpoint temperature thresholds are particularly well suited to define the local onset of NAM precipitation.
Late warm-season precipitation contributed the greatest amount of precipitation during the 2012–2015 water years, highlighting the importance of NAM precipitation amid drought. The 2012–2015 drought was followed by a wet spell that started with the influence of Hurricane Dolores, and included a monsoonal thunderstorm that produced the largest precipitation event since our site began operating. The 2015–2016 cool and early warm seasons ended the drought period, and a weak monsoon was then apparent in 2016. Future hydroclimatic variability in the NAM region, including the frequency and intensity of tropical Pacific cyclones, is highly uncertain. Shifts in global monsoon precipitation [69] could lead to major changes from the historical water balance, affecting not only the hydrology of monsoonal areas but also biotic and human communities. Better knowledge of current and past influences of the NAM upon water reserves and ecosystem responses, especially at its highly variable northwest border, provides crucial baseline information for anticipating future impacts of potential shifts in precipitation regimes.
Author Contributions
Conceptualization, M.D.D., E.Z., and F.B.; data curation, C.T. and F.B.; formal analysis, C.T., E.Z., and F.B,; funding acquisition, F.B.; investigation, C.T.; methodology, C.T., M.D.D., E.Z., and F.B.; project administration, F.B.; supervision, M.D.D. and F.B.; writing—original draft, C.T.; writing—review and editing, M.D.D., E.Z., and F.B.
Funding
This research was funded, in part, by the US National Science Foundation under grant AGS-P2C2-1401381 to F.B. and grant AGS-P2C2-1502379 to F.B. and E.Z. Additional funding was provided to F.B. by the Office of the Vice President for Research and Innovation at the University of Nevada, Reno, in relation to NevCAN. Additional support to M.D. came from the US Department of Agriculture, National Institute of Food and Agriculture (USDA-NIFA) grant entitled “Native Waters on Arid Lands”. The views and conclusions contained in this document are those of the authors and should not be interpreted as representing the opinions or policies of the funding agencies and supporting institutions.
Acknowledgments
We thank A. Csank, D.K. Adams, and S. Pascale for helpful comments and advice on an earlier version of this manuscript, S. Strachan for NevCAN maintenance, and A. Sprunger for collaborating with the NevCAN team on the Sheep Range transect. NevCAN data, including those we used in this study, are freely available from http://sensor.nevada.edu/SENSORDataSearch/.
Conflicts of Interest
The authors declare no conflict of interest. The funders had no role in the design of the study; in the collection, analyses, or interpretation of data; in the writing of the manuscript, and in the decision to publish the results.
Appendix A
Vapor pressure deficit (VPD) was calculated as the difference between saturated vapor pressure and actual vapor pressure. Saturated vapor pressure (SVP, hPa) was computed from air temperature (AT, °C) using Equation (6) in [24], as follows:
Actual vapor pressure (VP, hPa) was computed using a formula derived from ([25]; p. 37) and reported as Equation (2) in [26], as follows:
with RH (%) = relative humidity, and P (hPa) = barometric pressure.
Dewpoint temperature (DT, °C) was calculated from water vapor pressure (VP, hPa) using Equation (A.4) in [27], as follows:
Appendix B
Same as Figure 5, but also showing daily and hourly values. The x- and y-axis limits were kept constant in the three graphs to facilitate comparison. As it is typical of meteorological variables, the amount of noise increases at the shorter time scales, but the relationship is still visible.


Figure A1.
Total precipitation plotted against average dewpoint temperature for early and late warm season at our study site. The larger precipitation events occurred during the late warm season as dewpoint temperature increased.
Figure A1.
Total precipitation plotted against average dewpoint temperature for early and late warm season at our study site. The larger precipitation events occurred during the late warm season as dewpoint temperature increased.


References
- Cook, B.I.; Seager, R. The response of the North American Monsoon to increased greenhouse gas forcing. J. Geophys. Res. Atmos. 2013, 118, 1690–1699. [Google Scholar] [CrossRef]
- Adams, D.K.; Comrie, A.C. The North American Monsoon. Bull. Am. Meteorol. Soc. 1997, 78, 2197–2213. [Google Scholar] [CrossRef]
- Jana, S.; Rajagopalan, B.; Alexander, M.A.; Ray, A.J. Understanding the dominant sources and tracks of moisture for summer rainfall in the Southwest United States. J. Geophys. Res. Atmos. 2018, 123, 4850–4870. [Google Scholar] [CrossRef]
- Douglas, M.W.; Maddox, R.A.; Howard, K.; Reyes, S. The Mexican Monsoon. J. Clim. 1993, 6, 1665–1677. [Google Scholar] [CrossRef]
- Vera, C.; Higgins, R.W.; Amador, J.; Ambrizzi, T.; Garreaud, R.D.; Gochis, D.; Gutzler, D.S.; Lettenmaier, D.P.; Marengo, J.A.; Mechoso, C.R.; et al. Toward a unified view of the American monsoon systems. J. Clim. 2006, 19, 4977–5000. [Google Scholar] [CrossRef]
- Higgins, R.W.; Chen, Y.; Douglas, A.V. Interannual variability of the North American warm season precipitation regime. J. Clim. 1999, 12, 653–680. [Google Scholar] [CrossRef]
- Hu, H.; Dominguez, F. Evaluation of oceanic and terrestrial sources of moisture for the North American Monsoon using numerical models and precipitation stable isotopes. J. Hydrometeorol. 2015, 16, 19–35. [Google Scholar] [CrossRef]
- Adams, D.K.; Souza, E.P. CAPE and convective events in the Southwest during the North American Monsoon. Mon. Weather Rev. 2009, 137, 83–98. [Google Scholar] [CrossRef]
- Demko, J.C.; Geerts, B.; Miao, Q.; Zehnder, J.A. Boundary layer energy transport and cumulus development over a heated mountain: An observational study. Mon. Weather Rev. 2009, 137, 447–468. [Google Scholar] [CrossRef]
- Higgins, R.W.; Ahijevych, D.; Amador, J.; Barros, A.; Berbery, E.H.; Caetano, E.; Carbone, R.; Ciesielski, P.; Cifelli, R.; Cortez-Vazquez, M.; et al. The NAME 2004 field campaign and modeling strategy. Bull. Am. Meteorol. Soc. 2006, 87, 79–94. [Google Scholar] [CrossRef]
- Castro, C.L.; Pielke, R.A., Sr.; Adegoke, J.O. Investigation of the summer climate of the contiguous United States and Mexico using the Regional Atmospheric Modeling System (RAMS). Part I: Model climatology (1950–2002). J. Clim. 2007, 20, 3844–3865. [Google Scholar] [CrossRef]
- Carbone, R.E.; Tuttle, J.D.; Ahijevych, D.A.; Trier, S.B. Inferences of predictability associated with warm season precipitation episodes. J. Atmos. Sci. 2002, 59, 2033–2056. [Google Scholar] [CrossRef]
- Luong, T.M.; Castro, C.L.; Chang, H.-I.; Lahmers, T.; Adams, D.K.; Ochoa-Moya, C.A. The more extreme nature of North American Monsoon precipitation in the Southwestern United States as revealed by a historical climatology of simulated severe weather events. J. Appl. Meteorol. Clim. 2017, 56, 2509–2529. [Google Scholar] [CrossRef]
- Hereford, R.; Webb, R.H.; Longpré, C.I. Precipitation history and ecosystem response to multidecadal precipitation variability in the Mojave Desert region, 1893–2001. J. Arid Environ. 2006, 67, 13–34. [Google Scholar] [CrossRef]
- Hawkins, T.W.; Ellis, A.W.; Skindlov, J.A.; Reigle, D. Intra-annual analysis of the North American snow cover–monsoon teleconnection: Seasonal forecasting utility. J. Clim. 2002, 15, 1743–1753. [Google Scholar] [CrossRef]
- Notaro, M.; Zarrin, A. Sensitivity of the North American monsoon to antecedent Rocky Mountain snowpack. Geophys. Res. Lett. 2011, 38. [Google Scholar] [CrossRef]
- Zhu, C.; Lettenmaier, D.P.; Cavazos, T. Role of antecedent land surface conditions on North American Monsoon rainfall variability. J. Clim. 2005, 18, 3104–3121. [Google Scholar] [CrossRef]
- Lo, F.; Clark, M.P. Relationships between spring snow mass and summer precipitation in the southwestern United States associated with the North American Monsoon System. J. Clim. 2002, 15, 1378–1385. [Google Scholar] [CrossRef]
- Gutzler, D.S. Covariability of spring snowpack and summer rainfall across the Southwest United States. J. Clim. 2000, 13, 4018–4027. [Google Scholar] [CrossRef]
- Griffin, R.D.; Woodhouse, C.A.; Meko, D.M.; Stahle, D.W.; Faulstich, H.L.; Carrillo, C.; Touchan, R.; Castro, C.L.; Leavitt, S.W. North American monsoon precipitation reconstructed from tree-ring latewood. Geophys. Res. Lett. 2013, 40, 954–958. [Google Scholar] [CrossRef]
- Gochis, D.; Schemm, J.-K.; Shi, W.; Long, L.; Higgins, R.W.; Douglas, A.V. A forum for evaluating forecasts of the North American Monsoon. Eos Tran. Am. Geophys. Union 2009, 90, 249–251. [Google Scholar] [CrossRef]
- Mensing, S.; Strachan, S.; Arnone, J.; Fenstermaker, L.; Biondi, F.; Devitt, D.; Johnson, B.; Bird, B.; Fritzinger, E. A network for observing Great Basin climate change. Eos Tran. Am. Geophys. Union 2013, 94, 105–106. [Google Scholar] [CrossRef]
- Johnson, B.G.; Verburg, P.S.J.; Arnone, J.A., III. Effects of climate and vegetation on soil nutrients and chemistry in the Great Basin studied along a latitudinal-elevational climate gradient. Plant Soil 2014, 382, 151–163. [Google Scholar] [CrossRef]
- Murray, F.W. On the computation of saturation vapor pressure. J. Appl. Meteorol. 1967, 6, 203–204. [Google Scholar] [CrossRef]
- Brutsaert, W. Evaporation into the Atmosphere; D. Reidel Publishing Company: Boston, MA, USA, 1982; p. 299. [Google Scholar]
- Biondi, F.; Hartsough, P. Using automated point dendrometers to analyze tropical treeline stem growth at Nevado de Colima, Mexico. Sensors 2010, 10, 5827–5844. [Google Scholar] [CrossRef]
- Kunkel, K.E. Simple procedures for extrapolation of humidity variables in the mountainous western United States. J. Clim. 1989, 2, 656–669. [Google Scholar] [CrossRef]
- Ellis, A.W.; Saffell, E.M.; Hawkins, T.W. A method for defining monsoon onset and demise in the southwestern USA. Int. J. Climatol. 2004, 24, 247–265. [Google Scholar] [CrossRef]
- Prakash, S.; Shati, F.; Norouzi, H.; Blake, R. Observed differences between near-surface air and skin temperatures using satellite and ground-based data. Theor. Appl. Climatol. 2019, 137, 587–600. [Google Scholar] [CrossRef]
- Biondi, F.; Rossi, S. Plant-water relationships in the Great Basin Desert of North America derived from Pinus monophylla hourly dendrometer records. Int. J. Biometeorol. 2015, 59, 939–953. [Google Scholar] [CrossRef]
- Daly, C.; Halbleib, M.; Smith, J.I.; Gibson, W.P.; Doggett, M.K.; Taylor, G.H.; Curtis, J.; Pasteris, P.P. Physiographically sensitive mapping of climatological temperature and precipitation across the conterminous United States. Int. J. Climatol. 2008, 28, 2031–2064. [Google Scholar] [CrossRef]
- R Core Team. R: A Language and Environment for Statistical Computing, 3.0.2; R Foundation for Statistical Computing: Vienna, Austria, 2015. [Google Scholar]
- Higgins, R.W.; Yao, Y.; Wang, X.L. Influence of the North American Monsoon system on the U.S. summer precipitation regime. J. Clim. 1997, 10, 2600–2622. [Google Scholar] [CrossRef]
- Dominguez, F.; Kumar, P.; Vivoni, E.R. Precipitation recycling variability and ecoclimatological stability—A study using NARR data. Part II: North American Monsoon region. J. Clim. 2008, 21, 5187–5203. [Google Scholar] [CrossRef]
- Serra, Y.L.; Adams, D.K.; Minjarez-Sosa, C.; Moker, J.M., Jr.; Arellano, A.F.; Castro, C.L.; Quintanar, A.I.; Alatorre, L.; Granados, A.; Vazquez, G.E.; et al. The North American Monsoon GPS Transect Experiment 2013. Bull. Am. Meteorol. Soc. 2016, 97, 2103–2115. [Google Scholar] [CrossRef]
- Bradley, R.S.; Keimig, F.T.; Diaz, H.F. Projected temperature changes along the American cordillera and the planned GCOS network. Geophys. Res. Lett. 2004, 31, L16210. [Google Scholar] [CrossRef]
- Biondi, F.; Hartsough, P.; Galindo Estrada, I.G. Recent warming at the tropical treeline of North America. Front. Ecol. Environ. 2009, 7, 463–464. [Google Scholar] [CrossRef]
- Strachan, S.; Daly, C. Testing the daily PRISM air temperature model on semiarid mountain slopes. J. Geophys. Res. Atmos. 2017, 122, 5697–5715. [Google Scholar] [CrossRef]
- Favors, J.E.; Abatzoglou, J.T. Regional surges of monsoonal moisture into the Southwestern United States. Mon. Weather Rev. 2013, 141, 182–191. [Google Scholar] [CrossRef]
- Pascale, S.; Kapnick, S.B.; Bordoni, S.; Delworth, T.L. The influence of CO2 forcing on North American Monsoon moisture surges. J. Clim. 2018, 31, 7949–7968. [Google Scholar] [CrossRef]
- Bordoni, S.; Stevens, B. Principal component analysis of the summertime winds over the Gulf of California: A gulf surge index. Mon. Weather Rev. 2006, 134, 3395–3414. [Google Scholar] [CrossRef]
- Gochis, D.J.; Jimenez, A.; Watts, C.J.; Garatuza-Payan, J.; Shuttleworth, W.J. Analysis of 2002 and 2003 warm-season precipitation from the North American Monsoon Experiment event rain gauge network. Mon. Weather Rev. 2004, 132, 2938–2953. [Google Scholar] [CrossRef]
- Smith, W.P.; Gall, R.L. Tropical squall lines of the Arizona Monsoon. Mon. Weather Rev. 1989, 117, 1553–1569. [Google Scholar] [CrossRef]
- Farfán, L.M.; Zehnder, J.A. Moving and stationary mesoscale convective systems over northwest Mexico during the Southwest Area Monsoon Project. Weather Forecast. 1994, 9, 630–639. [Google Scholar] [CrossRef]
- Lang, T.J.; Ahijevych, D.A.; Nesbitt, S.W.; Carbone, R.E.; Rutledge, S.A.; Cifelli, R. Radar-observed characteristics of precipitating systems during NAME 2004. J. Clim. 2007, 20, 1713–1733. [Google Scholar] [CrossRef]
- Brooks, H.E.; Anderson, A.R.; Riemann, K.; Ebbers, I.; Flachs, H. Climatological aspects of convective parameters from the NCAR/NCEP reanalysis. Atmos. Res. 2007, 83, 294–305. [Google Scholar] [CrossRef]
- Riemann-Campe, K.; Blender, R.; Fraedrich, K. Global memory analysis in observed and simulated CAPE and CIN. Int. J. Climatol. 2011, 31, 1099–1107. [Google Scholar] [CrossRef]
- Dettinger, M.D.; Ralph, F.M.; Das, T.; Neiman, P.J.; Cayan, D.R. Atmospheric rivers, floods and the water resources of California. Water 2011, 3, 445–478. [Google Scholar] [CrossRef]
- Rutz, J.J.; Steenburgh, W.J.; Ralph, F.M. Climatological characteristics of atmospheric rivers and their inland penetration over the western United States. Mon. Weather Rev. 2014, 142, 905–921. [Google Scholar] [CrossRef]
- Mesinger, F.; DiMego, G.; Kalnay, E.; Mitchell, K.; Shafran, P.C.; Ebisuzaki, W.; Jović, D.; Woollen, J.; Rogers, E.; Berbery, E.H.; et al. North American Regional Reanalysis. Bull. Am. Meteorol. Soc. 2006, 87, 343–360. [Google Scholar] [CrossRef]
- Gelaro, R.; McCarty, W.; Suárez, M.J.; Todling, R.; Molod, A.; Takacs, L.; Randles, C.A.; Darmenov, A.; Bosilovich, M.G.; Reichle, R.; et al. The Modern-Era Retrospective Analysis for Research and Applications, Version 2 (MERRA-2). J. Clim. 2017, 30, 5419–5454. [Google Scholar] [CrossRef]
- Hoffmann, L.; Günther, G.; Li, D.; Stein, O.; Wu, X.; Griessbach, S.; Heng, Y.; Konopka, P.; Müller, R.; Vogel, B.; et al. From ERA-Interim to ERA5: The considerable impact of ECMWF’s next-generation reanalysis on Lagrangian transport simulations. Atmos. Chem. Phys. 2019, 19, 3097–3124. [Google Scholar] [CrossRef]
- Peltier, D.M.P.; Ogle, K. Legacies of La Niña: North American monsoon can rescue trees from winter drought. Glob. Chang. Biol. 2019, 25, 121–133. [Google Scholar] [CrossRef]
- Kerhoulas, L.P.; Kolb, T.E.; Koch, G.W. The influence of monsoon climate on latewood growth of southwestern ponderosa pine. Forests 2017, 8, 140. [Google Scholar] [CrossRef]
- Ziaco, E.; Biondi, F. Stem circadian phenology of four pine species in naturally contrasting climates from sky-island forests of the western USA. Forests 2018, 9, 396. [Google Scholar] [CrossRef]
- Xiang, T.; Vivoni, E.R.; Gochis, D.J. Influence of initial soil moisture and vegetation conditions on monsoon precipitation events in northwest México. Atmósfera 2018, 31, 25–45. [Google Scholar] [CrossRef]
- Ziaco, E.; Truettner, C.; Biondi, F.; Bullock, S. Moisture-driven xylogenesis in Pinus ponderosa from a Mojave Desert mountain reveals high phenological plasticity. Plant Cell Environ. 2018, 41, 823–836. [Google Scholar] [CrossRef]
- Moreo, M.T.; Senay, G.B.; Flint, A.L.; Damar, N.A.; Laczniak, R.J.; Hurja, J. Hydroclimate of the Spring Mountains and Sheep Range, Clark County, Nevada; Scientific Investigations Report 2014-5142; U.S. Geological Survey: Reston, VA, USA, 2014; p. 38.
- Ingraham, N.L.; Lyles, B.F.; Jacobson, R.L.; Hess, J.W. Stable isotopic study of precipitation and spring discharge in southern Nevada. J. Hydrol. 1991, 125, 243–258. [Google Scholar] [CrossRef]
- Earman, S.; Campbell, A.R.; Phillips, F.M.; Newman, B.D. Isotopic exchange between snow and atmospheric water vapor: Estimation of the snowmelt component of groundwater recharge in the southwestern United States. J. Geophys. Res. Atmos. 2006, 111. [Google Scholar] [CrossRef]
- Winograd, I.J.; Riggs, A.C.; Coplen, T.B. The relative contributions of summer and cool-season precipitation to groundwater recharge, Spring Mountains, Nevada, USA. Hydrogeol. J. 1998, 6, 77–93. [Google Scholar] [CrossRef]
- Devitt, D.; Bird, B.; Lyles, B.; Fenstermaker, L.; Jasoni, R.; Strachan, S.; Arnone, J.A., III; Biondi, F.; Mensing, S.; Saito, L. Assessing near surface hydrologic processes and plant response over a 1600 m mountain valley gradient in the Great Basin, NV, U.S.A. Water 2018, 10, 420. [Google Scholar] [CrossRef]
- Lobell, D.B.; Roberts, M.J.; Schlenker, W.; Braun, N.; Little, B.B.; Rejesus, R.M.; Hammer, G.L. Greater sensitivity to drought accompanies maize yield increase in the U.S. midwest. Science 2014, 344, 516–519. [Google Scholar] [CrossRef]
- Oyler, J.W.; Dobrowski, S.Z.; Ballantyne, A.P.; Klene, A.E.; Running, S.W. Artificial amplification of warming trends across the mountains of the western United States. Geophys. Res. Lett. 2015, 42, 153–161. [Google Scholar] [CrossRef]
- Hatchett, B.J.; Boyle, D.P.; Putnam, A.E.; Bassett, S.D. Placing the 2012–2015 California-Nevada drought into a paleoclimatic context: Insights from Walker Lake, California-Nevada, USA. Geophys. Res. Lett. 2015, 42, 8632–8640. [Google Scholar] [CrossRef]
- Cook, B.I.; Cook, E.R.; Smerdon, J.E.; Seager, R.; Williams, A.P.; Coats, S.; Stahle, D.W.; Díaz, J.V. North American megadroughts in the Common Era: Reconstructions and simulations. Wires Clim. Chang. 2016, 7, 411–432. [Google Scholar] [CrossRef]
- Cerezo-Mota, R.; Cavazos, T.; Arritt, R.; Torres-Alavez, A.; Sieck, K.; Nikulin, G.; Moufouma-Okia, W.; Salinas-Prieto, J.A. CORDEX-NA: Factors inducing dry/wet years on the North American Monsoon region. Int. J. Climatol. 2016, 36, 824–836. [Google Scholar] [CrossRef]
- Stahle, D.W.; Cleaveland, M.K.; Grissino-Mayer, H.D.; Griffin, R.D.; Fye, F.K.; Therrell, M.D.; Burnette, D.J.; Meko, D.M.; Villanueva-Diaz, J. Cool- and warm-season precipitation reconstructions over western New Mexico. J. Clim. 2009, 22, 3729–3750. [Google Scholar] [CrossRef]
- Seidel, D.J.; Fu, Q.; Randel, W.J.; Reichler, T.J. Widening of the tropical belt in a changing climate. Nat. Geosci. 2008, 1, 21. [Google Scholar] [CrossRef]


© 2019 by the authors. Licensee MDPI, Basel, Switzerland. This article is an open access article distributed under the terms and conditions of the Creative Commons Attribution (CC BY) license (http://creativecommons.org/licenses/by/4.0/).