Article

Investigating the Effect of Different Meteorological Conditions on MAX-DOAS Observations of NO2 and CHOCHO in Hefei, China

1
School of Earth and Space Sciences, University of Science and Technology of China, Hefei 230026, China
2
Key Lab of Environmental Optics & Technology, Anhui Institute of Optics and Fine Mechanics, Chinese Academy of Sciences, Hefei 230031, China
3
Center for Excellence in Regional Atmospheric Environment, Institute of Urban Environment, Chinese Academy of Sciences, Xiamen 361021, China
4
Anhui Province Key Laboratory of Polar Environment and Global Change, USTC, Hefei 230026, China
5
Department of Meteorology, COMSATS University Islamabad, Islamabad 44000, Pakistan
*
Authors to whom correspondence should be addressed.
Atmosphere 2019, 10(7), 353; https://doi.org/10.3390/atmos10070353
Submission received: 9 May 2019 / Revised: 20 June 2019 / Accepted: 22 June 2019 / Published: 27 June 2019
(This article belongs to the Special Issue Lower Atmosphere Meteorology)

Abstract

:
In this work, a ground-based remote sensing instrument was used for observation of the trace gases NO2 and CHOCHO in Hefei, China. Excessive development and rapid economic growth over the years have resulted in the compromising of air quality in this city, with haze being the most prominent environmental problem. This is first study covering observation of CHOCHO in Hefei (31.783° N, 117.201° E). The observation period of this study, i.e., July 2018 to December 2018, is divided into three different categories: (1) clear days, (2) haze days, and (3) severe haze days. The quality of the differential optical absorption spectroscopy (DOAS) fit for both CHOCHO and NO2 was low during severe haze days due to a reduced signal to noise ratio. NO2 and CHOCHO showed positive correlations with PM2.5, producing R values of 0.95 and 0.98, respectively. NO2 showed strong negative correlations with visibility and air temperature, obtaining R values of 0.97 and 0.98, respectively. CHOCHO also exhibited strong negative correlations with temperature and visibility, displaying R values of 0.83 and 0.91, respectively. The average concentration of NO2, CHOCHO, and PM2.5 during haze days was larger compared to that of clear days. Diurnal variation of both CHOCHO and NO2 showed a significant decreasing trend in the afternoons during clear days due to photolysis, while during haze days these two gases started to accumulate as their residence time increases in the absence of photolysis. There was no prominent weekly cycle for both trace gases.

1. Introduction

China has been ranked near the bottom of the Global Environmental Sustainability Index due to its persistent and extensive air pollution [1]. Widespread air pollution in China can be attributed to a variety of factors: high output from production and manufacturing, an extensive rise in the number of automobiles, a massive economic boom, and high population growth. Poor air quality results in the degradation of human health as well as negative impacts on terrestrial ecosystems and the built environment.
Nitrogen dioxide (NO2) and glyoxal (CHOCHO) have significant roles in varying the chemistry of the troposphere [2]. Glyoxal may originate from natural as well as anthropogenic activities [3,4,5]. The molecule is the smallest alpha-dicarbonyl with the highest predominance in the troposphere [6]. Glyoxal is generated as an intermediate product in most volatile organic compound (VOC) oxidation cycles [5,7,8] and acts as an indicator for secondary organic aerosol (SOA) formation in the atmosphere [4,7,9]. In addition, CHOCHO is also produced as an oxidation product for alkyne, isoprene, and various aromatic hydrocarbons. The concentrations of CHOCHO are not directly impacted by vehicular discharges [5] because they are only in fractions.
The formation of tropospheric ozone and the destruction of stratospheric ozone are catalyzed by nitrogen dioxide (NO2) along with other species in the troposphere [10]. The oxidation of nitrogen dioxide forms nitric acid under favorable circumstances in the atmosphere [11]. It increases the risk and incidence of infections related to the respiratory tract [12]. Combustion of fossil fuels in urban settlements has been regarded as the main source of nitrogen dioxide [13]. Additionally, nitrogen dioxide may act as a precursor for the formation of aerosols under certain meteorological conditions. Nitrate aerosols constitute a significant proportion of fine particulates in the urban environment.
In the lower atmosphere, a substantial driving factor towards pollutant distribution in terms of chemical behavior and residence time is believed to be the meteorological condition of the locality. There exist several pieces of evidence in the literature that highlight the effect of various meteorological factors on the distribution of trace gases and aerosols in the atmosphere [14]. The overall tropospheric profile including gaseous pollutants and a variety of particles along with their meteorological parameters present a dynamic and multidimensional picture of the atmosphere, aiding towards a better understanding of pollutant sources, features, and sinks, as well as their dependence on weather conditions.
Multi-axis differential optical absorption spectroscopy (MAX-DOAS) is a type of passive spectroscopy system that has been in use to observe tropospheric trace gases over the past decade. There have been some reported studies on monitoring air quality in China using MAX-DOAS instruments. Long-term observations have resulted in the demonstration of monthly, weekly, and diurnal cycles of SO2, NO2, and HCHO in China, and these long-term based observations have been published in Ma et al. [15], Wang et al. [16], and Hendrick et al. [17]. Concentrations of tropospheric nitrogen dioxide were obtained using MAX-DOAS mounted at four different locations in Shanghai in 2010 during the Shanghai World Expo [18]. A MAX-DOAS system was deployed in the Eastern part of China to monitor NO2, HCHO, and SO2 in the Yangtze River Delta (YRD) region. Shanghai, Hefei, and Nanjing were designated for long-term monitoring. Vertical profiles and vertical column densities (VCDs) of tropospheric trace gases were monitored. Minimum values of SO2 and NO2 were observed at noon, whereas maxima for HCHO occurred during noontime. The broad-spectrum concentration of the pollutants was observed to gradually decrease from Shanghai to Hefei [19]. The effect of haze and non-haze conditions on the retrieval of CHOCHO from MAX-DOAS observations in Beijing has been investigated [20].
The city of Hefei, which supports a population of 683 people/km2, is the capital city of Anhui Province. Excessive development and rapid economic growth over the years have resulted in the compromising of air quality in this city, with haze being the most prominent environmental problem. The prevalence of haze has dramatically impacted public health and has cast negative impressions on transportation networks and production systems. The city usually witnesses hazy days during the autumn and winter months of the year. This can be understood by taking into account the crop burning practices which occur during these months.
In addition, the location of the city makes it more prone to cold and dry air, with relatively gentle winds resulting in less chance for dust and other particulates to be diffused, causing the formation of haze.
Keeping in mind the aforementioned facts, Hefei may be considered a potential site for the observation of pollutants like NO2 and CHOCHO. However, there have been no studies which have reported on the monitoring of CHOCHO and effects of different meteorological conditions on the retrieval of NO2 and CHOCHO.
In this study we primarily focused on retrieval of CHOCHO and NO2 from MAX-DOAS observations. Time series and weekly and diurnal cycles of VCDs of NO2 and CHOCHO were generated. The dependence of CHOCHO and NO2 VCDs on different meteorological parameters is discussed. As a quick overview of the arguments discussed above, the current research claims the unique contribution of monitoring the air quality of Hefei, China.

2. Materials and Methods

2.1. Instrument

Ground-based observations of several trace gases were carried out using a remote sensing MAX-DOAS instrument. The instrument contains a spectrometer which has a resolution of 0.6 nm and a spectral range of 300–490 nm. The major source of light employed by the instrument is dispersed sunlight, while spectral observations can be taken at different viewing angles depending on the concerned atmospheric species [21]. An inbuilt processor automatically controls the day-to-day measurements of the instrument. The spectral measurements were recorded at elevation viewing angles of 1°, 2°, 3°, 4°, 5°, 6°, 8°, 10°, 15°, 30°, and 90°. The average time span for single measurement was 60 s.

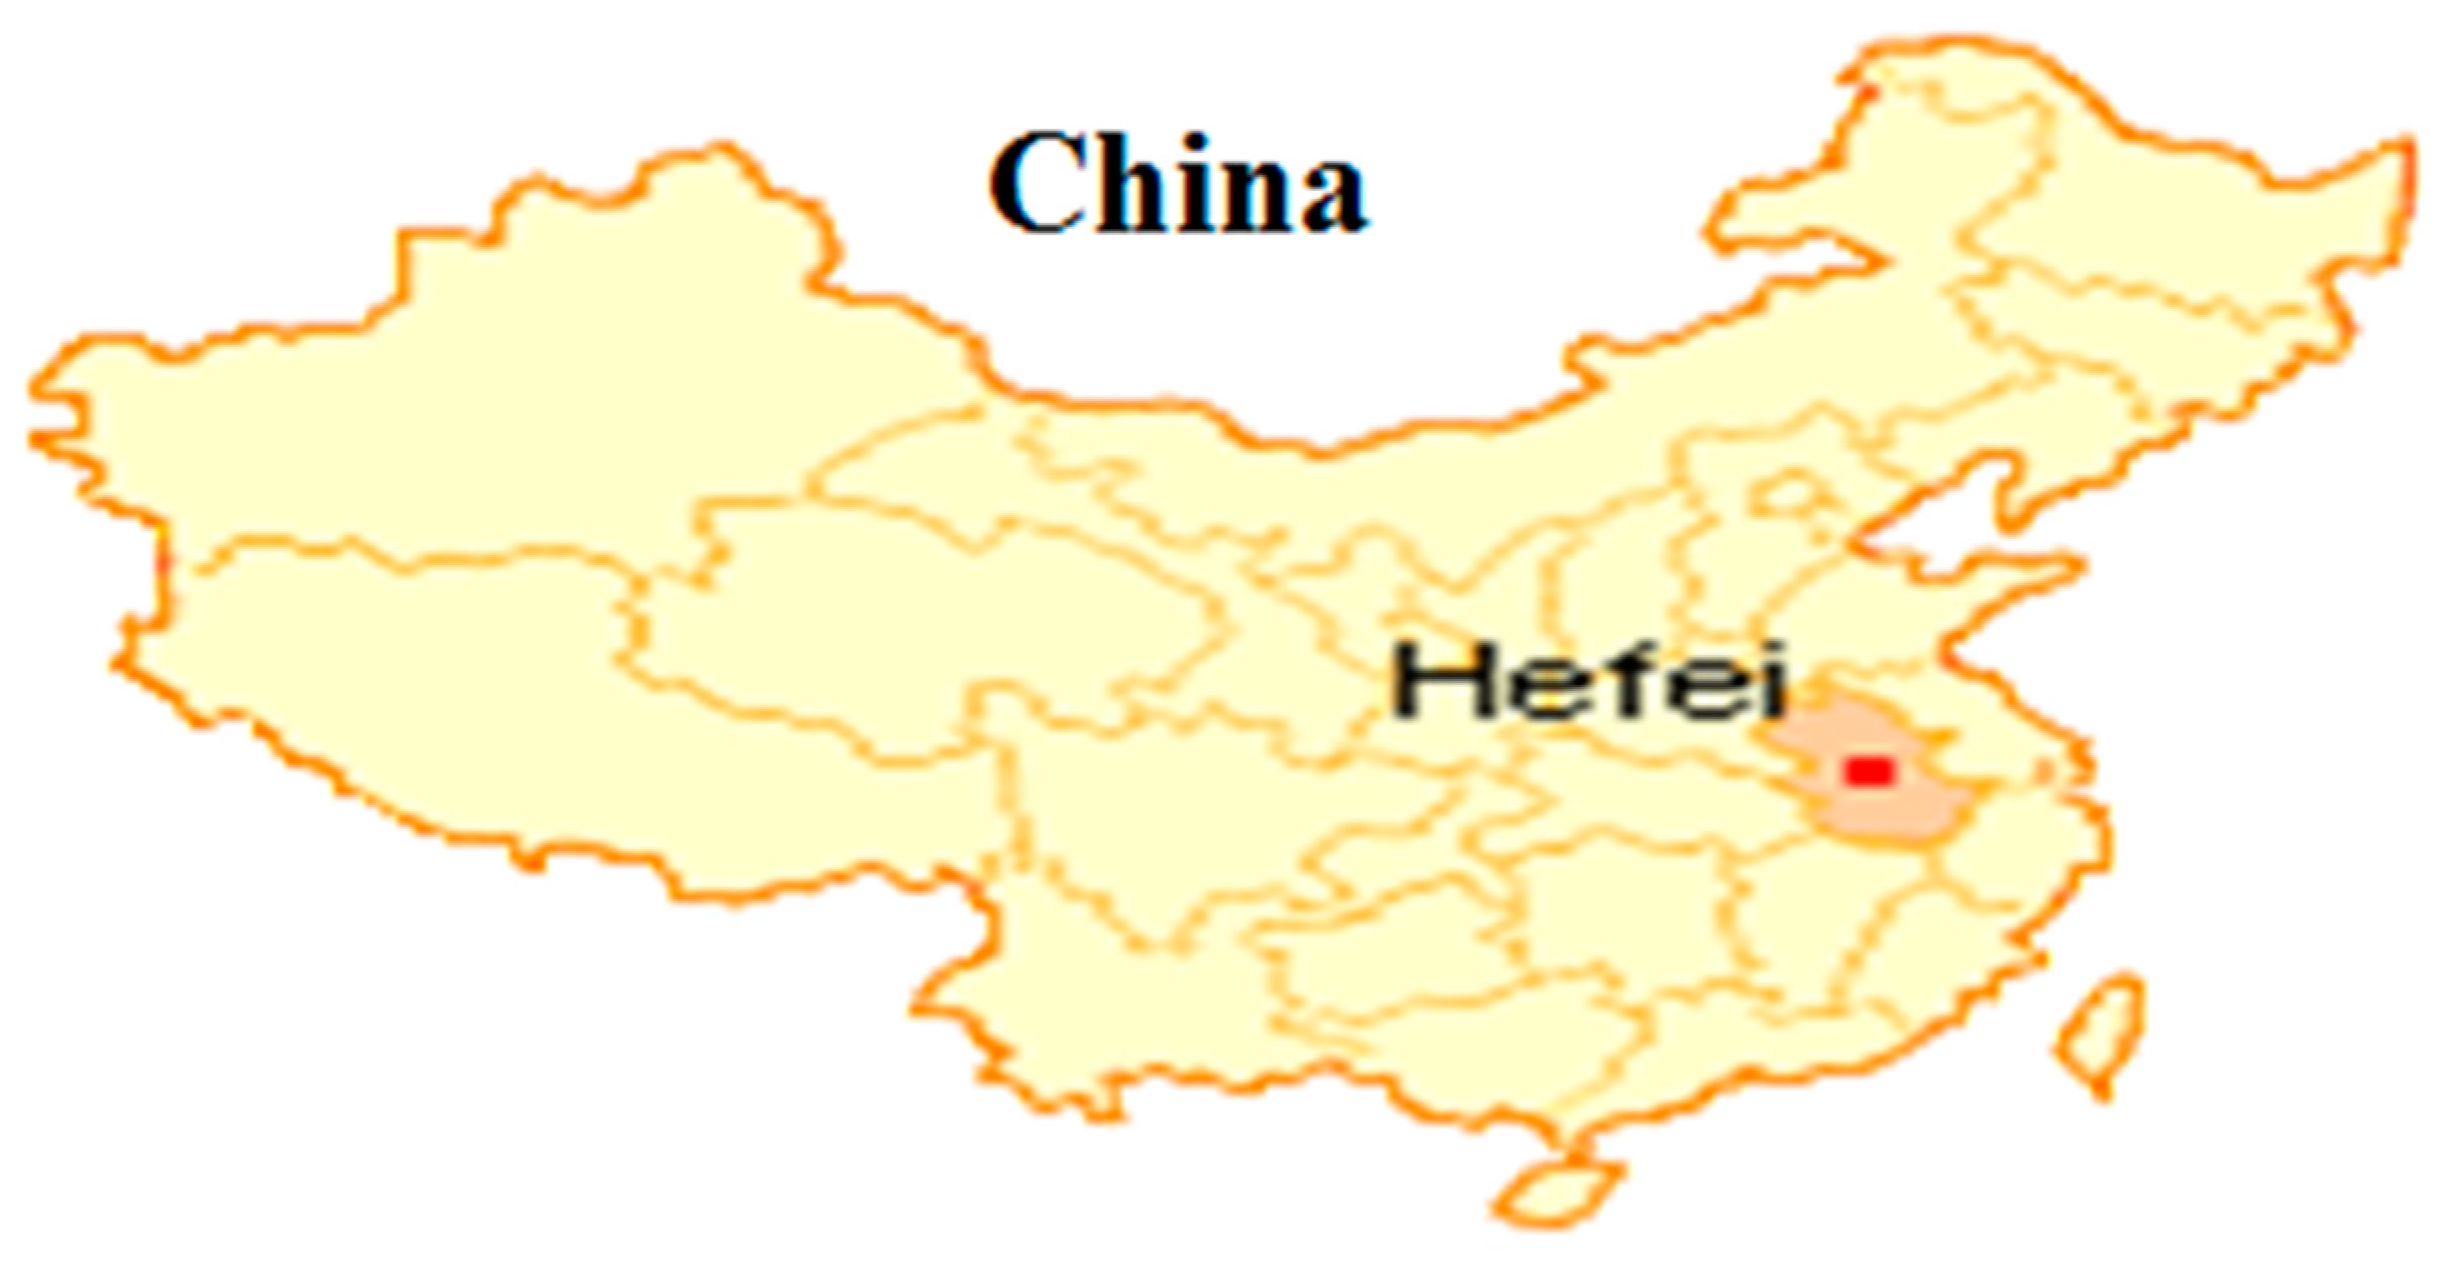
2.2. Observation Site

Anhui Province is situated in Eastern Central China with Hefei (31.783° N, 117.201° E) as the capital. The climate of the region is subtropical and humid with the existence of four distinct seasons: summer, fall, winter, and spring. The locality is dominated by southeasterly winds during summer and northwesterly during the winter season. Following a general trend, Hefei has experienced a boom in growth and development over the past two decades. At present, the city supports a permanent population of about 7.7 million. For the current study, the MAX-DOAS instrument was fitted on the building of the Hefei Environmental Protection Bureau. The observation site was almost in the center of city. Figure 1 shows the location of the observation site for MAX-DOAS measurements in Hefei, China.

2.3. DOAS Analysis

The application of DOAS provides differential slant column densities (dSCDs) for a variety of trace gases [22]. The current study analyzes MAX-DOAS spectra by employing QDOAS software developed by the Royal Belgian Institute for Space Aeronomy (BIRA-IASB) [23]. The spectra were employed to correct the measurement spectra prior to further analysis. A variety of absorption cross sections for trace gas [24,25,26,27,28], a low order polynomial, a Fraunhofer reference spectrum, and a Ring spectrum were included in the DOAS fit. Comprehensive details for the DOAS fit settings have been depicted in Table 1.
Figure 2 displays a characteristic DOAS spectral fitting of the spectrum obtained at a viewing angle of 30° on 11 November 2018. The fitting shows obvious absorption structures and low residuals, revealing that the spectral fitting is of good quality.
Vertical column densities were generated using an air mass factor (AMF) [29].
For the current study, a differential air mass factor (dAMF) was applied.
V C D t r o p = d S C D α d A M F α
The difference in AMF between α ≠ 90° and α = 90° is actually referred to as dAMF.
d A M F α = A M F α A M F 90 °
V C D t r o p = d S C D α A M F α A M F 90 °
AMF can be estimated using a geometrical approximation approach [30,31].
A M F = 1 sin ( α )
Equation (4) then becomes:
V C D t r o p = d S C D α 1 / s i n ( α ) 1

3. Results and Discussion

3.1. Meteorological Conditions

The observation period of this study, i.e., July 2018 to December 2018, has been divided into three different categories of meteorological conditions based on meteorological parameters. These three categories are (1) clear days, (2) haze days, and (3) severe haze days. The clear days are days with visibility greater than 10 km and a PM2.5 concentration less than 70 μg/m3. The haze days are days with visibility less than 10 km and greater than 5 km and where the PM2.5 concentration is greater than 70 μg/m3 and less than 115 μg/m3. The severe haze days are days with visibility less than 5 km and a PM2.5 concentration greater than 115 μg/m3 [32,33]. Table 2 shows a summary of different meteorological conditions. The data for meteorological parameters like temperature, humidity, and visibility was downloaded from (http://www.wunderground.com/). The data for meteorological parameters was obtained from a weather station installed at Hefei airport. The data for PM2.5 was downloaded from (http://beijingair.sinaapp.com/).

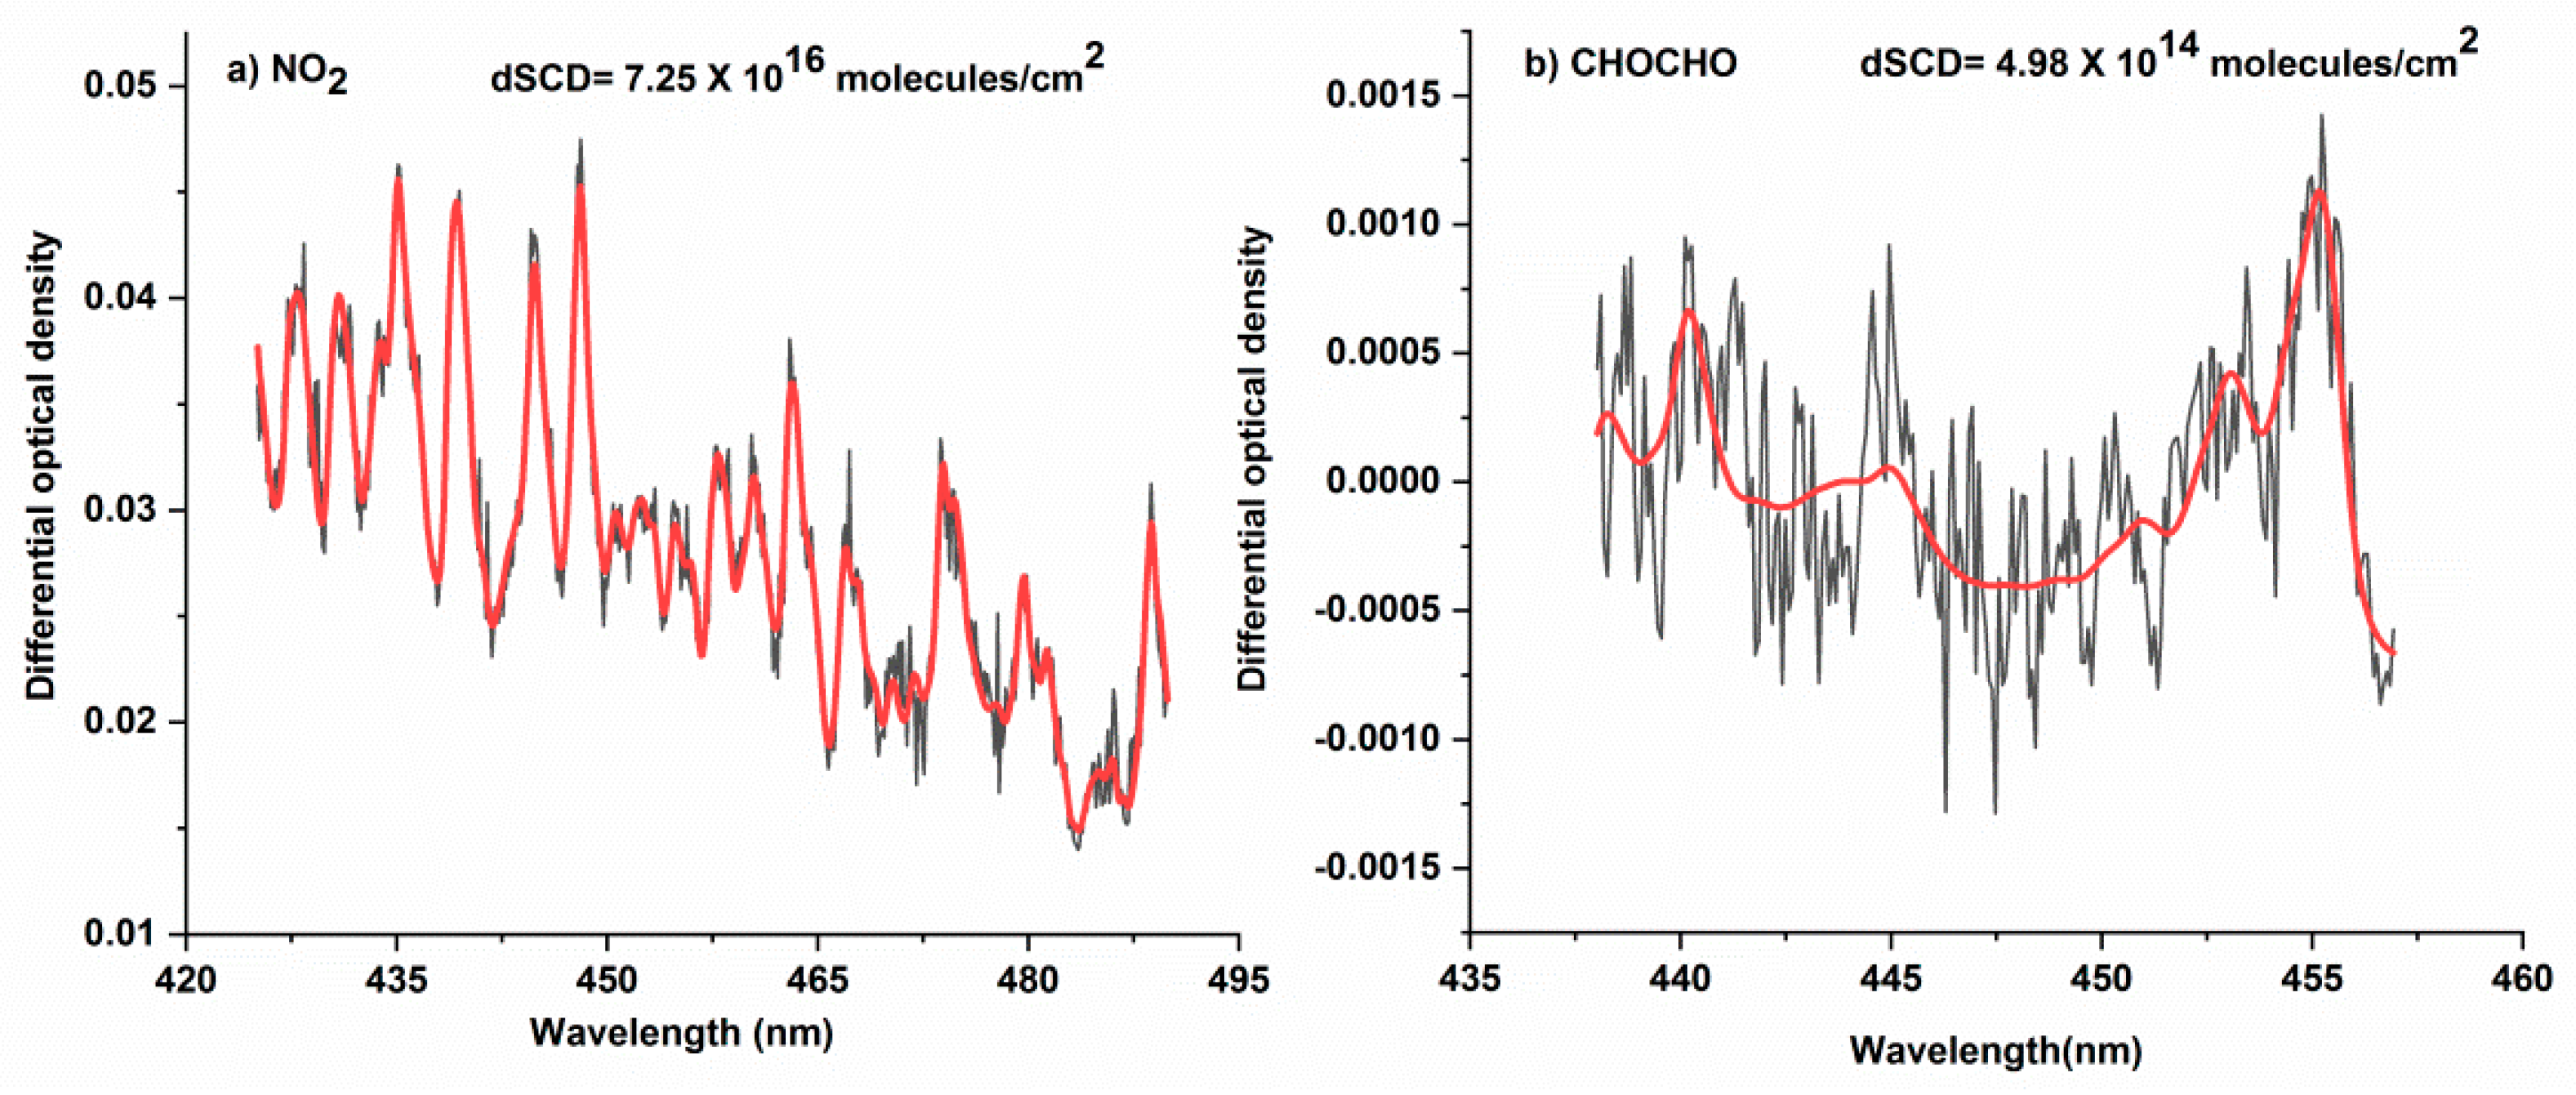
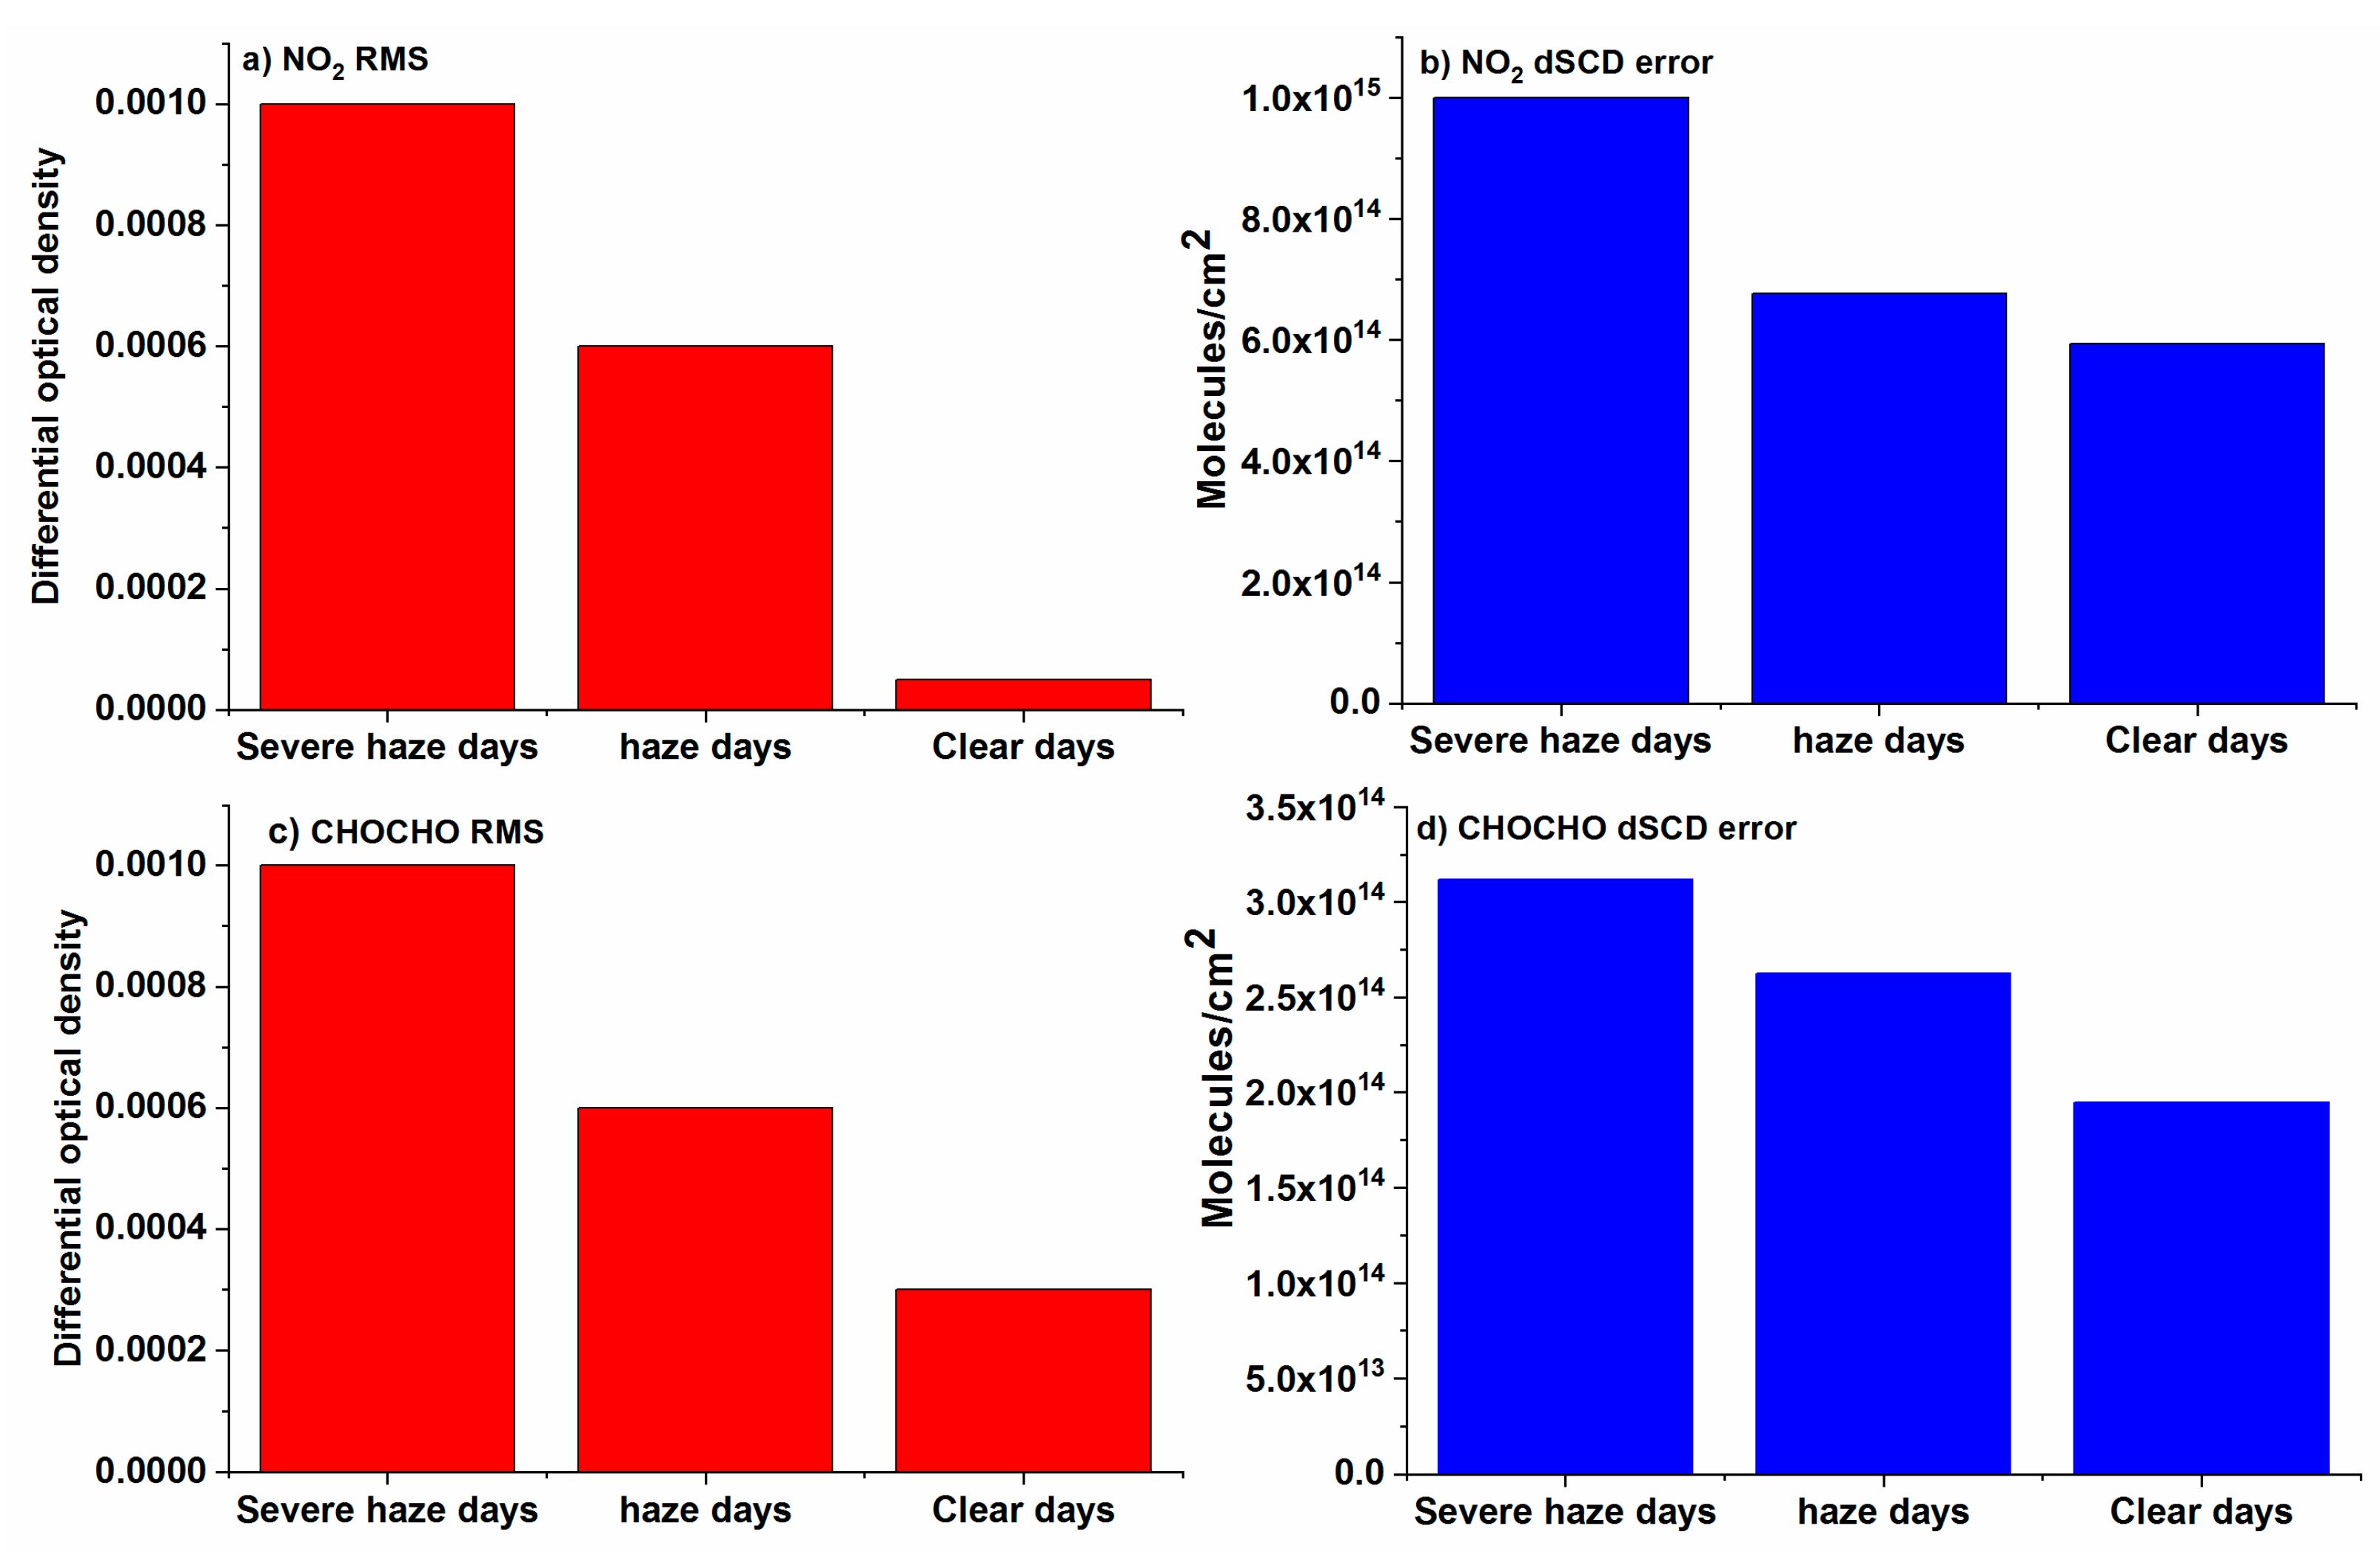
3.2. Impact of Meteorological Conditions on DOAS Fit of CHOCHO and NO2

The measurements of MAX-DOAS in the ultraviolet as well as the visible spectral range largely rely on the intensity of sunlight. The excellence of the DOAS fit is characterized by the structure of the residual left after subtracting numerous absorbers using a numerical least square fitting method [22,34] which is usually expressed using the root mean square (RMS). It is a measure of mean “instrument error” which is largely subjected to many specific parameters like limitations of the instruments (such as dark current and spectral resolution, etc.), along with limitations in illustrating the actual state of the atmosphere (for instance aerosols and scattering processes, etc.).
Figure 3 shows the average RMS and dSCD errors during different weather conditions. A higher RMS is observed during severe haze and haze days while on clear days the RMS is low. A similar trend is observed for the dSCD error with higher values during severe haze and haze days and lower values during clear days. These results can be related to the fact that during haze days the intensity of light is low, resulting in a lower signal to noise ratio. The quality of the DOAS fit is affected during severe haze days, which can be observed from the RMS and dSCD errors for both CHOCHO and NO2. This can result in an underestimation of CHOCHO and NO2 levels. By contrast, the RMS and dSCD errors during haze and clear days are in an acceptable range and do not have any significant effect on the levels of CHOCHO and NO2.

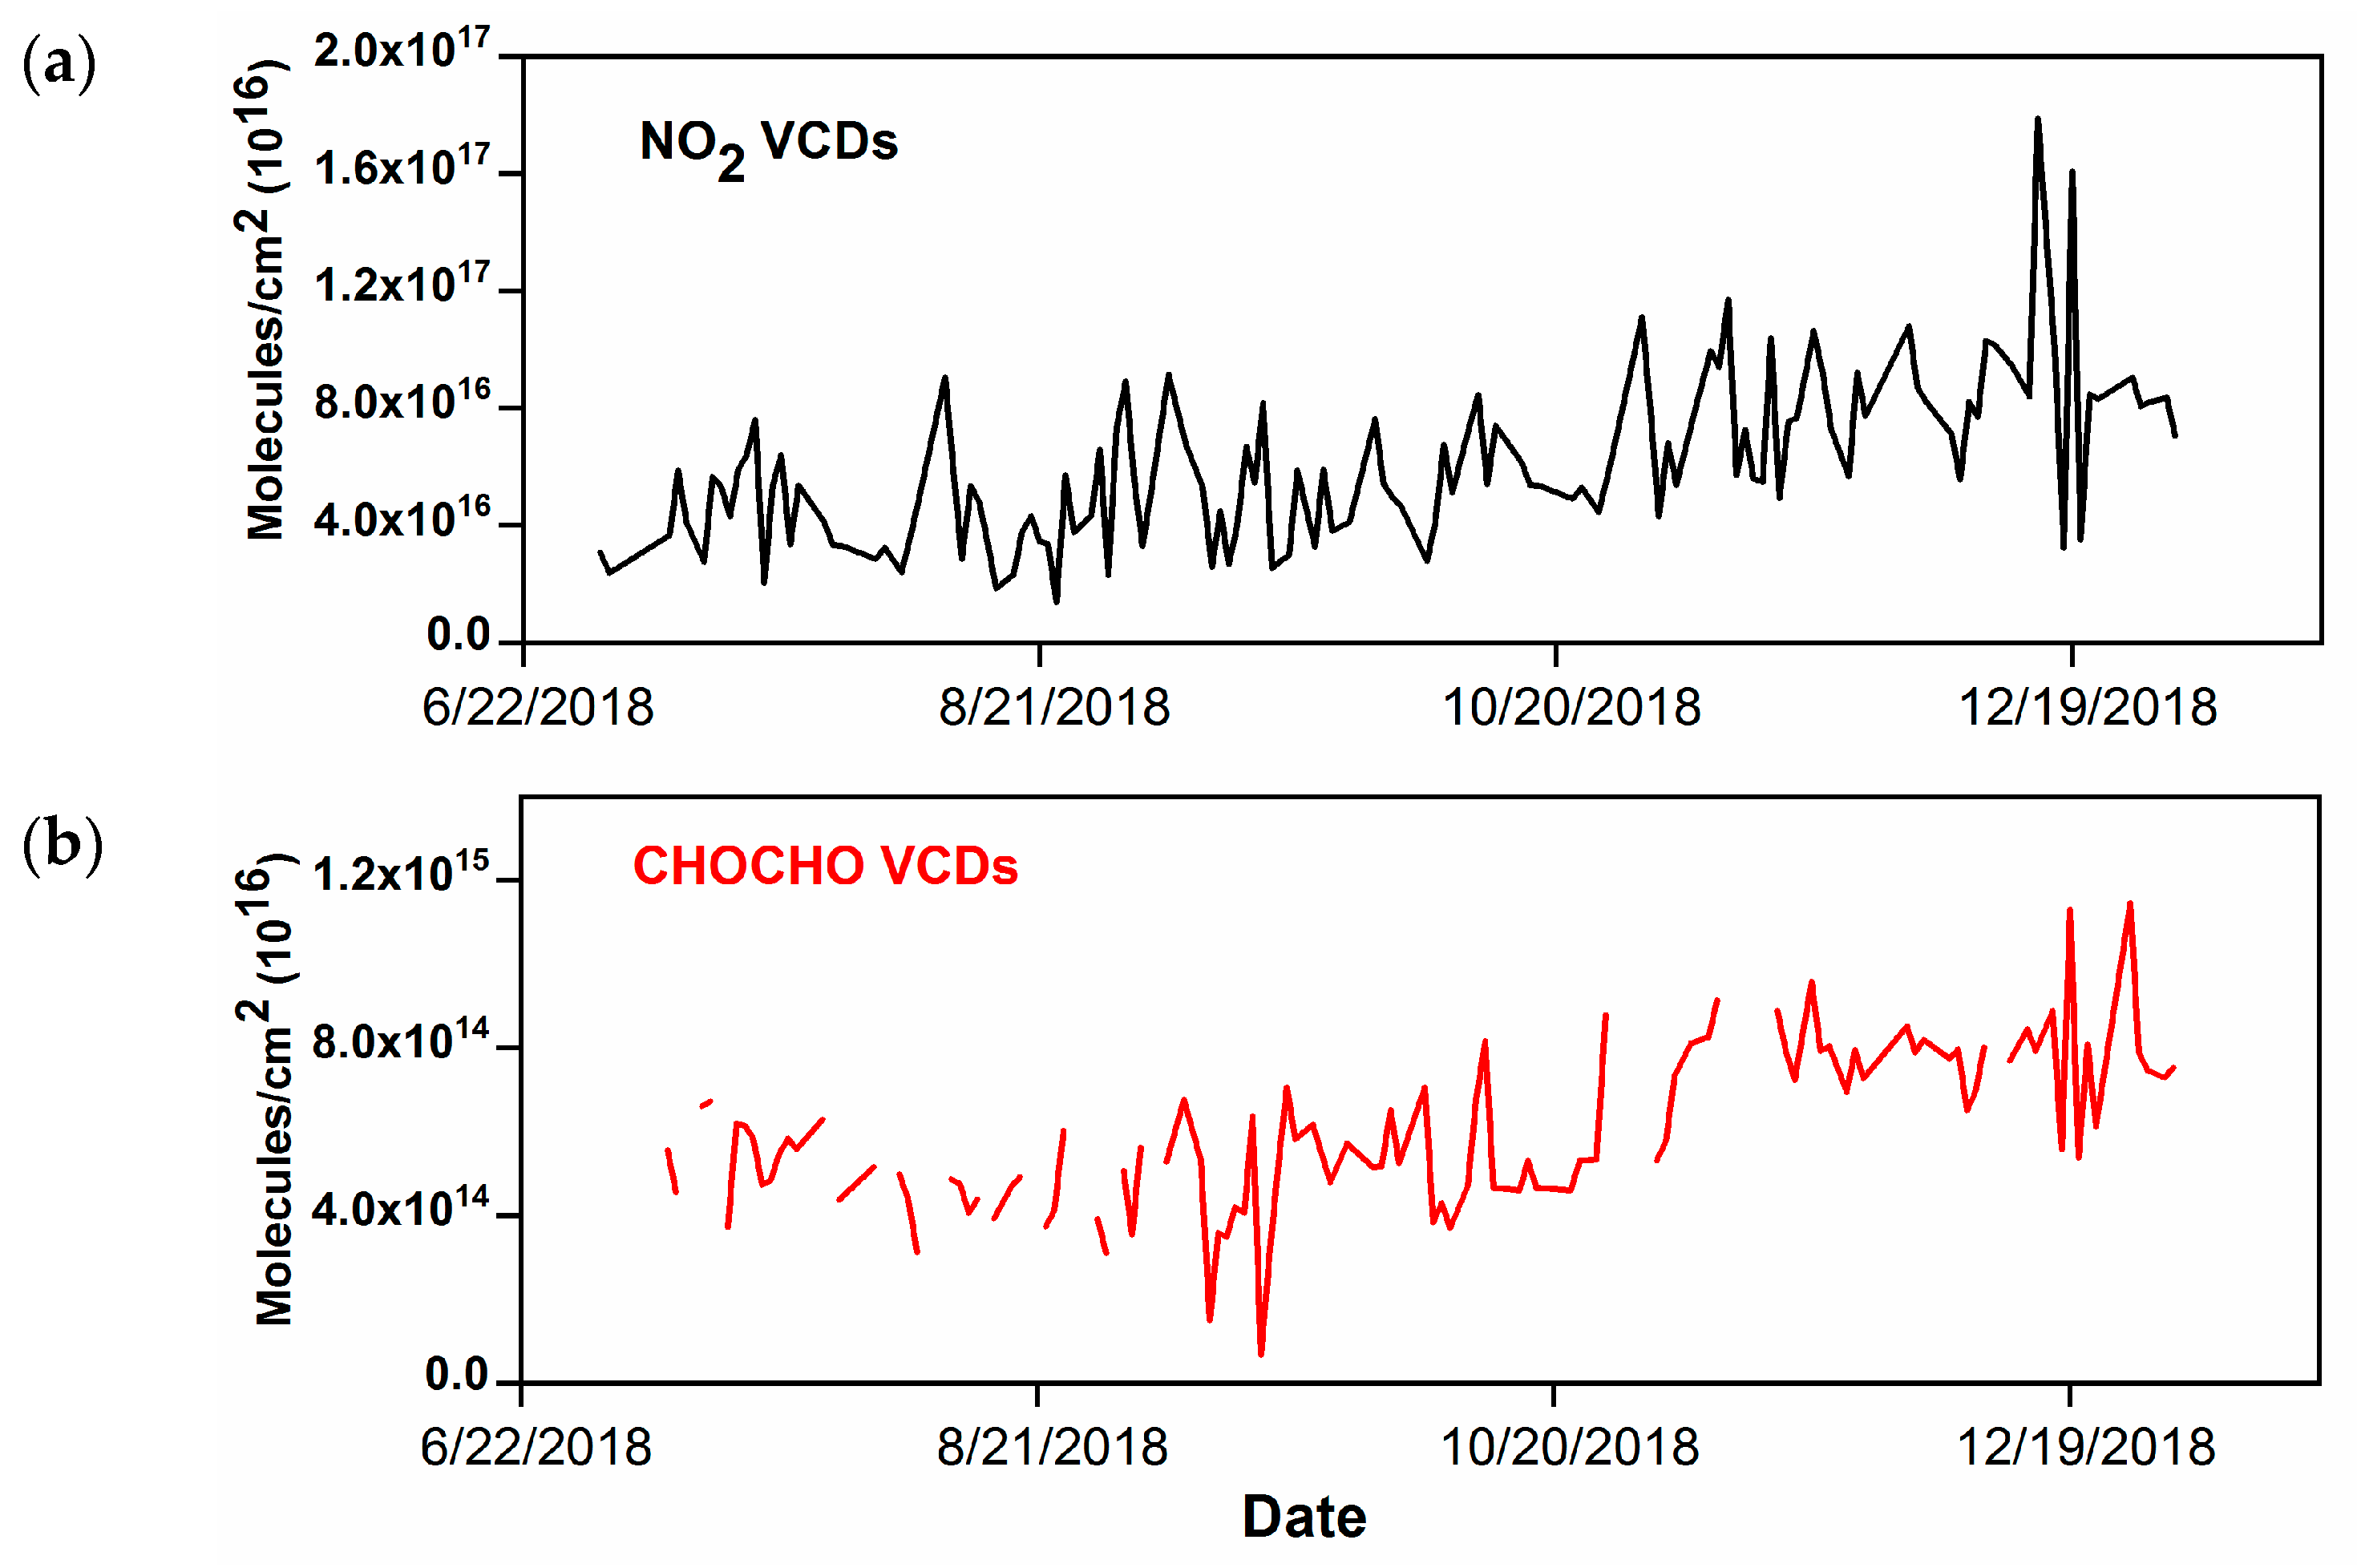
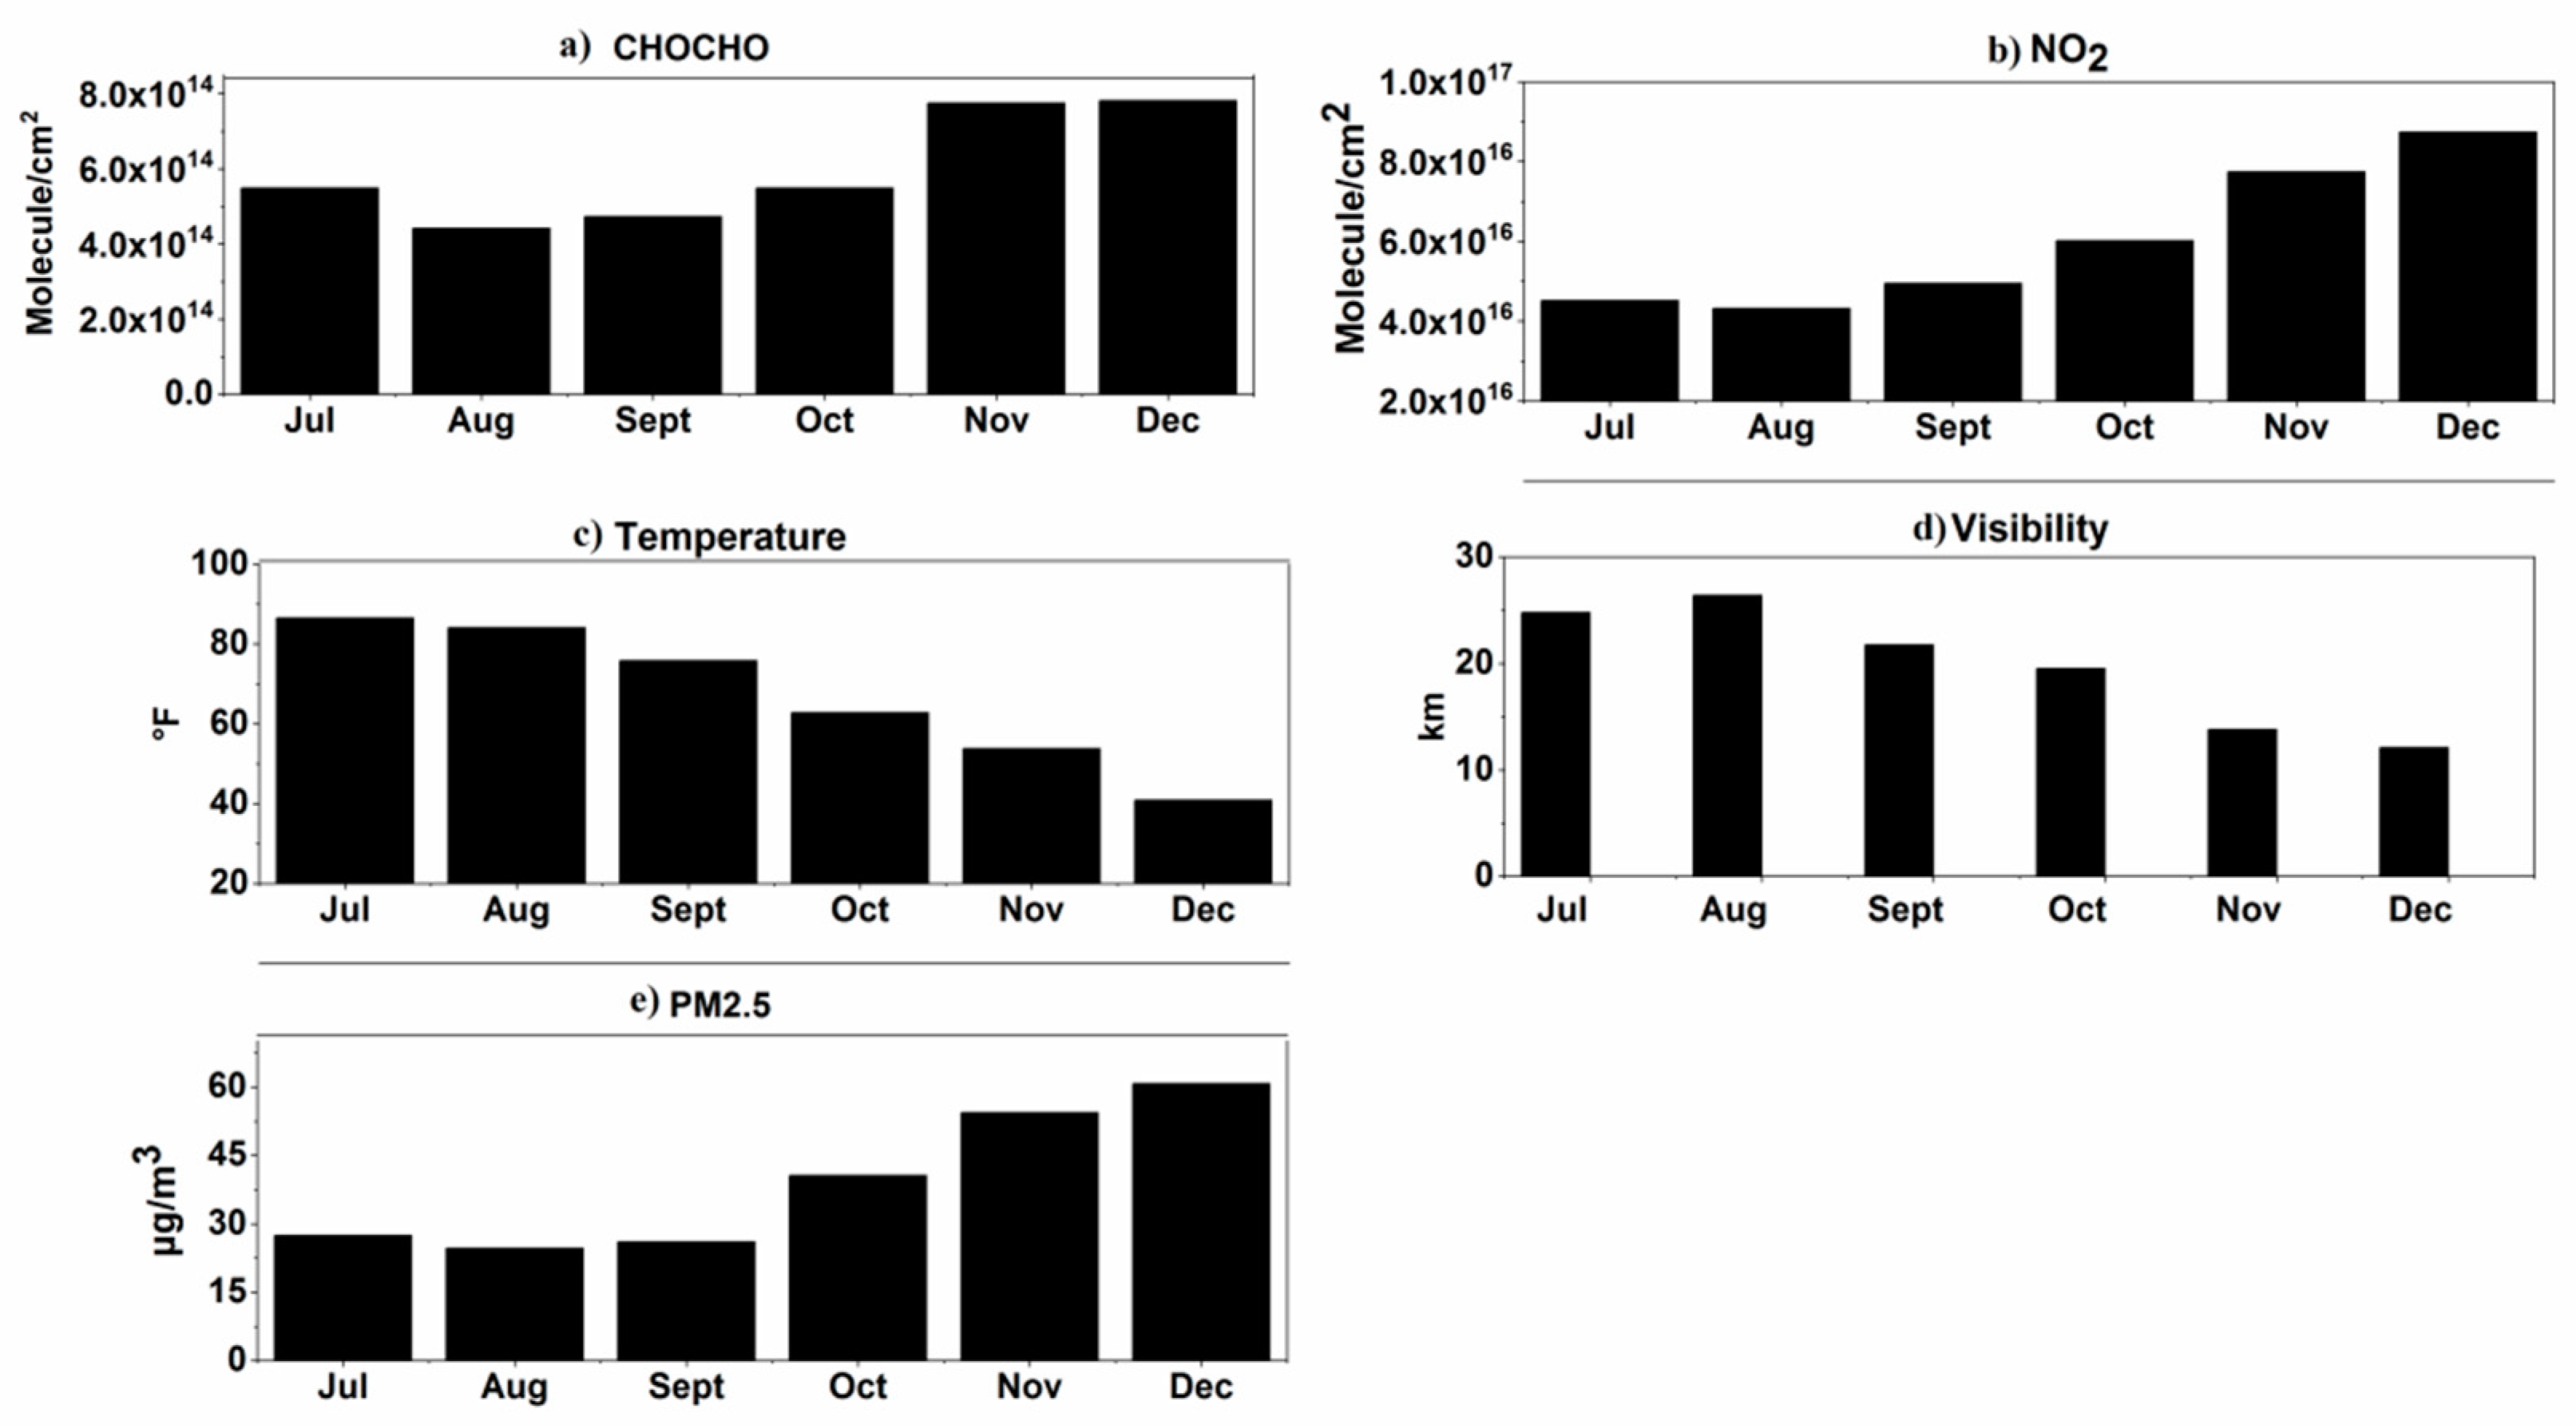
3.3. Time Series of NO2, CHOCHO, and Meteorological Parameters

Observations of the trace gases NO2 and CHOCHO were performed from July 2018 to 31 December 2018 in Hefei, China. QDOAS software was used for analysis of the spectrum to obtain dSCDs. VCDs were generated from these dSCDs using a geometric approximation approach. Data for meteorological parameters like temperature, humidity, and visibility was downloaded from (http://www.wunderground.com/). Data for PM2.5 was downloaded from (http://beijingair.sinaapp.com/). This website belongs to the national environmental monitoring network. Figure 4 shows time series of NO2 and CHOCHO.

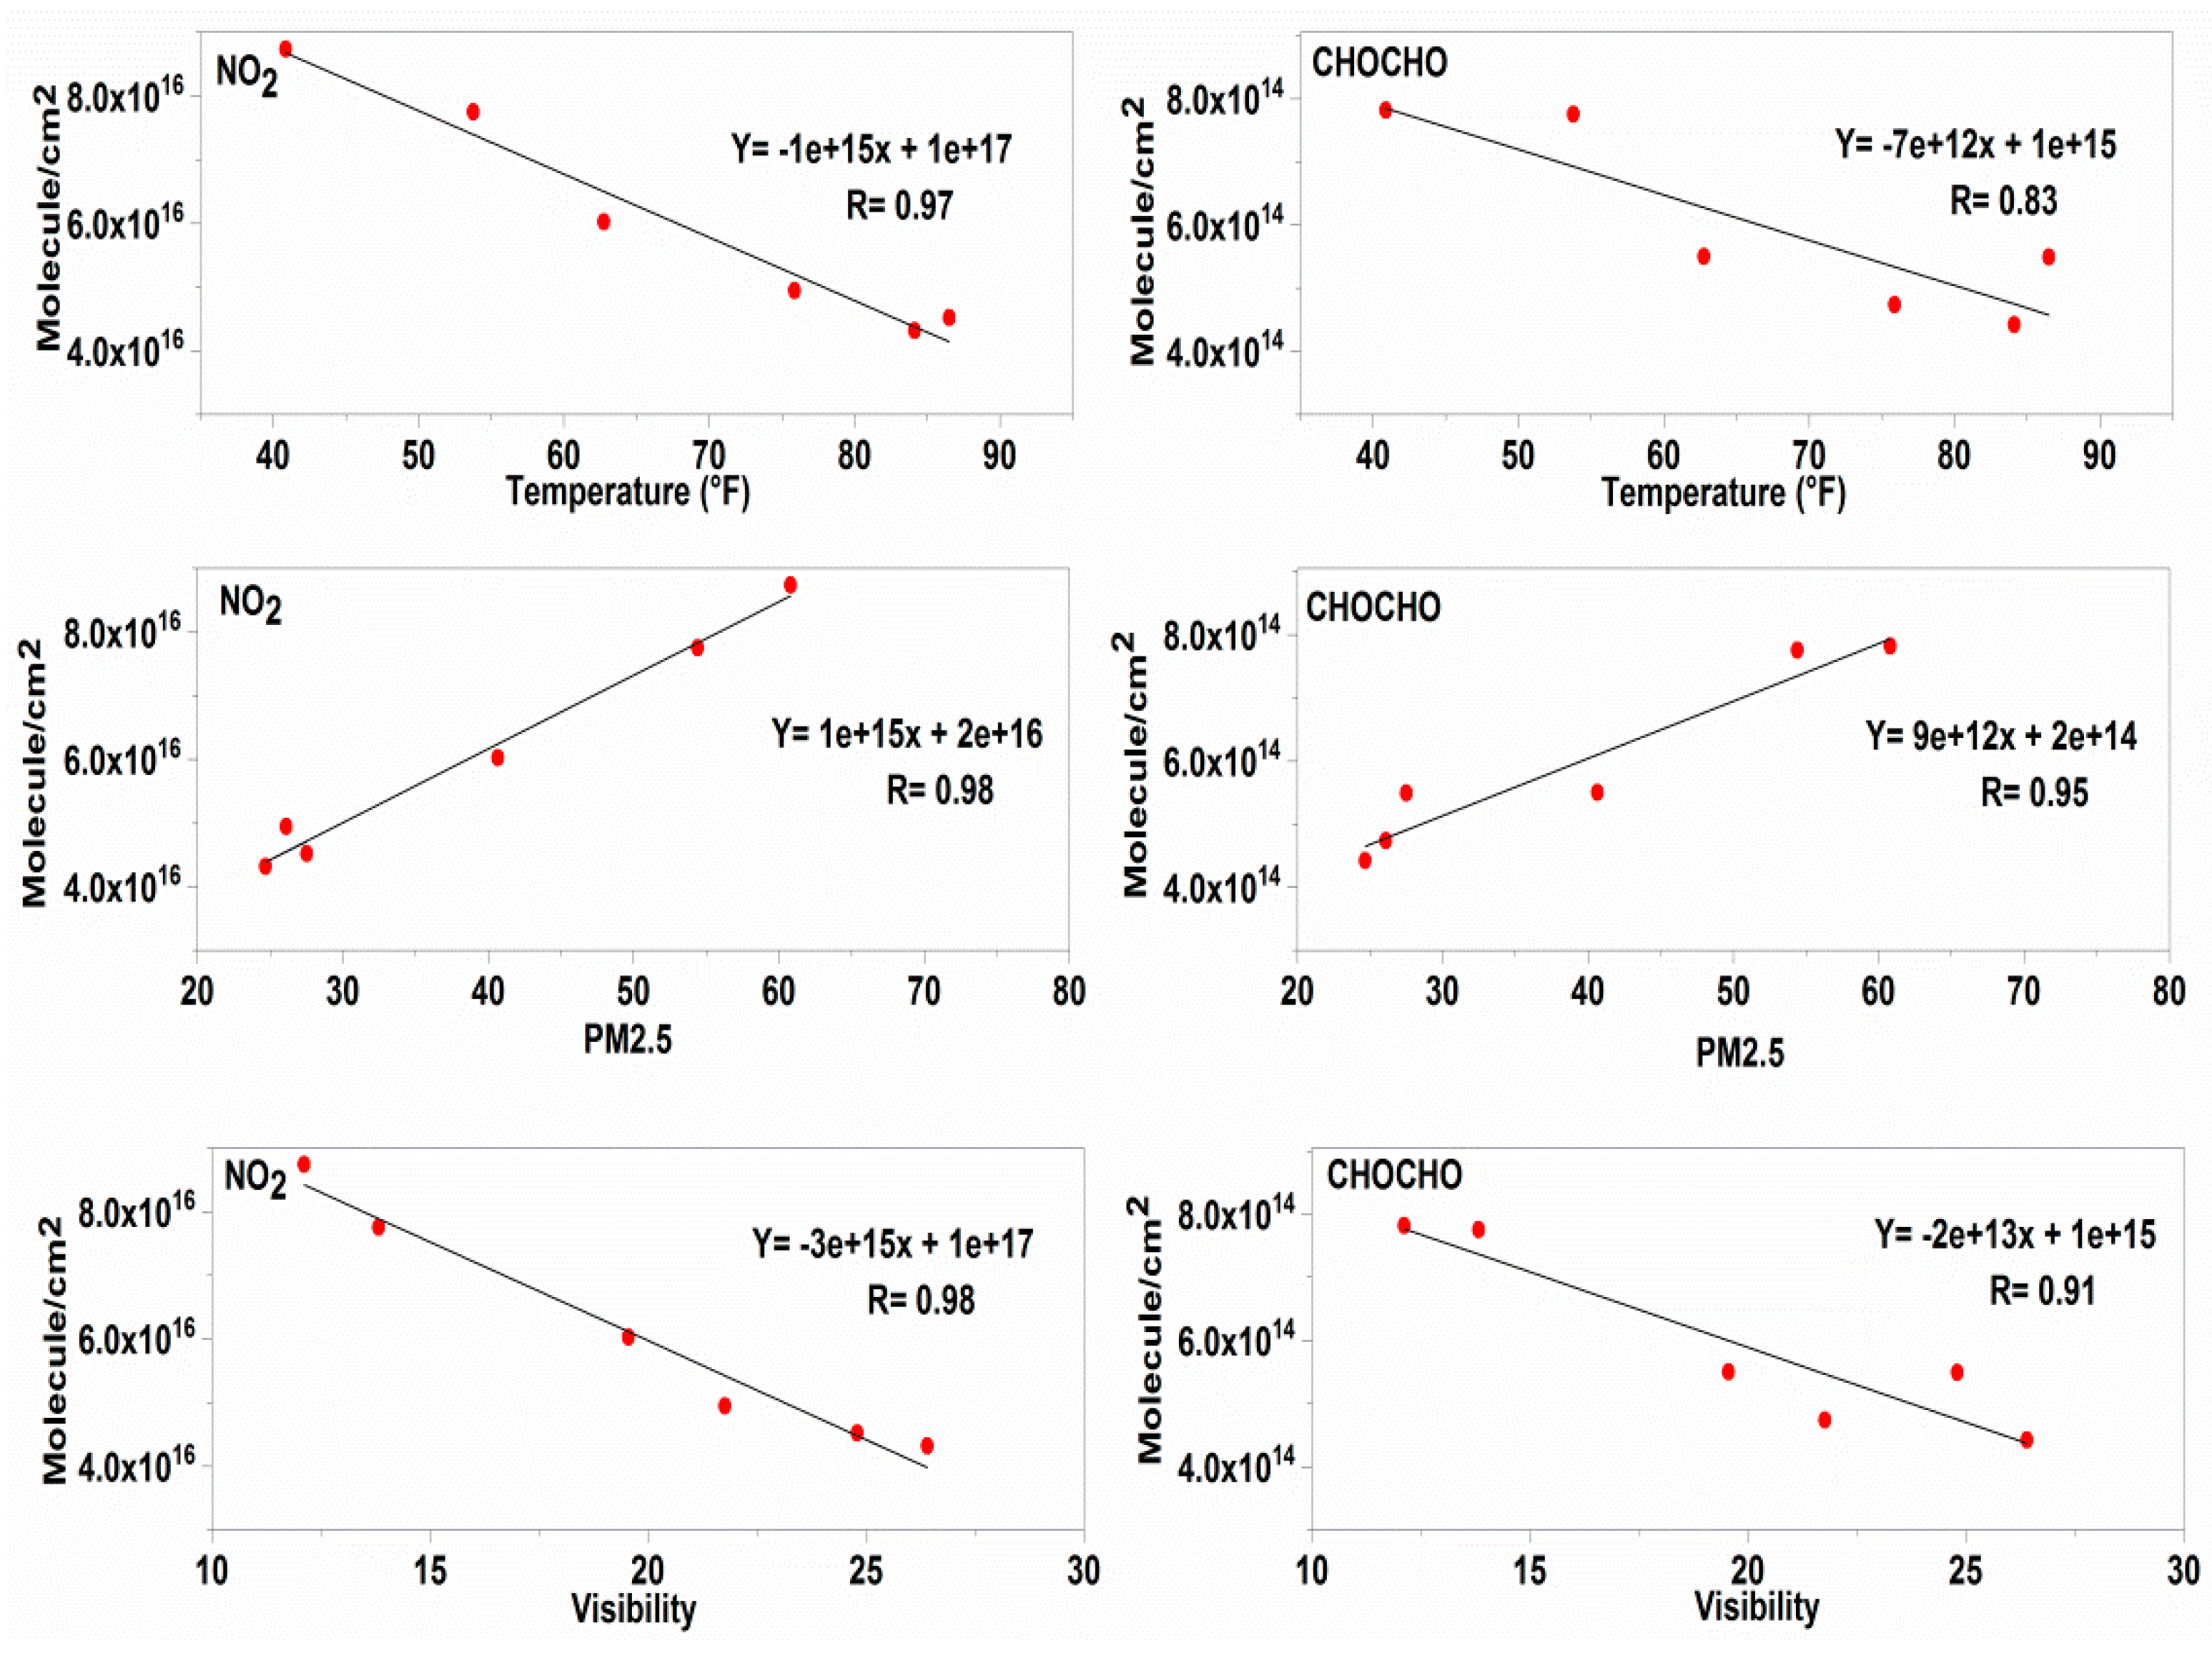
3.4. Dependence of Trace Gases on Meteorological Parameters

In the lower atmosphere, a substantial driving factor of pollutant distribution in terms of chemical behavior and residence time is the meteorological condition of the locality. Hence, the relation of trace gases, i.e., NO2 and CHOCHO, with different meteorological parameters is discussed here. Figure 5 shows monthly variations of PM2.5, temperature, visibility, NO2, and CHOCHO. The average concentration of PM2.5 is seen to increase gradually from July to December. A similar trend is observed for the concentration of NO2 and CHOCHO, whereas air temperature and visibility show a decreasing trend. The decrease in visibility due to an increase in PM2.5 is obviously to have resulted in the more frequent occurrence of haze days in the month of December.
The increasing trend of CHOCHO and NO2 VCDs can be explained by the fact that photolysis is a major sink of both these trace gases. During the winter months when haze conditions start to occur more frequently due to an increase in PM2.5, visibility decreases. The rate of photolysis decreases, as visibility is low. This results in the accumulation of NO2 and CHOCHO because their major sink, i.e., the rate of photolysis, is very low. The observed increase in CHOCHO from October may also be related to heating during winter. This finding is consistent with glyoxal retrieved over Beijing and Northern China from OMI (Ozone monitoring instrument) satellite data [35,36]. The increase in the concentration of NO2 may also be related to an increase in the burning of fossil fuels during the winter months. Figure 6 shows correlation plots of NO2 and CHOCHO with meteorological parameters.
NO2 shows strong negative correlations with temperature and visibility, producing R values of 0.97 and 0.98, respectively. CHOCHO also exhibits strong negative correlations with temperature and visibility, giving R values of 0.83 and 0.91, respectively. However, both CHOCHO and NO2 show positive correlations with PM2.5, having R values of 0.95 and 0.98, respectively. Table 3 shows the average concentration of NO2, CHOCHO, and PM2.5 during clear days, haze days, and severe haze days. It can be observed that the average concentration of NO2 and CHOCHO is higher during haze days and heavy days compared to clear days, which is due to reduced photolytic activity, with photolytic activity acting as a major sink for NO2 and CHOCHO. During heavy haze days the values are lower when compared with those of haze days.
The most likely reason for this trend is the fact that the quality of the DOAS fit is affected during severe haze days due to higher RMS and dSCD errors which result in the underestimation of NO2 and CHOCHO during severe haze days.

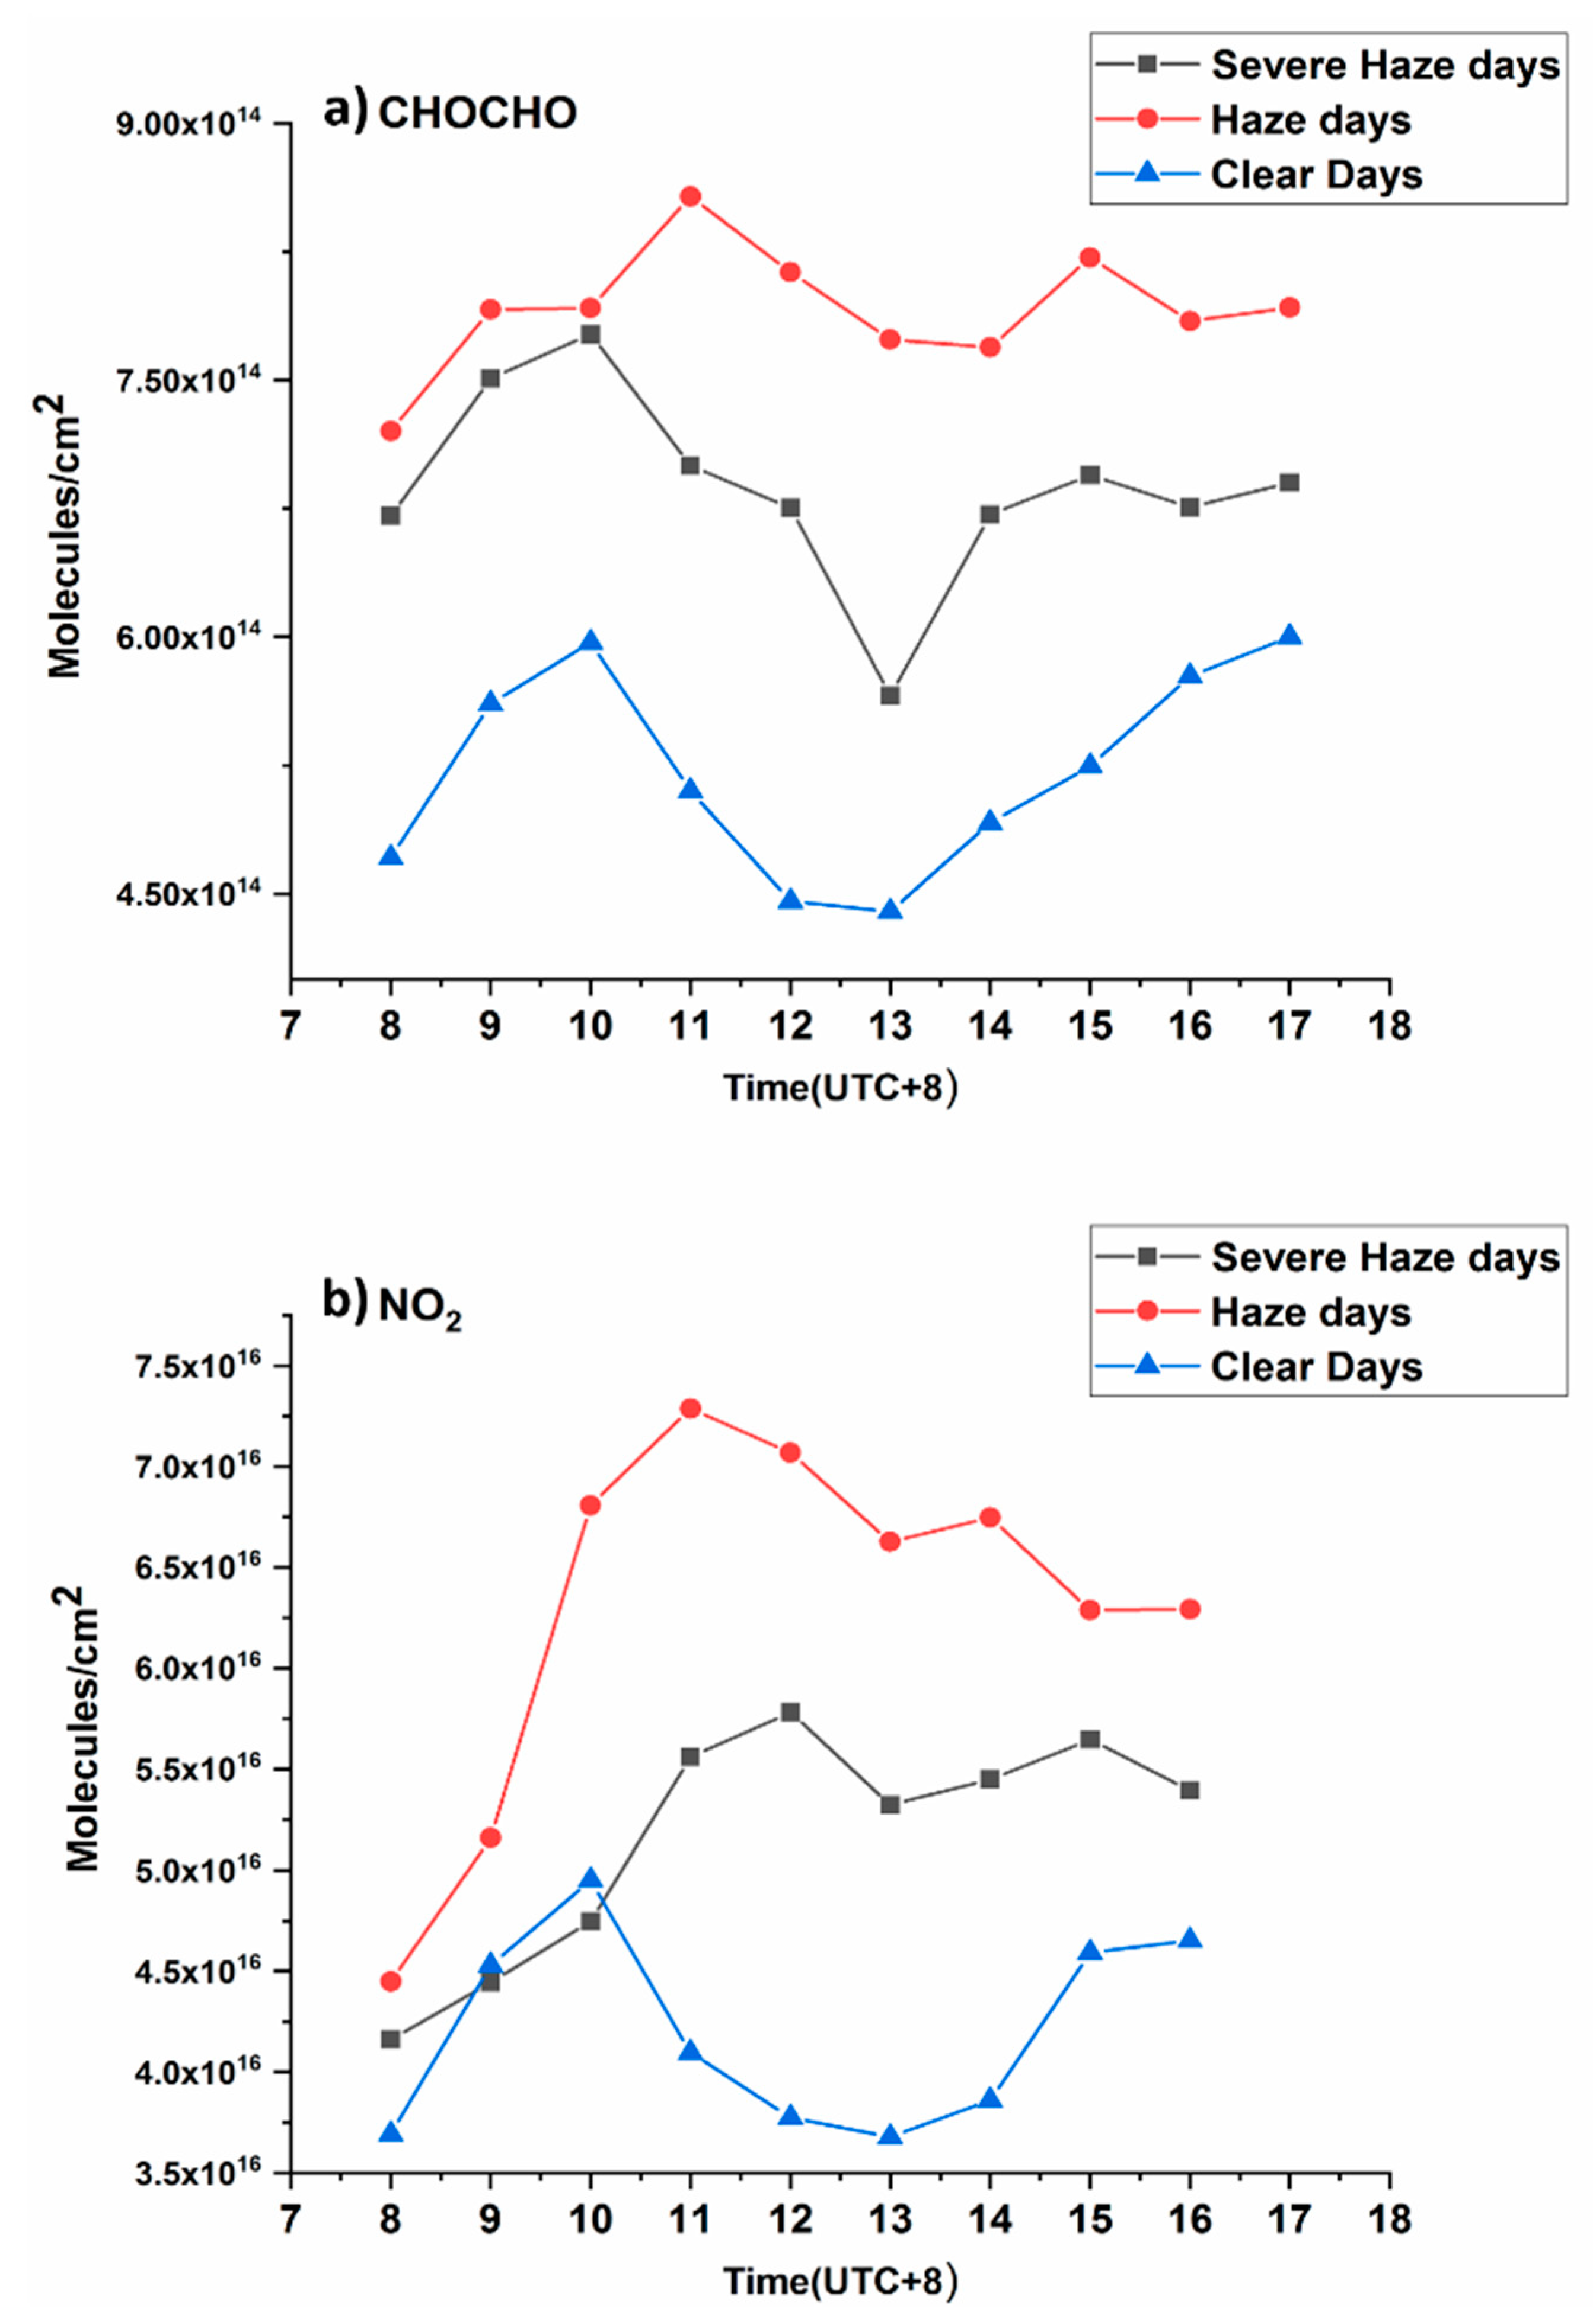
3.5. Diurnal Variation
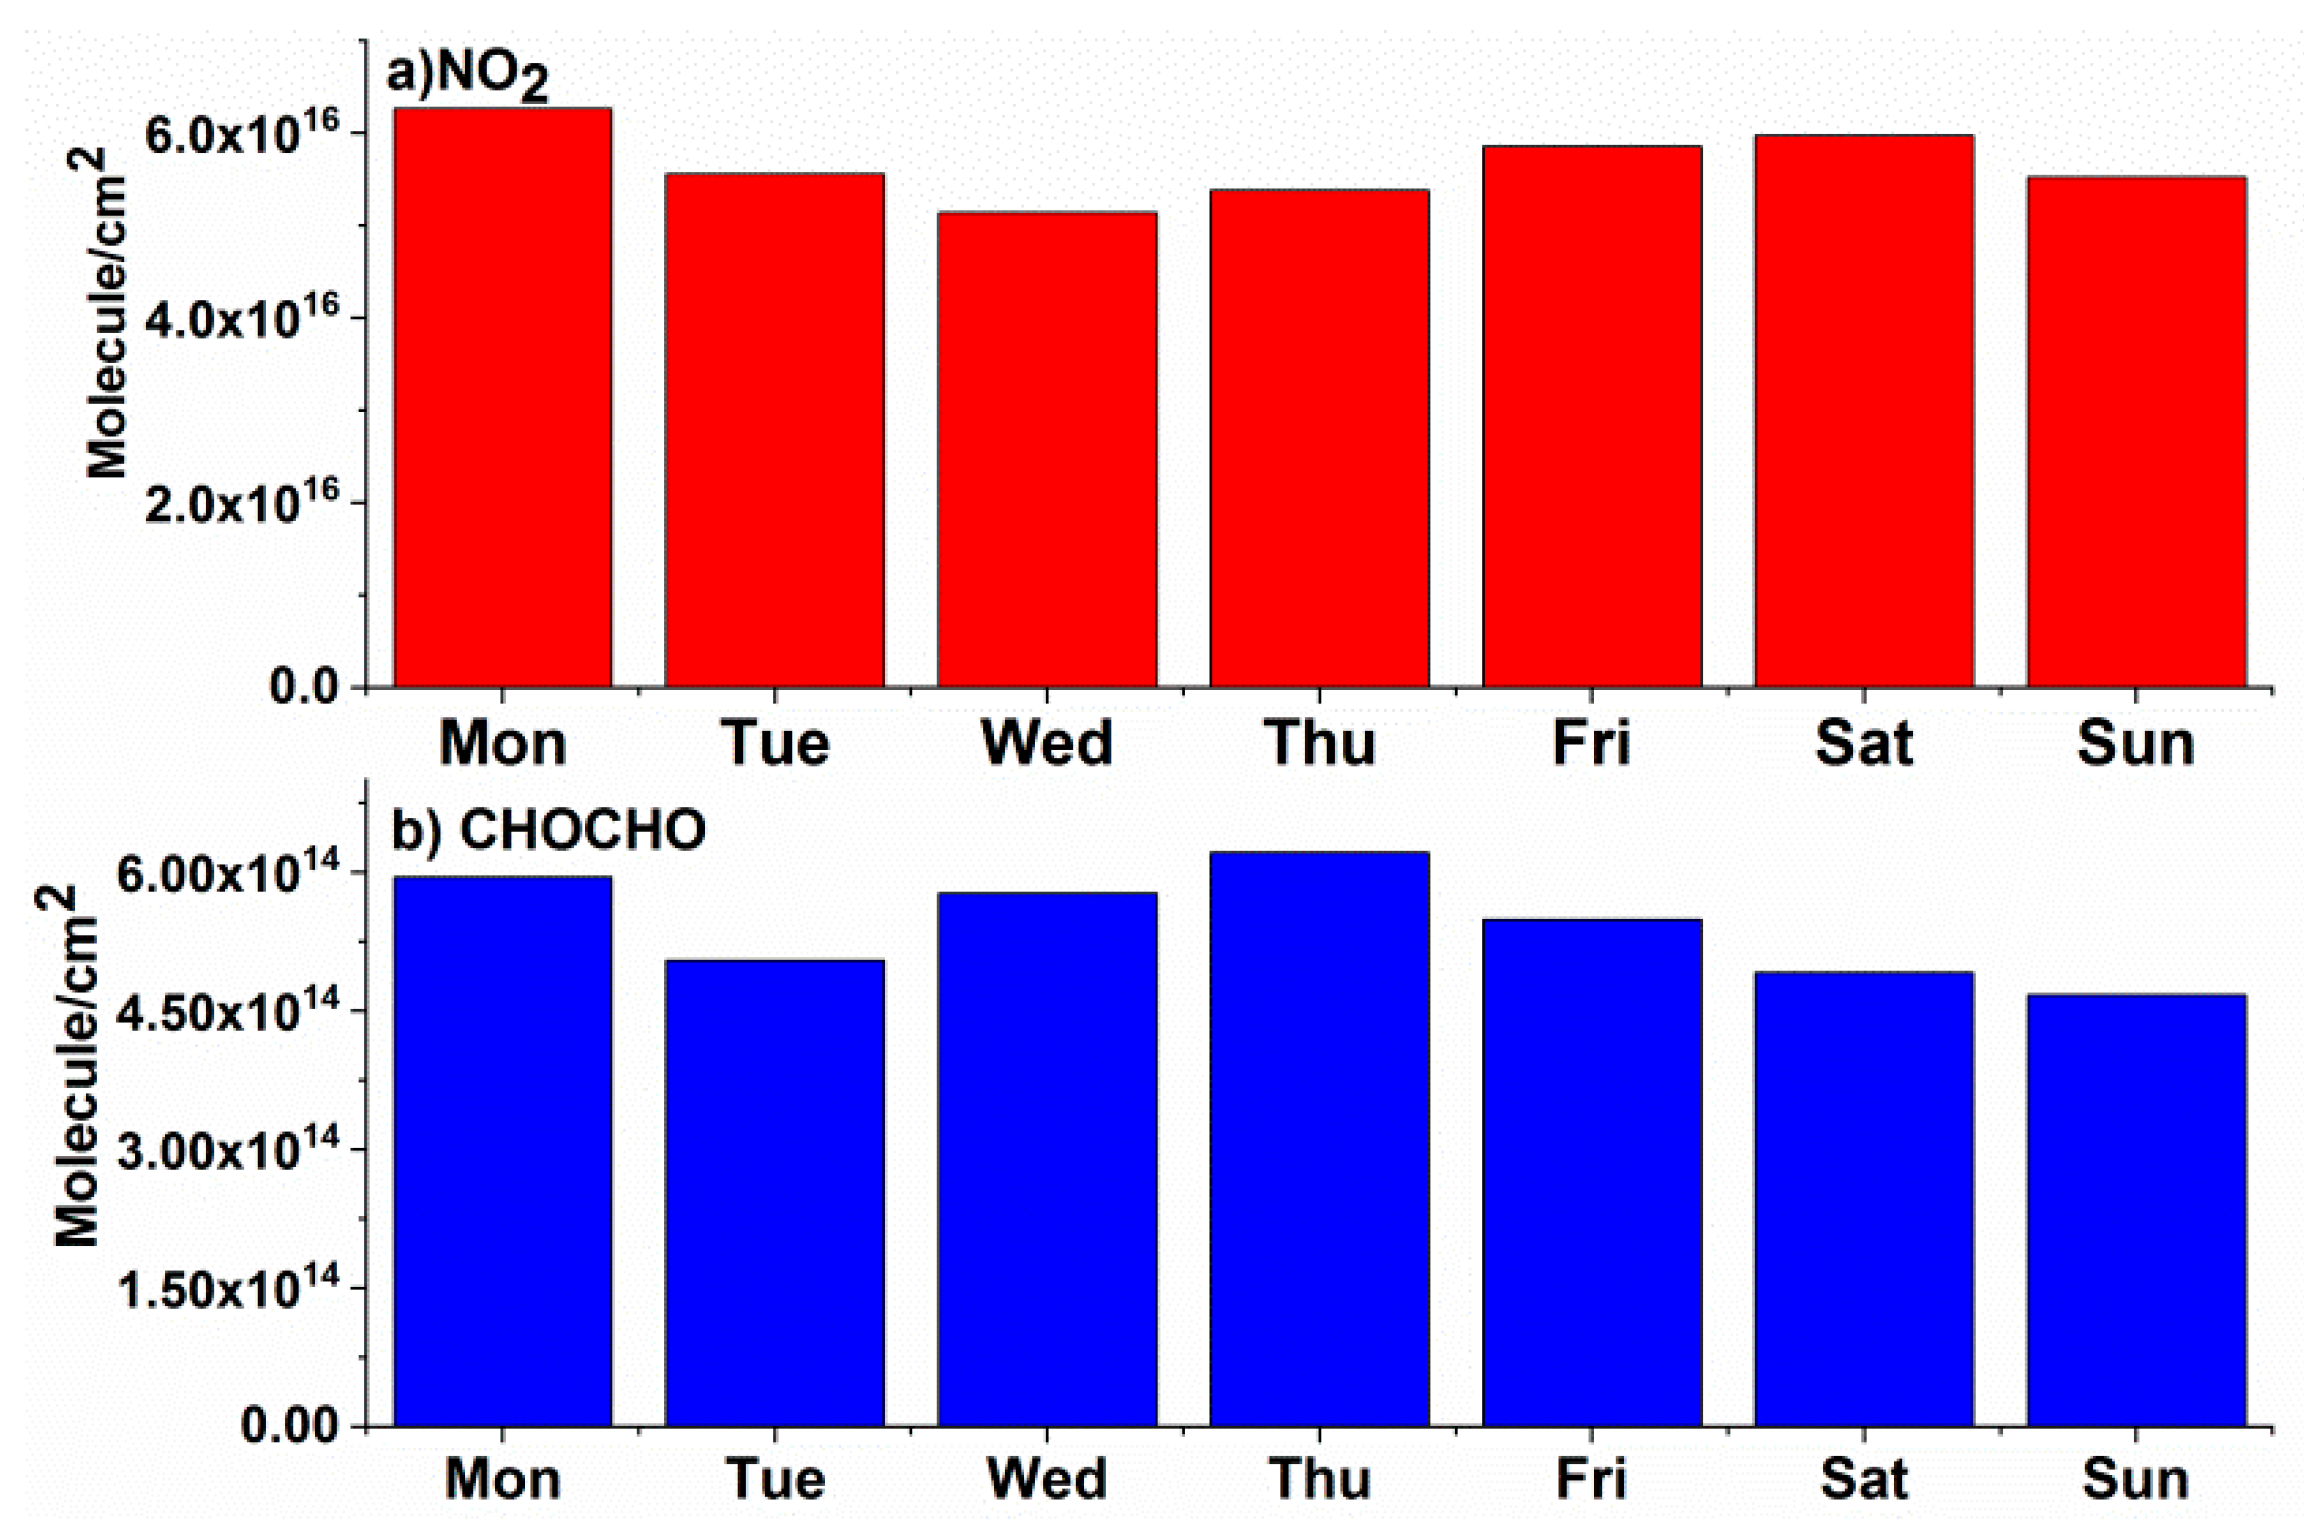
Atmospheric trace gases may come from a variety of natural sources of chemical and biological nature as well as from agricultural and industrial practices. The concentration of such gases in the atmosphere and their variation depends upon emission sources, transport routes, and removal mechanisms [37]. In urban centers, the concentration of trace gases is directly or indirectly linked to anthropogenic activities. Specific trends can be seen when looking at the diurnal cycle of these trace gases in the atmosphere at different times of the day. The diurnal cycle is critical for understanding the atmospheric profile of these pollutants as well as vital for understanding the emission sources and atmospheric chemistry of these trace gases. The study of atmospheric trace gases can be employed to address various contemporary environmental problems [38]. In this study, the mean diurnal variation of both trace gases was calculated. Figure 7 represents the diurnal variation of CHOCHO and NO2.
Diurnal variation of NO2 VCDs is observed to follow a typical pattern during clear days. Higher values occur during the morning and evening whereas lower values occur during noontime. In the morning NO2 levels increase with a peak at around 10 a.m. local time, which can be attributed to increased traffic-related NOx emissions. The lower values during noontime can be attributed to the enhanced rate of photolysis, along with the oxidation of NO2 by OH radicals. However, this reduction in NO2 levels is very small because our observation period took place during the winter season, when the rate of photolysis is very low. The level of NO2 VCDs again starts to rise during the late afternoon because rate of photolysis decreases and NO2 begins to accumulate as the load of traffic again increases during the evening. It is worth noting that our results are in agreement with other MAX-DOAS measurements for megacities [17,18,19,39].
For haze and severe haze days there is no reduction in the level of NO2 during the afternoon. This is obviously because the major sink for NO2, i.e. photolysis, is absent during these days, which results in a slight increase in residence time of the trace gas. During severe haze days, a lower concentration of NO2 is observed as compared to haze days. These results may be ascribed to an underestimation of trace gases during severe haze days due to a lower signal to noise ratio.
During clear days, due to a faster photolysis rate, a certain decrease in CHOCHO emissions is observed during the afternoon; haze and heavy haze days do not depict such a trend. CHOCHO concentrations during severe haze days are lower than during haze days, which can be explained by taking into account the fact that DOAS retrieval for CHOCHO is very sensitive and is underestimated during severe haze days.

3.6. Weekly Cycles

Human activities can be categorically divided according to weekly cycles. During weekends, because of reduced industrial activities and transport, the emissions of atmospheric pollutants normally decline [40] in comparison to week days, with peak anthropogenic activities at industrial as well as personal levels (including more use of public and private transport). This factor may have a significant effect on weekly cycles of various atmospheric species. However, in China, because of continuous industrial activity throughout the week and no formal weekly breaks, the weekend effect for various atmospheric species has been observed to be non-significant [15,18,19,41]. Figure 8 shows the results of our weekly cycle. There is no meaningful conclusion which can be drawn from these results. These results are consistent with the findings of previous studies.

4. Conclusions

In this work, MAX-DOAS observations for NO2 and CHOCHO were performed from 1 July 2018 to 31 December 2018 in Hefei, China. Hefei is the capital of Anhui Province and has a population of around 7.80 million. Hefei is becoming a potential site for air quality monitoring. Because of the development and growth of its economy its air quality is deteriorating and haze days are occurring more frequently. There have been fairly sparse studies reporting the monitoring of CHOCHO throughout China. This is first study to observe CHOCHO in Hefei. NO2 is well known for its significance in tropospheric chemistry. The observation time of our study was divided into three different categories based on meteorological parameters and PM2.5 levels. These categories were named clear days, haze days, and severe haze days. The excellence of the DOAS fit was not good during the severe haze days for both CHOCHO and NO2. RMS and dSCD errors were higher during severe haze days due to a low signal to noise ratio. This therefore resulted in the underestimation of NO2 and CHOCHO during severe haze days. NO2 and CHOCHO showed positive correlations with PM2.5, giving R values of 0.95 and 0.98, respectively. NO2 showed strong negative correlations with visibility and air temperature, displaying R values of 0.97 and 0.98, respectively. CHOCHO also exhibited strong negative correlations with temperature and visibility, producing R values of 0.83 and 0.91, respectively. These outcomes can be accredited to the fact that photolysis is the main sink for both NO2 and CHOCHO. An increase in PM2.5 concentration caused a reduction in visibility and hence resulted in the reduction of the rate of photolysis. The average concentrations of NO2, CHOCHO, and PM2.5 during haze days were higher when compared to those of clear days. Diurnal variations of both CHOCHO and NO2 showed significant decreasing trends during clear days due to photolysis, while during haze days the trace gases started to accumulate as the residence time of these gases increased. There was no prominent weekly cycle for both trace gases because of continuous industrial activity throughout the week and no formal weekly breaks; the weekend effect for various atmospheric species has been observed to be non-significant.

Author Contributions

Conceptualization, Z.J. and C.L.; formal analysis, Z.J.; methodology, C.L., W.T., and H.L.; resources, C.L.; validation, W.T. and C.X.; writing, review, and editing, Z.J., K.U., and C.L.

Funding

This research was funded by grants from the National Key Research and Development Program of China (2018YFC0213104), the National Natural Science Foundation of China (41722501, 91544212, 51778596, and 41575021) and the National Key Research and Development Program of China (2016YFC0203302).

Acknowledgments

We are indebted to Aimon Tanvir for their useful communications.

Conflicts of Interest

The authors declare no conflict of interest.

References

  1. Liu, J.; Diamond, J. China’s environment in a globalizing world. Nature. 2005, 435, 1179. [Google Scholar] [CrossRef] [PubMed]
  2. Hong, Q.; Liu, C.; Chan, K.L.; Hu, Q.; Xie, Z.; Liu, H.; Si, F.; Liu, J. Ship-based MAX-DOAS measurements of tropospheric NO2, SO2, and HCHO distribution along the Yangtze River. Atmos. Chem. Phys. 2018, 18, 5931–5951. [Google Scholar] [CrossRef]
  3. Stavrakou, T.; Müller, J.F.; Smedt, I.D.; Roozendael, M.V.; Kanakidou, M.; Vrekoussis, M.; Wittrock, F.; Richter, A.; Burrows, J.P. The continental source of glyoxal estimated by the synergistic use of spaceborne measurements and inverse modelling. Atmos. Chem. Phys. 2009, 9, 8431–8446. [Google Scholar] [CrossRef] [Green Version]
  4. Fu, T.M.; Jacob, D.J.; Wittrock, F.; Burrows, J.P.; Vrekoussis, M.; Henze, D.K. Global budgets of atmospheric glyoxal and methylglyoxal, and implications for formation of secondary organic aerosols. Geophys.Res. Atmos. 2008, 113, D15. [Google Scholar] [CrossRef]
  5. Wittrock, F.; Richter, A.; Oetjen, H.; Burrows, J.P.; Kanakidou, M.; Myriokefalitakis, S.; Volkamer, R.; Beirle, S.; Platt, U.; Wagner, T. Simultaneous global observations of glyoxal and formaldehyde from space. Geophys.Res. Lett. 2006, 33, 16. [Google Scholar] [CrossRef]
  6. Myriokefalitakis, S.; Vrekoussis, M.; Tsigaridis, K.; Wittrock, F.; Richter, A.; Brühl, C.; Volkamer, R.; Burrows, J.P.; Kanakidou, M. The influence of natural and anthropogenic secondary sources on the glyoxal global distribution. Atmos. Chem. Phys. 2008, 8, 4965–4981. [Google Scholar] [CrossRef] [Green Version]
  7. Sinreich, R.; Volkamer, R.; Filsinger, F.; Frieß, U.; Kern, C.; Platt, U.; Sebastián, O.; Wagner, T. MAX-DOAS detection of glyoxal during ICARTT 2004. Atmos. Chem. Phys. 2007, 7, 1293–1303. [Google Scholar] [CrossRef] [Green Version]
  8. Volkamer, R.; Molina, L.T.; Molina, M.J.; Shirley, T.; Brune, W.H. DOAS measurement of glyoxal as an indicator for fast VOC chemistry in urban air. Geophys.Res. Lett. 2005, 32, 8. [Google Scholar] [CrossRef]
  9. Vrekoussis, M.; Wittrock, F.; Richter, A.; Burrows, J.P. Temporal and spatial variability of glyoxal as observed from space. Atmos. Chem. Phys. 2009, 9, 4485–4504. [Google Scholar] [Green Version]
  10. Crutzen, P.J. The influence of nitrogen oxides on the atmospheric ozone content. Q. J. R. Meteorol. Soc. 1970, 96, 320–325. [Google Scholar] [CrossRef]
  11. Seinfeld, J.H.; Pandis, S.N. Atmospheric Chemistry and Physics: From Air Pollution to Climate Change, 2nd ed.; John Willey & Sons. Inc.: New York, NY, USA, 2006. [Google Scholar]
  12. Chaloulakou, A.; Mavroidis, I.; Gavriil, I. Compliance with the annual NO2 air quality standard in Athens. Required NOx levels and expected health implications. Atmos. Environ. 2008, 42, 454–465. [Google Scholar] [CrossRef]
  13. Noxon, J.F. Stratospheric NO2 in the Antarctic winter. Geophys.Res. Lett. 1978, 5, 1021–1022. [Google Scholar] [CrossRef]
  14. Sahu, L.K.; Tripathi, N.; Yadav, R. Contribution of biogenic and photochemical sources to ambient VOCs during winter to summer transition at a semi-arid urban site in India. Environ. Pollut. 2017, 229, 595–606. [Google Scholar] [CrossRef] [PubMed]
  15. Ma, J.Z.; Beirle, S.; Jin, J.L.; Shaiganfar, R.; Yan, P.; Wagner, T. Tropospheric NO2 vertical column densities over Beijing: results of the first three years of ground-based MAX-DOAS measurements (2008–2011) and satellite validation. Atmos. Chem. Phys. 2013, 13, 1547–1567. [Google Scholar] [CrossRef]
  16. Wang, Y.; Ying, Q.; Hu, J.; Zhang, H. Spatial and temporal variations of six criteria air pollutants in 31 provincial capital cities in China during 2013–2014. Environ. Int. 2014, 73, 413–422. [Google Scholar] [CrossRef] [PubMed]
  17. Hendrick, F.; Müller, J.F.; Clémer, K.; Wang, P.; Mazière, M.D.; Fayt, C.; Gielen, C.; Hermans, C.; Ma, J.Z.; Pinardi, G.; et al. Four years of ground-based MAX-DOAS observations of HONO and NO2 in the Beijing area. Atmos. Chem. Phys. 2014, 14, 765–781. [Google Scholar] [CrossRef]
  18. Chan, K.L.; Hartl, A.; Lam, Y.F.; Xie, P.H.; Liu, W.Q.; Cheung, H.M.; Lampel, J.; Pöhler, D.; Li, A.; Xu, J.; et al. Observations of tropospheric NO2 using ground based MAX-DOAS and OMI measurements during the Shanghai World Expo 2010. Atmos. Environ. 2015, 119, 45–58. [Google Scholar] [CrossRef]
  19. Tian, X.; Xie, P.; Xu, J.; Li, A.; Wang, Y.; Qin, M.; Hu, Z. Long-term observations of tropospheric NO2, SO2 and HCHO by MAX-DOAS in Yangtze River Delta area, China. J. Environ. Sci. 2018, 71, 207–221. [Google Scholar] [CrossRef]
  20. Javed, Z.; Liu, C.; Khokhar, M.F.; Xing, C.; Tan, W.; Subhani, M.A.; Rehman, A.; Tanvir, A. Investigating the impact of Glyoxal retrieval from MAX-DOAS observations during haze and non-haze conditions in Beijing. J. Environ. Sci. 2019. [Google Scholar] [CrossRef]
  21. Plane, J.M.; Saiz-Lopez, A. UV-visible differential optical absorption spectroscopy (DOAS). In Analytical Techniques for Atmospheric Measurement; Oxford publisher: Oxford, UK, 2006; pp. 147–188. [Google Scholar]
  22. Platt, U.; Stutz, J. Differential absorption spectroscopy. In Differential Optical Absorption Spectroscopy; Springer: Berlin/Heidelberg, Germany, 2008; pp. 135–174. [Google Scholar]
  23. Danckaert, T.; Fayt, C.; Van Roozendael, M.; De Smedt, I.; Letocart, V.; Merlaud, A.; Pinardi, G. QDOAS Software User Manual; Belgian Institute for Space Aeronomy: Brussels, Belgium, 2013. [Google Scholar]
  24. Vandaele, A.C.; Hermans, C.; Simon, P.C.; Carleer, M.; Colin, R.; Fally, S.; Merienne, M.F.; Jenouvrier, A.; Coquart, B. Measurements of the NO2 absorption cross-section from 42,000 cm−1 to 10,000 cm−1 (238–1000 nm) at 220 K and 294 K. J. Quant. Spectrosc. Radiat. Transf. 1998, 59, 171–184. [Google Scholar] [CrossRef]
  25. Vandaele, A.C.; Hermans, C.; Fally, S. Fourier transform measurements of SO2 absorption cross sections: II.: Temperature dependence in the 29,000–44,000 cm−1 (227–345 nm) region. J. Quant. Spectrosc. Radiat. Transf. 2009, 110, 2115–2126. [Google Scholar] [CrossRef]
  26. Serdyuchenko, A.; Gorshelev, V.; Weber, M.; Chehade, W.; Burrows, J.P. High spectral resolution ozone absorption cross-sections–Part 2: Temperature dependence. Atmos. Meas. Tech. 2014, 7, 625–636. [Google Scholar] [CrossRef]
  27. Thalman, R.; Volkamer, R. Temperature dependent absorption cross-sections of O2–O2 collision pairs between 340 and 630 nm and at atmospherically relevant pressure. Phys. Chem. Chem. Phys. 2013, 15, 15371–15381. [Google Scholar] [CrossRef] [PubMed]
  28. Rothman, L.S.; Gordon, I.E.; Barber, R.J.; Dothe, H.; Gamache, R.R.; Goldman, A.; Perevalov, V.I.; Tashkun, S.A.; Tennyson, J. HITEMP, the high-temperature molecular spectroscopic database. J. Quant. Spectrosc. Radiat. Transf. 2010, 111, 2139–2150. [Google Scholar] [CrossRef]
  29. Solomon, S.; Schmeltekopf, A.L.; Sanders, R.W. On the interpretation of zenith sky absorption measurements. Geophys. Res. Atmos. 1987, 92, 8311–8319. [Google Scholar] [CrossRef]
  30. Hönninger, G.; Friedeburg, C.V.; Platt, U. Multi axis differential optical absorption spectroscopy (MAX-DOAS). Atmos. Chem. Phys. 2004, 4, 231–254. [Google Scholar] [CrossRef] [Green Version]
  31. Celarier, E.A.; Brinksma, E.J.; Gleason, J.F.; Veefkind, J.P.; Cede, A.; Herman, J.R. Validation of ozone monitoring instrument nitrogen dioxide columns. J. Geophys. Res. Atmos. 2008, 113, D15. [Google Scholar] [CrossRef]
  32. Zheng, G.J.; Duan, F.K.; Su, H.; Ma, Y.L.; Cheng, Y.; Zheng, B.; Zhang, Q.; Huang, T.; Kimoto, T.; Chang, D.; et al. Exploring the severe winter haze in Beijing: the impact of synoptic weather, regional transport and heterogeneous reactions. Atmos. Chem. Phys. 2015, 15, 2969–2983. [Google Scholar] [CrossRef] [Green Version]
  33. Duan, L.; Xiu, G.; Feng, L.; Cheng, N.; Wang, C. The mercury species and their association with carbonaceous compositions, bromine and iodine in PM2.5 in Shanghai. Chemosphere 2016, 146, 263–271. [Google Scholar] [CrossRef]
  34. Wagner, T.; Burrows, J.P.; Deutschmann, T.; Dix, B.; Friedeburg, C.V.; Frieß, U.; Hendrick, F.; Heue, K.P.; Irie, H.; Iwabuchi, H.; et al. Comparison of box-air-mass-factors and radiances for Multiple-Axis Differential Optical Absorption Spectroscopy (MAX-DOAS) geometries calculated from different UV/visible radiative transfer models. Atmos. Chem. Phys. 2007, 7, 1809–1833. [Google Scholar] [CrossRef] [Green Version]
  35. Alvarado, L.M.A.; Richter, A.; Vrekoussis, M.; Wittrock, F.; Hilboll, A.; Schreier, S.F.; Burrows, J.P. An improved glyoxal retrieval from OMI measurements. Atmos. Meas. Tech. 2014, 7, 4133. [Google Scholar] [CrossRef]
  36. Wang, Y.; Tao, J.; Cheng, L.; Yu, C.; Wang, Z.; Chen, L. A Retrieval of Glyoxal from OMI over China: Investigation of the Effects of Tropospheric NO2. Remote Sens. 2019, 11, 137. [Google Scholar] [CrossRef]
  37. Rasmussen, R.A.; Khalil, M.A.K. Atmospheric trace gases: trends and distributions over the last decade. Science 1986, 232, 1623–1624. [Google Scholar] [CrossRef] [PubMed]
  38. Wilkniss, P.E.; Lamontagne, R.A.; Larson, R.E.; Swinnerton, J.W.; Dickson, C.R.; Thompson, T. Atmospheric trace gases in the southern hemisphere. Nat. Phys. Sci. 1973, 245, 45–47. [Google Scholar] [CrossRef]
  39. Gratsea, M.; Vrekoussis, M.; Richter, A.; Wittrock, F.; Schönhardt, A.; Burrows, J.; Kazadzis, S.; Mihalopoulos, N.; Gerasopoulos, E. Slant column MAX-DOAS measurements of nitrogen dioxide, formaldehyde, glyoxal and oxygen dimer in the urban environment of Athens. Atmos. Environ. 2016, 135, 118–131. [Google Scholar] [CrossRef]
  40. Cleveland, W.S.; Graedel, T.E.; Kleiner, B.; Warner, J.L. Sunday and workday variations in photochemical air pollutants in New Jersey and New York. Science 1974, 186, 1037–1038. [Google Scholar] [CrossRef] [PubMed]
  41. Beirle, S.; Platt, U.; Wenig, M.; Wagner, T. Weekly cycle of NO2 by GOME measurements: a signature of anthropogenic sources. Atmos. Chem. Phys. 2003, 3, 2225–2232. [Google Scholar] [CrossRef]
Figure 1. Location of Hefei observation site for multi-axis differential optical absorption spectroscopy (MAX-DOAS) measurements in China.
Atmosphere 10 00353 g001
Figure 2. Characteristic DOAS spectral fitting of the spectrum obtained at a viewing angle of 30° on 11 November 2018 for (a) NO2 and (b) CHOCHO. Legend: dSCD, differential slant column density.
Atmosphere 10 00353 g002
Figure 3. (a) NO2 RMS (b) NO2 dSCD error, (c) CHOCHO RMS and (d) CHOCHO dSCD error under different weather conditions.
Atmosphere 10 00353 g003
Figure 4. Time series of (a) NO2 and (b) CHOCHO from 1 July 2018 to 31 December 2018. Legend: VCDs, vertical column densities.
Atmosphere 10 00353 g004
Figure 5. Monthly variations in (a) CHOCHO, (b) NO2, (c) temperature, (d) visibility, and (e) PM2.5.
Atmosphere 10 00353 g005
Figure 6. Correlation plots of NO2 and CHOCHO with PM2.5, temperature, and visibility.
Atmosphere 10 00353 g006
Figure 7. Diurnal cycles for (a) CHOCHO and (b) NO2 VCDs monitored in Hefei, China.
Atmosphere 10 00353 g007
Figure 8. Weekly cycles for (a) NO2 and (b) CHOCHO VCDs monitored in Hefei, China.
Atmosphere 10 00353 g008
Table 1. The parameter settings used in MAX-DOAS observations.
ParameterData SourceTrace Gases
NO2CHOCHO
Wavelength 425–490 (nm)438–457 (nm)
NO2298 K, Vandaele et al. [24]
NO2220 K, Vandaele et al. [25]
O3223K, Serdyuchenko et al. [26]
CHOCHO296K, Volkamer et al. [8]x
O4293 K, Thalman and Volkamer [27]
H2O296 K, HITEMP (High-temperature spectroscopic absorption parameters), Rothman et al. [28]
RingCalculated with QDOAS
Polynomial degree 55
Table 2. Different meteorological conditions.
Meteorological ConditionVisibility (km)PM2.5 (μg/m3)
Clear days>10<70
Haze days>5 and <10>70 and <115
Severe haze days<5>115
Table 3. Average concentrations of NO2, CHOCHO, PM2.5, and visibility under different meteorological conditions.
Meteorological ConditionNO2 (molecules/cm2)CHOCHO (molecules/cm2)Visibility (km)PM2.5 (μg/m3)
Clear days1.92 × 10164.70 × 10142236
Haze days4.38 × 10167.62 × 10148.8103
Severe haze days3.30 × 10165.25 × 10143.9151

