Article

Atmospheric Dry Deposition of Water-Soluble Nitrogen to the Subarctic Western North Pacific Ocean during Summer

1
Korea Polar Research Institute, 26 Songdomirae-ro Yeonsu-gu, Incheon 21990, Korea
2
Department of Marine Science, Incheon National University, Incheon 22012, Korea
3
Department of Earth System Science, University of California, Irvine, CA 92697, USA
4
Institute of Low Temperature Science, Hokkaido University, Sapporo 060-0819, Japan
5
Department of Polar Sciences, University of Science and Technology (UST), Incheon 21990, Korea
*
Author to whom correspondence should be addressed.
Atmosphere 2019, 10(7), 351; https://doi.org/10.3390/atmos10070351
Submission received: 23 May 2019 / Revised: 20 June 2019 / Accepted: 24 June 2019 / Published: 26 June 2019

Abstract

:
To estimate dry deposition flux of atmospheric water-soluble nitrogen (N), including ammonium (NH4+), nitrate (NO3), and water-soluble organic nitrogen (WSON), aerosol samples were collected over the subarctic western North Pacific Ocean in the summer of 2016 aboard the Korean icebreaker IBR/V Araon. During the cruise, concentrations of NH4+, NO3, and WSON in bulk (fine + coarse) aerosols ranged from 0.768 to 25.3, 0.199 to 5.94, and 0.116 to 14.7 nmol m−3, respectively. Contributions of NH4+, NO3, and WSON to total water-soluble N represented ~74%, ~17%, and ~9%, respectively. Water-soluble N concentrations showed a strong gradient from the East Asian continent to the subarctic western North Pacific Ocean, indicating that water-soluble N species were mainly derived from anthropogenic or terrestrial sources. During sea fog events, coarse mode NO3 was likely to be scavenged more efficiently by fog droplets than fine mode NO3; besides, WSON was detected only in fine mode, suggesting that there may have been a significant influence of sea fog on WSON, such as the photochemical conversion of WSON into inorganic N. Mean dry deposition flux for water-soluble total N (6.3 ± 9.4 µmol m−2 d−1) over the subarctic western North Pacific Ocean was estimated to support a minimum carbon uptake of 42 ± 62 µmol C m−2d−1 by using the Redfield C/N ratio of 6.625.

1. Introduction

Nitrogen (N) is an essential nutrient in terrestrial and marine ecosystems. The supply of N to the ocean surface layer is an important factor controlling the ocean ecosystem [1]. Apart from the supply of deep nutrient-rich water by vertical mixing, atmospheric deposition can be a significant source of N to the photic zone of the open ocean where riverine input is negligible [2]. Thus, atmospheric deposition is considered as a dominant pathway for the supply of anthropogenic N to open ocean surface waters [3,4].
Human activities have already enhanced N input to coastal and open oceans [5,6]. For example, Duce et al. [5] reported that the flux of atmospheric total reactive N to the ocean surface has increased by 48 TgN/year from preindustrial times to 2000, suggesting that almost all ocean surface areas have been affected by anthropogenic atmospheric reactive N, including oxidized and reduced inorganic and organic N. As a result of increased combustion and fertilizer use, the enhanced N release from land has resulted in a change in nutrient supply to the oceans [7]. It has been, therefore, recognized that an increasing input of anthropogenic N to the ocean could lead to major changes in the upper ocean N cycle and biological productivity, since anthropogenic N inputs have the potential to affect marine ecosystem (e.g., changes in phytoplankton community structure, inorganic carbon storage, and primary productivity), especially in coastal regions and marginal seas [7,8].
Although recent studies have estimated the atmospheric N deposition flux and its impact on the marine ecosystem, there are still large uncertainties with regard to the atmospheric N cycle over the oceans [9], since most studies are based on the results from several models, and the validation of model output is primarily based on comparisons to terrestrial sampling sites [5,10,11,12]. Considerable efforts have been devoted to estimating atmospheric N deposition flux over various oceanic regions and during different periods to fill data gaps for the atmospheric N input to the open ocean. Nevertheless, previous results are still not enough to present a comprehensive picture of the spatial distributions of atmospheric N and its deposition to the ocean. In addition, relatively little data has been reported for the Pacific Ocean [3,13,14,15,16,17] compared to other oceans (e.g., the Atlantic Ocean) [9,18,19,20,21,22,23,24].
The western North Pacific Ocean receives a large influx of mineral particles and pollutants from the Asian continent through long-range atmospheric transport [25,26]. The increase in atmospheric N deposition is particularly important in the western North Pacific Ocean due to the rapid growths in human population and industrial activity in northeast Asian countries [27,28]. These changes in northeast Asia have markedly increased N fluxes in the adjacent marine environment through atmospheric transport by westerly winds and subsequent deposition [7,17,29]. Furthermore, Kim et al. [6] recently reported that the increase in excess N concentration observed in the upper North Pacific Ocean was a consequence of the recent increase in atmospheric N deposition, resulting mainly from the dramatic increase in anthropogenic N emissions in northeastern Asia. Accordingly, it becomes increasingly important to estimate deposition flux of atmospheric N to the western North Pacific Ocean and evaluate its impact on the marine ecosystem.
Sources of atmospheric ammonium (NH4+) and nitrate (NO3) are comparatively well understood [19,21,30]. Ammonia (NH3), a precursor of NH4+, is primarily generated from intensive agricultural activity [31] and biomass burning [32]. NH3 is also emitted into the atmosphere from the oceans as a result of biological activity [33]. NH4+ is formed from the reaction of NH3 with acidic species and predominant in fine mode aerosols. On the other hand, NO3 in the marine atmosphere is present primarily in coarse mode aerosol particles, resulting from reactions of nitric acid (HNO3) or its precursor (i.e., nitrogen oxides, NOx) derived from combustion processes with sea-salt [34]. In comparison to atmospheric inorganic N species, the details of the role of organic N are less well understood, although the importance of atmospheric organic N to N cycling, nutrient availability, and particle formation is recognized. Recently, Cape et al. [35] revealed several possible sources of water-soluble organic nitrogen (WSON) in the atmosphere, including livestock and animal husbandry, fertilizers, vehicle exhausts, biomass burning, and secondary pollutants. Besides, previous studies [36,37] have provided evidence that WSON in remote oceanic regions is produced by biological activity, suggesting a marine biogenic source for WSON. In a recent review, Cornell [38] summarized available data on dissolved organic nitrogen (DON) in rainwater and showed a clear geographical pattern with highest concentrations in continental areas and particularly over Asia (mean concentrations more than 100 µM) with much lower concentrations in remote marine locations (approximately 5 µM). Previous studies have shown that WSON is mainly associated with fine mode particles, which is formed by a reaction of its basic gaseous precursors with particulate or gaseous acidic species (i.e., gas-to-particle conversion) in the atmosphere [5,19,30,38,39,40,41], even though oxidation of reduced organic N species of biogenic origin produced by mechanical processes (as sea spray or soil mobilization) has also been considered as a potentially important WSON source [30,40]. In this study, we measured atmospheric water-soluble N species (i.e., NH4+, NO3, and WSON) in marine aerosols collected over the subarctic western North Pacific Ocean during the summer of 2016. This study, therefore, aims to (1) investigate spatial distributions of atmospheric NH4+, NO3, and WSON; (2) estimate dry deposition fluxes of atmospheric water-soluble N species; and (3) evaluate the impact of atmospheric water-soluble N deposition on the marine ecosystem.

2. Experiments

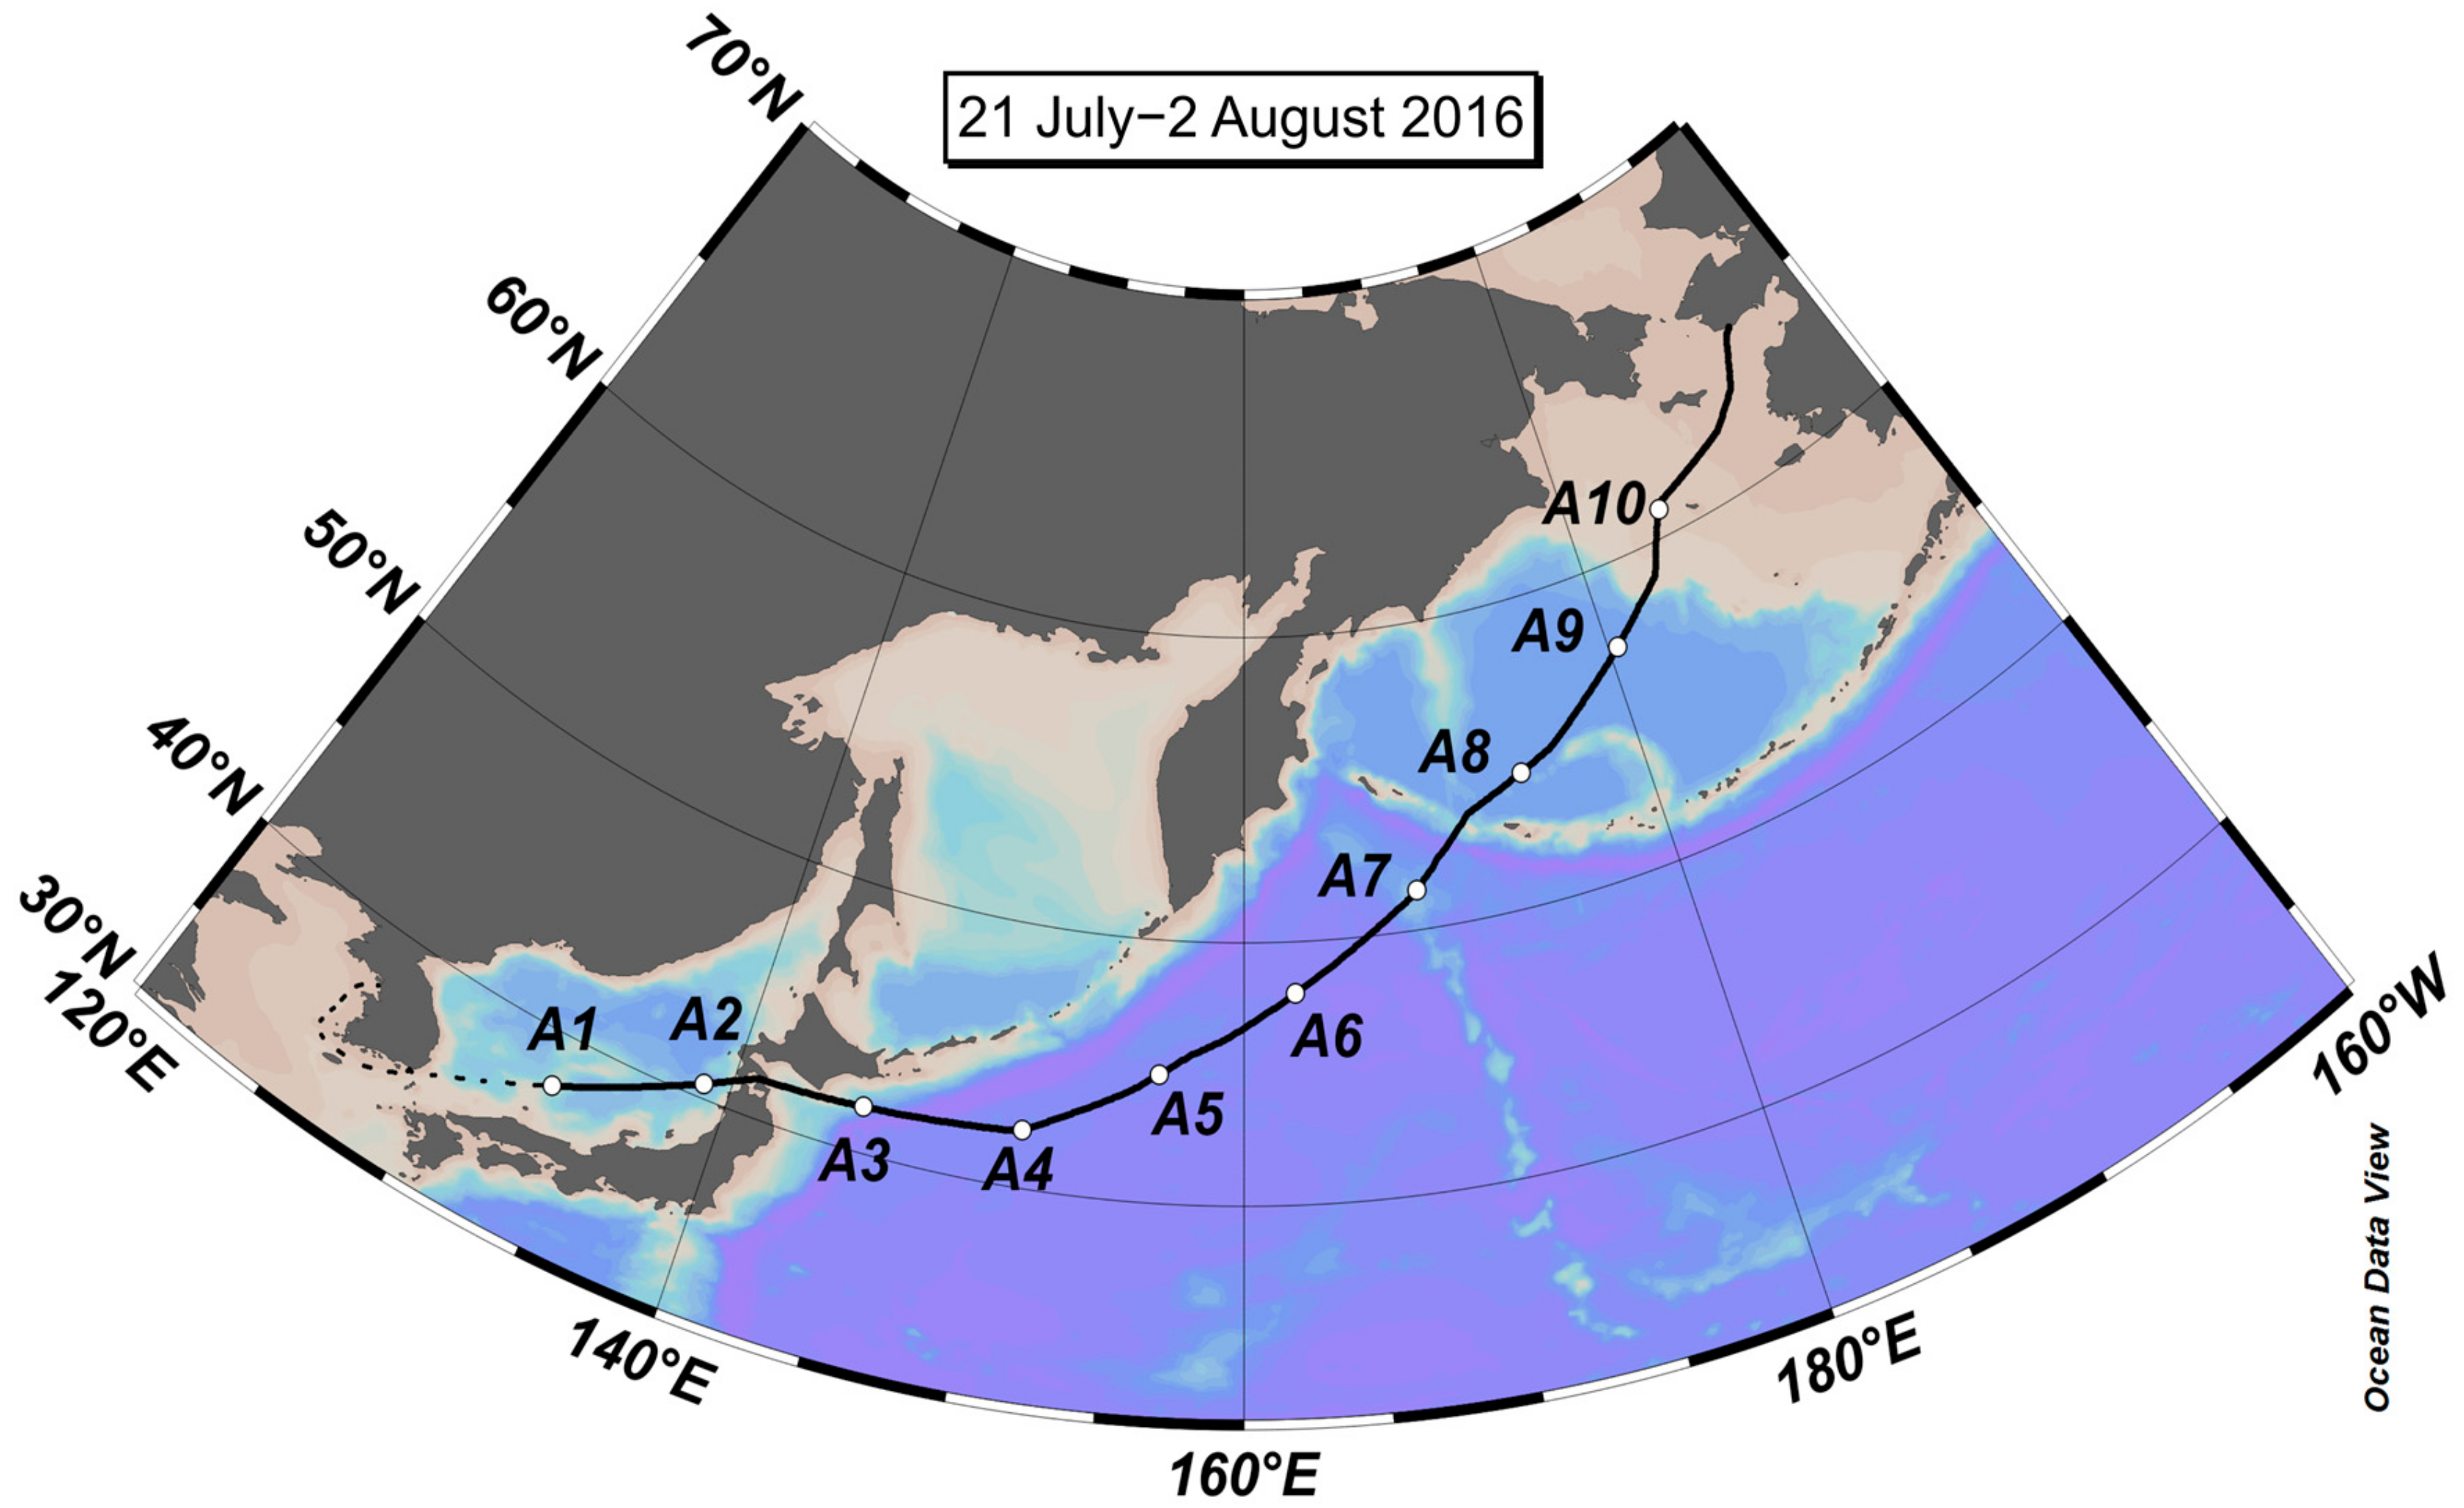
2.1. Aerosol Collection

Aerosol samples were collected over the subarctic western North Pacific Ocean during the ARA07A cruise (21 July−2 August 2016) aboard the Korean icebreaker IBR/V Araon (Figure 1). During the cruise, two high-volume aerosol samplers (HV-100R, Sibata Scientific Technology Ltd., Tokyo, Japan) were located at the upper deck of the ship and used to collect marine aerosols on pre-combusted (at 550 °C for 6 h) quartz filters (25 × 20 cm, QR-100, Sibata Scientific Technology Ltd.) at a sampling flow rate of 1000 L min−1. To collect fine (D < 2.5 µm) and coarse modes (2.5 µm < D < 10 µm) aerosols on the filters, particle size selector for PM2.5 and PM10 were installed to each aerosol sampler. Possible contamination from ship exhaust was prevented by using a wind-sector controller during the cruise [42]. The wind-sector controller was set to collect marine aerosol samples only when the relative wind directions were within plus or minus 100° relative to the ship’s bow and the relative wind speeds were over 1 m s−1. The sampling time for each sample was approximately 24 h. However, the total air volume of each sample varied from 400 to 1400 m3 due to the different conditions of relative wind directions and wind speeds for each sampling period. After sampling, the filters were stored frozen at −24 °C before chemical analysis. Procedural blanks (n = 3) were obtained by placing quartz filters in the aerosol sampler for 5 min on idle systems (i.e., no air flow through the filters) and processed as other aerosol samples.

2.2. Chemical Analysis

2.1.1. Ionic Species

Aerosol samples were analyzed for major ionic and inorganic N species (NH4+ and NO3) using the method described in detail elsewhere [15,16,42,43]. Briefly, the filters were cut into four equivalent subsamples. The subsamples were ultrasonically extracted using 50 mL of Milli-Q water (>18 MΩ cm−1, Millipore Co., Bedford, MA, USA). The extraction solution was then filtered through a 13-mm diameter, 0.45-µm pore size membrane filter (PTFE syringe filter, Millipore Co.). The filtrate was analyzed by ion chromatography (IC; ICS-1100, Thermo Scientific Dionex) for anions (Cl, MSA, NO3, and SO42−) and cations (Na+, NH4+, K+, Mg2+, and Ca2+). The instrumental detection limits were: Cl 0.05 µg L−1, MSA 0.02 µg L−1, NO3 0.02 µg L−1, SO42− 0.02 µg L−1, Na+ 0.02 µg L−1, NH4+ 0.14 µg L−1, K+ 0.16 µg L−1, Mg2+ 0.08 µg L−1, and Ca2+ 0.20 µg L−1. From replicate injections, the analytical precision was estimated to be <5%.

2.1.2. Water-Soluble Total Nitrogen

Other aerosol subsamples were ultrasonically extracted using the same method for ionic species measurements. The filtrates were analyzed by a total organic carbon (TOC) analyzer (Model TOC-L, Shimadzu Inc., Tokyo, Japan) equipped with a total nitrogen (TN) unit (TNM-L, Shimadzu Inc.) for determination of the total aerosol nitrogen dissolved in water [44,45]. The nitrogen content was determined by measuring nitrogen monoxide with an ozone chemiluminescence detector. Because the instrument measured the TN in a liquid sample, we use the term water-soluble total nitrogen (WSTN) when referring to the concentrations measured with this instrument. The field blank for WSTN dissolved in water was 3.5 µmol L−1, which represented 7.4% of WSTN concentration in ambient aerosols. The uncertainty of the WSTN was estimated to be 4.1%. The concentration of WSON is defined as the difference between WSTN and inorganic N (i.e., WSON = WSTN − NH4+ − NO3). Using the propagating errors of each parameter, the uncertainty of WSON was estimated to be 8.2%.

2.3. Backward Trajectory Anzalysis

Air mass backward trajectories (AMBTs) were calculated using the Hybrid Single-Particle Lagrangian Integrated Trajectories (HY-SPLIT) model [46]. The HY-SPLIT model was run for 7 days with meteorological data from the Global Data Assimilation System (GDAS). Arriving heights were set at 500, 1000, and 1500 m.

2.4. Dry Deposition Flux Estimate

Dry deposition fluxes (Fd) were calculated from aerosol concentrations (Ca) in the coarse (c) and fine (f) modes and dry deposition velocities (Vd) for each size mode [3,21]:
Fd = CacVdc + CafVdf
In this study, we used dry deposition velocities of 2 cm s–1 for coarse mode and 0.1 cm s–1 for fine mode, since these two values are known to be best estimates based on experimental and model studies [3,20]. Nevertheless, this estimate might be subject to a bias of a factor of 2−3 in the calculated flux because processes that control Vd, including gravitational settling, impaction, and diffusion of particles, varies depending on many variables, such as particle size, wind speed, and relative humidity [3].

3. Results and Discussion
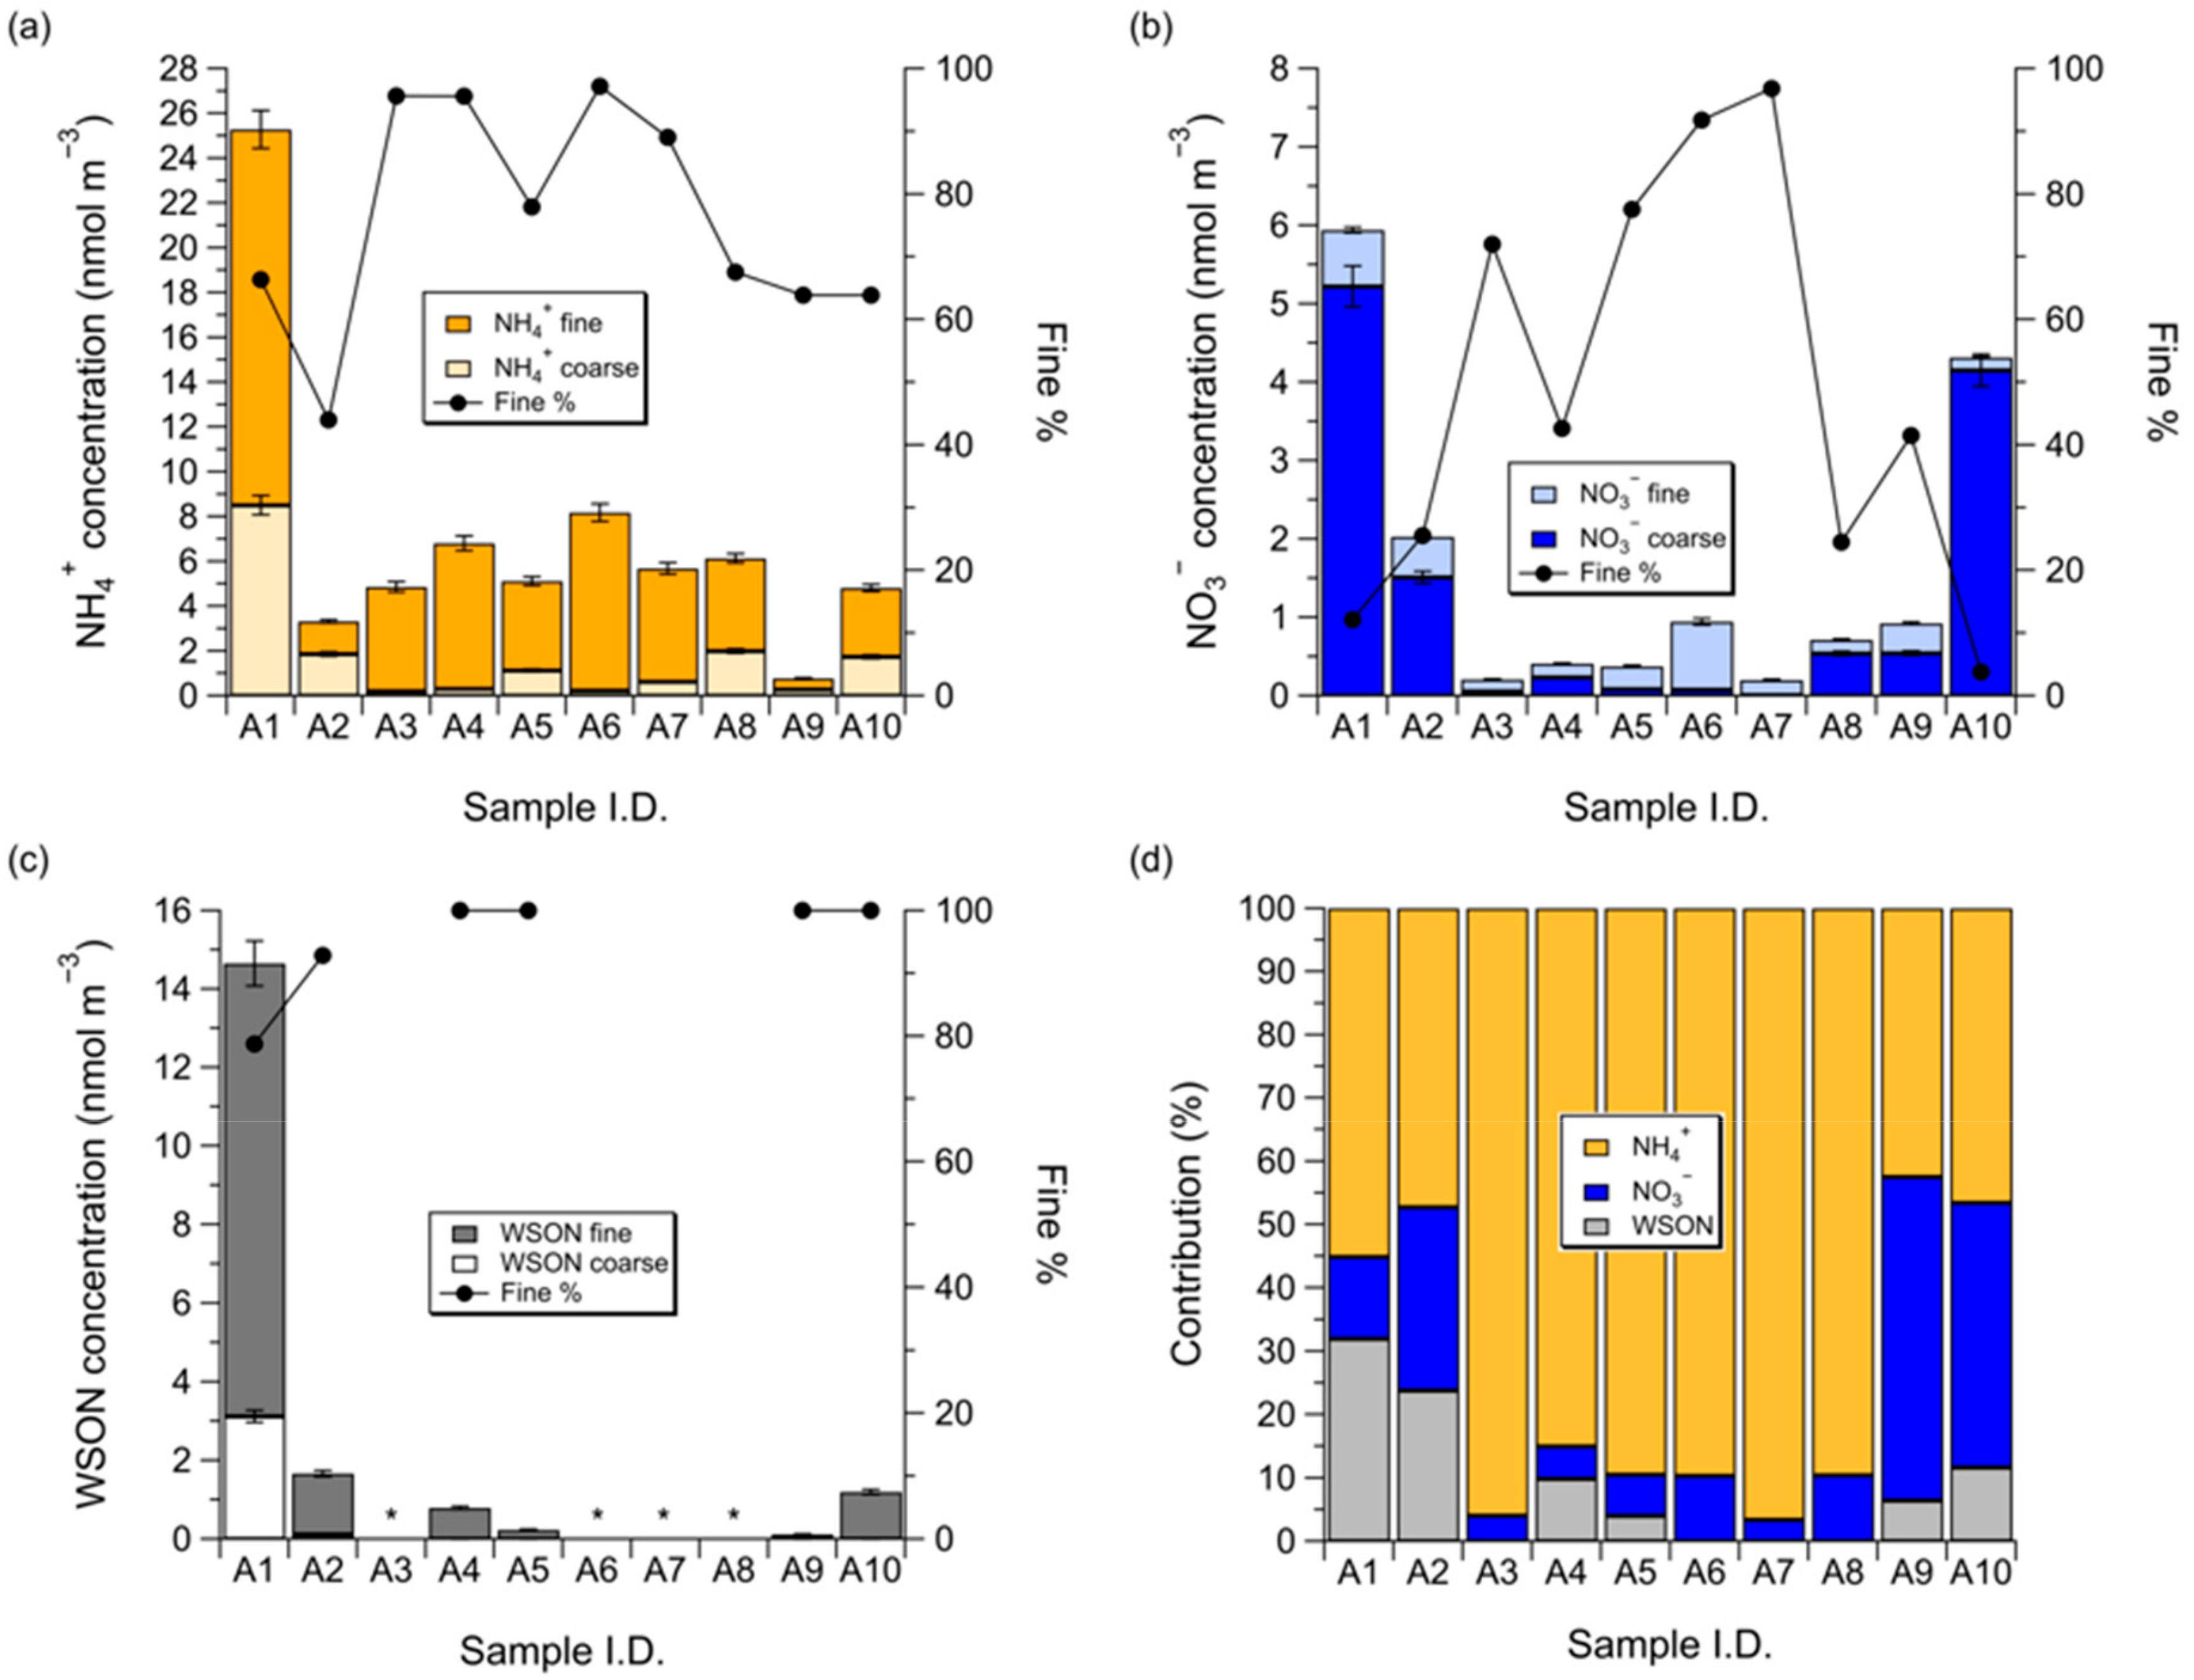
3.1. Concentrations of NH4+, NO3, and WSON over the Subarctic Western North Pacific Ocean

During the cruise, concentrations of NH4+, NO3, and WSON in bulk (fine + coarse) aerosols ranged from 0.768 to 25.3 nmol m−3, 0.199 to 5.94 nmol m−3, and 0.116 to 14.7 nmol m−3, with averages of 7.09 ± 6.69 nmol m−3, 1.61 ± 1.97 nmol m−3, and 3.11 ± 5.69 nmol m−3, respectively (Figure 2). Aerosol water-soluble total N was composed of ~74% NH4+, ~17% NO3, and ~9% WSON (mean values for all data), with ~73%, ~42%, and ~100% (median values for all data) of each species being present on fine mode aerosol, respectively.
Atmospheric water-soluble N species concentrations can vary depending on sampling location, regional source strengths, transport pathways, and meteorological conditions (e.g., rainfall) [47]. The mean NH4+ concentration from this study was a factor of 1.3 higher than the previous result by Jung et al. [16], who reported that the mean concentrations of NH4+ and NO3 observed over the subarctic western North Pacific Ocean (38° N–48° N, 29 July–19 August 2008) were 5.6 nmol m−3 (range: 2.9–9.8 nmol m−3) and 2.5 nmol m−3 (range: 0.64–5.6 nmol m−3), respectively. However, our mean NO3 concentration was a factor of 1.6 lower than their result. For WSON, our mean concentration was a factor of 2.3 higher than that (mean: 1.4 ± 1.1 nmol m−3) observed over the western North Pacific Ocean (40° N–44° N, 24 August–13 September 2008) [44]. During the cruise, the highest concentrations of NH4+, NO3, and WSON were observed when air masses originated from the East Asian continent circulated the vicinity of the Japanese Islands and thereafter reached the sampling region (i.e., aerosol sample A1) (Figure 3). However, the concentrations of atmospheric water-soluble N species drastically decreased and remained low when relatively clean marine air originated from the central Pacific Ocean reached the sampling sites. These results suggest that atmospheric NH4+, NO3, and WSON were mainly derived from anthropogenic and/or terrestrial sources. Furthermore, when the ship sailed over the subarctic western North Pacific Ocean, the NO3 and WSON concentrations decreased much more or were not observed, whereas NH4+ concentration showed no significant variation. Atmospheric NO3 concentration, however, increased sharply when the ship approached Alaska, whereas NH4+ and WSON concentrations remained low or slightly increased, indicating that the primary source regions for NO3 are continental [48], but those for NH4+ and WSON are the East Asian continent [29,38].

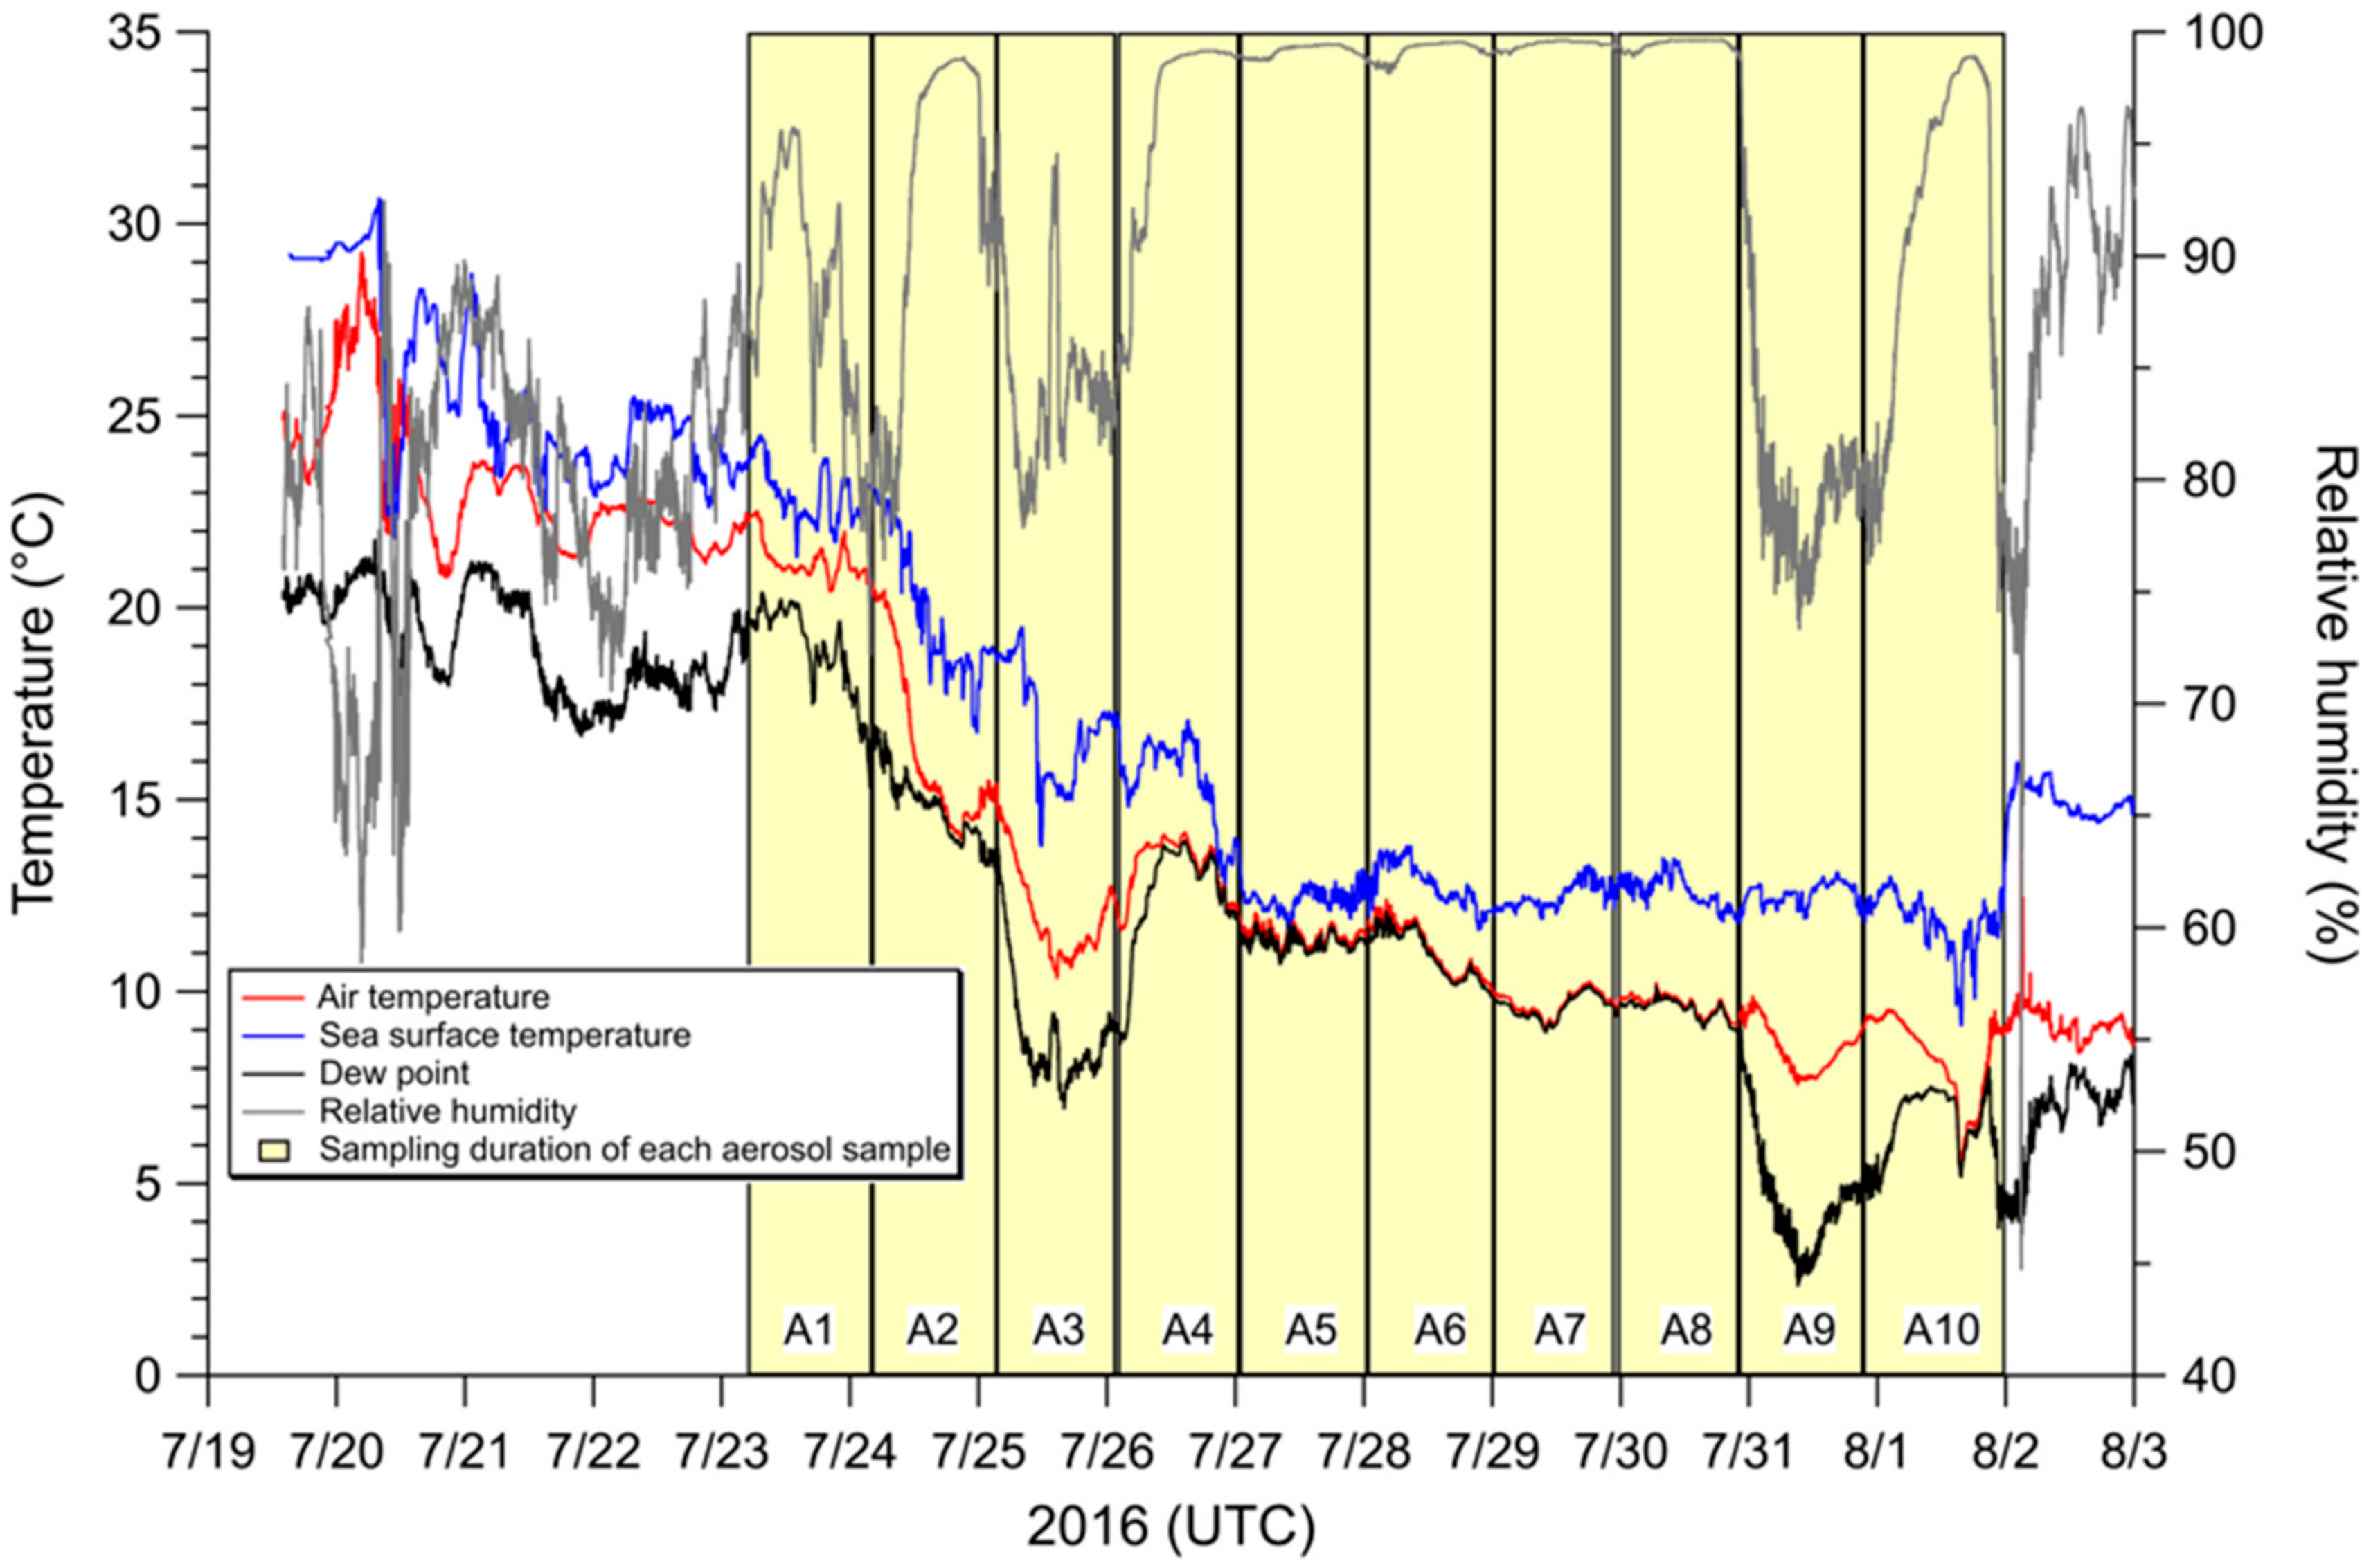
3.2. Influence of Sea Fog Events on Atmospheric Water-Soluble N Species

Sea fog, a type of advection fog, typically occurs when moist marine air passes over a cold surface by advection [49,50]. The subarctic western North Pacific Ocean has a high sea fog frequency, with a maximum of ~50% during the summertime period from June to August [51]. During the sampling period, sea fog occurred when air temperature dropped to its dew point (Figure 4). This result indicates that the warm and humid air masses from the subtropical Northern Pacific Ocean were cooled down to a saturation temperature during the passage over the cold sea surface of the subarctic western North Pacific Ocean (Figure 3) [16]. On the contrary, the air temperature dropped to its dew point during the sampling period near Alaska (i.e., aerosol sample A10) when air masses circulated the Arctic Ocean reached the sampling site. Gultepe et al. [50] reported that steam fog, another type of advection fog, tends to be observed in the Arctic and occurs when very cold air drifts across relatively warm water [50]. The meteorological data set and the AMBT, therefore, suggests that two types of fog occurred during the cruise.
As described above, the AMBT (Figure 3) and the meteorological conditions (Figure 4) show that sea fog occurred during the cruise. For example, the air temperature during the sampling periods of aerosol samples, A2, A4–A8, and A10, cooled down to its dew point, and the relative humidity reached ~100%, making a favorable condition for sea fog formation (Figure 4). In particular, aerosol samples A4–A8 were most likely to be affected by sea fog events since the air temperature dropped to its dew point during 66–100% of sampling periods of those samples.
Previous studies [16,52] observed the statistically significant decreases in number densities of particles larger than 0.5 µm during sea fog events that occurred in the subarctic western North Pacific Ocean, suggesting that coarse mode particles (D > 0.5 µm) could act preferentially as condensation nuclei for sea fog droplets and that the condensation of water vapor occurred preferably on coarse particles leads to the acceleration of particle removal from the atmosphere and the effective scavenging of coarse mode particles. In addition, sea fog can deliver substantial N to the surface ocean if the sea fog event persists long enough with sufficient liquid water content [53]. As shown in Figure 2, the NO3 concentration sharply decreased, and the percentage of NO3 existed in fine mode aerosol particles increased during sea fog events, suggesting that the coarse mode NO3 was likely to be scavenged more efficiently by sea fog than the fine mode NO3. However, although aerosol samples A2 and A10 were likely to be affected by fog events as well, the NO3 concentrations in those aerosol samples were relatively high, and most NO3 in those samples existed in coarse mode aerosols. These results suggest that fog events that occurred during the collections of those samples persisted in short (i.e., 42% and 28% of sampling periods of A2 and A10, respectively) (Figure 4) and that the source strength of NO3 near the continent overwhelmed the influence of fog events on NO3 concentration during the collection of those samples.
Unlike NO3, NH4+ concentration showed no significant variation during sea fog events, reflecting that NH4+ was less likely to be affected by sea fog than NO3. However, likewise to NO3, the percentage of NH4+ that existed in fine mode aerosol particles increased during sea fog events, suggesting that the coarse mode NH4+ was likely to be scavenged more efficiently than the fine mode NH4+ due to the preferential removal of coarse particles by sea fog [16,52].
In comparison to atmospheric inorganic N species, most aerosol WSON collected during the cruise showed low concentration or was not detected, except for that observed in near the East Asian continent (i.e., aerosol sample A1), and the WSON in aerosol samples likely affected by sea fog events was found only in fine mode aerosols, suggesting there may have been a significant influence of sea fog on WSON (Figure 2). If the absence of coarse mode WSON in aerosol samples affected by sea fog events is caused by the preferential scavenging processes of coarse particles by sea fog, the fine mode WSON in those aerosol samples would be observed. However, unlike NH4+, the fine mode WSON in several samples affected by sea fog events was not detected, although both NH4+ and WSON were primarily present in fine mode aerosol particles [39]. The absence of fine mode WSON may be attributed to the decline of atmospheric WSON concentration with distance from the East Asian continent. Luo et al. [17] observed significant logarithmic decreases in water-soluble N species concentrations from China to the Northwest Pacific Ocean. However, removal processes for inorganic N are very effective, with concentrations declining rapidly with distance from the source [38]. In comparison, organic N compounds have been identified as important in the long-range transport of N because removal processes for organic N tend to be less effective [54,55]. Moreover, previous studies observed WSON in marine aerosols collected in remote oceanic regions where the influence of anthropogenic sources is less than our study region [44,56]; one cannot, therefore, disregard the possibility that the absence of fine mode WSON in aerosol samples affected by sea fog events is not due to a land–sea gradient in WSON concentration. Another possible explanation for the absence of fine mode WSON is the photochemical conversion of atmospheric organic N in atmospheric condensed phases into inorganic N species (i.e., NH4+ and NO3). Zhang and Anastasio [57] investigated the transformations of bulk organic N in atmospheric condensed phases (in fog water and aerosol extracts) during exposure to simulated sunlight. They found that over the course of several hours of exposure (about 8 h), a significant portion of condensed-phase organic N was transformed into inorganic N species (average formation rates for NH4+ and NO3 were 12 ± 8.4 ng m−3 h−1 and 42 ± 12 ng m−3 h−1, respectively). Furthermore, their results suggest that organic N itself can participate in photochemical reactions, thus acting as a reservoir of inorganic N in the atmosphere and that WSON can be converted into inorganic N during the long-range transport of continental aerosols (cycling in the atmosphere and fog waters). The absence of fine and coarse mode WSON as well as the increases in the percentages of fine mode inorganic N in aerosol samples affected by sea fog events, therefore, could possibly have resulted from complex linkage between the effective removal of coarse mode particles by sea fog [16] and the photochemical conversion of atmospheric organic N into inorganic N in the condensed phase [57].

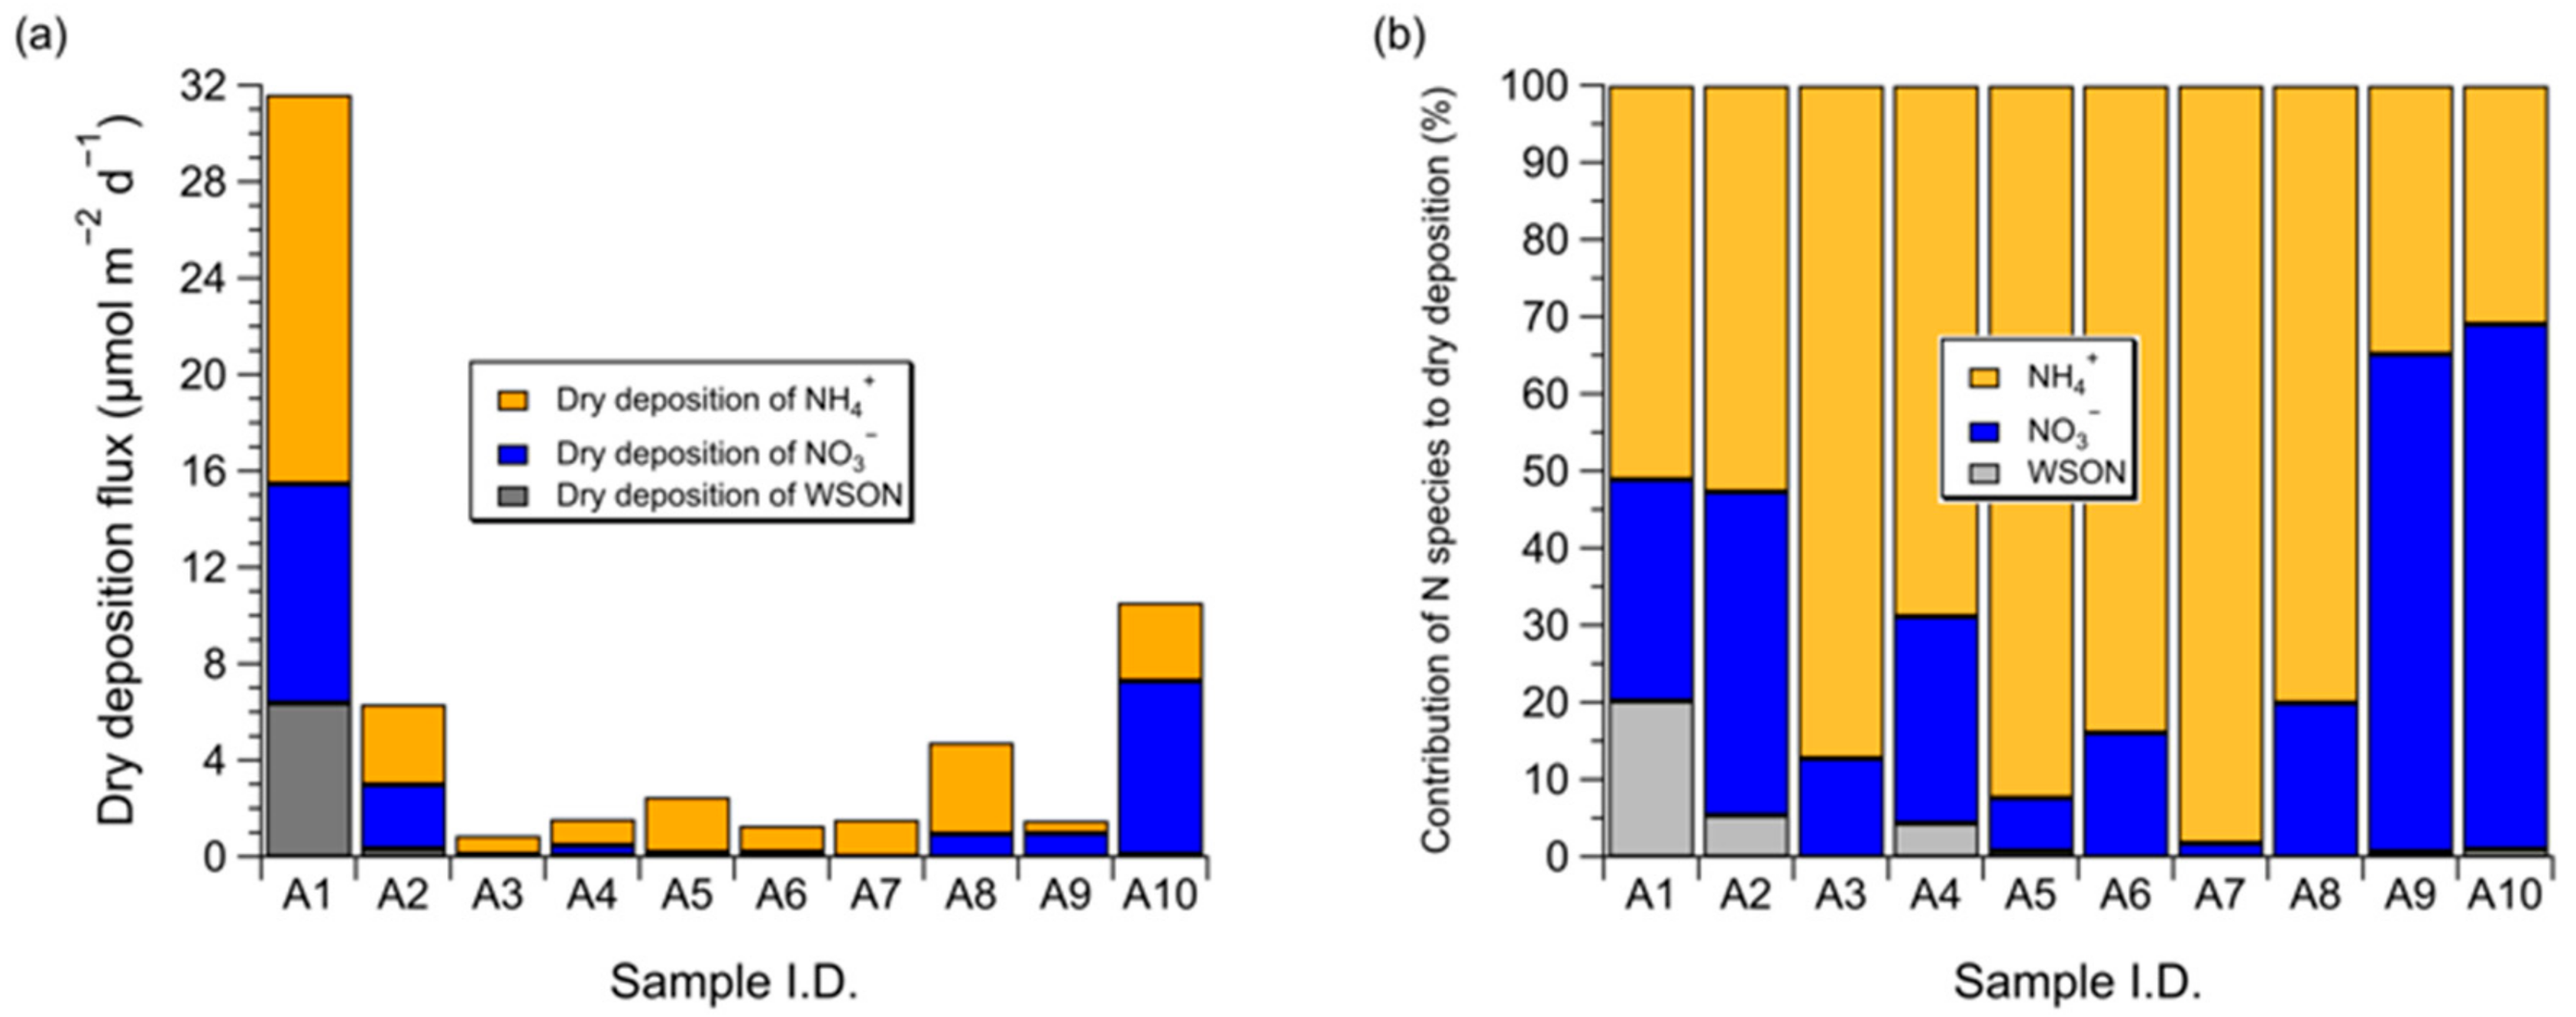
3.3. Dry Deposition Flux of Atmospheric Water-Soluble N to the Subarctic Western North Pacific Ocean

Variations of dry deposition fluxes for NH4+, NO3, and WSON during the sampling period are shown in Figure 5. Dry deposition fluxes for water-soluble N species sharply decreased with distance from the East Asian continent. This is consistent with decreasing concentrations of each water-soluble N species away from anthropogenic and/or terrestrial sources in the East Asian continent. Over the subarctic western North Pacific, the dry deposition flux decreased much more due to the influence of sea fog as mentioned in Section 3.2; however, the dry deposition flux somewhat increased near Alaska. The estimated dry deposition fluxes for atmospheric water-soluble N species ranged from 0.52 to 16 µmol m−2 d−1 for NH4+, 0.028 to 9.1 µmol m−2 d−1 for NO3, and 0 to 6.4 µmol m−2 d−1 for WSON. Mean dry deposition fluxes for NH4+, NO3, and WSON were estimated to be 3.4 ± 4.6 µmol m−2 d−1, 2.2 ± 3.3 µmol m–2 d–1, and 0.69 ± 2.0 µmol m−2 d−1, accounting for ~68%, ~29%, and ~3% to the dry deposition flux for water-soluble N, respectively. In general, NO3 is the dominant inorganic N species in dry deposition [15,16,17,58] since NO3 in the marine atmosphere is mainly present in coarse mode particles that deposit more rapidly. However, in this study, NH4+ was a more important water-soluble N species supplied by dry deposition, although most NH4+ predominantly existed in fine mode particles, probably due to the preferential scavenging processes of NO3 by sea fog. However, it is worth noting that water-soluble N species preferentially scavenged by sea fog events would be delivered to the subarctic western North Pacific by sea fog deposition because the formation of liquid droplets by condensation of water vapor on pre-existed particles acting as condensation nuclei leads to the acceleration of particle removal from the atmosphere [16].
Distinct seasonal cycles in NOx and NH3 emissions were observed over the northwestern Pacific Ocean [47,58,59,60,61]. Anthropogenic sources (e.g., fossil fuel combustion) cause NOx concentrations to peak in wintertime, while NH3 emissions from agricultural activities (e.g., chemical fertilizer application and livestock breeding) peak in springtime. Our mean dry deposition fluxes for water-soluble N species were 1.4 times, 20 times, and 11 times lower than the results over the northwestern Pacific Ocean (27° N−37° N, 137° E−150° E) by Luo et al. [58], who reported that mean dry deposition fluxes for NH4+, NO3, and WSON during the spring of 2014 were 4.66 ± 3.90 µmol m−2 d−1, 44.6 ± 55.3 µmol m−2 d−1, and 7.6 ± 6.5 µmol m−2 d−1, respectively. Given the seasonality of NOx and NH3 emissions and the sampling period of this study (i.e., summer), our dry deposition fluxes for water-soluble N species to the subarctic western North Pacific should be considered as minimum values.

3.4. Potential Impact of Atmospheric Water-Soluble N on New Primary Production over the Subarctic Western North Pacific Ocean

The availability of reactive N limits primary production in much of the ocean because most marine organisms can only assimilate reactive N [5]. The Redfield ratio (C:N = 6.625) shows that phytoplankton use nutrients in well-defined ratios. These ratios indicate that for every mole of nitrogen used, 6.625 mol of carbon is assimilated [62]. Thus, the impact of atmospheric N deposition on the marine ecosystem was evaluated by estimating potential new primary production using dry deposition flux for water-soluble total N and the Redfield C/N ratio of 6.625. It is worth noting that the impact of atmospheric N deposition on new primary production can vary depending on the nutrient status of the receiving waters (e.g., N limitation or iron limitation) [63]. The subarctic North Pacific has been characterized as a high-nutrient, low-chlorophyll (HNLC) region where iron is thought to limit primary production [64,65]. Recent studies have shown that iron concentration is higher in the subarctic western North Pacific [66] than the subarctic eastern North Pacific [67], at least until summer [66]. The higher iron concentration in the subarctic western North Pacific is explained by its proximity to Asian dust sources and three-fold higher rates of dust deposition [68,69,70,71], and the iron supply through ventilation processes originating in the Sea of Okhotsk [66]. Besides, Matsumoto et al. [72] found a significant relationship between primary production and light availability based on the field observations from 2005 to 2013 in the subarctic western North Pacific, suggesting that light availability was a factor that controlled primary production throughout the year in the subarctic western North Pacific. These results by previous studies suggest that atmospheric water-soluble N deposited in the subarctic western North Pacific could be available for uptake by phytoplankton.
Atmospheric inorganic N (NH4+ and NO3) can be readily utilized by a variety of aquatic microorganisms [73]. The bioavailability of atmospheric WSON (or dissolved organic N) to phytoplankton was also reported to be high (29−80%) [74,75]. Assuming the uptake of all the N delivered from atmospheric deposition by phytoplankton without losses and an adequate supply of other nutrients (e.g., phosphorus and iron), the mean dry deposition flux of atmospheric water-soluble total N over the subarctic western North Pacific Ocean (6.3 ± 9.4 µmol m−2 d−1) can support a minimum biologically mediated flux of 42 ± 62 µmol C m−2 d−1. Wong et al. [76] estimated the annual new production from the surface (upper 50 m) of the subarctic western North Pacific Ocean, which covers the sampling area of this study, to be 32.8–82.8 g C m–2 year–1. Based on the estimate by Wong et al. [76], the result of this study suggests that dry deposition for water-soluble N to the subarctic western North Pacific Ocean can support 0.22–0.56% of the new primary production. The contribution of atmospheric water-soluble N input to the new production was negligible because we estimated only the dry deposition flux. However, the contribution of dry deposition to total deposition flux over the subarctic western North Pacific in summer periods is small (~11%) compared to wet and sea fog deposition [16]. Assuming that our dry deposition flux represents ~11% of total N input, the contribution of atmospheric water-soluble N input to the new production would increase up to 5.1%.
In this study, the contribution to the new primary production stimulated by atmospheric dry deposition flux for water-soluble total N was estimated to be <1%. Although the contribution of atmospheric water-soluble N deposition to the new primary production in this study was not significant, the episodic deposition events, such as Asian dust storm, can transport a large amount of N to the surface ocean over a very short period [60,77]. Moreover, the dry deposition flux reported in this study should be considered as a lower limit on the total deposition flux to the subarctic western North Pacific, since both wet and sea fog deposition fluxes were not included in this study. Nevertheless, dry deposition is a non-negligible transfer process for atmospheric water-soluble N from the marine atmosphere to the subarctic western North Pacific, especially in the spring when there is little precipitation, since dry deposition occurs continuously while wet and sea fog deposition is highly episodic.
It is worth mentioning that several limitations exist in this study, including the uncertainty of dry deposition estimates and the limited sampling period. Dry deposition velocities remain one of the major uncertainties in assessing the atmospheric flux of N to the ocean [3], although we used the deposition velocities known to be best estimates based on experimental and model studies. Given the uncertainty of dry deposition velocities (i.e., a factor of 2–3), the range of values for water-soluble total N input in dry deposition to the subarctic western North Pacific due to the uncertainty in deposition velocities was estimated to be 12.6 ± 19.8–18.9 ± 28.2 µmol m−2 d−1. Another limitation of this study is the limited sampling period in the summer. As mentioned earlier, there is distinct seasonality in NOx emissions from anthropogenic sources (highest in winter) and NH3 from agricultural activities (highest in spring). Consequently, given the seasonal changes in N emissions, our dry deposition flux for atmospheric water-soluble N should be considered as a lower limit. Nevertheless, the estimate of atmospheric water-soluble N flux from this study provide a useful contribution to the understanding of atmospheric N cycle in the open ocean environment.

4. Conclusions

Atmospheric water-soluble N input to the subarctic western North Pacific Ocean was determined using the result from marine aerosols collected during the summer of 2016. The highest concentrations of water-soluble N species were observed when air masses originated from the East Asian continent, reflecting the significant influence of anthropogenic or terrestrial sources on aerosol water-soluble N. In comparison, over the subarctic western North Pacific, concentrations of water-soluble N species were significantly lower because of the input of relatively clean marine air and the possible influence of sea fog events. During sea fog events, the coarse mode NO3 was likely to be scavenged more efficiently by sea fog than the fine mode NO3, probably due to the preferential removal of coarse particles by sea fog. Interestingly, WSON in both fine and coarse mode particles was hardly observed during sea fog events, although both NH4+ and WSON were primarily associated with fine mode particles. These results suggest that there may have been a significant influence of sea fog on WSON, such as the photochemical conversion of WSON into inorganic N.
The mean dry deposition fluxes for NH4+, NO3, and WSON were estimated to be 3.4 ± 4.6 µmol m−2 d−1, 2.2 ± 3.3 µmol m−2 d−1, and 0.69 ± 2.0 µmol m−2 d−1, accounting for ~68%, ~29%, and ~3% to the dry deposition flux for water-soluble N, respectively. In this study, NH4+ was a more important water-soluble N species supplied by dry deposition, although most NH4+ predominantly existed in fine mode particles, probably due to the preferential scavenging processes of NO3 by sea fog.
In this study, atmospheric water-soluble N input to the subarctic western North Pacific was estimated during the limited sampling period in the summer. To improve our understanding of atmospheric N input to the surface ocean more clearly, further studies are required to include wet and sea fog deposition as well as dry deposition, and focus on long-term monitoring of atmospheric water-soluble N species.

Author Contributions

J.J. designed the research, processed the data, and wrote the paper. B.H. carried out the experiments. B.R. collected aerosol samples. Y.M. provided water-soluble total nitrogen data and contributed scientific discussion. H.Y.C. and K.K. analyzed ionic species. J.-O.C. processed the meteorological data. K.P., I.-N.K., and S.K. contributed scientific discussion. E.J.Y. and S.-H.K. organized the field campaign. All co-authors contributed to reviewing the paper and improving the study.

Funding

This research was a part of the project titled “Korea-Arctic Ocean Observing System (K-AOOS)”, KOPRI, 20160245, funded by the MOF, Korea.

Acknowledgments

We are grateful to the captain and crews of IBR/V Araon for their enthusiastic assistance during the ARA07A cruise.

Conflicts of Interest

The authors declare no conflict of interest.

References

  1. Elser, J.J.; Bracken, M.E.S.; Cleland, E.E.; Gruner, D.S.; Harpole, W.S.; Hillebrand, H.; Ngai, J.T.; Seabloom, E.W.; Shurin, J.B.; Smith, J.E. Global analysis of nitrogen and phosphorus limitation of primary producers in freshwater, marine and terrestrial ecosystems. Ecol. Lett. 2007, 10, 1135–1142. [Google Scholar] [CrossRef] [Green Version]
  2. Uno, I.; Uematsu, M.; Hara, Y.; He, Y.J.; Ohara, T.; Mori, A.; Kamaya, T.; Murano, K.; Sadanaga, Y.; Bandow, H. Numerical study of the atmospheric input of anthropogenic total nitrate to the marginal seas in the western North Pacific region. Geophys. Res. Lett. 2007, 34, L17817–L17822. [Google Scholar] [CrossRef]
  3. Duce, R.A.; Liss, P.S.; Merrill, J.T.; Atlas, E.L.; Buat-Menard, P.; Hicks, B.B.; Miller, J.M.; Prospero, J.M.; Arimoto, R.; Church, T.M.; et al. The atmospheric input of trace species to the world ocean. Global Biogeochem. Cycles 1991, 5, 193–259. [Google Scholar] [CrossRef]
  4. Jickells, T. Atmospheric inputs of metals and nutrients to the oceans: Their magnitude and effects. Mar. Chem. 1995, 48, 199–214. [Google Scholar] [CrossRef]
  5. Duce, R.A.; LaRoche, J.; Altieri, K.; Arrigo, K.R.; Baker, A.R.; Capone, D.G.; Cornell, S.; Dentener, F.; Galloway, J.; Ganeshram, R.S.; et al. Impacts of atmospheric anthropogenic nitrogen on the open ocean. Science 2008, 320, 893–897. [Google Scholar] [CrossRef]
  6. Kim, I.N.; Lee, K.; Gruber, N.; Karl, D.M.; Bullister, J.L.; Yang, S.; Kim, T.W. Increasing anthropogenic nitrogen in the North Pacific Ocean. Science 2014, 346, 1102–1106. [Google Scholar] [CrossRef]
  7. Kim, T.W.; Lee, K.; Najjar, R.G.; Jeong, H.D.; Jeong, H.J. Increasing N abundance in the Northwestern Pacific Ocean due to atmospheric nitrogen deposition. Science 2011, 334, 505–509. [Google Scholar] [CrossRef]
  8. Doney, S.C.; Mahowald, N.; Lima, I.; Feely, R.A.; Mackenzie, F.T.; Lamarque, J.-F.; Rasch, P.J. Impact of anthropogenic atmospheric nitrogen and sulfur deposition on ocean acidification and the inorganic carbon system. Proc. Natl. Acad. Sci. USA 2007, 104, 14580–14585. [Google Scholar] [CrossRef] [Green Version]
  9. Baker, A.R.; Lesworth, T.; Adams, C.; Jickells, T.D.; Ganzeveld, L. Estimation of atmospheric nutrient inputs to the Atlantic Ocean from 50° N to 50° S based on large-scale field sampling: Fixed nitrogen and dry deposition of phosphorus. Glob. Biogeochem. Cycles 2010, 24, GB3006–GB3021. [Google Scholar] [CrossRef]
  10. Dentener, F.; Drevet, J.; Lamarque, J.F.; Bey, I.; Eickhout, B.; Fiore, A.M.; Hauglustaine, D.; Horowitz, L.W.; Krol, M.; Kulshrestha, U.C.; et al. Nitrogen and sulfur deposition on regional and global scales: A multimodel evaluation. Glob. Biogeochem. Cycles 2006, 20, GB4003–GB4023. [Google Scholar] [CrossRef]
  11. Okin, G.S.; Baker, A.R.; Tegen, I.; Mahowald, N.M.; Dentener, F.J.; Duce, R.A.; Galloway, J.N.; Hunter, K.; Kanakidou, M.; Kubilay, N.; et al. Impacts of atmospheric nutrient deposition on marine productivity: Roles of nitrogen, phosphorus, and iron. Glob. Biogeochem. Cycles 2011, 25, GB2022–GB2031. [Google Scholar] [CrossRef]
  12. Zhao, Y.; Zhang, L.; Pan, Y.; Wang, Y.; Paulot, F.; Henze, D.K. Atmospheric nitrogen deposition to the northwestern Pacific: Seasonal variation and source attribution. Atmos. Chem. Phys. 2015, 15, 10905–10924. [Google Scholar] [CrossRef]
  13. Nakamura, T.; Matsumoto, K.; Uematsu, M. Chemical characteristics of aerosols transported from Asia to the East China Sea: An evaluation of anthropogenic combined nitrogen deposition in autumn. Atmos. Environ. 2005, 39, 1749–1758. [Google Scholar] [CrossRef]
  14. Matsumoto, K.; Minami, H.; Uyama, Y.; Uematsu, M. Size partitioning of particulate inorganic nitrogen species between the fine and coarse mode ranges and its implication to their deposition on the surface ocean. Atmos. Environ. 2009, 43, 4259–4265. [Google Scholar] [CrossRef]
  15. Jung, J.; Furutani, H.; Uematsu, M. Atmospheric inorganic nitrogen in marine aerosol and precipitation and its deposition to the North and South Pacific Oceans. J. Atmos. Chem. 2012, 68, 157–181. [Google Scholar] [CrossRef]
  16. Jung, J.; Furutani, H.; Uematsu, M.; Kim, S.; Yoon, S. Atmospheric inorganic nitrogen input via dry, wet, and sea fog deposition to the subarctic western North Pacific Ocean. Atmos. Chem. Phys. 2013, 13, 411–428. [Google Scholar] [CrossRef] [Green Version]
  17. Luo, L.; Kao, S.-J.; Bao, H.; Xiao, H.; Xiao, H.; Yao, X.; Gao, H.; Li, J.; Lu, Y. Sources of reactive nitrogen in marine aerosol over the Northwest Pacific Ocean in spring. Atmos. Chem. Phys. 2018, 18, 6207–6222. [Google Scholar] [CrossRef] [Green Version]
  18. Prospero, J.M.; Barrett, K.; Church, T.; Dentener, F.; Duce, R.A.; Galloway, J.N.; Levy II, H.; Moody, J.; Quinn, P. Atmospheric deposition of nutrients to the North Atlantic Basin. Biogeochemistry 1996, 35, 27–73. [Google Scholar] [CrossRef]
  19. Spokes, L.J.; Yeatman, S.G.; Cornell, S.E.; Jickells, T.D. Nitrogen deposition to the eastern Atlantic Ocean. The importance of south-easterly flow. Tellus Ser. B 2000, 52, 37–49. [Google Scholar] [CrossRef] [Green Version]
  20. Baker, A.R.; Kelly, S.D.; Biswas, K.F.; Witt, M.; Jickells, T.D. Atmospheric deposition of nutrients to the Atlantic Ocean. Geophys. Res. Lett. 2003, 30, 2296–2299. [Google Scholar] [CrossRef]
  21. Baker, A.R.; Weston, K.; Kelly, S.D.; Voss, M.; Streu, P.; Cape, J.N. Dry and wet deposition of nutrients from the tropical Atlantic atmosphere: Links to primary productivity and nitrogen fixation. Deep Sea Res. Part I 2007, 54, 1704–1720. [Google Scholar] [CrossRef]
  22. Sandroni, V.; Raimbault, P.; Migon, C.; Garcia, N.; Gouze, E. Dry atmospheric deposition and diazotrophy as sources of new nitrogen to northwestern Mediterranean oligotrophic surface waters. Deep Sea Res. Part I 2007, 54, 1859–1870. [Google Scholar] [CrossRef]
  23. Loughner, C.P.; Tzortziou, M.; Shroder, S.; Pickering, K.E. Enhanced dry deposition of nitrogen pollution near coastlines: A case study covering the Chesapeake Bay estuary and Atlantic Ocean coastline. J. Geophys. Res. Atmos. 2016, 121, 14221–14238. [Google Scholar] [CrossRef]
  24. St-Laurent, P.; Friedrichs, M.A.M.; Najjar, R.G.; Martins, D.K.; Herrmann, M.; Miller, S.K.; Wilkin, J. Impacts of atmospheric nitrogen deposition on surface waters of the western North Atlantic mitigated by multiple feedbacks. J. Geophys. Res. Oceans 2017, 122, 8406–8426. [Google Scholar] [CrossRef]
  25. Gao, Y.; Arimoto, R.; Zhou, M.Y.; Merrill, J.T.; Duce, R.A. Relationships between the dust concentrations over eastern Asia and the remote North Pacific. J. Geophys. Res. 1992, 97, 9867–9872. [Google Scholar] [CrossRef]
  26. Uematsu, M.; Hattori, H.; Nakamura, T.; Narita, Y.; Jung, J.; Matsumoto, K.; Nakaguchi, Y.; Kumar, M.D. Atmospheric transport and deposition of anthropogenic substances from the Asia to the East China Sea. Mar. Chem. 2010, 120, 108–115. [Google Scholar] [CrossRef]
  27. Akimoto, H. Global Air Quality and Pollution. Science 2003, 302, 1716–1719. [Google Scholar] [CrossRef] [Green Version]
  28. Galloway, J.N.; Townsend, A.R.; Erisman, J.W.; Bekunda, M.; Cai, Z.; Freney, J.R.; Martinelli, L.A.; Seitzinger, S.P.; Sutton, M.A. Transformation of the nitrogen cycle: Recent trends, questions, and potential solutions. Science 2008, 320, 889–892. [Google Scholar] [CrossRef]
  29. Chen, H.-Y.; Huang, S.Z. Effects of atmospheric dry deposition on external nitrogen supply and new production in the northern South China Sea. Atmosphere 2018, 9, 386. [Google Scholar] [CrossRef]
  30. Cornell, S.E.; Jickells, T.D.; Cape, J.N.; Rowland, A.P.; Duce, R.A. Organic nitrogen deposition on land and coastal environments: A review of methods and data. Atmos. Environ. 2003, 37, 2173–2191. [Google Scholar] [CrossRef]
  31. Aneja, V.P.; Roelle, P.A.; Murray, G.C.; Southerland, J.; Erisman, J.W.; Fowler, D.; Asman, W.; Patni, N. Atmospheric nitrogen compounds II: Emissions, transport, transformation, deposition and assessment. Atmos. Environ. 2001, 35, 1903–1911. [Google Scholar] [CrossRef]
  32. Andreae, M.O.; Merlet, P. Emission of trace gases and aerosols from biomass burning. Glob. Biogeochem. Cycles 2001, 15, 955–966. [Google Scholar] [CrossRef] [Green Version]
  33. Jickells, T.D.; Kelly, S.D.; Baker, A.R.; Biswas, K.; Dennis, P.F.; Spokes, L.J.; Witt, M.; Yeatman, S.G. Isotopic evidence for a marine ammonia source. Geophys. Res. Lett. 2003, 30, 27-1–27-4. [Google Scholar] [CrossRef]
  34. Andreae, M.O.; Crutzen, P.J. Atmospheric aerosols: Biogeochemical sources and role in atmospheric chemistry. Science 1997, 276, 1052–1058. [Google Scholar] [CrossRef]
  35. Cape, J.N.; Cornell, S.E.; Jickells, T.D.; Nemitz, E. Organic nitrogen in the atmosphere—Where does it come from? A review of sources and methods. Atmos. Res. 2011, 102, 30–48. [Google Scholar] [CrossRef]
  36. Facchini, M.C.; Decesari, S.; Rinaldi, M.; Carbone, C.; Finessi, E.; Mircea, M.; Fuzzi, S.; Moretti, F.; Tagliavini, E.; Ceburnis, D.; et al. Important Source of Marine Secondary Organic Aerosol from Biogenic Amines. Environ. Sci. Technol. 2008, 42, 9116–9121. [Google Scholar] [CrossRef] [PubMed]
  37. Miyazaki, Y.; Kawamura, K.; Sawano, M. Size distributions of organic nitrogen and carbon in remote marine aerosols: Evidence of marine biological origin based on their isotopic ratios. Geophys. Res. Lett. 2010, 37, L06803–L06807. [Google Scholar] [CrossRef]
  38. Cornell, S.E. Atmospheric nitrogen deposition: Revisiting the question of the importance of the organic component. Environ. Pollut. 2011, 159, 2214–2222. [Google Scholar] [CrossRef] [PubMed]
  39. Nakamura, T.; Ogawa, H.; Maripi, D.K.; Uematsu, M. Contribution of water soluble organic nitrogen to total nitrogen in marine aerosols over the East China Sea and western North Pacific. Atmos. Environ. 2006, 40, 7259–7264. [Google Scholar] [CrossRef]
  40. Zhang, Q.; Anastasio, C.; Jimenez-Cruz, M. Water-soluble organic nitrogen in atmospheric fine particles (PM2.5) from northern California. J. Geophys. Res. 2002, 107, AAC 3-1–AAC 3-9. [Google Scholar] [CrossRef]
  41. Matsumoto, K.; Yamamoto, Y.; Nishizawa, K.; Kaneyasu, N.; Irino, T.; Yoshikawa-Inoue, H. Origin of the water-soluble organic nitrogen in the maritime aerosol. Atmos. Environ. 2017, 167, 97–103. [Google Scholar] [CrossRef]
  42. Jung, J.; Hong, S.-B.; Chen, M.; Hur, J.; Jiao, L.; Lee, Y.; Park, K.; Hahm, D.; Choi, J.-O.; Yang, E.J.; et al. Characteristics of biogenically-derived aerosols over the Amundsen Sea, Antarctica. Atmos. Chem. Phys. Discuss. 2019, 3. [Google Scholar] [CrossRef]
  43. Jung, J.; Furutani, H.; Uematsu, M.; Park, J. Distributions of atmospheric non-sea-salt sulfate and methanesulfonic acid over the Pacific Ocean between 48° N and 55° S during summer. Atmos. Environ. 2014, 99, 374–384. [Google Scholar] [CrossRef]
  44. Miyazaki, Y.; Kawamura, K.; Jung, J.; Furutani, H.; Uematsu, M. Latitudinal distributions of organic nitrogen and organic carbon in marine aerosols over the western North Pacific. Atmos. Chem. Phys. 2011, 11, 3037–3049. [Google Scholar] [CrossRef] [Green Version]
  45. Miyazaki, Y.; Fu, P.; Ono, K.; Tachibana, E.; Kawamura, K. Seasonal cycles of water-soluble organic nitrogen aerosols in a deciduous broadleaf forest in northern Japan. J. Geophys. Res. Atmos. 2014, 119, 1440–1454. [Google Scholar] [CrossRef] [Green Version]
  46. Stein, A.F.; Draxler, R.R.; Rolph, G.D.; Stunder, B.J.B.; Cohen, M.D.; Ngan, F. NOAA’s HYSPLIT atmospheric transport and dispersion modeling system. Bull. Amer. Meteor. Soc. 2015, 96, 2059–2077. [Google Scholar] [CrossRef]
  47. Zhang, G.; Zhang, J.; Liu, S. Characterization of nutrients in the atmospheric wet and dry deposition observed at the two monitoring sites over Yellow Sea and East China Sea. J. Atmos. Chem. 2007, 57, 41–57. [Google Scholar] [CrossRef]
  48. Altieri, K.E.; Hastings, M.G.; Gobel, A.R.; Peters, A.J.; Sigman, D.M. Isotopic composition of rainwater nitrate at Bermuda: The influence of air mass source and chemistry in the marine boundary layer. J. Geophys. Res. Atmos. 2013, 118, 11304–11316. [Google Scholar] [CrossRef]
  49. Lewis, J.M.; Koračin, D.; Redmond, K.T. Sea fog research in the United Kingdom and United States: A historical essay including outlook. Bull. Amer. Meteor. Soc. 2004, 85, 395–408. [Google Scholar] [CrossRef]
  50. Gultepe, I.; Tardif, R.; Michaelides, S.C.; Cermak, J.; Bott, A.; Bendix, J.; Müller, M.D.; Pagowski, M.; Hansen, B.; Ellrod, G.; et al. Fog Research: A review of past achievements and future perspectives. Pure Appl. Geophys. 2007, 164, 1121–1159. [Google Scholar] [CrossRef]
  51. Wang, B.-H. Distributions and variations of sea fog in the world. In Sea Fog; China Ocean Press: Beijing, China, 1985; pp. 51–90. [Google Scholar]
  52. Sasakawa, M.; Ooki, A.; Uematsu, M. Aerosol size distribution during sea fog and its scavenge process of chemical substances over the northwestern North Pacific. J. Geophys. Res. 2003, 108. [Google Scholar] [CrossRef]
  53. Jordan, C.E.; Talbot, R.W. Direct atmospheric deposition of water-soluble nitrogen to the Gulf of Maine. Glob. Biogeochem. Cycles 2000, 14, 1315–1329. [Google Scholar] [CrossRef]
  54. Matsumoto, K.; Uematsu, M. Free amino acids in marine aerosols over the western North Pacific Ocean. Atmos. Environ. 2005, 39, 2163–2170. [Google Scholar] [CrossRef]
  55. Neff, J.C.; Holland, E.A.; Dentener, F.J.; McDowell, W.H.; Russell, K.M. The origin, composition and rates of organic nitrogen deposition: A missing piece of the nitrogen cycle? Biogeochemistry 2002, 57, 99–136. [Google Scholar] [CrossRef]
  56. Cornell, S.; Mace, K.; Coeppicus, S.; Duce, R.; Huebert, B.; Jickells, T.; Zhuang, L.-Z. Organic nitrogen in Hawaiian rain and aerosol. J. Geophys. Res. 2001, 106, 7973–7983. [Google Scholar] [CrossRef]
  57. Zhang, Q.; Anastasio, C. Conversion of fogwater and aerosol organic nitrogen to ammonium, nitrate, and NOx during exposure to simulated sunlight and ozone. Environ. Sci. Technol. 2003, 37, 3522–3530. [Google Scholar] [CrossRef] [PubMed]
  58. Luo, L.; Yao, X.H.; Gao, H.W.; Hsu, S.C.; Li, J.W.; Kao, S.J. Nitrogen speciation in various types of aerosols in spring over the northwestern Pacific Ocean. Atmos. Chem. Phys. 2016, 16, 325–341. [Google Scholar] [CrossRef] [Green Version]
  59. Adams, P.J.; Seinfeld, J.H.; Koch, D.M. Global concentrations of tropospheric sulfate, nitrate, and ammonium aerosol simulated in a general circulation model. J. Geophys. Res. D Atmos. 1999, 104, 13791–13823. [Google Scholar] [CrossRef]
  60. Zhang, J.; Zhang, G.S.; Bi, Y.F.; Liu, S.M. Nitrogen species in rainwater and aerosols of the Yellow and East China seas: Effects of the East Asian monsoon and anthropogenic emissions and relevance for the NW Pacific Ocean. Glob. Biogeochem. Cycles 2011, 25, GB3020–GB3033. [Google Scholar] [CrossRef]
  61. Kundu, S.; Kawamura, K.; Lee, M. Seasonal variation of the concentrations of nitrogenous species and their nitrogen isotopic ratios in aerosols at Gosan, Jeju Island: Implications for atmospheric processing and source changes of aerosols. J. Geophys. Res. 2010, 115, D20305–D20323. [Google Scholar] [CrossRef]
  62. Redfield, A.C. The biological control of chemical factors in the environment. Am. Sci. 1958, 46, 205–221. [Google Scholar]
  63. Baker, A.R.; Jickells, T.D.; Biswas, K.F.; Weston, K.; French, M. Nutrients in atmospheric aerosol particles along the Atlantic Meridional Transect. Deep Sea Res. Part II 2006, 53, 1706–1719. [Google Scholar] [CrossRef]
  64. Harrison, P.J.; Boyd, P.W.; Varela, D.E.; Takeda, S.; Shiomoto, A.; Odate, T. Comparison of factors controlling phytoplankton productivity in the NE and NW subarctic Pacific gyres. Prog. Oceanogr. 1999, 43, 205–234. [Google Scholar] [CrossRef]
  65. Nishioka, J.; Ono, T.; Saito, H.; Sakaoka, K.; Yoshimura, T. Oceanic iron supply mechanisms which support the spring diatom bloom in the Oyashio region, western subarctic Pacific. J. Geophys. Res. Oceans 2011, 116, C02021–C02037. [Google Scholar]
  66. Nishioka, J.; Ono, T.; Saito, H.; Nakatsuka, T.; Takeda, S.; Yoshimura, T.; Suzuki, K.; Kuma, K.; Nakabayashi, S.; Tsumune, D.; et al. Iron supply to the western subarctic Pacific: Importance of iron export from the Sea of Okhotsk. J. Geophys. Res. 2007, 112, C10012–C10026. [Google Scholar] [CrossRef]
  67. Lam, P.J.; Bishop, J.K.B. The continental margin is a key source of iron to the HNLC North Pacific Ocean. Geophys. Res. Lett. 2008, 35, L07608–L07612. [Google Scholar] [CrossRef]
  68. Duce, R.A.; Tindale, N.W. Atmospheric transport of iron and its deposition in the ocean. Limnol. Oceanogr. 1991, 36, 1715–1726. [Google Scholar] [CrossRef]
  69. Moore, J.K.; Doney, S.C.; Glover, D.M.; Fung, I.Y. Iron cycling and nutrient-limitation patterns in surface waters of the World Ocean. Deep Sea Res. Part II 2002, 49, 463–507. [Google Scholar] [CrossRef]
  70. Mahowald, N.M.; Baker, A.R.; Bergametti, G.; Brooks, N.; Duce, R.A.; Jickells, T.D.; Kubilay, N.; Prospero, J.M.; Tegen, I. Atmospheric global dust cycle and iron inputs to the ocean. Glob. Biogeochem. Cycles 2005, 19, GB4025–GB4039. [Google Scholar] [CrossRef]
  71. Yoon, J.-E.; Kim, K.; Macdonald, A.M.; Park, K.-T.; Kim, H.-C.; Yoo, K.-C.; Yoon, H.-I.; Yang, E.J.; Jung, J.; Lim, J.-H.; et al. Spatial and temporal variabilities of spring Asian dust events and their impacts on chlorophyll-a concentrations in the western North Pacific Ocean. Geophys. Res. Lett. 2017, 44, 1474–1482. [Google Scholar] [CrossRef]
  72. Matsumoto, K.; Honda, M.C.; Sasaoka, K.; Wakita, M.; Kawakami, H.; Watanabe, S. Seasonal variability of primary production and phytoplankton biomass in the western Pacific subarctic gyre: Control by light availability within the mixed layer. J. Geophys. Res. Oceans 2014, 119, 6523–6534. [Google Scholar] [CrossRef]
  73. Glibert, P.M.; Garside, C.; Fuhrman, J.A.; Roman, M.R. Time-dependent coupling of inorganic and organic nitrogen uptake and regeneration in the plume of the Chesapeake Bay estuary and its regulation by large heterotrophs. Limnol. Oceanogr. 1991, 36, 895–909. [Google Scholar] [CrossRef]
  74. Bronk, D.A.; See, J.H.; Bradley, P.; Killberg, L. DON as a source of bioavailable nitrogen for phytoplankton. Biogeosciences 2007, 4, 283–296. [Google Scholar] [CrossRef] [Green Version]
  75. Wedyan, M.A.; Fandi, K.G.; Al-Rousan, S. Bioavailability of atmospheric dissolved organic nitrogen in the marine aerosol over the Gulf of Aqaba. Aust. J. Basic Appl. Sci. 2007, 1, 208–212. [Google Scholar]
  76. Wong, C.S.; Waser, N.; Nojiri, Y.; Whitney, F.A.; Page, J.S.; Zeng, J. Seasonal cycles of nutrients and dissolved inorganic carbon at high and mid latitudes in the North Pacific Ocean during the Skaugran cruises: Determination of new production and nutrient uptake ratios. Deep Sea Res. Part II 2002, 49, 5317–5338. [Google Scholar] [CrossRef]
  77. Han, Y.; Huiwang, G.; Xiaohong, Y.; Zifa, W. Simulating dry deposition fluxes of PM10 and particulate inorganic nitrogen over the eastern China seas during a severe Asian dust event using WRF-Chem model. J. Ocean Univ. China 2012, 11, 301–314. [Google Scholar]
Figure 1. Cruise track of the ARA07A cruise during 21 July−2 August 2016. White circles indicate aerosol sampling locations. Each aerosol sampling start point represents the end of the previous sampling period. The dotted line indicates that no aerosol sampling was conducted.
Atmosphere 10 00351 g001
Figure 2. Concentrations of (a) NH4+, (b) NO3, (c) water-soluble organic (WSON) in aerosols collected over the subarctic western North Pacific Ocean, and (d) the contribution of each N species against sample I.D. Solid circle lines in (ac) show the percentage of NH4+, NO3, and WSON in fine (D < 2.5 µm) aerosol particles. Stars in (c) indicate that WSON was not observed.
Atmosphere 10 00351 g002
Figure 3. The 168 h (7 days) air mass backward trajectories for starting altitude 500 (blue dots), 1000 (yellow dots), and 1500 m (purple dots) above ground level (a.g.l.) during the collection of aerosol samples calculated from the Global Data Assimilation System (GDAS) database of the National Ocean and Atmospheric Administration (NOAA) and simulated by using the Hybrid Single-Particle Lagrangian Integrated Trajectory (HY-SPLIT) model [46]. White circles and black line indicate aerosol sampling locations and cruise track, respectively.
Atmosphere 10 00351 g003
Figure 4. Temporal variations of meteorological variables (i.e., air temperature, sea surface temperature, dew point, and relative humidity) during the cruise. Yellow hatched area indicates the sampling duration of each aerosol sample.
Atmosphere 10 00351 g004
Figure 5. Variations of (a) dry deposition fluxes for NH4+, NO3, and WSON, and (b) the contribution of each N species to dry deposition flux over the subarctic western North Pacific Ocean during the cruise.
Atmosphere 10 00351 g005

