Autumn Cold Surge Paths over North China and the Associated Atmospheric Circulation

Key Laboratory of Meteorological Disaster of Ministry of Education (KLME), Collaborative Innovation Center on Forecast and Evaluation of Meteorological Disasters (CIC-FEMD), Joint International Research Laboratory of Climate and Environment Change (ILCEC), Nanjing University of Information Science and Technology, Nanjing 210044, China
*
Author to whom correspondence should be addressed.
Atmosphere 2019, 10(3), 134; https://doi.org/10.3390/atmos10030134
Submission received: 23 January 2019
/
Revised: 6 March 2019
/
Accepted: 7 March 2019
/
Published: 12 March 2019
(This article belongs to the Special Issue Weather and Climate Extremes: Current Developments)
Abstract
:Using the Hybrid Single-Particle Lagrangian Integrated Trajectory (HYSPLIT) model, we tracked the paths of 46 autumn cold surges affecting North China from 1961 to 2014, and classified them by clustering analysis, thereby investigating their changes and associated atmospheric circulation evolution. Our results indicate that autumn cold surges affecting North China can be classified into three types according to their paths: the north type, west type, and northwest type, with occurrences of 12, 16, and 18 respectively. Different types of cold surges have different atmospheric circulation characteristics. The north type is associated with a blocking type of atmospheric circulation pattern, with an enhanced stretching northeast ridge over the Ural Mountains and a transverse trough over Lake Baikal. However, the northwest type is characterized by a ridge–trough–ridge wave-train pattern that is located over the Barents Sea, West Siberian Plain, and Sakhalin Island, respectively. The west-type cold surge is related to a conversion type: a blocking system over the Ural Mountains forms four days before the cold surge occurrence, after which it becomes a wave-train type. The atmospheric signals detected prior to the occurrences of the three types of cold surges are also explored. The main signal of the north-path cold surges is that the energy propagates eastward from the Azores Islands to the Ural Mountains, and then forms a blocking high over the Urals. However, for the northwest-path cold surges, there is a weak trough over the Ural Mountains that gradually strengthens because the blocking high collapses over the Norwegian Sea. The key signal of the formation of the west-path cold surges is a blocking high over the Norwegian Sea’s continuous enhancement and extension to Novaya Zemlya, which results in a transmission of energy to the Ural Mountains and leads to the formation of a blocking system over here. When the above-mentioned different types of atmospheric circulation characteristics appear, the type of cold surge path and its impact area can be potentially forecasted in advance, which may reduce the losses that result from cold surges.
1. Introduction
North China is a political, economic, and cultural center of China. The wide-ranging abrupt temperature drops, strong winds, and sleety weather caused by cold surges usually lead to a variety of serious meteorological disasters. Most of the previous studies have focused on cold surges in winter (from December to February) or extended winter (from November to March) [1,2], because these cold surges are the strongest and most influential. However, many studies have found that autumn is the season with the highest frequency of cold surges in Northern China [3,4]. The frequent cold surges in autumn will exert serious effects on agricultural production, transportation, electricity, and people’s health, as well as lead to dramatic economic losses [5,6,7]. Thus, study on the cold surges in autumn may provide more important information for disaster prevention and relief.
In recent years, research on cold surges has mostly focused on their interannual or interdecadal changes in frequency [3,8,9,10]. It is generally believed that the occurrences of cold surges in northern China have declined significantly as a result of global warming. Some studies have indicated that the Siberian High (SH) has a direct effect on the activities of East Asian winter monsoons and cold surges across China [3,11,12,13]. Furthermore, Arctic Oscillation (AO) is also an important factor affecting cold surges in East Asia. The negative phase of AO is capable of providing circulation conditions that are favorable to the cold surge occurrences [2,14,15,16,17,18,19,20]. According to the results of Park et al. [14,15], extended winter (November–March) cold surges in East Asia can be divided into two types, the blocking type and wave-train type, on the basis of their dynamic origins. It has been found that blocking-type cold surges mostly occur during the AO negative phase, but the wave-train type cold surge shows no preference for positive or negative AO [20]. Therefore, a study to investigate the classification of cold surges is needed. Considering that the paths of cold surges depend on their atmospheric circulation characteristics, classifying cold surges by their paths can provide a better understanding of their changes. Meanwhile, there are regional differences in the frequency and intensity of cold surges; these differences are not only associated with the cold air intensity, but also closely related to the cold air paths. However, there are few studies on cold surge paths in North China. Hence, a further study on it is necessary and helpful to better understand the processes linked to cold surges and thus improve their forecasting.
Tao [21] and Ding [22] found that the cold air invading China usually originated from three regions along four paths. In the last century, paths of the Siberian High have been often selected as a means to investigate the cold surge paths in many case studies [22,23]. However, it is hard to rely on the path for a detailed classification scheme, because it is a single and huge atmospheric system. Thus, applying more objective methods to track cold surge paths is necessary for us. In recent years, three-dimensional (3D) trajectory methods, such as the Flexible Particle (FLEXPART) and Hybrid Single-Particle Lagrangian Integrated Trajectory (HYSPLIT) models, have been developed [20,24,25,26,27]. The FLEXPART model was utilized by Park et al. [20] and Tang and Zeng [28] to investigate cold air paths over East Asia. Walsh et al. [29] employed a back-tracking method to track severe cold air paths that affected the eastern United States and Northwest Europe. Sun et al. [30] and Wang et al. [31] used a 3D wind speed trajectory inverse method to investigate the severe cold air paths invading northwest and northeast China. The 3D trajectory method has been proved to be a good tool for tracking cold air paths, because these paths contain not only information on the horizontal position, but also on the vertical position, and with higher accuracy. Therefore, this method can be used to acquire knowledge of the complete motion track of a cold air mass.
Few analyses have been conducted on the changes in autumn cold surge paths and their associated atmospheric circulations. This study investigates both of these topics. Autumn ranges from October to November in our study; we found that the North China cold surge rarely happens in September: it only twice occurred in this month from 1961 to 2014, so we excluded September. The data and methods are introduced in Section 2 of this paper. In Section 3, autumn cold surge events are defined. Then, details are provided for the HYSPLIT model, which was adopted in this study to track the paths of autumn cold surges in North China from 1961 to 2014. Then, the classification of cold surges using cluster analysis is reported, and the evolution of their atmospheric circulations is explored in the end. Conclusions and discussions are provided in Section 4 of this paper.
2. Data and Methods
2.1. Data
The data used in this analysis are as follows: (1) the daily minimum air temperature data from 72 stations in North China, including Beijing, Tianjin, Shandong, Shanxi, Henan, and Hebei provinces (Figure 1), provided by the National Meteorological Center of China Meteorological Administration (CMA); (2) daily and monthly reanalysis datasets from the National Centers for Environmental Prediction (NCEP)/National Center for Atmospheric Research (NCAR), including sea level pressure (SLP), surface temperature, zonal and meridional winds, geopotential height, and air temperature, were analyzed to provide a synoptic and dynamical characterization of cold surges with a horizontal resolution of 2.5° longitude by 2.5° latitude [32]; (3) six hourly reanalyses from NCEP/NCAR were selected for cold surge path tracking, including 3D winds, temperatures, geopotential heights, and surface pressure [32], with a horizontal resolution of 2.5° longitude by 2.5° latitude. All of the data are from the period between 1961–2014. The climatological mean used in the study is the average of the values from 1981 to 2010.
2.2. Definition of Cold Surges
According to the Chinese national standard for cold surge grades (GB/T 21987-2008) [33], a single-station cold surge event is identified by the following thresholds: (1) the minimum daily air temperature is below 4 °C; and (2) the minimum daily air temperature drops by at least 8 °C within 24 h, at least 10 °C within 48 h, or at least 12 °C within 72 h. A regional cold surge event is defined when more than 40% of the stations in the region meet the threshold of a single-station cold surge.
2.3. Stationery Wave Action Flux
In order to clearly understand the development and propagation of the stationary wave before the occurrence of cold surge, the 3D wave activity flux proposed by Plumb [26] was utilized in this study to figure out the stationary wave activity flux Fs on a 300-hPa isobaric surface:
In Equation (1), refers to the air pressure value; ; are latitude and altitude, respectively; are the stationary disturbances’ zonal wind, meridional wind, geopotential height, and temperature, respectively; are the angular velocity of rotation and the average radius of the earth; where as the static stability, and the caret indicates the areal average over the average north of 20° N. (= 8000 m) is the constant scale height, and (= 287/1004 JK−1 kg−1) is the ratio of the gas constant to the specific heat at constant pressure.
2.4. Tracking Method for Cold Surge Path
The HYSPLIT model [27,34], based on the Lagrangian algorithm, was adopted to track cold surge paths in this study. Starting from a station at which the daily minimum temperature dropped the most in the study region within one day, the path was backtracked for several days. This model assumes that a particle moving along with the wind field and its trajectory is equal to an integral of the particle spatially and temporally. Moreover, the velocity vectors are linearly interpolated in both space and time. As assumed, a cold air mass can be substituted by a particle; therefore, the particle trajectory can replace the path of a cold air mass [20,35]. The advection of a particle is computed from the average of the three-dimensional velocity vector for the initial position and the first-guessed position [36].
The first-guessed position is:
and the final position is:
Furthermore, the integration time step (∆t) can vary during the simulation. It is computed from the requirement that the advection distance per time step should be less than the grid spacing. The maximum transport velocity Umax is determined by the maximum particle transport speed during the previous hour. The time step can vary from 1 min to 1 h, and is computed using the following equation:
The performance of the HYSPLIT model for tracking the cold surge path should be evaluated before it is used to track all paths of cold surge events. Figure 2 shows the horizontal view of eight cold air paths (random selection) tracked by the HYSPLIT model. In this figure, the dashed lines track the center points of surface temperature drops as determined every 24 h for the six days preceding autumn cold surges in North China. The times of occurrence of these eight cold waves are 16 October 1964; 30 November 1966; 27 November 1968; 13 November 1970; 10 November 1979; 20 November 1990; 17 November 1997; and 6 November 2000. It was found that these cold surge paths tracked by the HYSPLIT model coincide with the moving tracks of surface temperature drop centrodes, indicating that the HYSPLIT model has a good performance in tracking cold surge paths. Thus, the HYSPLIT model was used to track cold surge paths in this study.
2.5. Clustering Method
Here we use Ward variance minimization algorithm and K-means clustering algorithm to cluster the trajectories.
Ward variance minimization algorithm [37]: First, divide the N samples into n categories, and then narrow down one class at a time; the sum of the squares of the dispersions will increase, and choose the two types of combinations that minimize the variance until all the samples are classified into one class.
K-means clustering algorithm [38]: (1) Place new K trajectories into the space represented by the objects that are being clustered. These trajectories represent initial group centroid tracks; (2) Assign each object to the group that has the closest centroid track; (3) When all the objects have been assigned, recalculate the positions of the K centroid tracks; (4) Repeat steps 2 and 3 until the centroids no longer move. After finishing these steps, it will produce a separation of the objects into groups from which the metric to be minimized can be calculated.
In our study, as the first step, we used the Ward variance minimization algorithm to cluster the trajectories. This method divides the trajectories into G categories, and G mean trajectories are obtained by synthetic analysis. We let these G trajectories be the K-means’ initial group centroid tracks. Then, we used the K-means clustering algorithm to cluster once again.
3. Results
3.1. Spatial–Temporal Variation in Autumn Cold Surge Frequency in North China
According to the definition of a single-station cold surge, the climatological mean occurrences of autumn cold surges in North China are shown in Figure 3. It can be observed that autumn cold surges have occurred frequently in the north of the Taihang and Yanshan Mountains, about twice or more per year, especially in the Zhangbei and Youyu stations, with occurrences of up to 3.8 times per year. In the North China Plain, cold surge occurrences are typically less than once every year because of the barrier formed by these mountains. An exception is found in the middle and western regions of Shandong.
From 54 years of data, we calculated 1.28 events to be the annual occurrence of autumn cold surges in North China. It was also found that there was a significant decrease in the cold surge occurrences, and an interdecadal shift occurred in the time series in the mid–late 1990s (Figure 4). The result of the Mann–Kendall test (figure not shown) shows that this interdecadal decrease is statistically significant at the 0.05 confidence level. These findings are different from previous studies’ conclusions that winter cold surges in northern China have significantly decreased since the 1980s [3,39], indicating seasonable discrepancies between the autumn and winter cold surges’ occurrences.
3.2. Autumn Cold Surge Paths in North China
According to the definition of a regional cold surge, 46 regional cold surges occurred in autumn in North China from 1961 to 2014. For all of these cold surges, their six-day paths leading up to their occurrences were tracked by the HYSPLIT model (Figure 5). When the cold air passes by the key cold surge region (70–90° E, 43–65° N) in central Siberia, as defined by National Meteorological Center of CMA [40], it has accumulated intensively because of the topographic barrier. Then, it invades China along different paths. Typically, it takes three to four days for the cold air to move southward from the key area to North China. In this regard, clustering analysis was performed in this study for the path of the period within three days prior to the cold surge’s occurrence, and three types of paths were discovered (Figure 5). First, there is the west path (frequency = 16), whereby the cold air reaches China after passing by North Xinjiang (north of the Tianshan Mountains) and moves eastward and eventually invades North China via Qinghai, Gansu, Ningxia, and Shanxi provinces. The second is the northwest path (frequency = 18). In this case, the cold air reaches Mongolia via the Sayan Mountains from the east to the Altai Mountains, and then it moves in a southeastern direction to Central Mongolia before entering China and finally invading North China from North Shanxi and Northwest Hebei. The third one is the north path (frequency = 12): the cold air moves southeastward via Lake Baikal, passes by the east of the Mongolian Plateau, and then moves southward to reach East Inner Mongolia and subsequently invade North China.
As shown in Figure 5, the cold air of autumn cold surges invading North China are primarily from three regions, namely, the Kara Sea, the Barents Sea, and the area near the Norwegian Sea and the Scandinavian Peninsula. The west path of cold air mainly originates from the Norwegian Sea and the Scandinavian Peninsula, with a small part sourced from the Barents Sea and a tiny minority intensified after meeting the cold air moving southward from the Kara Sea, thus further invading China. The cold air of the northwestern path is mainly derived from the Barents Sea and the Kara Sea. Finally, the cold air of the north path is from the Kara Sea in most cases.
Figure 6 depicts the variability in autumn cold surges in North China for the three path types. The occurrences of autumn cold surges have decreased since the 2000s, and the occurrences of northwest-path cold surges reduced from five in the 1990s to one in the 2000s, while the occurrences of north and west path cold surges remained unchanged between the two decades. What causes the northwest-path cold surges to decrease significantly? This question needs to be further studied, and as a first step, it is necessary to investigate the formation of cold surges in different paths.
3.3. Evolution of Atmospheric Circulation for Three Types of Autumn Cold Surges
The cold air of the autumn cold surges that have affected North China is from three different types of paths. What was the evolution of their atmospheric circulation before they invaded North China? We used a composite analysis to investigate their evolution.
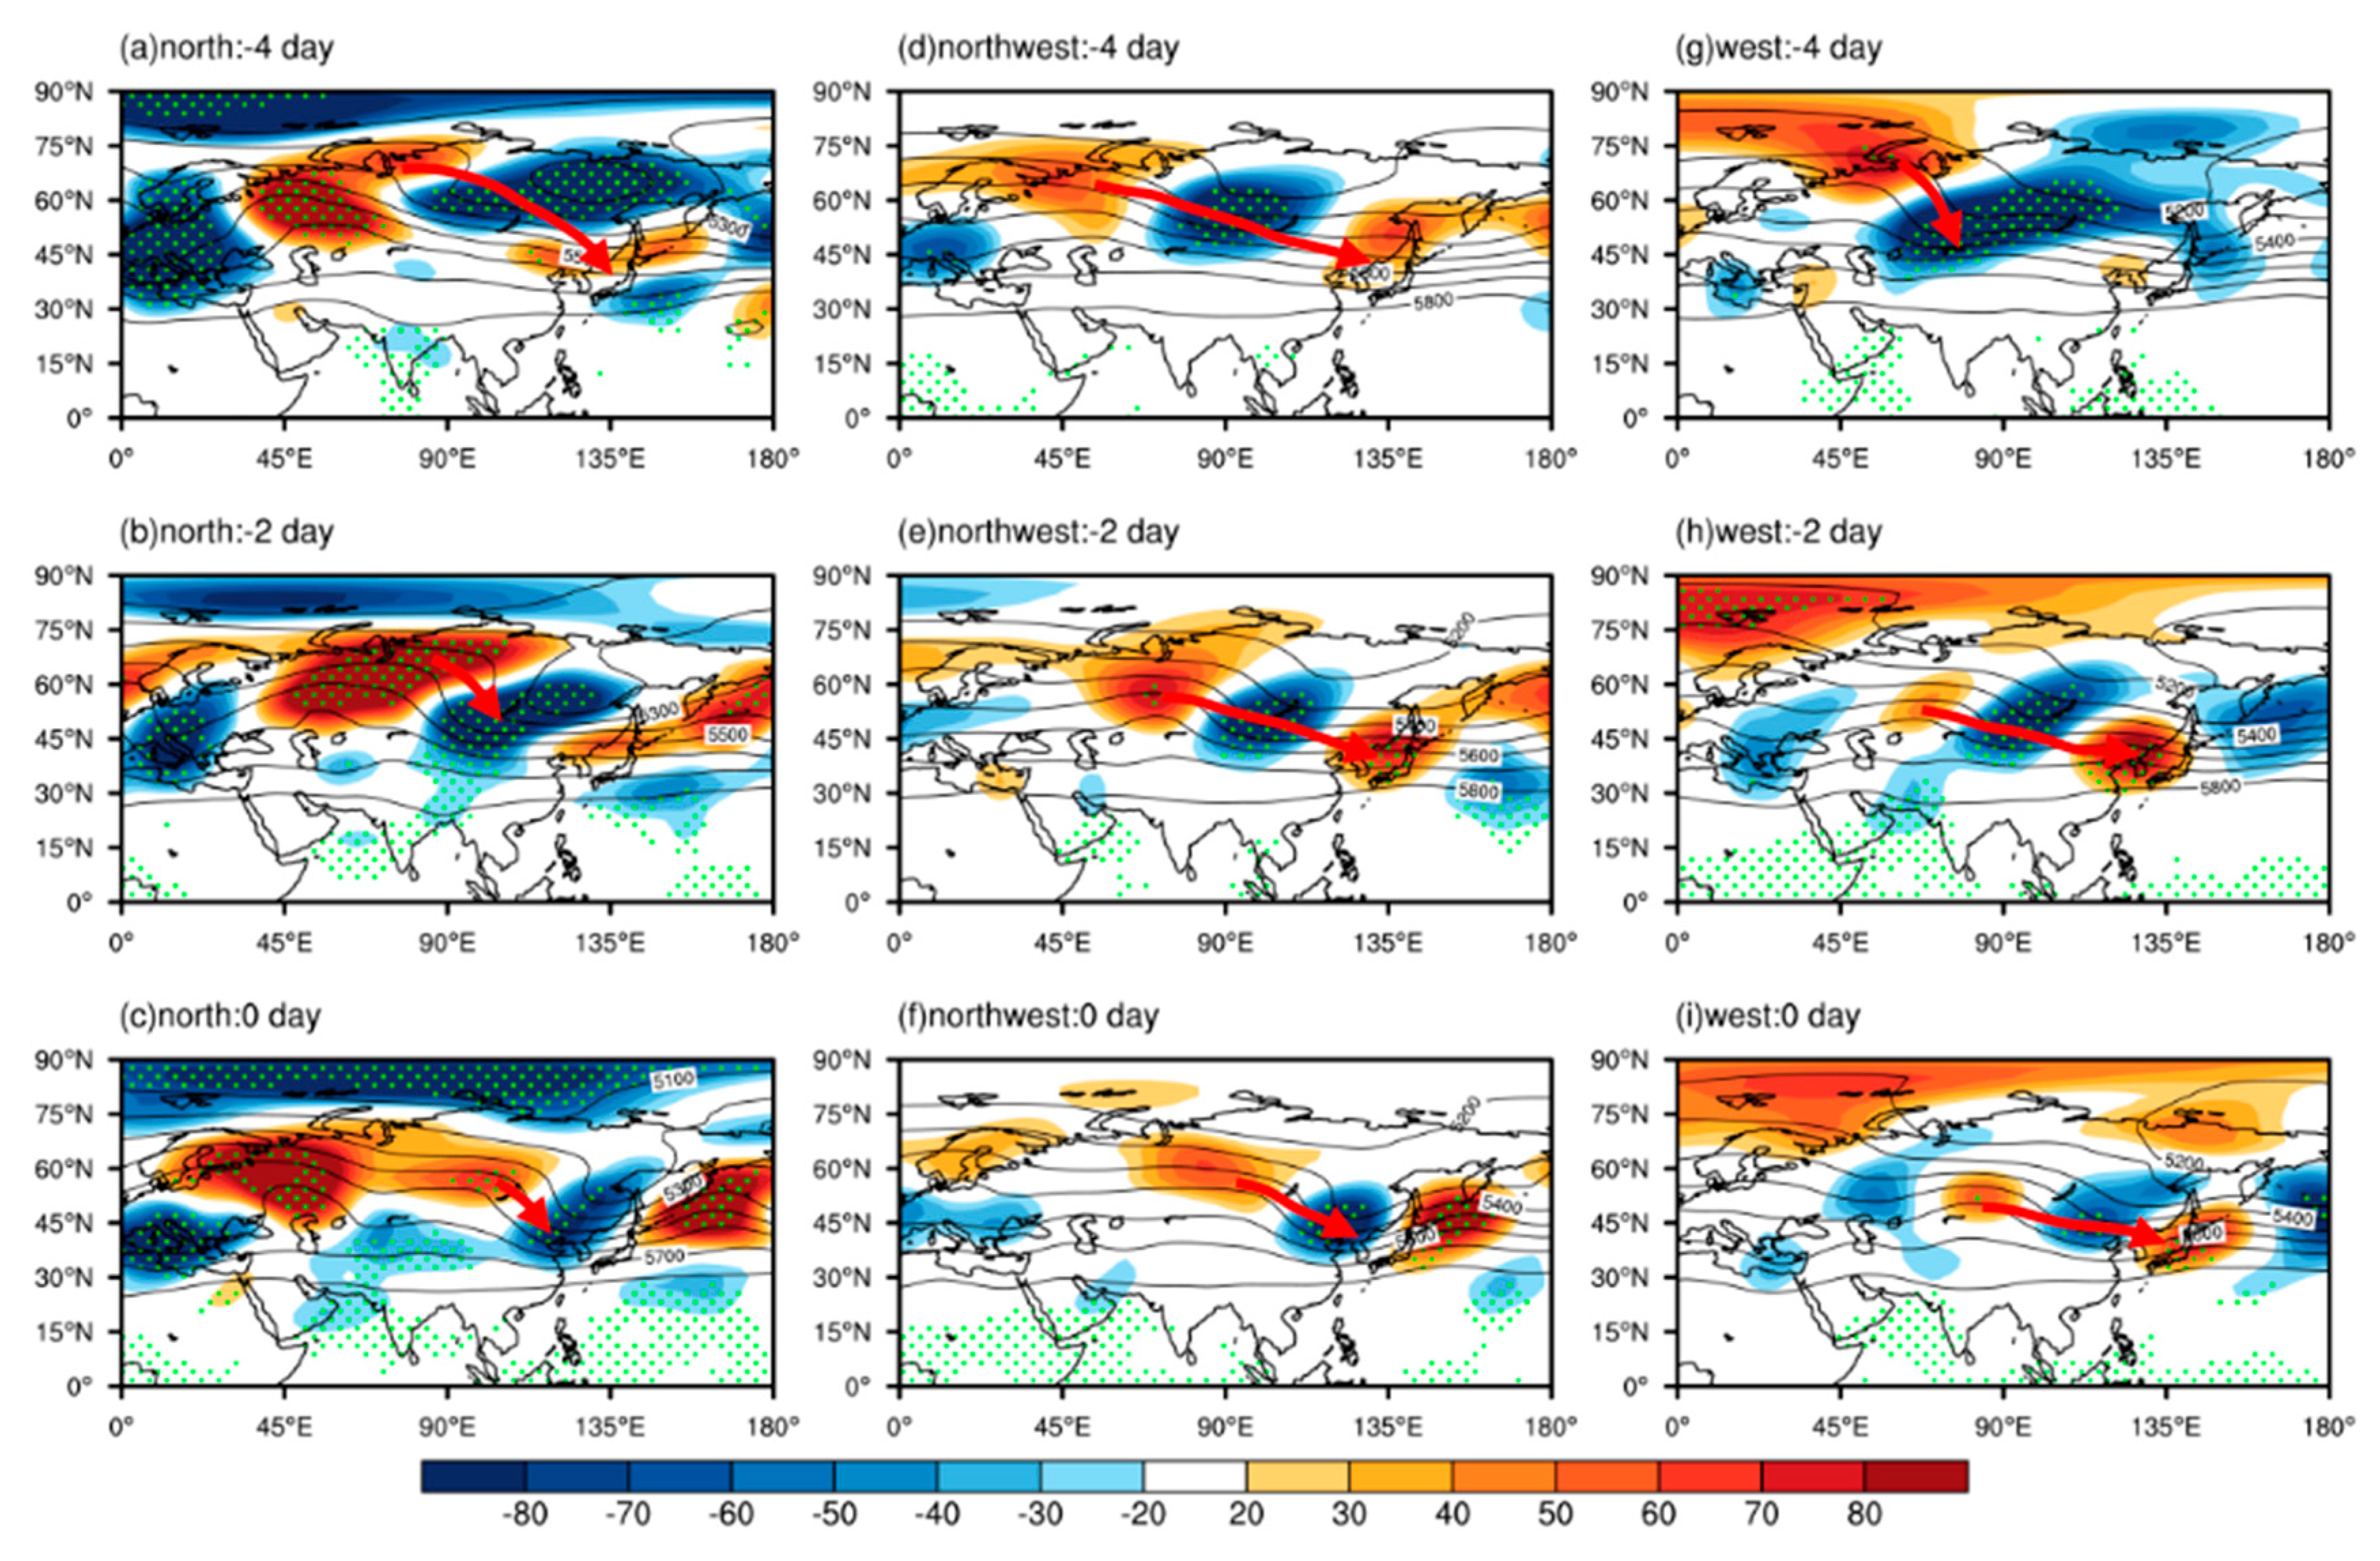
The 500-hPa geopotential heights (GPH) and SLP anomalies of the three types of cold surges within four days prior to the occurrence (day −4 to day 0) are shown in Figure 7 and Figure 8. For the north type of cold surge, the associated circulation is a blocking type. A blocking high extends from the Ural Mountains to the northeast, and a distinct transverse trough is formed over northern Lake Baikal (Figure 7a). The SH starts to establish in the North Siberian Plain (Figure 8a), and prefrontal warming causes cyclonic circulation over Lake Baikal. This condition is conducive to the movement of a cold air mass from the nearby Kara Sea to the Eurasia continent, and then its accumulation at Lake Baikal. At day −2 (Figure 7b), the blocking high gradually collapses, the transverse trough becomes longitudinal at day 0 (Figure 7c), and the SH expands southward (Figure 8c), causing cold air to erupt southward into the Mongolian plateau via Lake Baikal, after which it finally invades North China.
For the northwest type, a weak trough appears north of the Altai Mountains and the ridge–trough–ridge wave-train pattern can be found over the Barents Sea, West Siberian Plain, and Sakhalin Island, followed by the cold air from the Barents Sea propagating toward the southeast to the West Siberian Plain (Figure 7d). At day −2 (Figure 7e), the cold trough over the West Siberian Plain is enhanced and moves to Lake Baikal. Warm air carried by the southerly air in front of the trough forms a cyclonic flow on the Mongolian Plateau, thereby causing the SH to extend into this area and forcing cold air to move from the Barents Sea to the Mongolian Plateau via the Altai Mountains (Figure 8e). As the entire system moves eastward, the cold air invades North China.
For the west type of cold surge (Figure 7g), a blocking high over the Ural Mountains is anomalously oriented northward, while a tilted trough extending to Lake Balkhash is established. Thus, a blocking system is established in the southeast of the Ural Mountains. The SH is strengthened above the Ural Mountains, and the cyclonic circulation in front of the tilted trough is formed over Lake Balkhash (Figure 8g). Cold air moves from the Barents Sea and the Scandinavian Peninsula to Lake Balkhash, and then accumulates. At day −2 (Figure 7h), the tilted trough becomes longitudinal and moves to the Altai Mountains. The blocking system turns into a zonal ridge–trough–ridge wave-train type over northwestern Lake Balkhash, the Altai Mountains, and the Korean Peninsula. This system is located more southward than the northwest-type system, which is conducive to cold air moving from Lake Balkhash to North China.
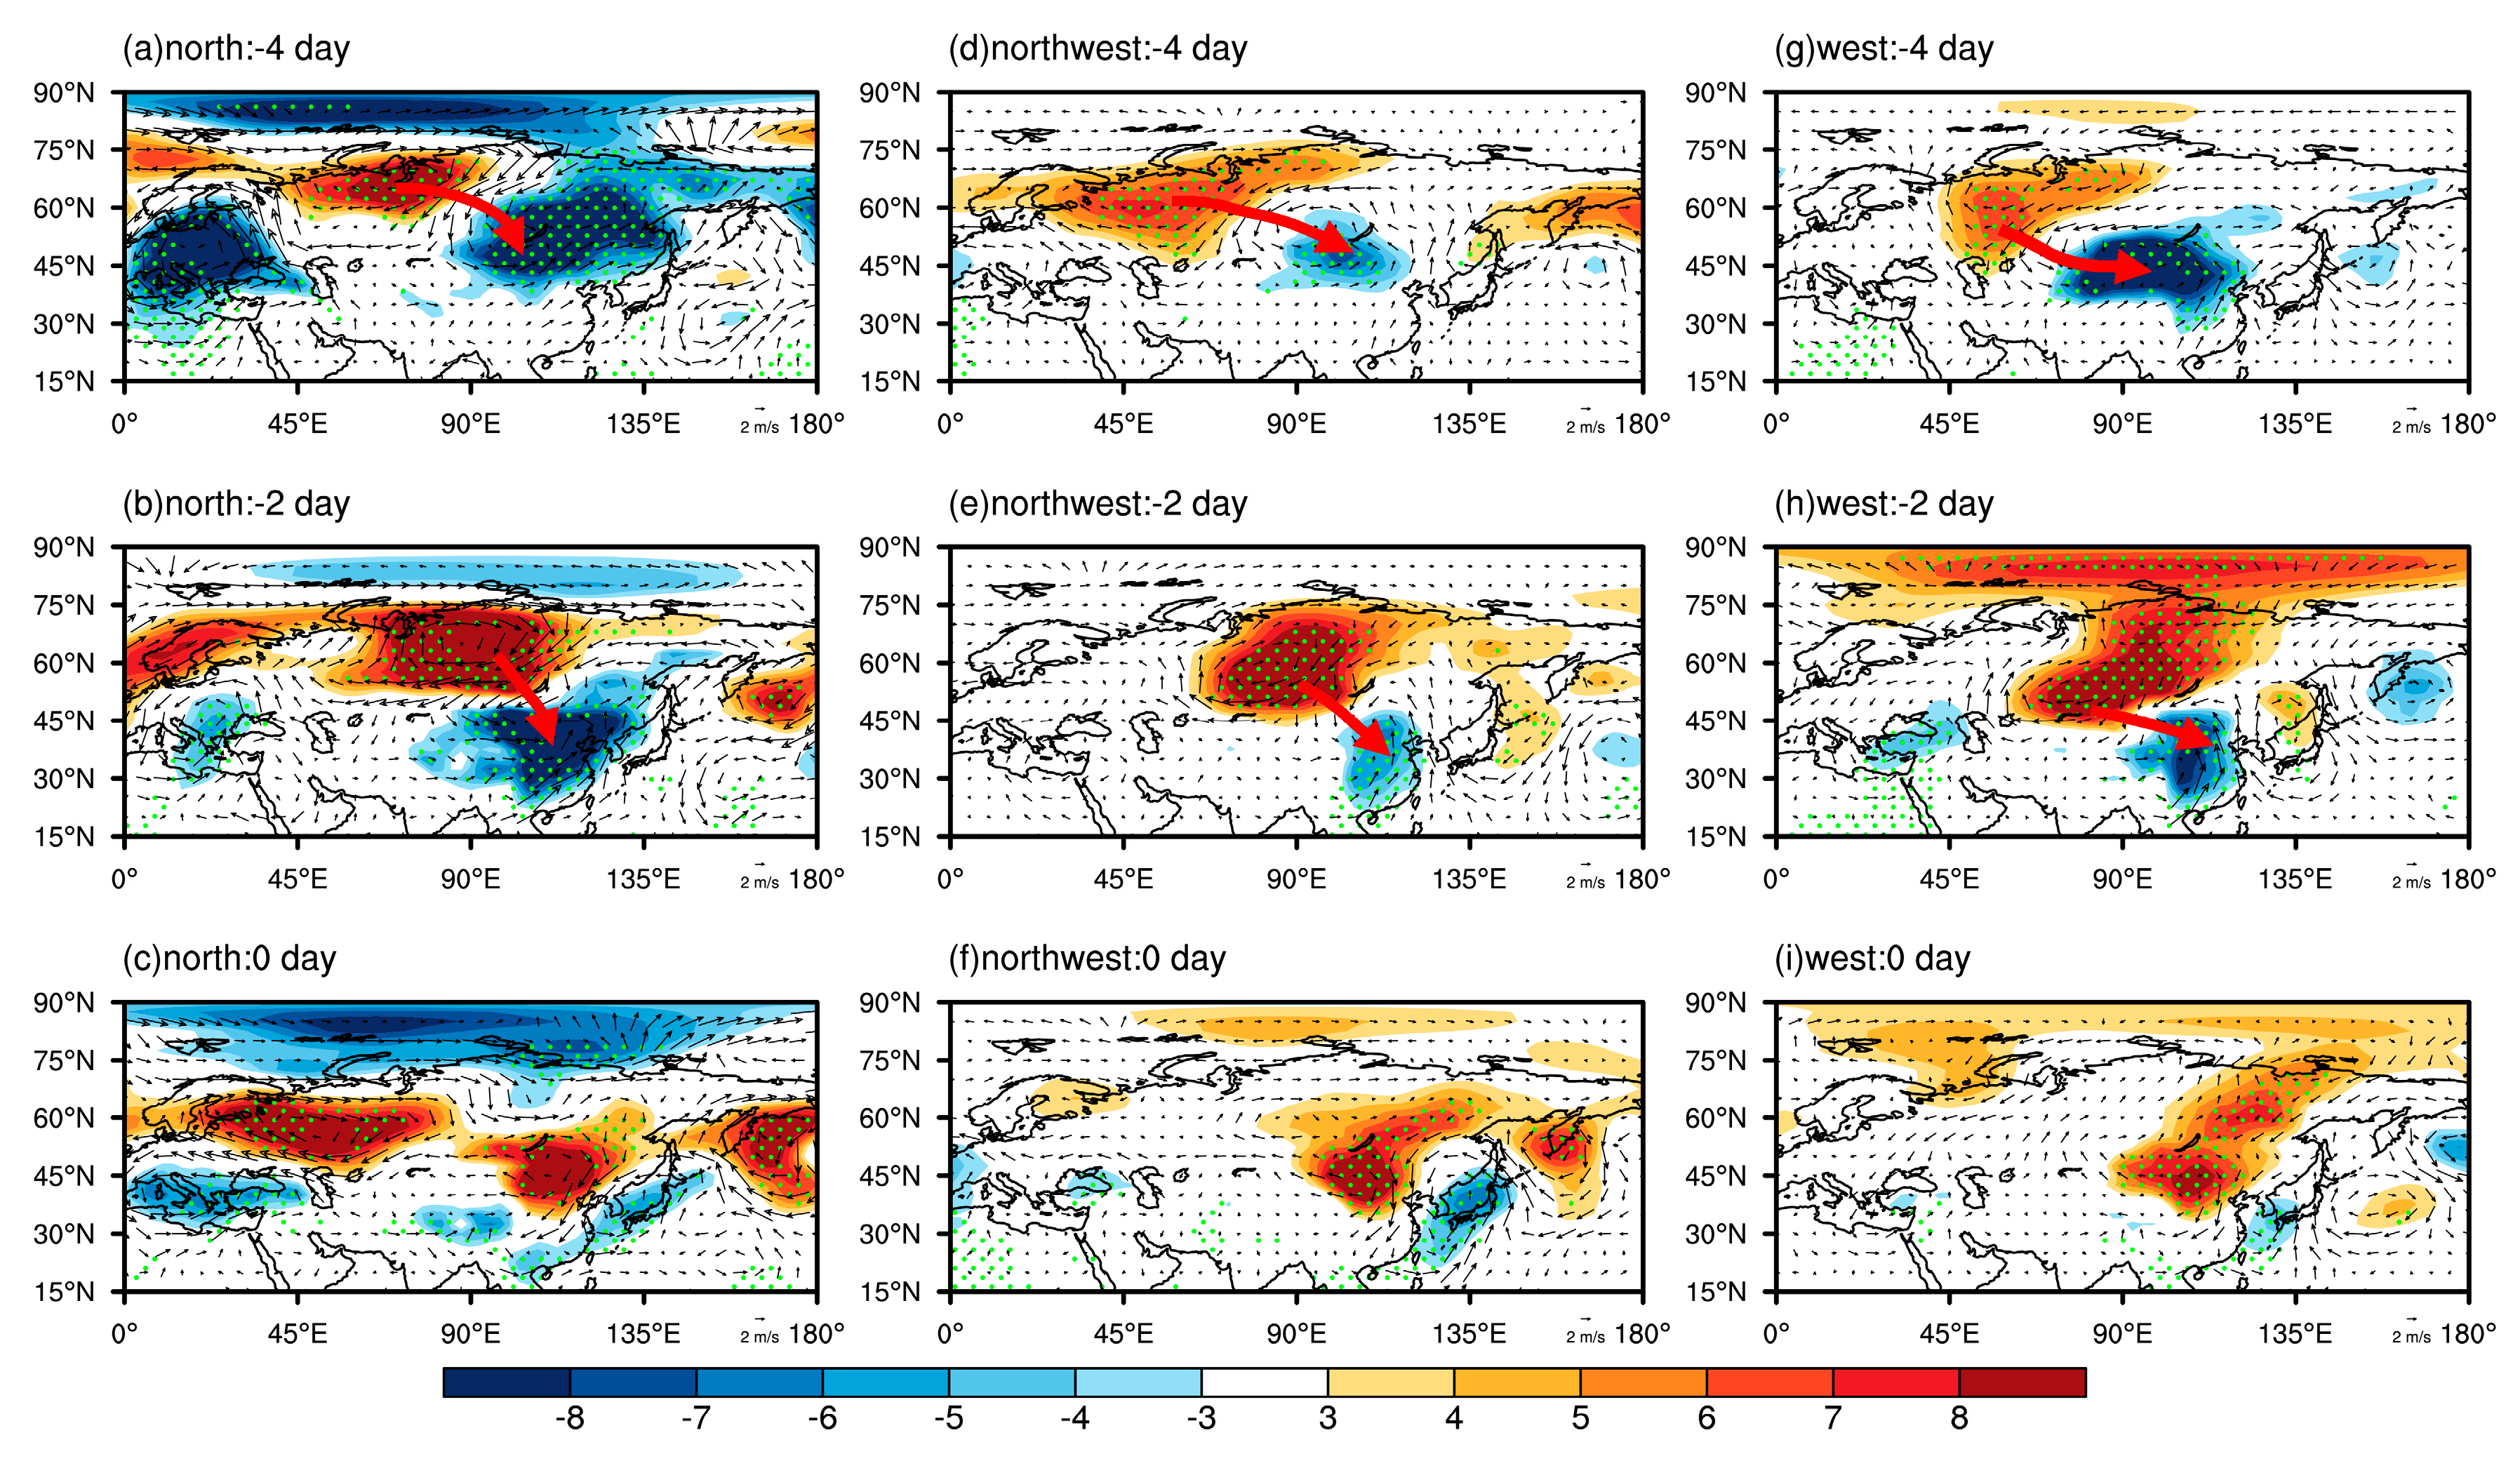
In order to explore the formation processes of the cold surges in the different paths, we analyzed the dynamic signals that appeared prior to the occurrences of the three types of cold surges. Furthermore, this procedure and the resulting information can improve cold surge path forecasting. Considering that the characteristics of atmospheric circulation in the four days preceding the occurrence of a cold surge are not enough to determine the formation processes, wave action flux analysis was performed in this study to explore the kinetic features over the two weeks leading up to cold surge occurrence.
Figure 9, Figure 10 and Figure 11 show the early formation processes of the three types of cold surges. For the north type, our focus is on how the blocking system in northern Lake Baikal is formed. From day −14 to day −10 (Figure 9a–c), GPH anomalies of the upper troposphere lead to the formation of a trough–ridge–trough wave train from the Azores Islands to the west of the Ural Mountains; the perturbation grows, while its position is basically stationary. The energy propagates eastward to the downstream, and results in positive GPH anomalies over the east of the Ural Mountains at day −10. Then, the positive perturbation moves eastward to Lake Baikal, the wave energy propagates to the northeast, and this strengthens the Arctic polar vortex, which gradually moves southward. At day −6, as a result of the continuous transmission of energy, a high ridge over the Ural Mountains strengthens rapidly, extends to the northeast, and forms a transverse trough coordinate with the Arctic polar vortex. Thus, the blocking system forms over northern Lake Baikal.
For the northwest type, the emphasis is on the formation of Eurasian wave trains. From day −14 to day −8 (Figure 11a–d), a blocking high is established over the Norwegian Sea. Additionally, it can be observed from the wave action flux that the wave propagates from the blocking high downstream to the Ural Mountains at day −10 (Figure 10c). For this reason, the negative anomaly perturbation on the Ural Mountains becomes strong and arrives at the east side of the Ural Mountains at day −8 (Figure 10d). At day −6 (Figure 10e), the blocking high over the Norwegian Sea collapses, leading to cold air southward and causing the perturbation to propagate toward the Ural Mountains. In this case, the positive anomaly perturbation moves downward to the south and reaches Eurasia, where the ridge–trough–ridge wave train forms.
Compared with the north type, the blocking system of the west type is located above the Ural Mountains, and its formation process is completely different. From day −14 to day −10 (Figure 11a–c), a weak high ridge is maintained in the Norwegian Sea, and transmits energy to the Ural Mountains, which deepens the trough. At day −8 (Figure 11d), as a result of the continuous transmission of energy from the mid-latitude Atlantic Ocean to the Norwegian Sea, the high ridge strengthens to form a blocking high over the Barents Sea, leading to the cold air moving toward the Ural Mountains. Then, the cold trough strengthens. The blocking system forms at day −6 (Figure 11e). The energy source is interrupted, thereby causing the blocking high to gradually collapse, and the cold air bursts into Lake Balkhash. As a result of the eastward shift of the tilted trough in the north of Balkhash, the blocking type is converted to the wave-train type.
In summary, two weeks before the occurrence of a north cold surge, a trough–ridge–trough wave train forms from the Azores Islands to the west of the Ural Mountains. Then, the wave train stimulates two high ridges, one after another, over the Urals, forcing the polar vortex to move southward. Meanwhile, the latter high ridge is continuously strengthened, extends to the northeast, and forms a blocking high. However, the northwest cold surge develops because the blocking high collapses over the Norwegian Sea. There is a weak trough in the Ural Mountains that is gradually strengthened by the collapse of the blocking high. The atmospheric circulation presents a wave-train pattern with an orientation from the Barents Sea to Sakhalin Island. The key to the formation of the west cold surge lies in the emergence of a blocking situation in the Ural Mountains. The blocking high over the Norwegian Sea is constantly enhanced and moves to the Barents Sea and Novaya Zemlya, and it continues to transmit energy to the Ural Mountains to deepen the cold trough. A blocking situation is formed in the Ural Mountains. With the collapse of the blocking high, the cold air bursts into Lake Balkhash. As a result of the eastward shift of the tilted trough in the north part of Lake Balkhash, the blocking type is converted into a wave-train type, and the cold air moves eastward from Lake Balkhash to North China.
4. Conclusions and Discussions
In this study, we investigated the autumn cold surge paths and their associated atmospheric circulation evolution. Using the HYSPLIT model to track the paths of 46 autumn cold surge events affecting North China from 1961 to 2014, we classified the cold surges into three types, i.e., the north type, west type, and northwest type, with occurrences of 12, 16, and 18, respectively.
Our results indicate that the north-path cold surge is associated with a blocking type of atmospheric circulation, so its main characteristic is the formation of an abnormally enhanced blocking high and a transverse trough over the north of Lake Baikal four days before the cold surge occurrence. The northwest-path cold surge is linked to a wave-train type, for which a ridge–trough–ridge wave-train pattern appears over the Barents Sea, West Siberian Plain, and Sakhalin Island at day −4. The west-path cold surge is connected to a conversion type, whereby a blocking system over the Ural Mountains forms at day −4, and then transforms into a wave-train type.
The atmospheric signals that appear prior to the occurrences of the three types of cold surges were also explored in this study. The main signal of the north-path cold surge is a trough–ridge–trough wave train that forms over the Azores Islands, Ireland Island, and the west of the Ural Mountains two weeks before the occurrence of the cold surge. Then, this wave-train energy propagates eastward, where it forms two high ridges, one after another, over the Urals. However, for the northwest-path cold surge, there is a weak trough over the Ural Mountains that gradually strengthens because the blocking high collapses over the Norwegian Sea. The key signal to the formation of the west-path cold surge is that the blocking high over the Norwegian Sea is constantly enhanced and extends to Novaya Zemlya, transmits energy to the Ural Mountains, and deepens the cold trough, leading to the formation of a blocking system over the Ural Mountains.
The exploration of atmospheric circulation evolution and pre-signaling of cold surges is very important for their prediction. When the above-mentioned different types of atmospheric circulation characteristics appear, the type of cold surge path and its impact area can be potentially forecasted in advance, which may reduce the losses that result from cold surges.
The winter cold surges’ formation processes that were described for the blocking type and wave-train type by Park et al. [14,15] are the same as those for the north type and northwest type in our study, but the west type is a new type that is entirely different from the above two, indicating that the autumn cold surge is different from that of winter. Whether the new type of cold surge is unique to autumn is also worthy of further study.
Although the atmospheric circulation evolution for the three paths of autumn cold surges in North China are discussed, and their key atmospheric signals are explored, the reasons underlying the appearance of these signals are still unclear. As mentioned above, there is always a process for maintaining and enhancing the signals preceding cold surges in the three different paths, but the mechanism for their development and maintenance should be further investigated. Arctic sea ice is an important underlying surface factor that can affect cold surge activity [41]. Previous studies have found that Arctic sea ice shows a linearly decreasing trend [42,43,44]. Especially since 1998, sea ice concentration has significantly decreased [45]. Our results show that there has been an interdecadal decrease in the autumn cold surge frequency in North China since the mid–late 1990s, and northwest-path cold surges decreased significantly in the 2000s. Is there a relationship between Arctic sea ice and cold surge paths? This issue needs to be further investigated. In addition, our research on the formation process of three-path cold surges will provide an important basis for future study on the mechanism of the cold surge occurrences in different paths.
Author Contributions
B.C. and G.Z. (Gang Zeng) initiated and designed the study, and then collected the data. B.C. analyzed the data and wrote the paper. G.Z. (Gang Zeng), G.Z. (Guwei Zhang) and Z.L. made suggestions and revised the paper.
Funding
This research was funded by the National Natural Science Foundation of China grant numbers (41575085 and 41430528) and the National Key Research and Development Program of China grant number (2017YFA0603804).
Acknowledgments
We thank the three anonymous reviewers for their helpful comments and suggestions, which greatly improved the manuscript.
Conflicts of Interest
Authors express no conflicts of interest.
References
- Ou, T.; Chen, D.; Jeong, J.H.; Linderholm, H.W.; Zhou, T. Changes in winter cold surges over Southeast China: 1961 to 2012. Asia-Pac. J. Atmos. Sci. 2015, 51, 29–37. [Google Scholar] [CrossRef]
- Jeong, J.H.; Ho, C. Changes in occurrence of cold surges over East Asia in association with Arctic Oscillation. Geophys. Res. Lett. 2005, 32, 14704. [Google Scholar] [CrossRef]
- Wang, Z.Y.; Ding, Y.H. Climate Change of the cold surge Frequency of China in the last 53 years and the possible reasons. Chin. J. Atmos. Sci. 2006, 30, 1068–1076. (In Chinese) [Google Scholar]
- Huang, H.Q.; Han, X. Variation trend analysis of the cold airs in the East Asia. Mar. For. 2014, 31, 69–75. (In Chinese) [Google Scholar]
- Yang, T.C.; Wu, P.C.; Chen, Y.J.; Su, H.J. Cold surge: A sudden and spatially varying threat to health? Sci. Total Environ. 2009, 407, 3421–3424. [Google Scholar] [CrossRef] [PubMed] [Green Version]
- Lu, Q.F.; Zhang, W.J.; Peng, Z.; Wu, X.; Zhang, F.; Liu, Z.; Dale, M.B. Monitoring the 2008 cold surge and frozen disasters snowstorm in South China based on regional ATOVS data assimilation. Sci. China Earth Sci. 2010, 53, 1216–1228. [Google Scholar] [CrossRef] [Green Version]
- Lee, W.V. Historical global analysis of occurrences and human casualty of extreme temperature events (ETEs). Nat. Hazards. 2014, 70, 1453–1505. [Google Scholar] [CrossRef]
- Qian, W.H.; Zhang, W.W. Changes in cold surge events and warm winter in China during the last 46 years. Chin. J. Atmos. Sci. 2007, 31, 1266–1278. (In Chinese) [Google Scholar]
- Wei, F.Y. The changing characteristics of cold surge disasters in China under the background of climate warming. Prog. Nat. Sci. 2008, 18, 289–295. (In Chinese) [Google Scholar]
- Wang, Z.M.; Sun, Z.B.; Li, Z.X.; Ni, D.H. Variation characteristics of strong cold air activity frequency in Eurasia from 1949 to 2009. Meteorol. Disaster Reduct. Res. 2011, 34, 16–23. (In Chinese) [Google Scholar]
- Ding, Y.H. A statistical study of winter monmoons in East Asia. J. Trop. Meteorol. 1990, 6, 119–128. (In Chinese) [Google Scholar]
- Gong, D.Y.; Wang, S.W. Long-term variability of the siberian high and the possible connection to global warming. Acta. Geogr. Sin. 1999, 54, 31–39. (In Chinese) [Google Scholar]
- Qian, W.H.; Zhang, H.N.; Zhu, Y.F.; Lee, D.K. Interannual and interdecadal variability of East Asian acas and their impact on temperature of China in winter season for the last century. Adv. Atmos. Sci. 2001, 18, 511–523. [Google Scholar]
- Park, T.W.; Ho, C.H.; Deng, Y. A synoptic and dynamical characterization of wave-train and blocking cold surge over East Asia. Clim. Dyn. 2014, 43, 753–770. [Google Scholar] [CrossRef]
- Park, T.W.; Ho, C.H.; Jeong, J.H.; Heo, J.W.; Deng, Y. A new dynamical index for classification of cold surge types over East Asia. Clim. Dyn. 2015, 45, 2469–2484. [Google Scholar] [CrossRef]
- Hu, Y.Y. On the influence of stratospheric anomalies on tropospheric weather systems. Adv. Earth. Sci. 2006, 21, 713–721. (In Chinese) [Google Scholar]
- Woo, S.H.; Kim, B.M.; Jeong, J.H.; Kim, S.J.; Lim, G.H. Decadal changes in surface air temperature variability and cold surge characteristics over northeast Asia and their relation with the Arctic Oscillation for the past three decades (1979–2011). J. Geophys. Res. Atmos. 2012, 117, 1–16. [Google Scholar] [CrossRef]
- Gong, Z.; Feng, G.; Ren, F.; Li, J. A regional extreme low temperature event and its main atmospheric contributing factors. Theor. Appl. Climatol. 2014, 117, 195–206. [Google Scholar] [CrossRef]
- Shen, B.Z. The Contact and Effect of Arctic Oscillation and Polar Vortex in Winter on Frequent Cold Winter Occurred in Eurasia Since 21th Century; Lanzhou University: Lanzhou, China, 2013. (In Chinese) [Google Scholar]
- Park, T.W.; Ho, C.H.; Yang, S. Relationship between the Arctic Oscillation and cold surges over East Asia. J. Clim. 2011, 24, 68–83. [Google Scholar] [CrossRef]
- Tao, S.Y. China’s research on the cold surge of East Asia in the past ten years. Acta Meteorol. Sin. 1959, 30, 226–230. (In Chinese) [Google Scholar]
- Ding, Y. Build-up, air mass transformation and propagation of Siberian high and its relations to cold surge in East Asia. Meteorol. Atmos. Phys. 1990, 44, 281–292. [Google Scholar]
- Zhang, P.Z.; Chen, G.M. A statistical analysis of the cold surge high which in fluences on China. Acta Meteorol. Sin. 1999, 57, 493–501. (In Chinese) [Google Scholar]
- Stohl, A. Computation, accuracy and applications of trajectories—A review and bibliography. Atmos. Environ. 1998, 32, 947–966. [Google Scholar] [CrossRef]
- Stohl, A.; Seibert, P. Accuracy of trajectories as determined from the conservation of meteorological tracers. Q. J. R. Meteorol. Soc. 1998, 124, 1465–1484. [Google Scholar] [CrossRef]
- Plumb, R.A. On the three-dimensional propagation of stationary waves. J. Atmos. Sci. 1985, 42, 217–229. [Google Scholar] [CrossRef]
- Draxler, R.R.; Hess, G.D. An overview of the hysplit-4 modeling system for trajectories. Aust. Meteorol. Mag. 1998, 47, 295–308. [Google Scholar]
- Tang, M.Q.; Zeng, G. Decadal variability of spring cold surge across Northeast China in the past 30 years and its possible causes. Clim. Environ. Res. 2017, 22, 473–486. (In Chinese) [Google Scholar]
- Walsh, J.E.; Phillips, A.S.; Portis, D.H.; Chapman, W.L. Extreme cold outbreaks in the United States and Europe1 1948–99. J. Clim. 2001, 14, 2642–2658. [Google Scholar] [CrossRef]
- Sun, Z.B.; Wang, Z.M.; Zeng, G. The characteristics of cold air outbreaks in Northwest China based on airflow trajectory model. J. Zhengzhou Univ. 2017, 49, 1671–6841. (In Chinese) [Google Scholar]
- Wang, Z.M.; Sun, Z.B.; Zeng, G. Characteristics of strong cold air outbreaks in Northeast China during 1970 to 2013. J. Xinyang Norm. Univ. 2017, 30, 407–411. (In Chinese) [Google Scholar]
- Kalnay, E.; Kanamitsu, M.; Kistler, R.; Collins, W.; Deaven, D.; Gandin, L.; Iredell, M.; Saha, S.; White, G.; Woollen, J.; et al. The NCEP/NCAR 40-Year Reanalysis Project. Bull. Am. Meteorol. Soc. 1996, 77, 437–472. [Google Scholar] [CrossRef]
- The State Administration of Quality Supervision, Inspection and Quarantine of the People’s Republic of China, China National Standardization Administration Commission. Grades of Cold Wave (GB/T 21987−2008); China Standards Press: Beijing, China, 2008; pp. 1–3. (In Chinese) [Google Scholar]
- Stein, A.F.; Draxler, R.R.; Rolph, G.D.; Stunder, B.J.; Cohen, M.D.; Ngan, F. NOAA’s HYSPLIT Atmospheric Transport and Dispersion Modeling System. Bull. Am. Meteorol. Soc. 2015, 96, 2059–2077. [Google Scholar] [CrossRef]
- Wang, Z.; Sun, Z.; Zeng, G. Characteristics of Strong Cold Air Outbreaks in China’s Central and Eastern Mongolian Region between 1970 and 2013. Atmosphere 2017, 8, 98. [Google Scholar] [CrossRef]
- Draxler, R.R.; Hess, G.D. Description of the HYSPLIT_4 modelling system. Natl. Ocean. Atmos. Adm. Tech. Memo. 1997, 12, 197–199. [Google Scholar]
- Ward, J.H., Jr. Hierarchical Grouping to Optimize an Objective Function. J. Am. Stat. Assoc. 1963, 58, 236–244. [Google Scholar] [CrossRef] [Green Version]
- Hartigan, J.A.; Wong, M.A. Algorithm AS 136: A K-means clustering algorithm. J. R. Stat. Soc. 1979, 28, 100–108. [Google Scholar] [CrossRef]
- Li, F.; Jiao, M.Y.; Ding, Y.H.; Jin, R.H. Climate change of arctic atmospheric circulation in last 30 years and its effect on strong cold events in China. Plateau Meteorol. 2006, 25, 209–219. (In Chinese) [Google Scholar]
- National Meteorological Center of CMA. The cold surge that affects China. Meteorol. Mon. 1974, 1, 3–6. (In Chinese) [Google Scholar]
- Zhu, C.Y.; Fei, H.; Shi, Y. Spatial-Temporal Patterns of the Cold Surge Events in China in Recent 50 Years and Its Relationship with Arctic Sea Ice. Period. Ocean Univ. China 2014, 44, 12–20. [Google Scholar]
- Liu, J.; Curry, J.A.; Wang, H.; Song, M.; Horton, R.M. Impact of declining Arctic sea ice on winter snowfall. Proc. Natl. Acad. Sci. USA 2012, 109, 4074–4079. [Google Scholar] [CrossRef] [Green Version]
- Cavalieri, D.J.; Gloersen, P.; Parkinson, C.L.; Comiso, J.C.; Zwally, H.J. Observed Hemispheric Asymmetry in Global Sea Ice Changes. Science 1997, 278, 1104–1106. [Google Scholar] [CrossRef]
- Vinnikov, K.Y.; Robock, A.; Stouffer, R.J.; Walsh, J.E.; Parkinson, C.L.; Cavalieri, D.J.; Mitchell, J.F.; Garrett, D.; Zakharov, V.F. Global Warming and Northern Hemisphere Sea Ice Extent. Science 1999, 286, 1934–1936. [Google Scholar] [CrossRef] [PubMed]
- Fang, Z.F.; Zhang, L.; Cheng, Y.J. The Decrease of the Arctic Sea Ice and the Abrupt Changes of Sea Ice in 1990s. Arid Meteorol. 2005, 23, 1–11. (In Chinese) [Google Scholar]
Figure 1.
Map of study area (North China) is surrounded by blue solid line (shading indicates the topography; unit: m; dots are 72 stations in North China).
Figure 1.
Map of study area (North China) is surrounded by blue solid line (shading indicates the topography; unit: m; dots are 72 stations in North China).
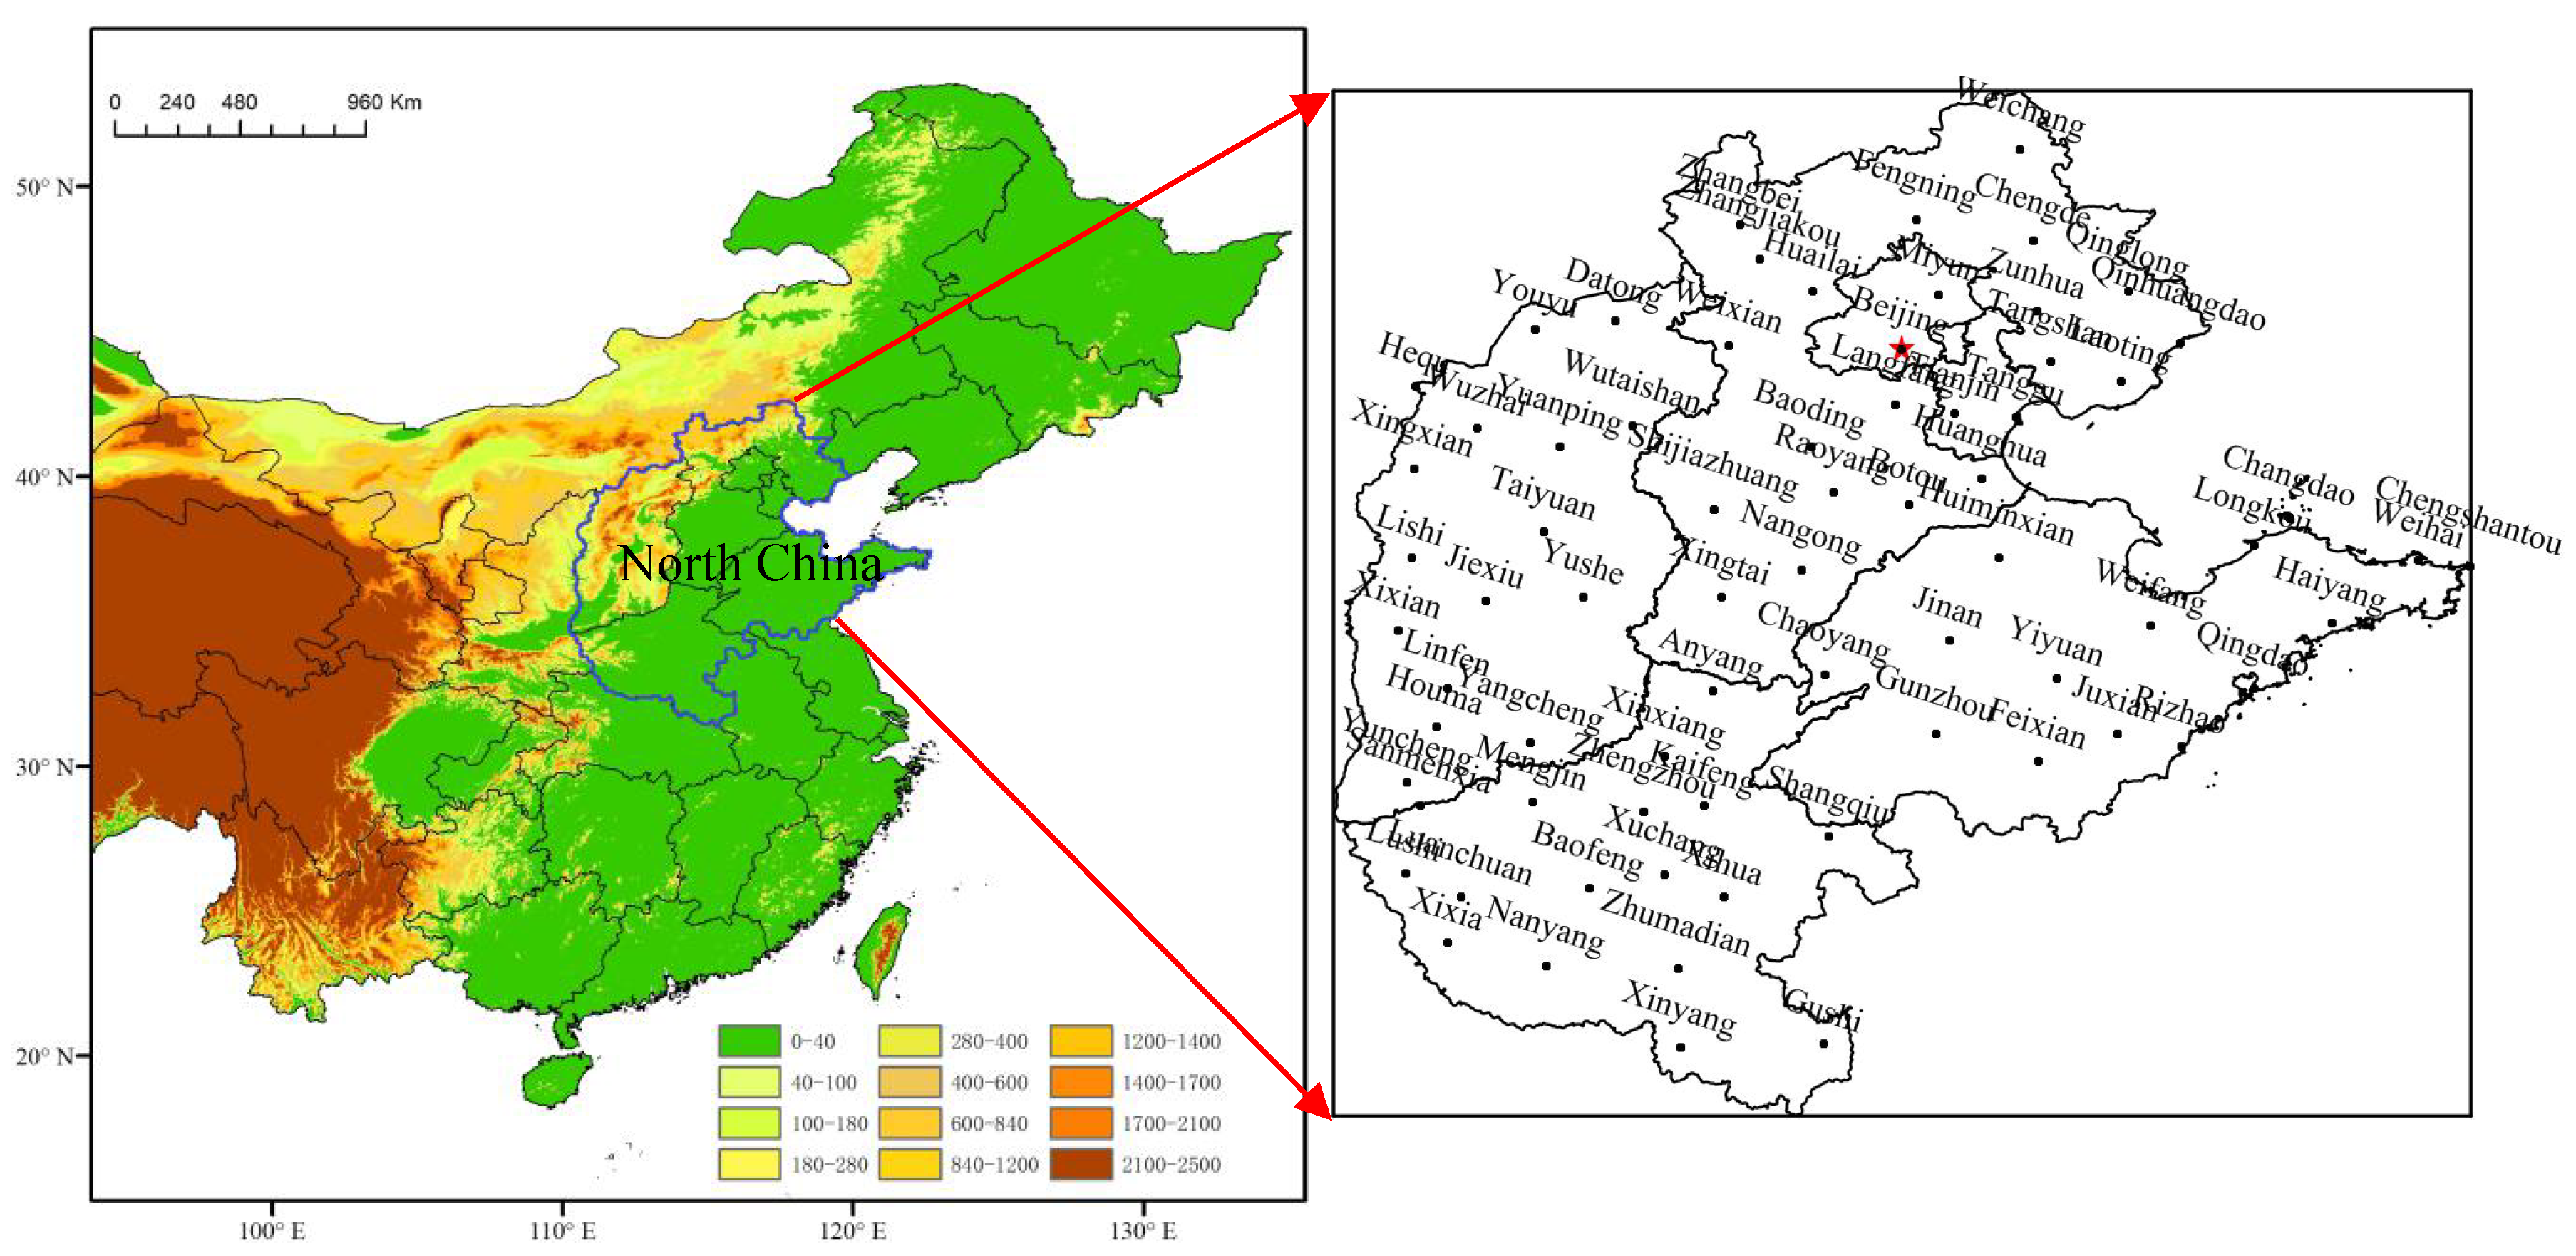
Figure 2.
Comparison between surface temperature drop centrode paths (dashed lines) and cold air paths tracked with the Hybrid Single-Particle Lagrangian Integrated Trajectory (HYSPLIT) model (solid lines) every 24 h in the preceding six days of eight cold surges that occurred in North China.
Figure 2.
Comparison between surface temperature drop centrode paths (dashed lines) and cold air paths tracked with the Hybrid Single-Particle Lagrangian Integrated Trajectory (HYSPLIT) model (solid lines) every 24 h in the preceding six days of eight cold surges that occurred in North China.
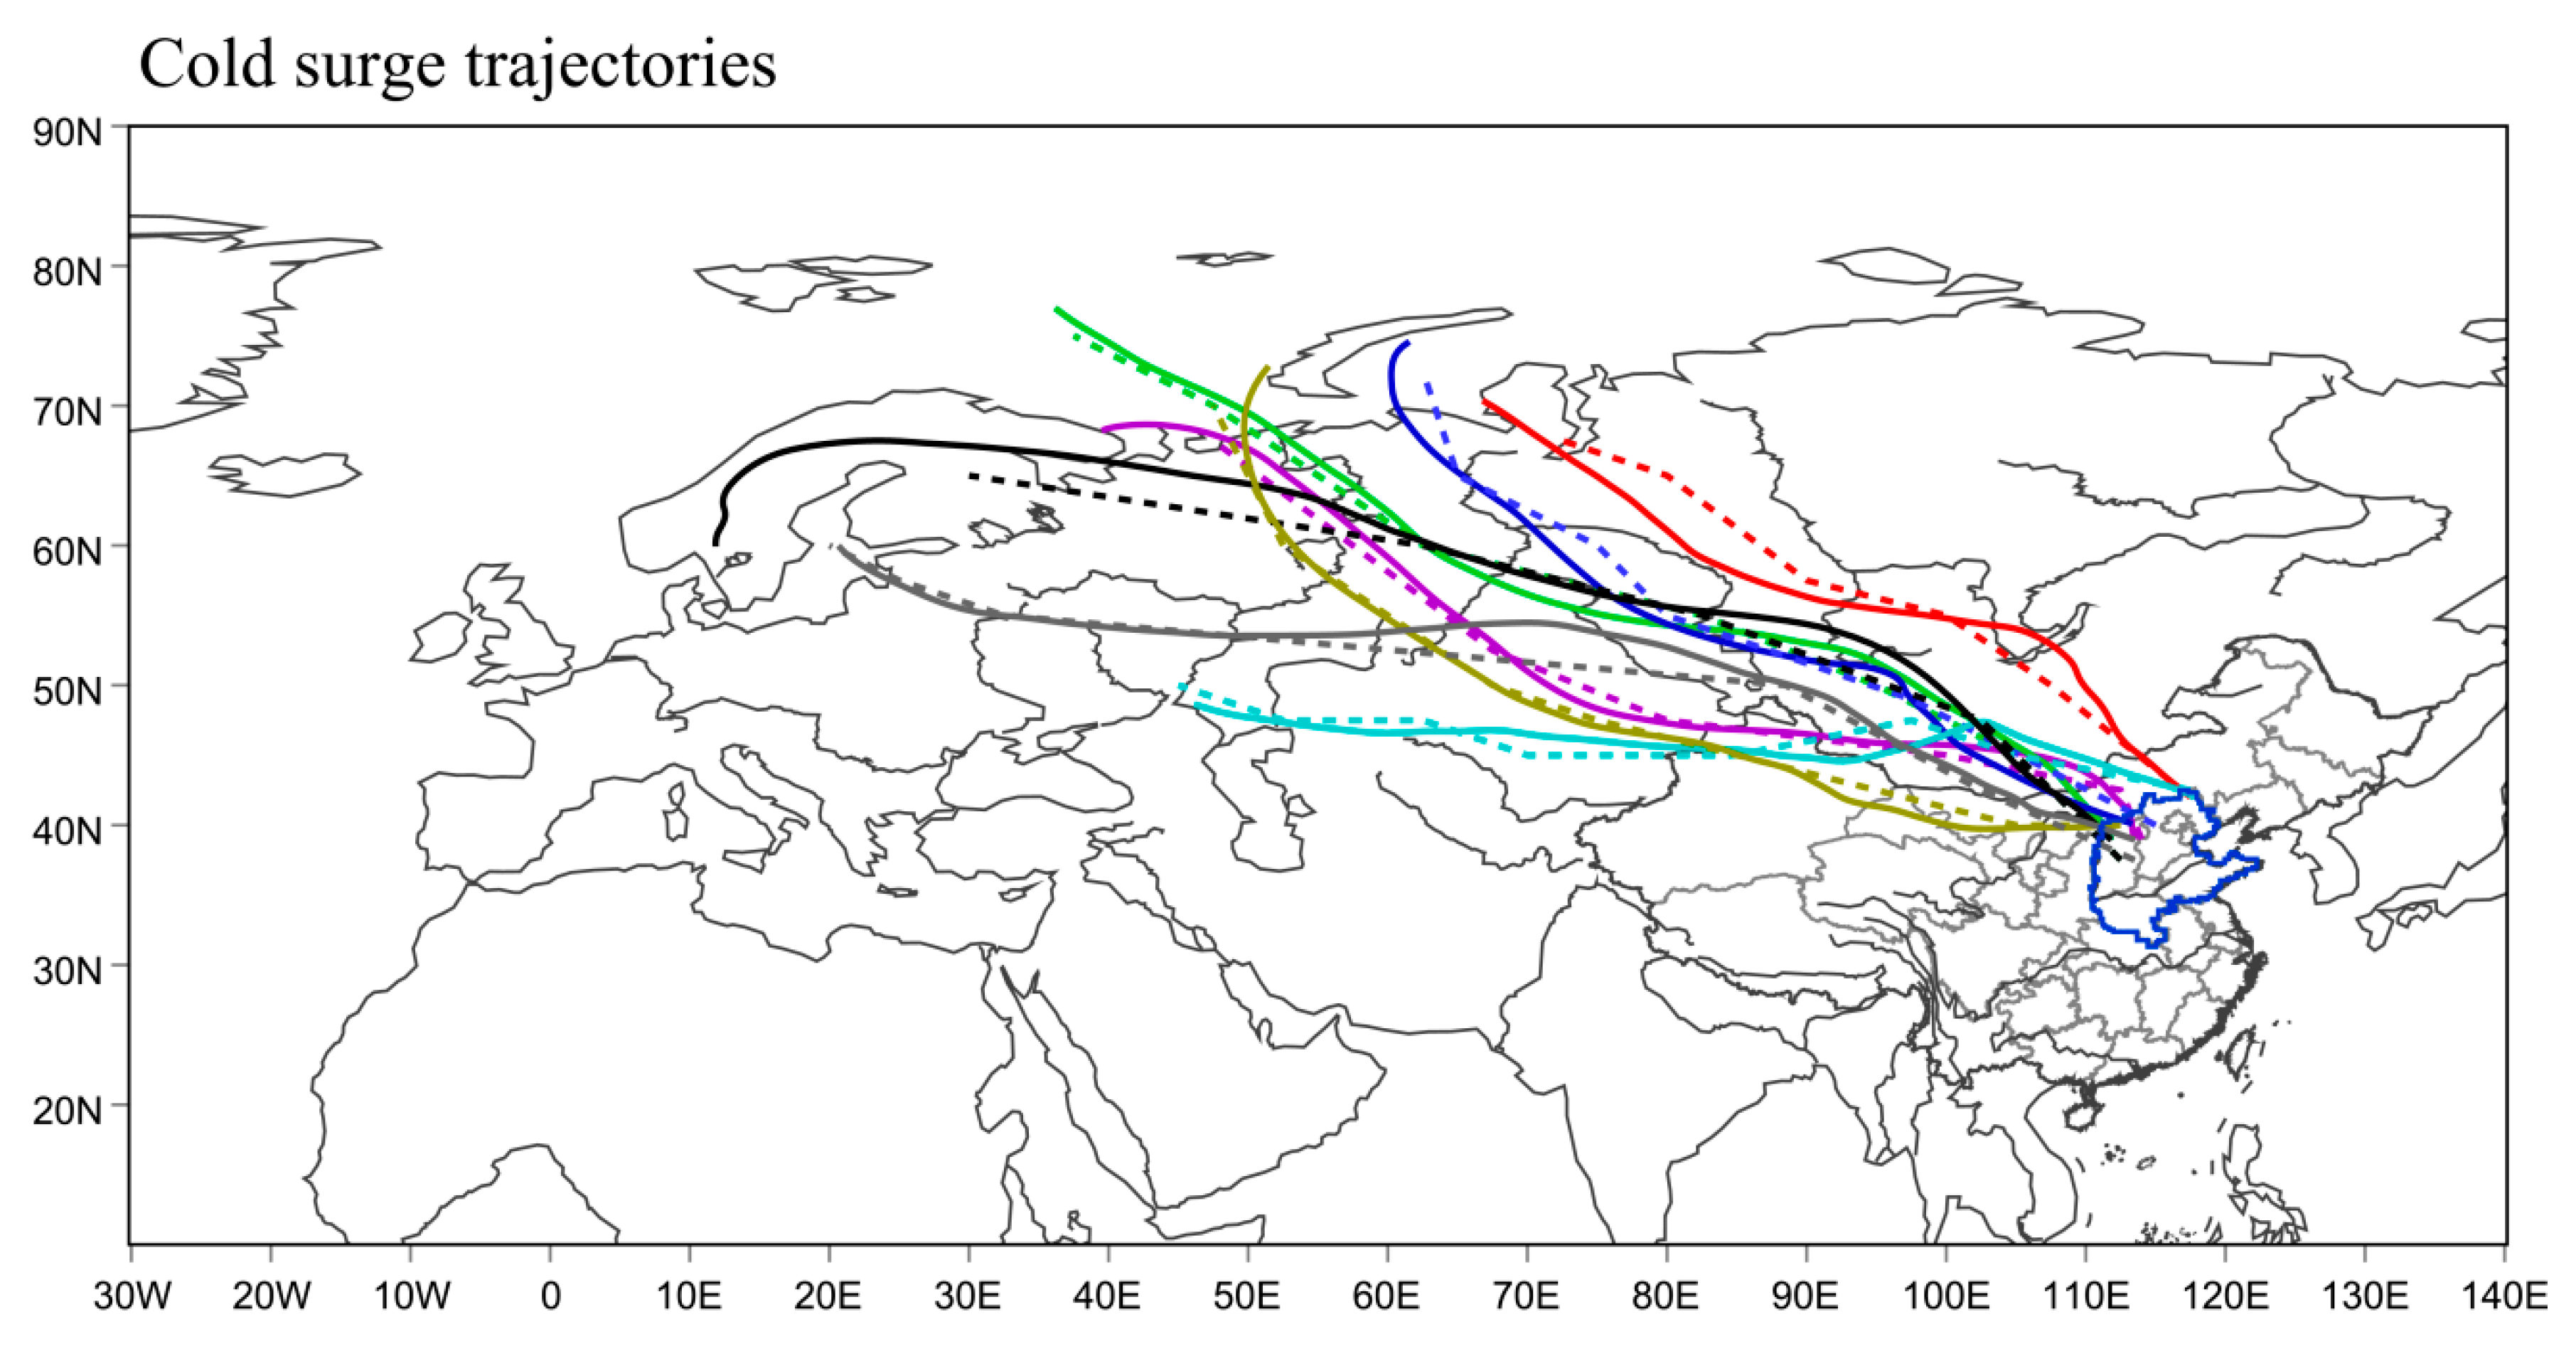
Figure 3.
The climatological mean frequency of autumn cold surges in 72 stations of North China from 1961 to 2014 (black dots indicate the stations).
Figure 3.
The climatological mean frequency of autumn cold surges in 72 stations of North China from 1961 to 2014 (black dots indicate the stations).
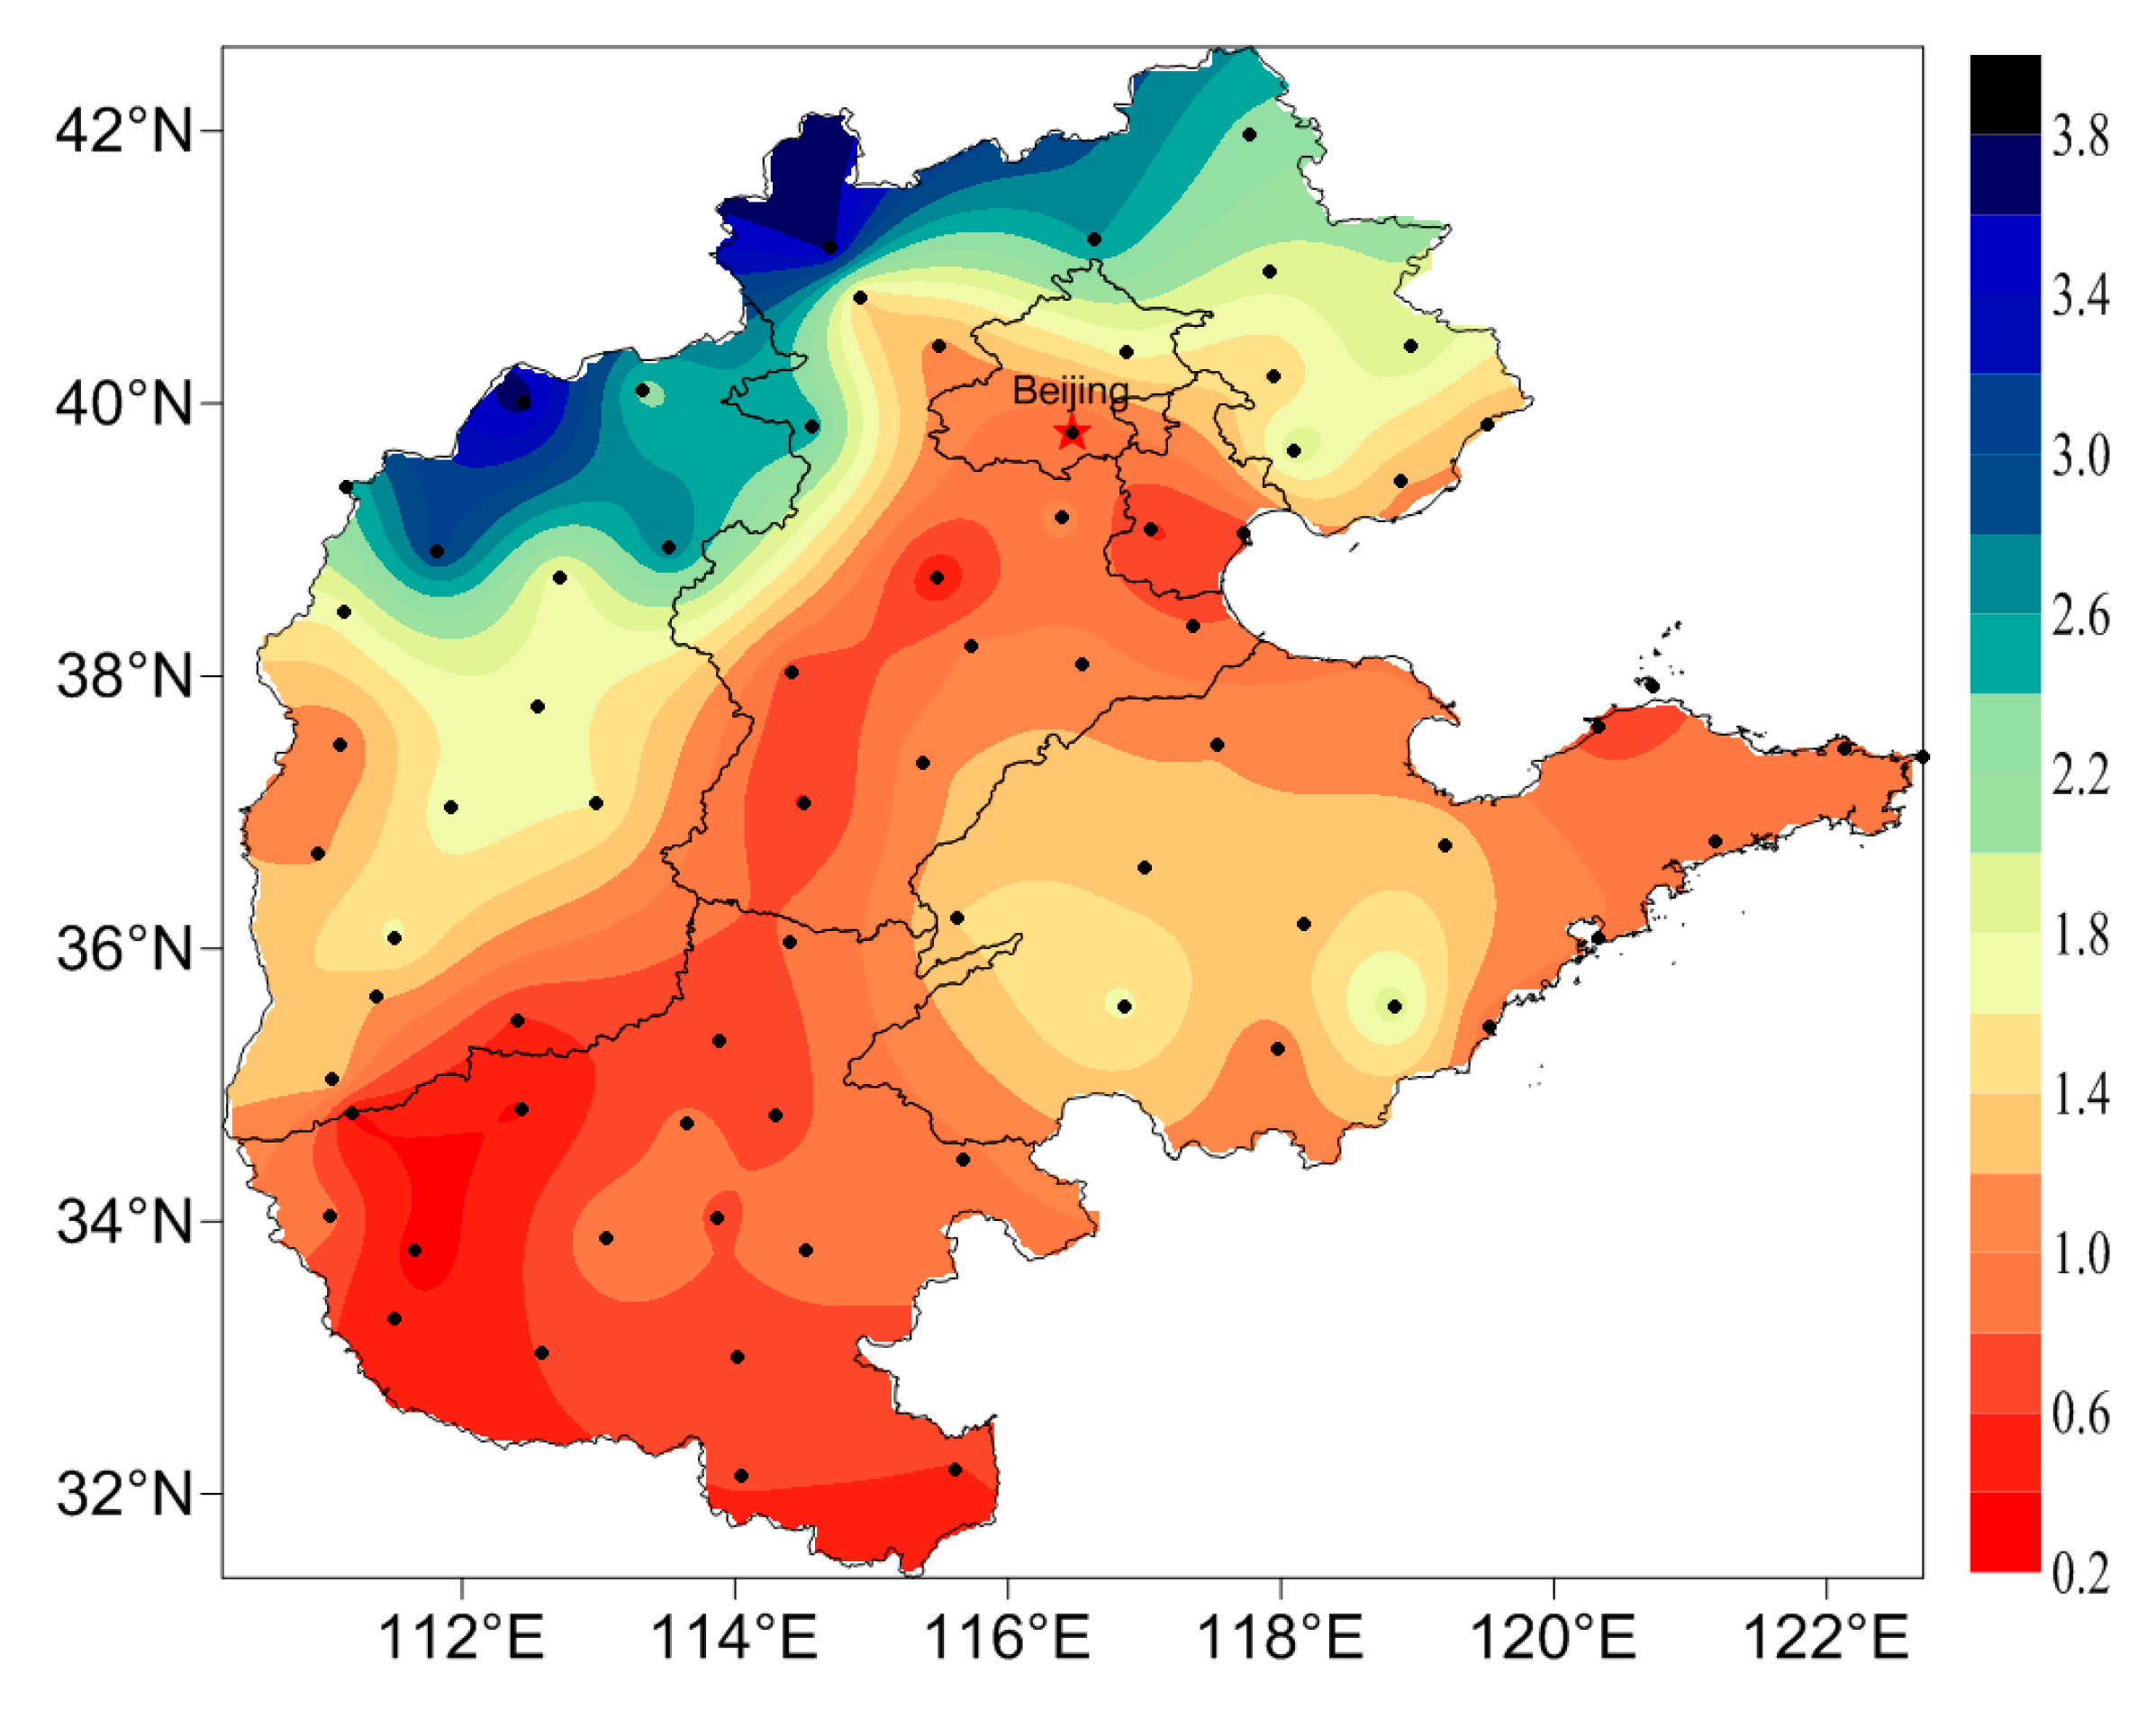
Figure 4.
Variation in the occurrence of autumn cold surges in North China from 1961 to 2014. The black solid line indicates the average occurrence for the study period. The gray solid line indicates the nine-year running average.
Figure 4.
Variation in the occurrence of autumn cold surges in North China from 1961 to 2014. The black solid line indicates the average occurrence for the study period. The gray solid line indicates the nine-year running average.

Figure 5.
Six-day horizontal paths of autumn cold surges in North China from 1961 to 2014 and the corresponding classification: west path (blue lines), northwest path (green lines), and north path (red lines); gray, yellow, and black bold lines represent the synthesized trajectories formed 72 h before the onset of the cold surges. Black rectangles represent the key region (70–90° E, 43–65° N).
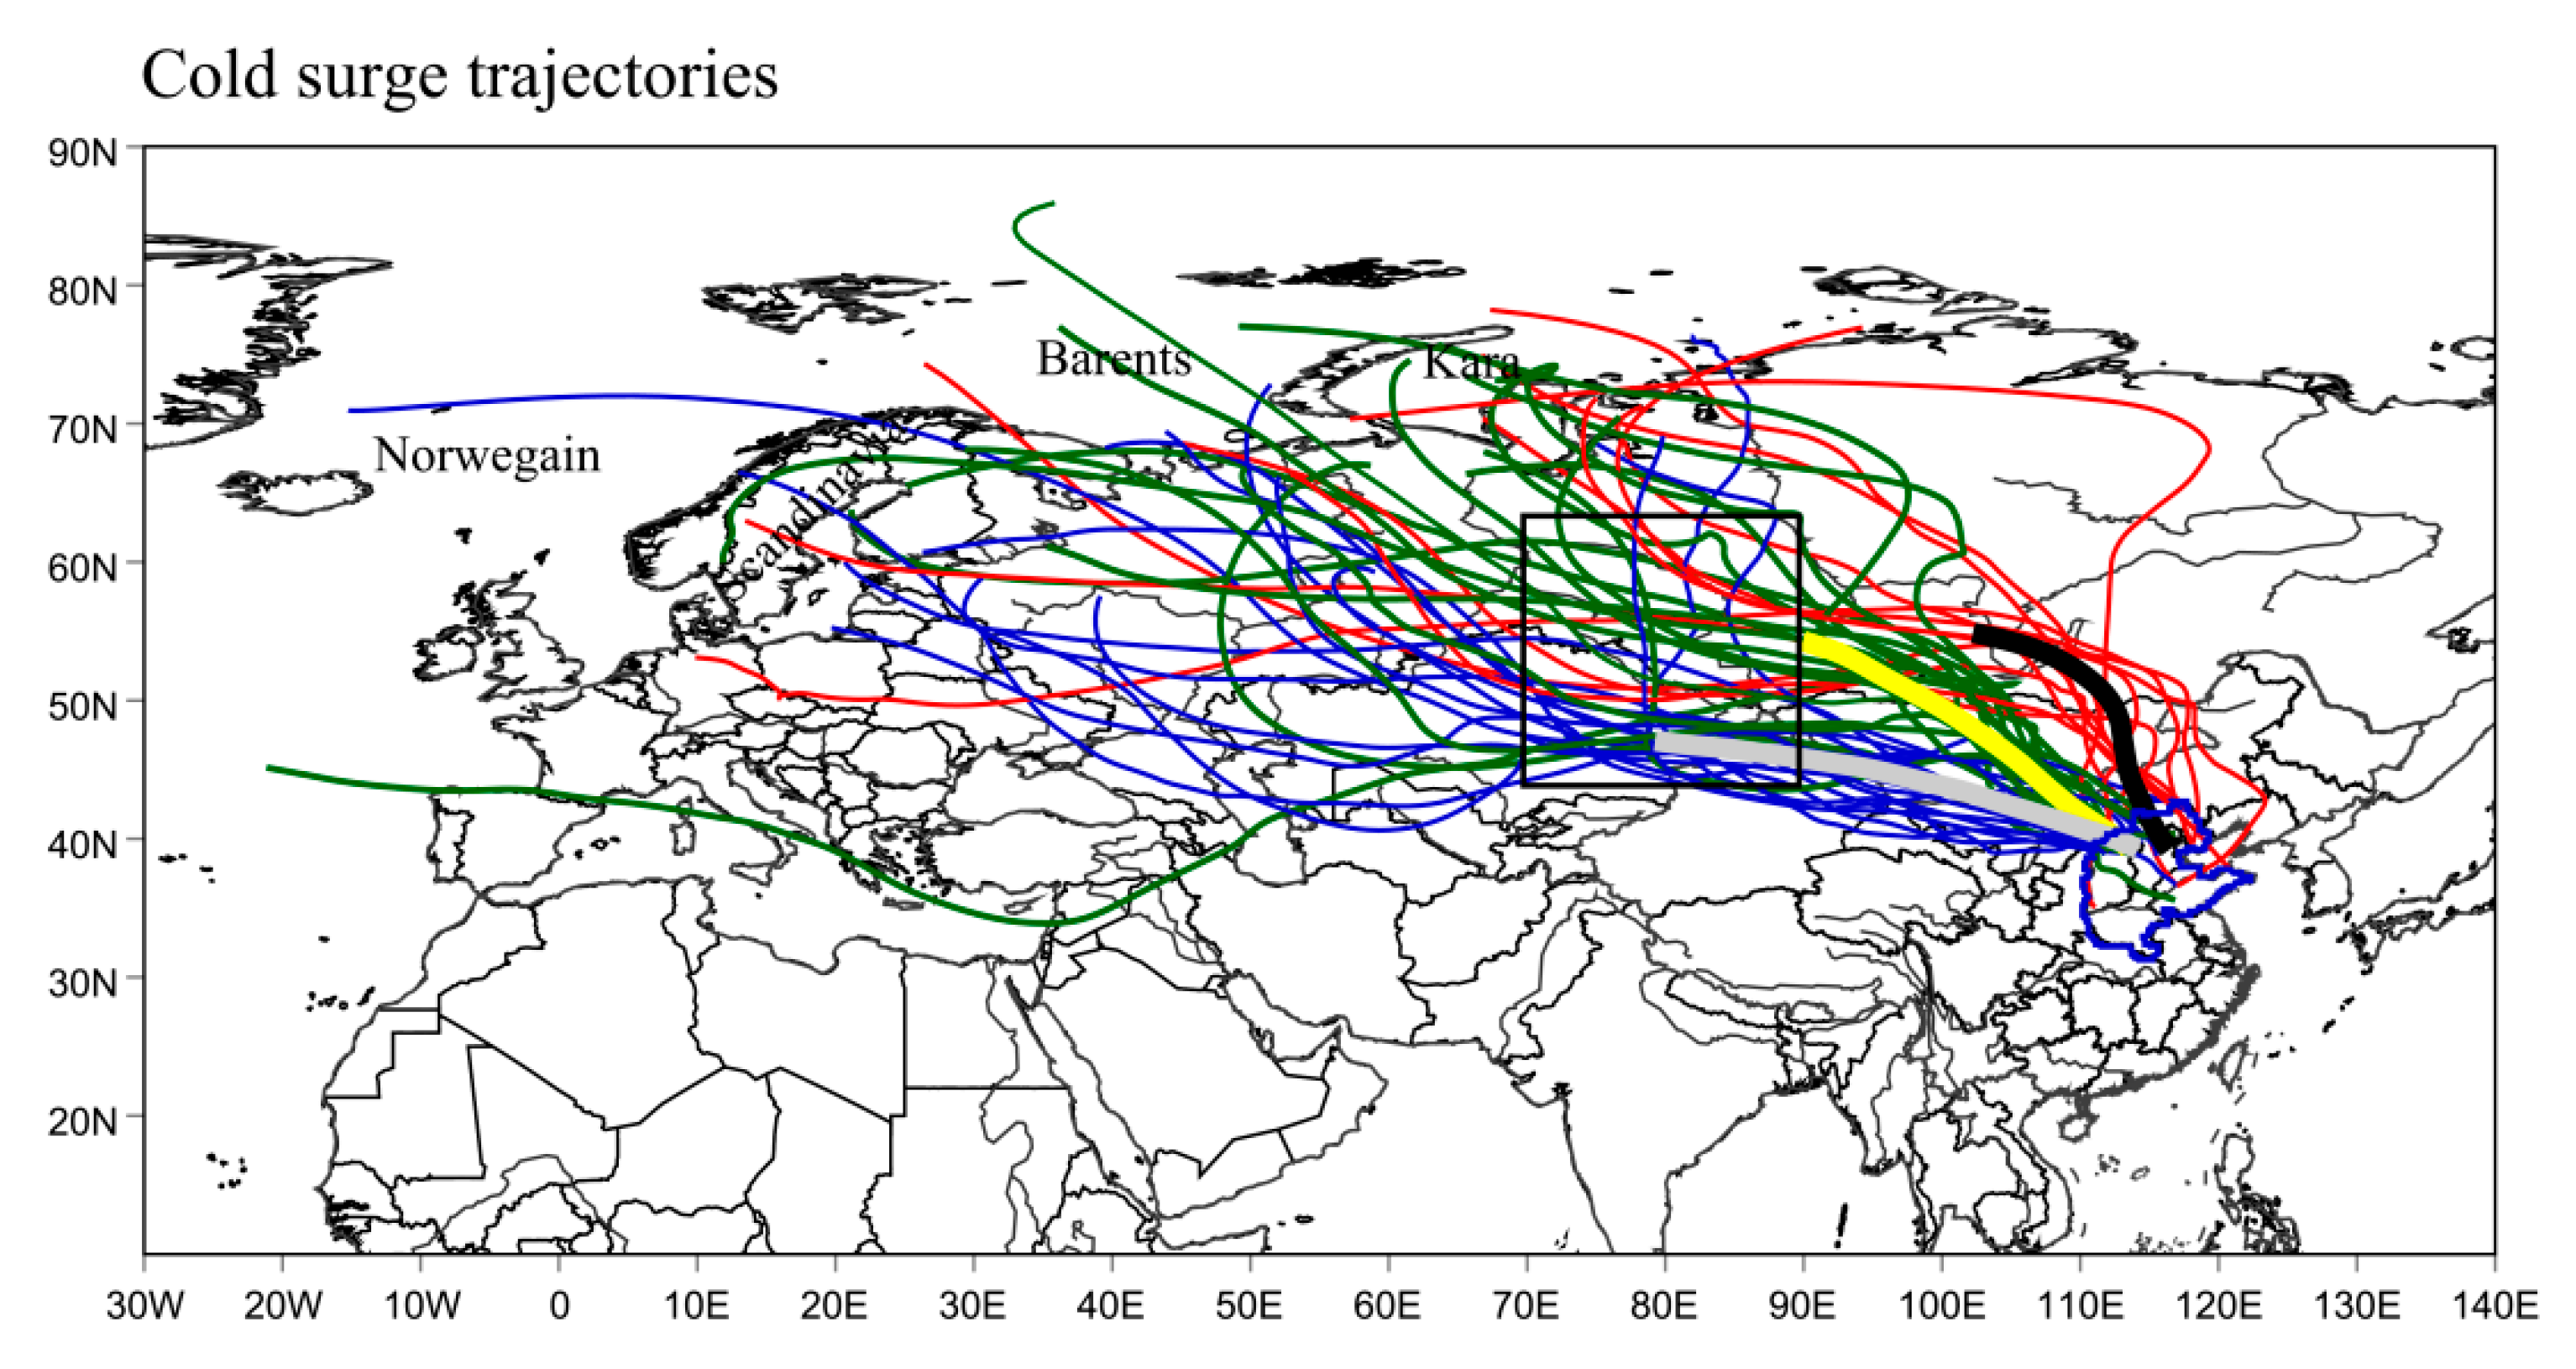
Figure 6.
Variability in autumn cold surge occurrences in North China from the north (N), northwest (NW), and west (W) paths.
Figure 6.
Variability in autumn cold surge occurrences in North China from the north (N), northwest (NW), and west (W) paths.
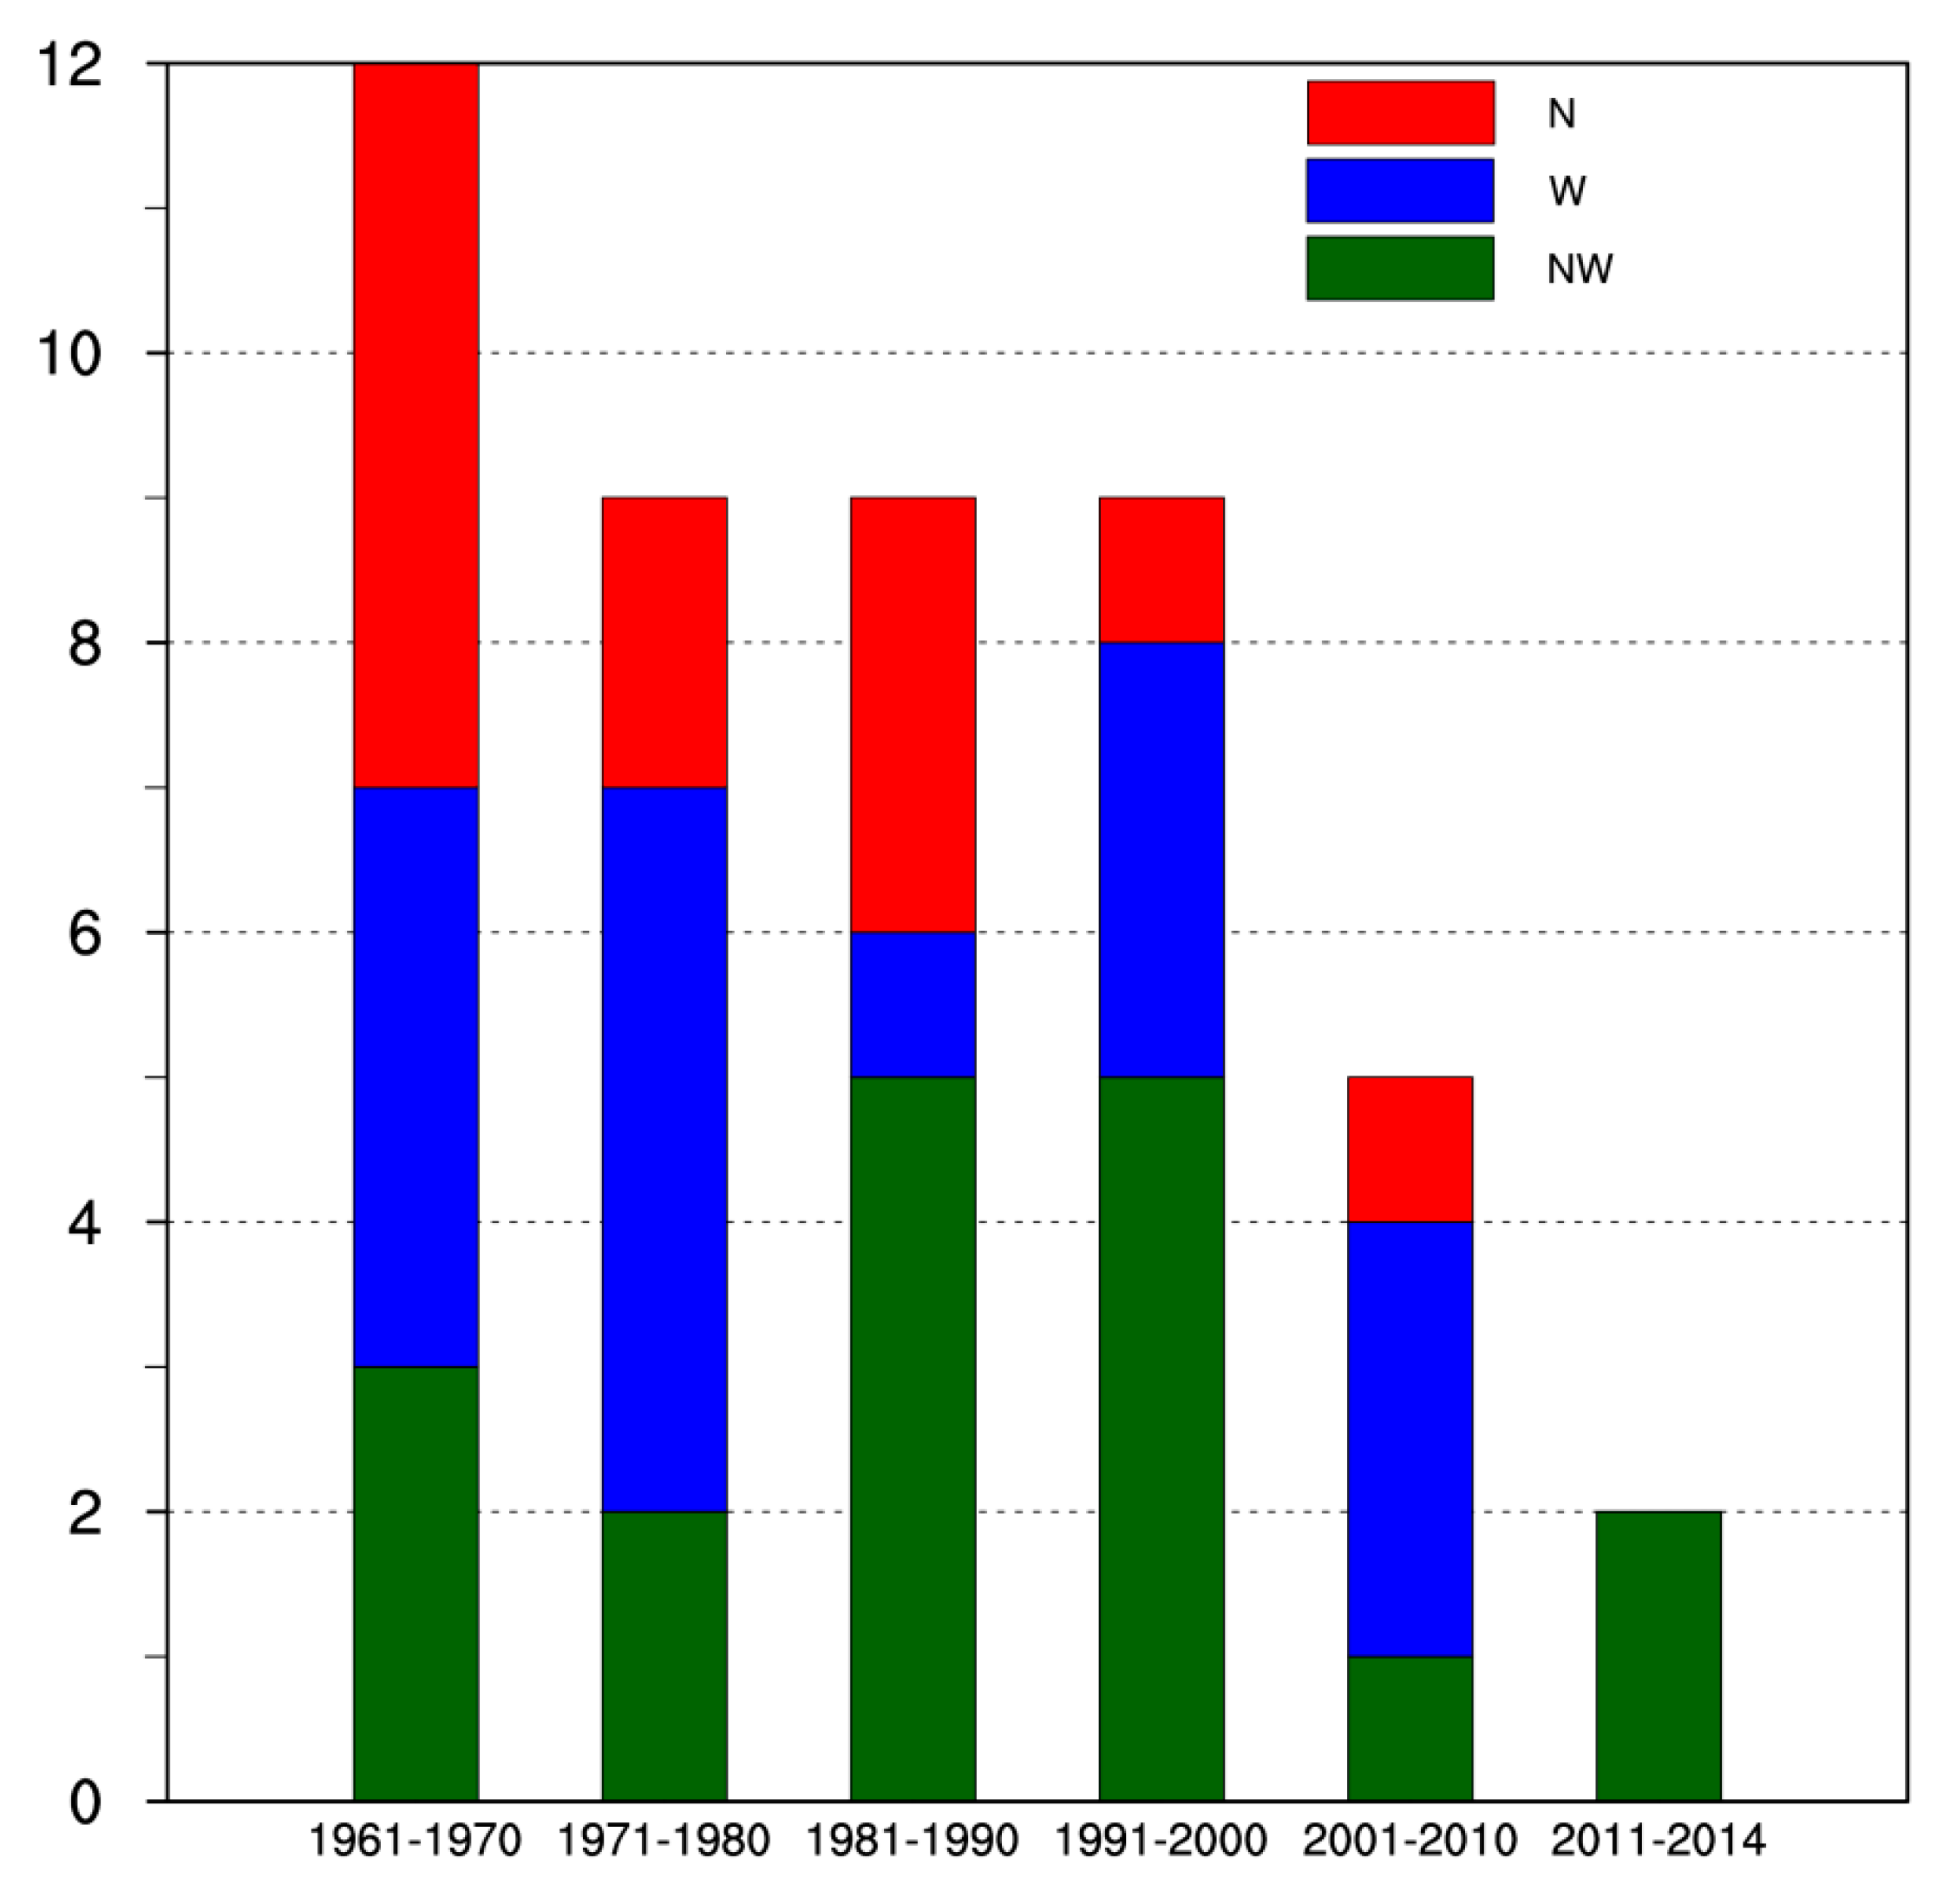
Figure 7.
Composite of geopotential height (GPH) (contours; intervals of 100 m) and its anomalies (shaded areas; unit: m; significant values at the 0.05 confidence level are presented by green dots) at 500 hPa from day −4 to day 0 relative to cold surge occurrences of the north (a–c), northwest (d–f), and west (g–i) types. Red arrows indicate the wave-guided line.
Figure 8.
Sea level pressure (shaded areas; unit: hPa) and 850-hPa wind anomalies (vectors; unit: m/s) from day −4 to day −2 relative to cold surge occurrences of the north (a–c), northwest (d–f), and west (g–i) types. Red arrows indicate the expansion of the Siberian High.
Figure 8.
Sea level pressure (shaded areas; unit: hPa) and 850-hPa wind anomalies (vectors; unit: m/s) from day −4 to day −2 relative to cold surge occurrences of the north (a–c), northwest (d–f), and west (g–i) types. Red arrows indicate the expansion of the Siberian High.
Figure 9.
Composite GPH anomalies at 300 hPa (shaded areas; unit: m; significant values at the 0.05 confidence level are presented by green dots) and Plumb wave action flux anomalies (vectors, unit: m2/s2) from day −14 to day −4 (a–f) relative to the north cold surge occurrences.
Figure 9.
Composite GPH anomalies at 300 hPa (shaded areas; unit: m; significant values at the 0.05 confidence level are presented by green dots) and Plumb wave action flux anomalies (vectors, unit: m2/s2) from day −14 to day −4 (a–f) relative to the north cold surge occurrences.
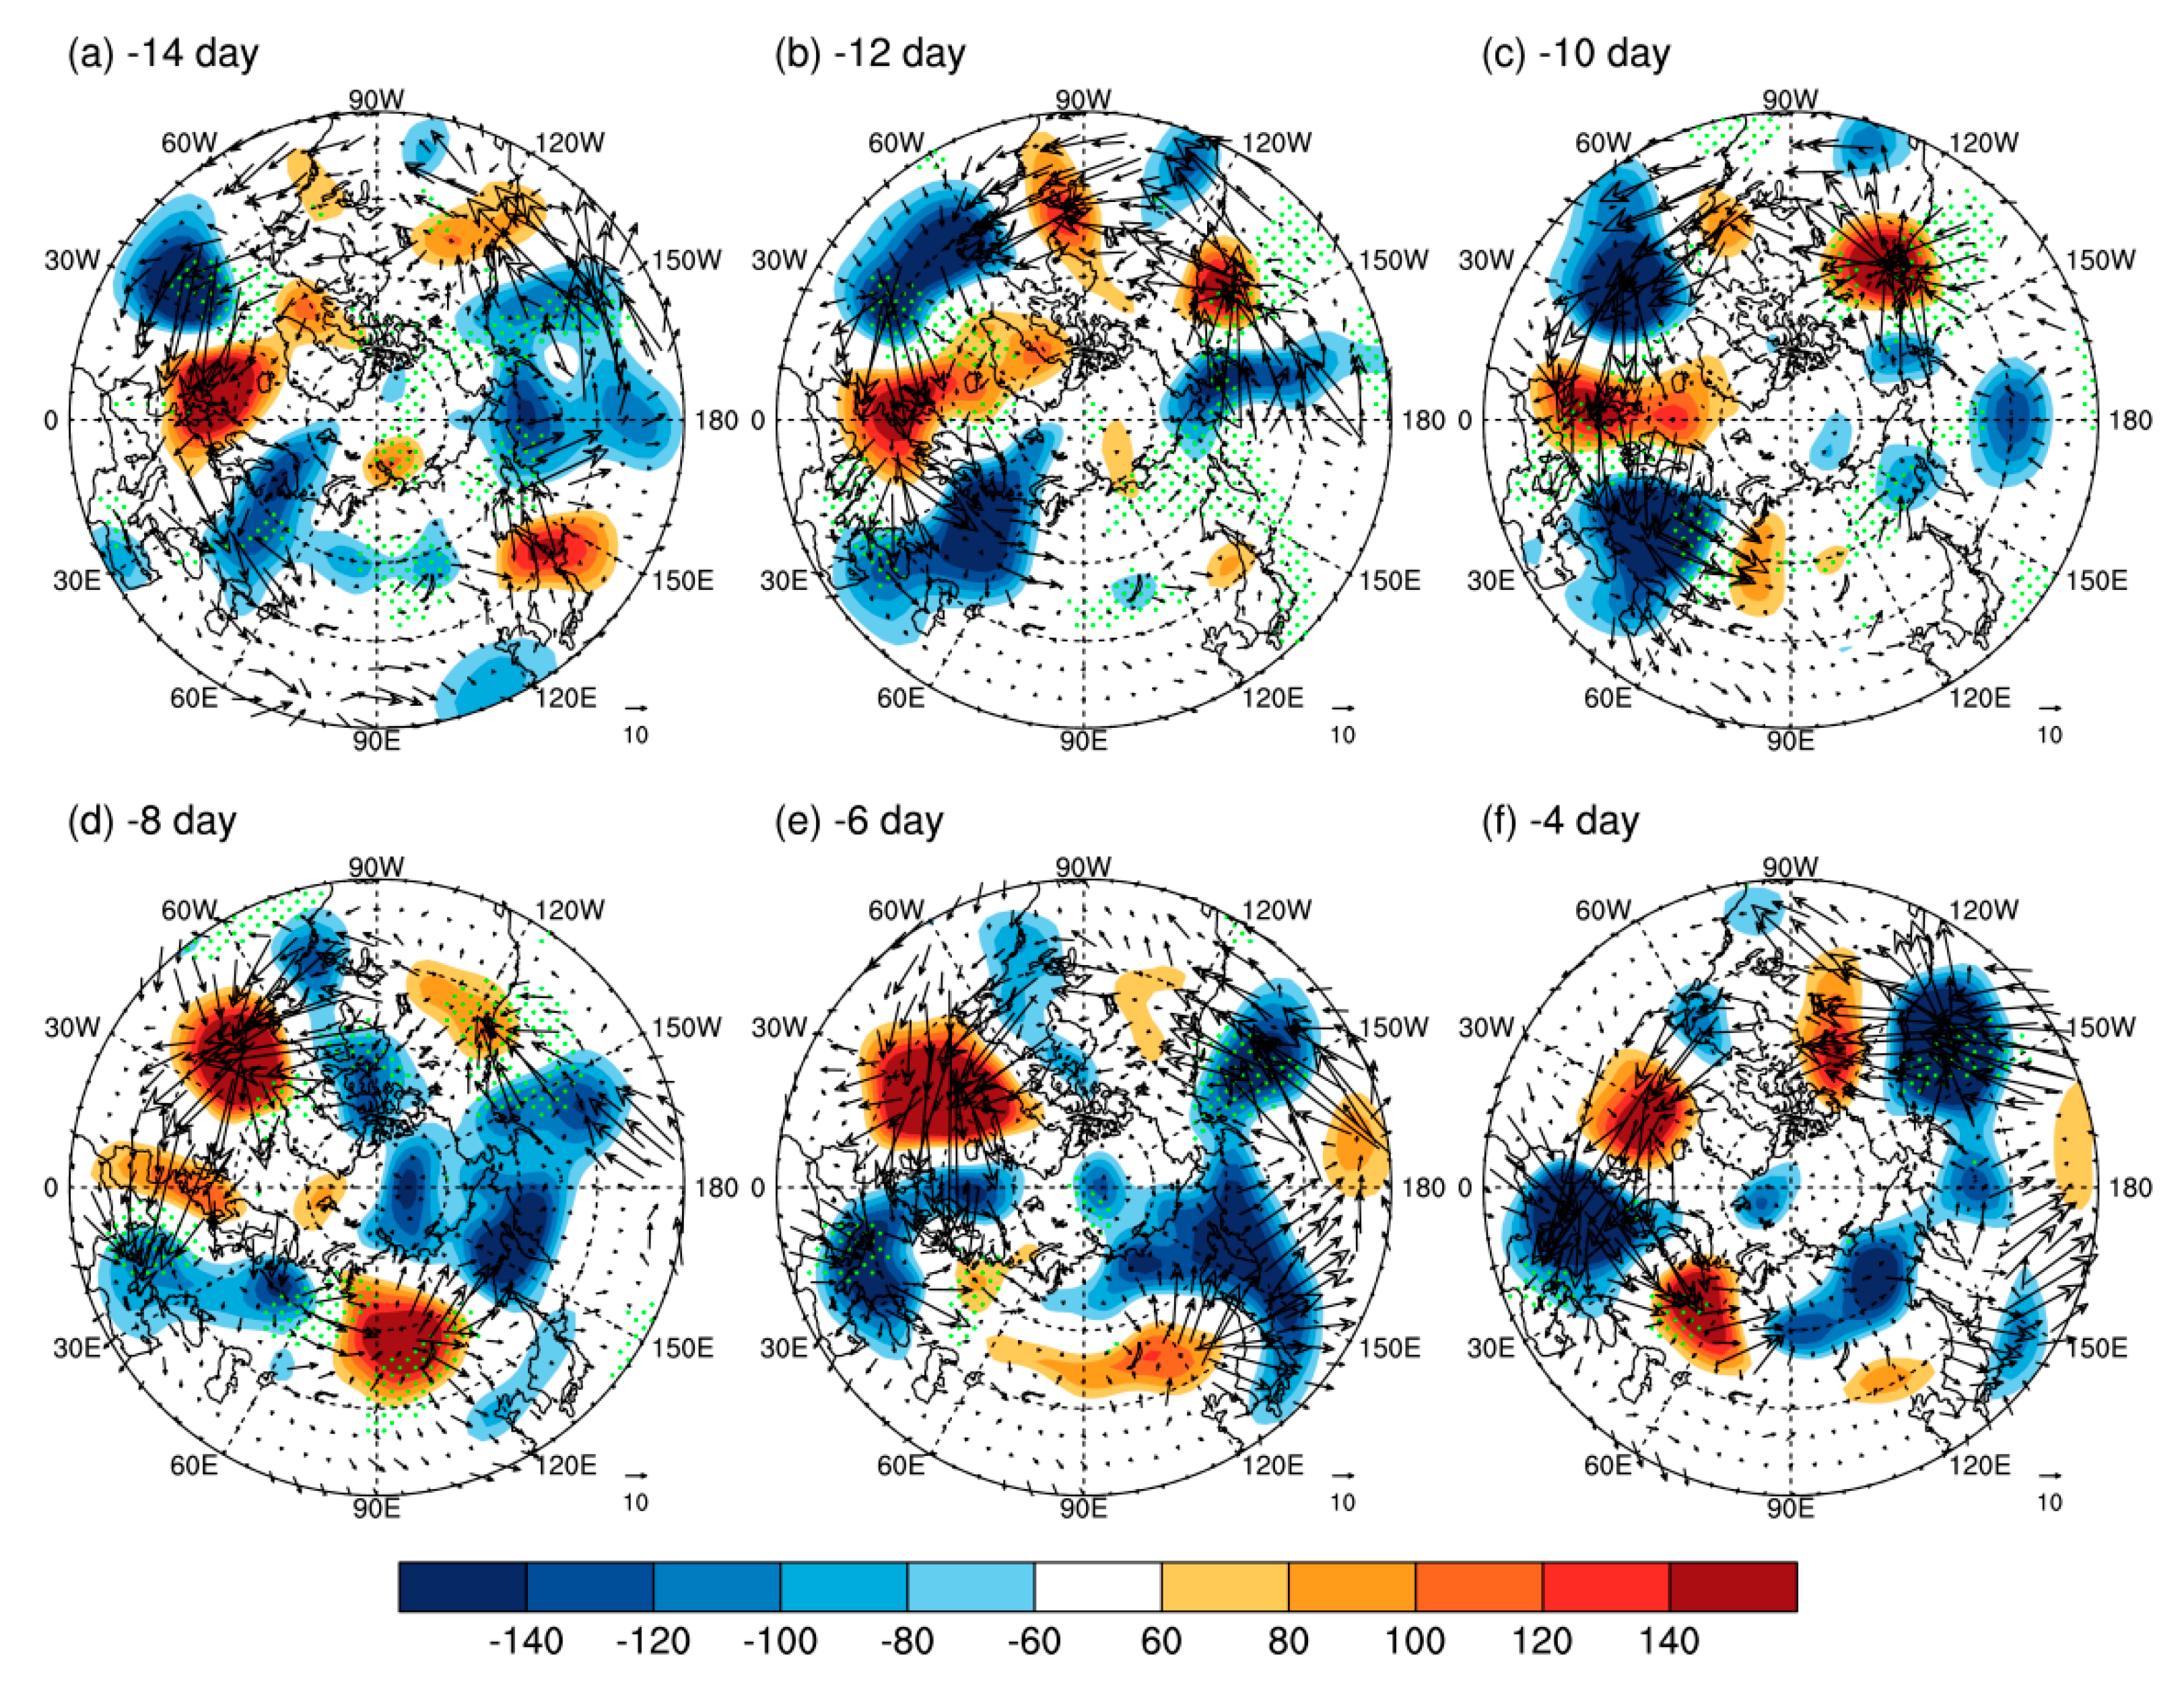
Figure 10.
Same as Figure 9, but for the northwest type (a–f).
Figure 10.
Same as Figure 9, but for the northwest type (a–f).

Figure 11.
Same as Figure 9, but for the west type (a–f).
Figure 11.
Same as Figure 9, but for the west type (a–f).

© 2019 by the authors. Licensee MDPI, Basel, Switzerland. This article is an open access article distributed under the terms and conditions of the Creative Commons Attribution (CC BY) license (http://creativecommons.org/licenses/by/4.0/).
Share and Cite
MDPI and ACS Style
Cai, B.; Zeng, G.; Zhang, G.; Li, Z. Autumn Cold Surge Paths over North China and the Associated Atmospheric Circulation. Atmosphere 2019, 10, 134. https://doi.org/10.3390/atmos10030134
AMA Style
Cai B, Zeng G, Zhang G, Li Z. Autumn Cold Surge Paths over North China and the Associated Atmospheric Circulation. Atmosphere. 2019; 10(3):134. https://doi.org/10.3390/atmos10030134
Chicago/Turabian StyleCai, Bo, Gang Zeng, Guwei Zhang, and Zhongxian Li. 2019. "Autumn Cold Surge Paths over North China and the Associated Atmospheric Circulation" Atmosphere 10, no. 3: 134. https://doi.org/10.3390/atmos10030134
Note that from the first issue of 2016, this journal uses article numbers instead of page numbers. See further details here.