Article

Characteristics of Aerosol Chemical Compositions and Size Distributions during a Long-Range Dust Transport Episode in an Urban City in the Yangtze River Delta

1
Wuhan Regional Climate Centre, Wuhan 430074, China
2
Wuhan Central Meteorological Office, Wuhan 430074, China
3
Collaborative Innovation Center on Forecast and Evaluation of Meteorological Disasters, Key Laboratory for Aerosol-Cloud-Precipitation of the China Meteorological Administration, Nanjing University of Information Science and Technology, Nanjing 210044, China
4
Shanghai Key Laboratory of Atmospheric Particle Pollution and Prevention (LAP3), Shanghai 200000, China
*
Authors to whom correspondence should be addressed.
Atmosphere 2019, 10(2), 68; https://doi.org/10.3390/atmos10020068
Submission received: 9 January 2019 / Revised: 30 January 2019 / Accepted: 2 February 2019 / Published: 6 February 2019
(This article belongs to the Special Issue Mineral Dust: Sources, Atmospheric Processing and Impacts)

Abstract

:
A long- and large-range heavy dust episode occurred from 3 to 8 May 2017 in China. To explore the impacts of this long-range dust transport episode on the chemical compositions and size distributions of urban aerosols, such instruments as an online analyzer for monitoring aerosols and gases (MARGA) and a wide-range particle spectrometer (WPS) were mainly used to monitor chemical components, such as PM2.5 and aerosol size distributions in the range of 10 nm to 10 μm, in Nanjing in this study. During the dust episode, the average concentrations of PM2.5 and PM10 and ions of Ca2+, Mg2+, Cl, SO42−, NO3, and NH4+ were 66.2, 233.9, and 1.1, 1.5, 1.1, 11.4, 7.8 and 4.4 μg·m−3, which were 4.4, 5.8, 3.7, 15, 1.38, 1.84, 1.66 and 1.83 times higher than the values observed before the episode and 2.2, 3.3, 5.5, 5.0, 1.57, 1.97, 1.39 and 1.69 times the levels after the episode. The dusts were demonstrated to have differential impacts on the water-soluble gases in the air. During the dust episode, the concentrations of HCl, SO2 and NH3 were comparably low, while the HNO2 and HNO3 concentrations were high. The diurnal variations in pollutants, including SO2, HNO3, Cl, Ca2+, Mg2+, PM2.5 and PM10, were strongly impacted by the dust episode. However, those variations in NH3, NO3, SO42− and NH4+ were only slightly influenced. Pollutants were distinctively featured in the various dust stages. The concentration of HNO2 was relatively high in the earliest stage but was substituted by those of SO2, PM10, PM2.5, Ca2+, Mg2+ HNO3 and Cl in the explosion stage. The aerosol number concentrations exhibited unimodal distributions in the earliest and explosion stages but showed bimodal distributions in the duration and dissipation stages. Additionally, the aerosol size distributions were observed to shift to larger particle segments in different dust stages. The surface area concentrations exhibited four peaks in different dust stages and exhibited trimodal distributions in the non-dust episode. The surface area concentration of fine particles first increased during the earliest stage, while that of coarse particles first decreased during the dissipation stage.

1. Introduction

As one of the major components of atmospheric aerosols, dust aerosols account for 50% of global aerosols [1,2]. Dust aerosols can influence the energy balance of the Earth’s atmosphere by absorbing and scattering solar radiation and surface radiation and can change cloud microphysical structures, development scales and lifespans by acting as cloud condensation nuclei [3,4,5,6,7]. Simultaneously, dust aerosols may serve as the reaction interfaces for heterogeneous reactions that further influence atmospheric chemical processes [8,9,10]. In addition, dust aerosols delivered upward can experience long-range transportation and subsequently affect Earth’s biological cycles when the aerosols sink to the ground and the ocean [11,12,13].
East Asia is a major source of dust in the world. The estimates for annual global dust emissions range from 1000 to 3000 trillion grams (Tg), and Asian deserts are assumed to constitute 10–25% of the total [14,15,16]. The Taklimakan and Gobi Deserts in southern Mongolia and northern China, respectively, are two major active sources of East Asian dust [17]. The Gobi Desert in Mongolia and the Taklimakan and Badain Juran Deserts in northwestern China contribute approximately 70% of the total Asian dust emissions [18]. Most dust storms in China originate from the Taklimakan Desert, the Hexi Corridor, and the desert regions of central and western Inner Mongolia [19,20,21]. The dusts may exhibit long-range transport processes after they are delivered to higher altitudes. Furthermore, dusts can participate in a global cycle if they are uplifted to the upper troposphere, approximately 8–10 km above the Earth’s surface [22,23].
In recent years, research concerning sand mechanisms, dynamic characteristics, physicochemical properties, transport pathways and environmental climate effects of dusts has been extensively conducted [24,25,26,27]. Mori et al. [28] found that the mass concentrations of dust rapidly declined with the transport processes. The mass concentration of aerosol was 6700 μg·m−3 in the Chinese interior (in and around the Inner Mongolia Autonomous Region), 1500 μg·m−3 in Beijing, China, and 230 μg·m−3 at a remote island in Japan. Seinfeld et al. [29] carried out comprehensive surface, airborne, shipboard, and satellite measurements of Asian aerosol chemical composition, size, optical properties, and radiative impacts during the Asian Pacific Regional Aerosol Characterization Experiment (ACE-Asia) study, which was a first-time assessment of the regional climatic and chemical effects of a continental-scale mixture of dust and pollution. Huang et al. [30] discovered that the effective particle diameters of ice clouds, optical depths and ice water paths of cirrus clouds under dust polluted conditions were 11%, 32.8%, and 42% smaller than those particle diameters derived from ice clouds in dust-free atmospheric environments. Chen et al. [31] indicate that weather conditions, topography, and surface types in dust source regions may influence dust emission, uplift height, and transportation at the regional scale by using the WRF-CHEM model. Guo et al. [32] consider observations and modeling to demonstrate how a typical springtime dust episode develops and how the dust particles can travel over the North Pacific Ocean to North America. By using satellite data, Li et al. [33] discovered that the vertical structure of dust plumes, the layer-integrated color ratio and the depolarization ratio all indicated variable climate effects (e.g., the direct radiative impact) via mineral dust, dependent on the event being observed in Central Asia.
As one of the major urban agglomerations in East Asia, the Yangtze River Delta (YRD) has a developed economy, intensive urban cities and large populations. As general anthropogenic activities that are accompanied by unfavorable weather conditions, dust storms can cause severe air pollution problems with high particulate matter concentrations in urban environments [34,35]. Huang et al. [35] discovered that the vertical profiles of PM10 and PM2.5 concentrations showed maxima at altitudes between 0.2 km and 1.3 km by model simulation during a dust episode from 28 April to 5 May in 2011. The observational results during two dust processes in 2010 also suggested that Asian dust particles were not homogeneously mixed with anthropogenic pollutants, and the consecutive transport of anthropogenic air masses and dust plumes had occurred [36]. Huang et al. [37] found that the northeastern dust reached Shanghai with high acidity and became a mixed aerosol with interactions among dust, local pollutants, and sea salts. A heavy dust episode occurred from 3 to 8 May 2017 in East Asia. This episode affected more than ten provinces in China from the north to the south with an influenced area of over 1.63 million km2. The YRD region was seldom impacted over 3 consecutive days during this episode. To explore the impacts of this long-range dust transport episode on the urban aerosols’ chemical compositions and size distributions, such instruments as an online analyzer for monitoring aerosols and gases (MARGA) and a wide-range particle spectrometer (WPS) were mainly used to monitor aerosol chemical components, such as PM2.5 and size distributions in the range of 10 nm to 10 μm, in Nanjing in this study. This dust episode was divided into four stages, including I: the earliest stage, II: the explosion stage, III: the duration stage, and IV: the dissipation stage. Consequently, the aerosol chemical components and size distributions at different dust stages were also discussed.

2. Materials and Methods

2.1. Data Origins

The PM2.5 and PM10 concentration data were mainly obtained from the national urban air quality real-time release platform of the China National Environmental Monitoring Center (http://106.37.208.233:20035/) with a time resolution of 1 h. Aerosol size distribution and water-soluble ions (WSIs) were measured from the top of the Meteorological building at Nanjing University of Information Science and Technology (NUIST, Figure 1) with an altitude of 40 m. Meteorological data were from the observation, training and practice base of the China Meteorological Administration (Nanjing) on the campus of NUIST at a 1 h time resolution. The observation period was from 1 to 10 May 2017.

2.2. Instruments

A Wide-Range Particle Spectrometer (WPS, MSP Corporation model 1000XP) was used to measure aerosol number concentrations for sizes ranging from 10 nm to 10 μm with a time resolution of 5 min. This instrument combines the principles of differential mobility analysis (DMA), condensation particle counting (CPC) and laser light scattering (LPS). DMA and CPC are used for measuring particles in the size range of 10–500 nm, and LPS is used for measuring particles in the range of 0.35 to 10 µm. Concentrations in the cross-measurement range (0.35–0.5 μm) have discrepancies due to their different principles. Instrument details can be found in Wang et al. [38]. We used a drying tube in the sheath air inlet section to eliminate the effects of high relative humidity (RH) on the data. Parts of invalid data were rejected, as well, and 2198 groups of number spectra data in total were derived from the observation.
A model ADI 2080 online analyzer for monitoring for aerosols and gases (MARGA, Applikon Analytical B.V., Netherlands) [39] was employed to obtain gases and water-soluble ions. The MARGA detection system has the ability to measuring mass concentrations of major water-soluble inorganic ions in aerosols (NH4+, Na+, K+, Ca2+, Mg2+, SO42−, NO3, Cl) and trace gases (HCl, HNO2, SO2, HNO3, NH3) at a 1 h time resolution. Instrument details can be found in the cited references [40,41]. Two hundred twenty-eight groups of data were derived for the chemical components, while the HCl, Ca2+, Mg2+, Cl, Na+ and K+ data had missing measurements of 76, 70, 58, 44, 220 and 213 groups, therefore, the Na+ and K+ data were not discussed in this paper.

2.3. Air Mass Backward Trajectories

Air mass backward trajectories over 48 h were calculated and presented in Figure 1. The trajectories were simulated using the Hybrid Single-Particle Lagrangian Integrated Trajectory (HYSPLIT) model, which was developed by the National Oceanic and Atmospheric Administration (NOAA) Air Resources Laboratory (ARL) [42]. The backward trajectories were calculated at 12:00 (LST) and at 1000 m above the observation sites. The National Weather Service’s National Centers for Environmental Prediction (NCEP) Global Data Assimilation System (GDAS) archive was used for meteorological input data.

3. Results and Discussion

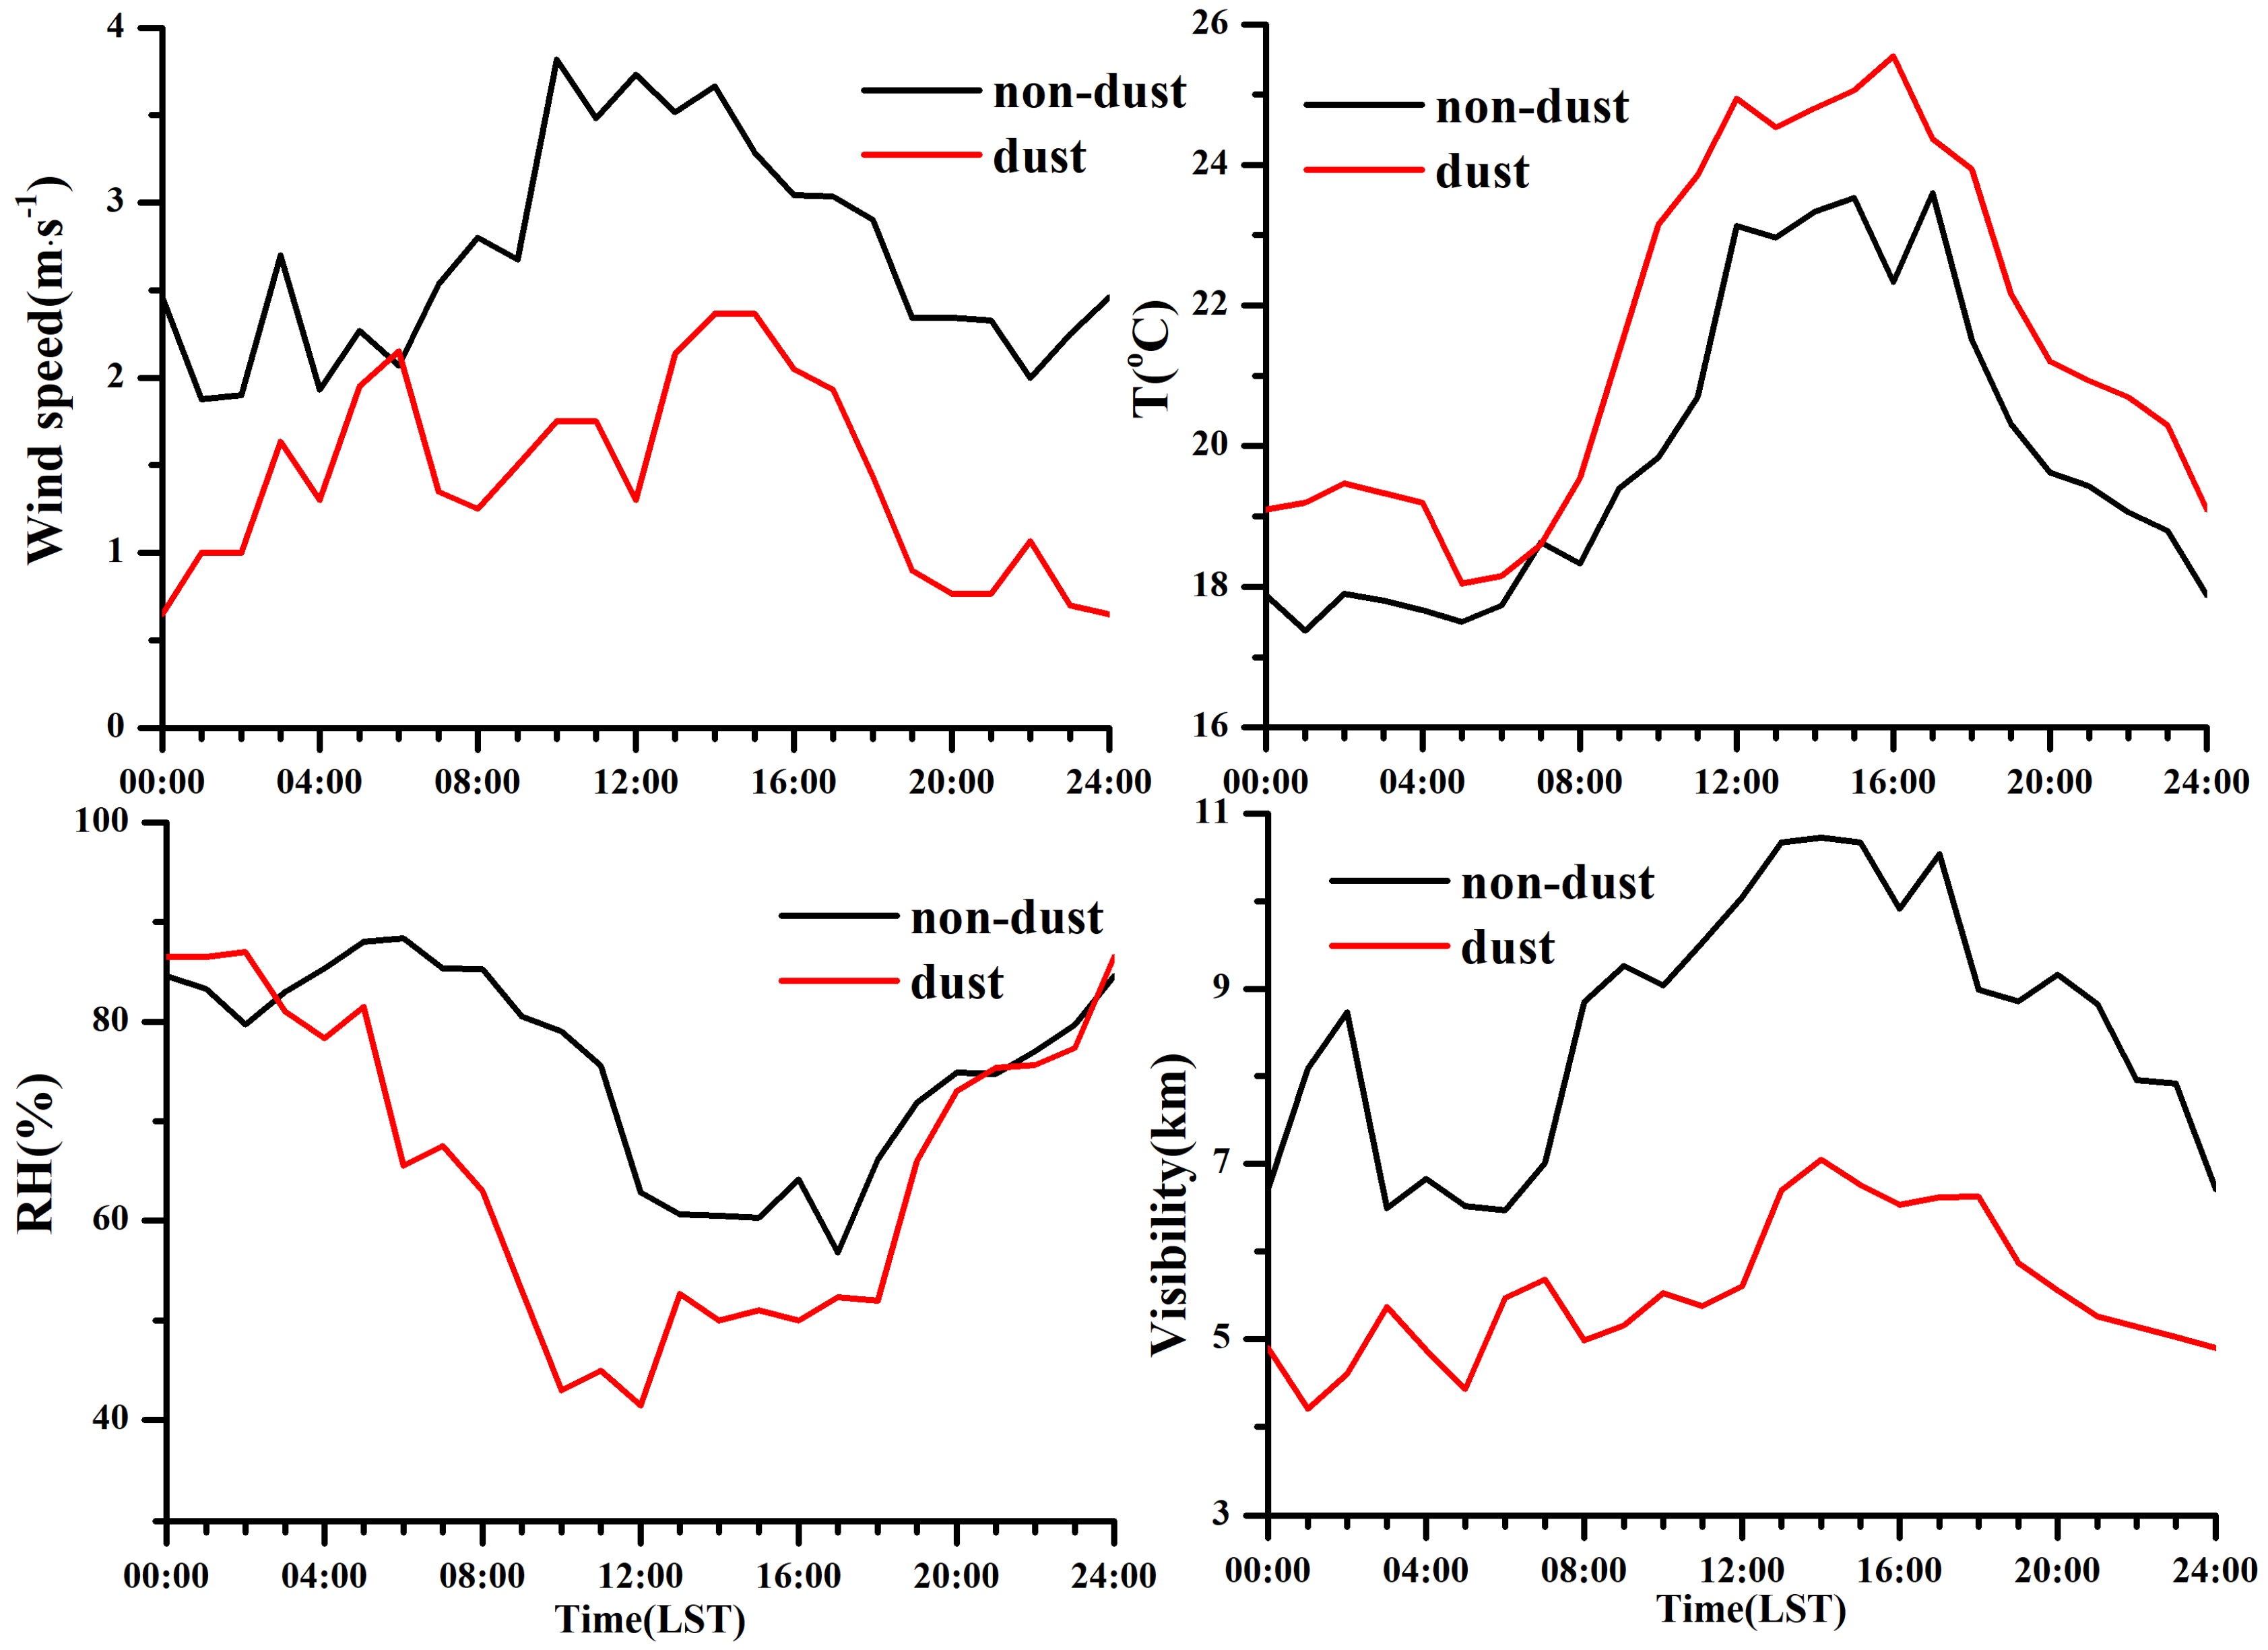
3.1. General Characteristics of the Dust Episode

A heavy dust episode occurred from 3 to 8 May 2017 in China. Dusty weather occurred in several provinces and cities, including southern Xinjiang Basin, central and western Gansu, Ningxia, inner Mongolia, northern Shanxi, central and northern Shanxi, northern Hebei, Beijing, western Jilin, Southwestern Heilongjiang, Shandong, Jiangsu, Hubei and northern Hunan. Dust storms even occurred in some districts of inner Mongolia. The influence areas exceeded 1.63 million km2. An upward airflow that was generated by divergence at high altitudes and convergence near the ground in the sand source regions uplifted the dust into the air and transported it eastwards over northern China, where a downward airflow was generated below the altitude of 700 hPa due to convergence at high altitudes and divergence near the ground, which mainly resulted in this heavy dust episode. Besides for the southerly movement of a Mongolian cyclone, the YRD region was barely impacted by this long-range dust transport episode.
Figure 2 illustrates that the concentrations of PM10 and PM2.5 were relatively low with average values of 40.5 and 15.0 μg·m−3 (Table 1) before the dust impacted Nanjing. From 1 to 3 May, Nanjing was characterized by large easterly wind with an average wind speed of 3 m·s−1, a high RH with an average value of 65.8% and a mean visibility of 8.8 km. Two precipitation events occurred on 2 and 4 May, and the maximum hourly precipitation was 20.7 mm for the latter event. The PM concentrations decreased inordinately but were only scavenged slightly due to their low levels. However, the precipitation on 4 May had significant scavenging effects on WSIs in PM2.5, the concentrations of which were 29.8 and 5.4 μg·m−3 before and after the precipitation, respectively. After 4 May, the dominant wind was transferred from east to north, indicating the influence of the Mongolian cyclone.
Around 13:00 on 5 May, Nanjing was initially impacted by a dust episode, resulting in a gradual PM increase. At 05:00 on 6 May, the PM10 concentrations explosively increased as the dust impacted Nanjing. By 11:00 on 6 May, the PM10 concentrations had increased by 315 μg·m−3 in 6 h with a maximum level of 481 μg·m−3. The PM2.5 concentrations also increased from 49 to 88 μg·m−3 during the same time period. After that step, the PM concentrations were continuously high due to the constant influence of dust. Table 1 lists that the average concentrations of PM2.5 and PM10 were 66.2 and 233.9 μg·m−3 during the dust episode. A cold air occurred on 8 May, which featured a temperature decrease from 20 °C at 04:00 to 14.7 °C at 10:00 and a precipitation event. Consequently, the PM concentrations were reduced and maintained at lower levels with mean values of 30.1 and 70.8 μg·m−3 for PM2.5 and PM10, respectively, after this cold air. The impacts of dust pollution disappeared, as well.
Figure 1 reveals that southeastern air masses were dominant at an altitude of 1 km in Nanjing from 1–4 May. On 5 May, the northerly air masses became dominant, leading to the initial influences of dust pollution on Nanjing. On 6 May and 7 May, the northwestern air masses, mostly from the sand source regions, were dominant, indicating a continuous impact of dust pollution. On 8 May, the southerly air masses dominated. The intersection of warm air masses rich in water vapor and inland air masses resulted in a precipitation event in Nanjing, indicating the end of dust pollution. On 9 May and 10 May, although the northerly air masses prevailed, the dust air masses moved into the ocean and had no impacts on the YRD region.
Figure 2 displays that the WSI concentrations rapidly increased when the dust began to impact Nanjing, especially for those secondary ions of NH4+, SO42− and NO3. Additionally, these WSIs varied in different dust stages. This long-range dust transport episode occurred after a strong precipitation event, which favors our discussion of the impacts of dust pollution on WSIs in PM2.5 and aerosol size distributions.

3.2. Impacts of Dust on Aerosol Chemical Components

Table 1 shows that the WSIs in PM2.5 increased inordinately during the dust period. These minerals created ions of Ca2+ and Mg2+ and caused a sharp increase with average values of 1.1 and 1.5 μg·m−3 during the dust, which were 3.7 and 15 times larger than the values before the dust and 5.5 and 5.0 times larger than those after the dust. During the dust episode, the average concentrations of SO42−, NO3 and NH4+ were 11.4, 7.8 and 4.4, accounting for 41.8%, 28.6% and 16.1% of the total ion concentrations, the concentrations of which were 1.84, 1.66, and 1.83 higher than values before the dust and 1.97, 1.39 and 1.69 times higher than values after the dust, respectively. The Cl ion was scarcely impacted by the dust with an average concentration of 1.1 μg·m−3 during the dust, which was 1.38 and 1.57 times the levels before and after the dust, respectively. The mass concentrations of PM2.5 and PM10 during the dust were 4.41 and 5.78, and 2.20 and 3.30 times larger than values before and after the dust, respectively (Table 1). The secondary ions that accounted for large proportions of the PM2.5 concentrations had a weak increase range compared to those of PM10, which suggested that these ions were probably from local emissions and were weakly impacted by the dust episode. According to Table 1, the RH during the dust episode (63.6%) was considerably lower than that before and after the dust episode. The conditions of low RHs were therefore detrimental to the formation of the secondary inorganic salt.
Table 1 lists that the ratios of SO42−/NH4+ were 2.58, 2.59 and 2.23 before, during and after the dust, and were much lower than the results observed during the 2013 dust process in southeastern Italy [43]. Besides, the levels derived in our study were much lower than the stoichiometric ratios for ammonium sulfate (2.66) and ammonium bisulfate (5.38), indicating that ammonium is sufficient for completely neutralizing sulfate. The ratios of NO3/NH4+ were 1.96, 1.77 and 2.15 before, during and after the dust, respectively, which were smaller than the stoichiometric ratio for ammonium nitrate (2.44), indicating that there was a sufficient amount of ammonium to completely neutralize the nitrate. Simultaneously, the ratios of SO42−/Ca2+ before, during and after the dust (20.67, 10.36 and 29.0, respectively) were significantly larger than the stoichiometric value for CaSO4 (2.4). The ratios of NO3/Ca2+ before, during and after the dust (15.67, 7.09 and 28.0, respectively) were significantly larger than the stoichiometric value for Ca(NO3)2 (3.1). This finding suggests that during the dust event, the dominant forms of secondary sulfate and nitrate are ammonium sulfate and ammonium nitrate, rather than calcium sulfate and calcium nitrate.
Table 1 also reveals that the dust episode had different influences on soluble gases in the air. During the dust period, the gaseous concentrations of HCl, SO2 and NH3 were 0.8, 0.9 and 0.84 times the values observed before the dust. However, the HNO2 and HNO3 concentrations during the dust were elevated and were 2.04 and 1.5 times larger than those before the dust. Nie et al. [41] discovered the phenomena of dust-promoted particle nucleation and growth along with HONO production at Mt. Heng. During the dust episode, the acidic gases, comprising of HCl, HNO2, HNO3 and SO2, were 1.33, 1.31, 1.33 and 3.63 times higher than the values observed after the dust. However, the amount of alkaline gas of NH3 during the dust was 0.85 times the value after the dust. Although the northerly air masses were uniformly dominant during and after the dust, they were comparably clean for the latter after a strong cold air process (Figure 1). In addition, acidic gases are likely to participate in reactions under rich alkaline conditions. Consequently, the acidic gases had lower concentrations after the dust.
Table 2 illustrates that the impacts of this dust episode on PM concentrations in the YRD region were similar to those during previous episodes. The PM2.5 concentration influenced by the dust in Nanjing was analogous to those in Shanghai and Nanjing during the dust episode on 26 and 27 April 2010 [36,44]. but was higher than the level impacted by the dust during 1 to 5 May 2011 in Nanjing [45]. The PM10 concentration during this episode was similar to that during the 2010 episode and was lower than the value during the 2010 episode. During the dust episode of 2010, the PM levels in Shanghai were smaller than those in Nanjing. By comparison, the PM2.5 concentration had a maximum value of 637.9 μg·m−3 at the dust source of Tongyu and was 242.5 μg·m−3, 116.15 μg·m−3 and 137.6 μg·m−3 in Chengdu, Beijing and Xi’an, respectively. This fact confirmed that the PM concentrations decreased constantly during the long-range dust transport episode.
During the dust episode of 2010, the WSI concentrations in PM2.5 in Shanghai were larger than values in Nanjing, especially for those of SO42−, NH4+, Mg2+ and Ca2+, which were 1.17, 1.93, 1.82 and 1.39 times higher. The various pollutant sources in different cities resulted in this phenomenon.
The Cl concentrations had little discrepancy between this dust episode and the other dust episodes in the YRD region, suggesting a weak impact of the dust on city Cl levels. However, the Cl concentration in our study was 0.58, 0.37 and 0.5 times the levels in Tongyu, Chengdu and Xi’an, respectively, which revealed that the long-range dust transport episode probably increased the Cl concentration. The ions of NO3 and NH4+ had the largest differences between distinct dust processes, and the SO42− was impacted slightly by different dust episodes. These secondary ions that are capable of reacting at the surface of dusts may have more complex sources and variations during a dust episode. The Ca2+ and Mg2+ concentrations were positively related to the impact scope and transportation speed of the dust.
Figure 3 shows that the diurnal variations of PM2.5 and PM10 were similar during the dust, peaking between 04:00 and 13:00 when the dust had the strongest influence. The diurnal variations of SO2, HNO3, Cl, Mg2+ and Ca2+ were uniformly identical with those of the PMs, suggesting an impact from the foreign transportation process. Figure 4 exhibits that the wind speed during the dust episode was smaller than that during the non-dust episode, and simultaneously, the trajectories during the dust were mostly short (Figure 1). Low wind speeds exacerbated the PM pollution and led to a sharp decrease in visibility. The visibility during the dust episode was much lower than that during the non-dust episode and decreased to its minimum value between 08:00 and 12:00 when the PM concentrations were the highest.
Figure 3 reveals that the secondary inorganic ions, comprising of NO3, SO42− and NH4+, had stable diurnal variations during the dust episode. These secondary ions were not the major components of the dust and were difficult to generate under low RH conditions during the dust.
The diurnal variation of NH3 was impacted slightly by the dust episode, the peak of which was merely delayed by 2 h, according to Figure 3. The HNO2 peak occurred during the nighttime and had a similar diurnal variation to that of RH, suggesting that its source originated from a gas-liquid heterogeneous reaction on the surface of the dust.

3.3. Variations of Chemical Components in the Different Developing Stages of Dust

To better discuss the impacts of the dust episode on aerosol components, four developing stages of dust were determined in this study. I: the earliest stage, II: the explosion stage, III: the duration stage, and IV: the dissipation stage. Additionally, the non-dust period was classified into rainy days and sunny days.
Figure 5 presents the variations of air pollutants during the different developing stages of dust. The concentrations of SO2, PM10, PM2.5, Ca2+ and Mg2+ were comparably high in the explosion and duration stages and were low in the earliest and dissipation stages. The PM concentrations during the dust episode were uniformly higher than the values during the non-dust episode. The variations of Ca2+ and Mg2+ ions conformed to those of the PMs. The SO2 concentration was the lowest in the earliest dust stage but was higher on rainy and sunny days compared to the levels from the dissipation dust stage. HNO2 had relatively high concentrations during the earliest and duration stages, which affirmed the results of Nie et al. [50] from 2009 at Mt. Heng. HNO3 had the highest concentration in the explosion and duration stages and had low values in the earliest and dissipation stages. The concentrations of HCl had slight discrepancies during different stages of dust, suggesting weak impacts from the dust episode.
The ion concentration of Cl was much larger during the explosion stage as compared to the levels in other dust stages, which demonstrated that Cl was affected greatly by the foreign transport process in the explosion stage and by local emissions in other stages. The sources of Cl in the air were complex and mostly the result of coal burning, waste incineration [51], and the long-range transport of sea salt [52]. Figure 5 shows that the Mg2+ concentration was the highest in the explosion stage. Continiet et al. [53] discovered that the sea salt was abundant in ions of Na+, Cl and Mg2+, which illustrated that the Cl during the dust may be from the long-range transport of sea salt. Figure 1 shows that the air masses during the observation period were mainly from the ocean, which resulted in the equivalent Cl concentrations observed on rainy and sunny days.
The secondary WSIs had large discrepancies between different dust stages. The SO42− concentration was ranked in the order of the duration stage > the earliest stage > the explosion stage > the dissipation stage. In addition, SO42− had higher concentrations during the dust episode as compared to the levels during the non-dust episode, suggesting a foreign transport process of SO42−. Moreover, SO42− was weakly impacted by the precipitation event, resulting in the minor concentration discrepancy observed between rainy and sunny days. The NO3 concentration was much higher in the duration stage as compared to values in other dust stages, and simultaneously, it exhibited few differences between the explosion and dissipation dust stages and the non-dust episode.

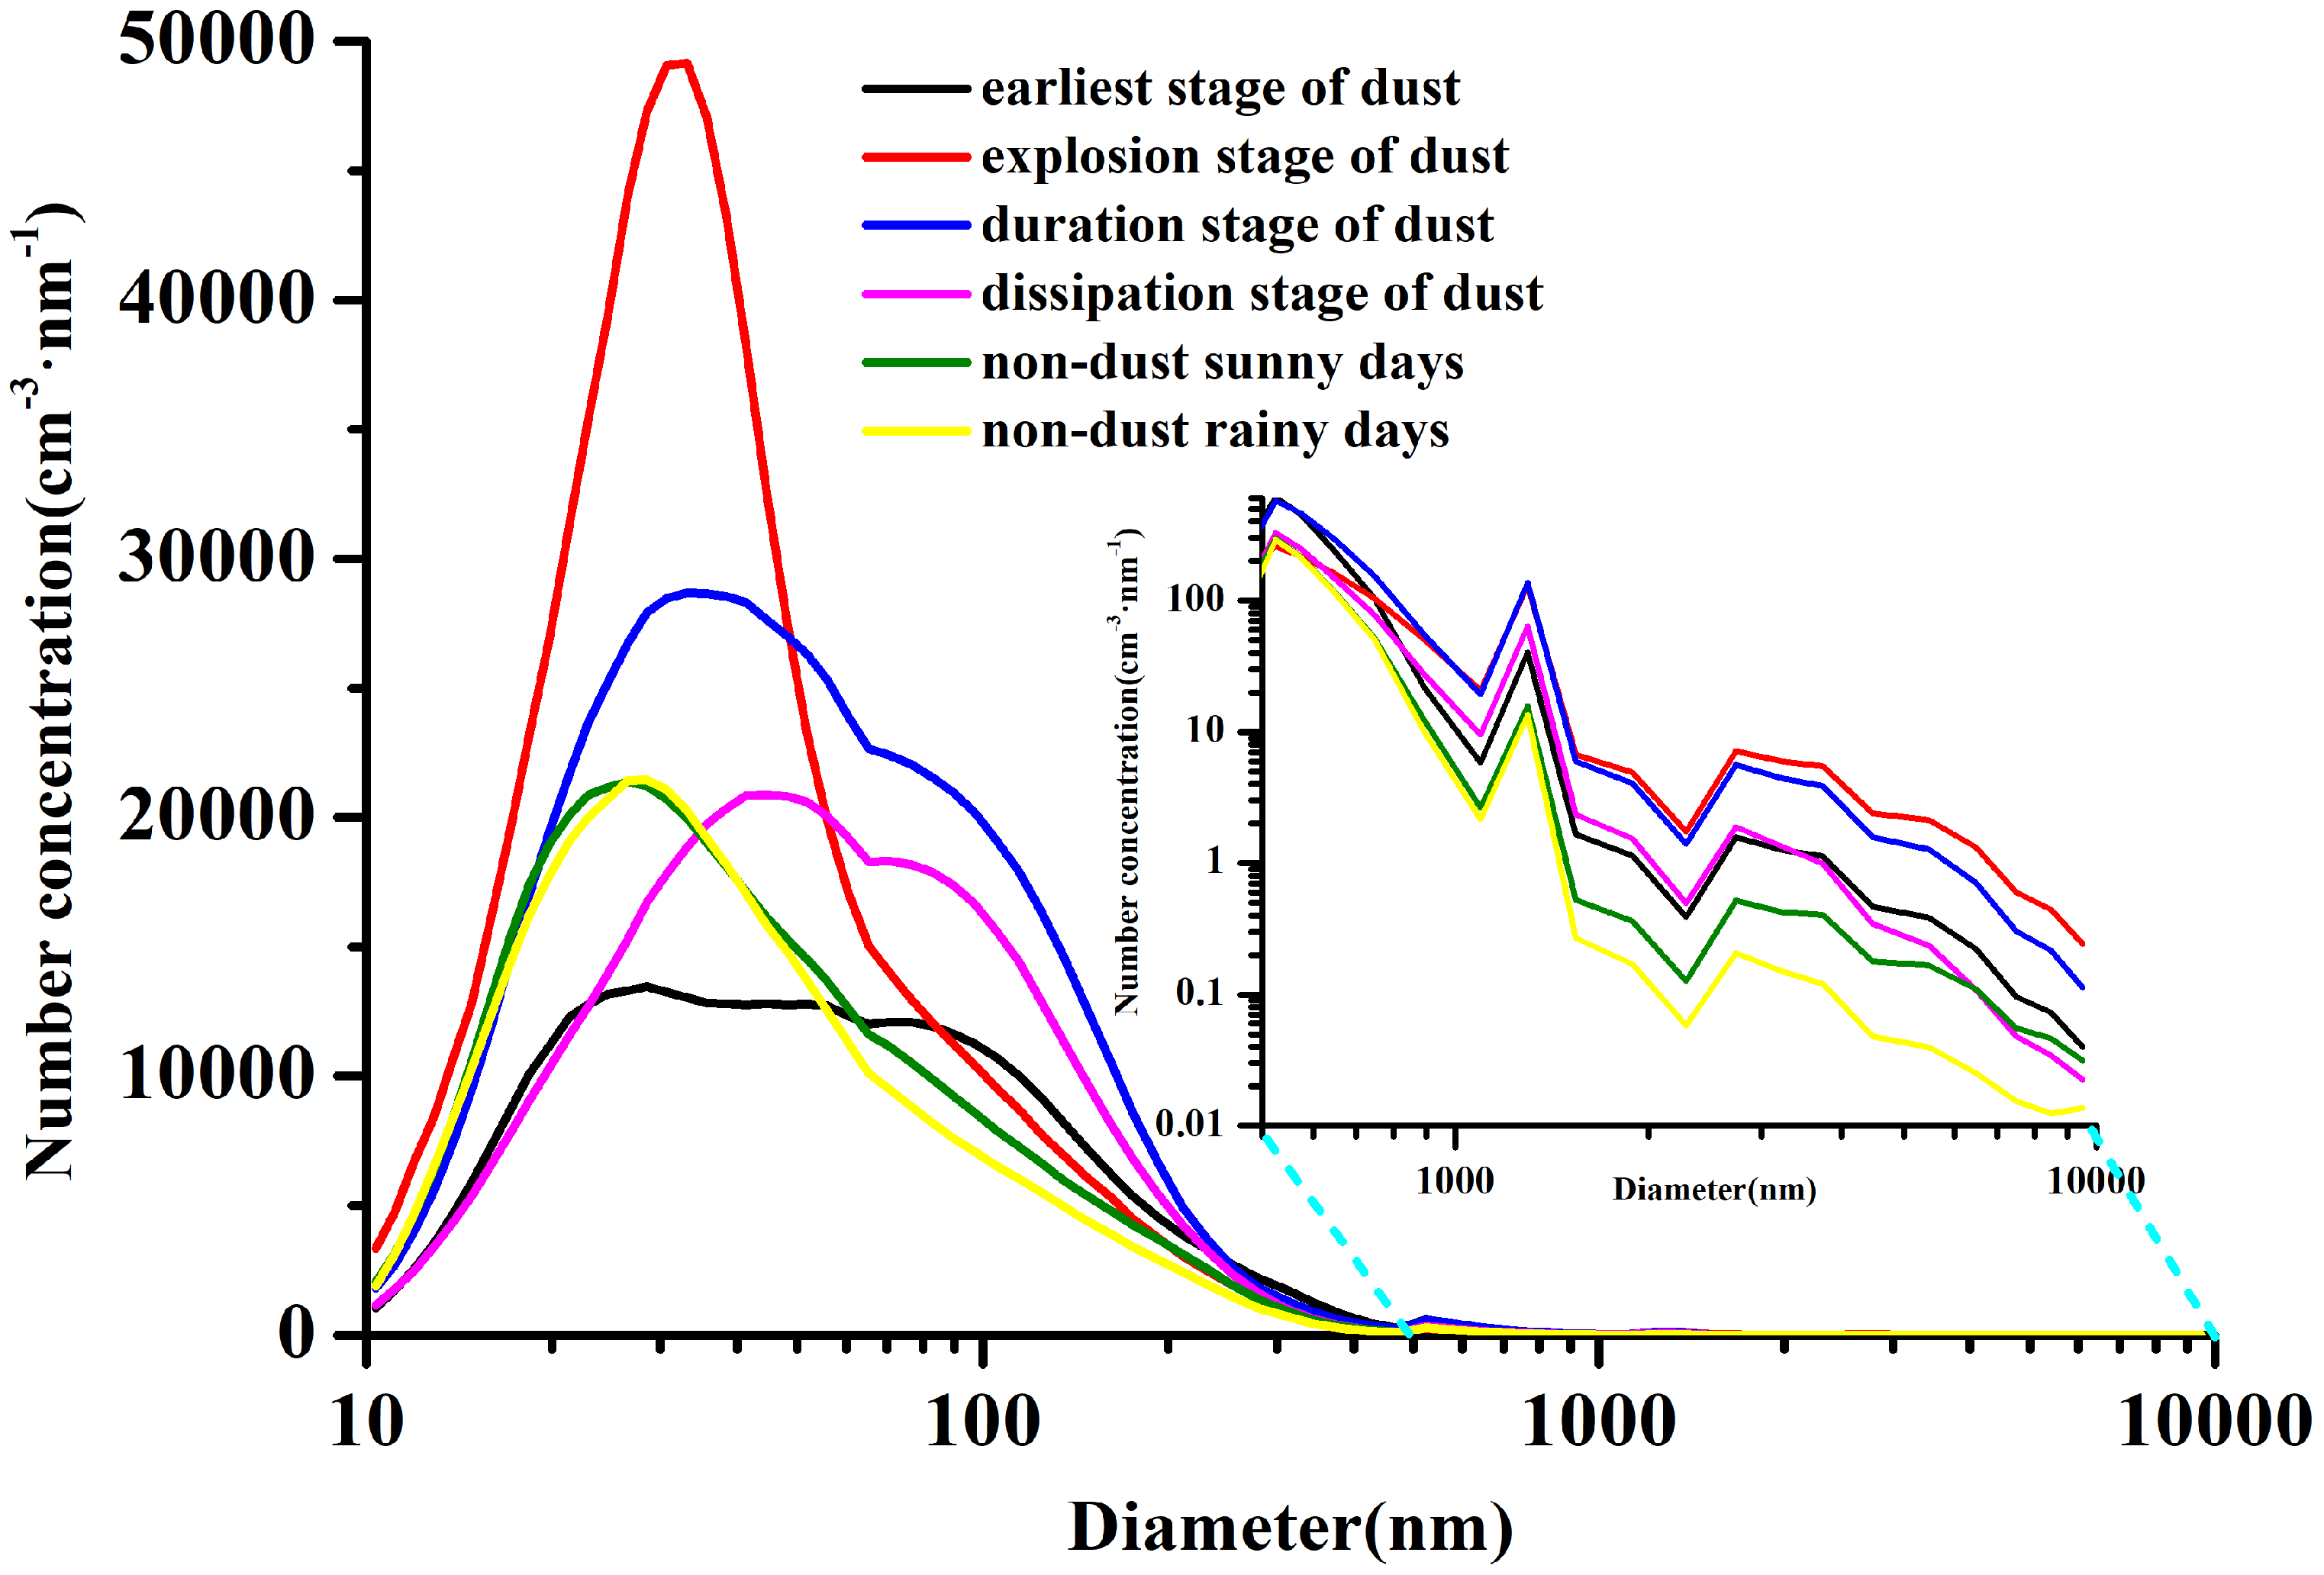
3.4. Aerosol Size Distributions at Different Developing Stages of Dust

Figure 6 displays the size distribution of aerosol number concentration during the different dust stages. During the earliest stage, the number concentration spectrum had the lowest peak level and the largest peak width at 20–100 nm. During the explosion stage, the spectrum had a unimodal distribution and exhibited its highest peak value at 30–35 nm. During the duration and dissipation stages, the spectra distributions were bimodal and peaked at 30-40 nm and 90–100 nm in the duration stage and at 40–50 nm and 90–100 nm in the dissipation stage, respectively. During the non-dust episode, the spectrum distribution was unimodal, peaking at 25–30 nm on rainy and sunny days. The number concentration spectra moved inordinately to larger particle segments in different dust stages.
Although the PM10 concentrations elevated sharply during the dust period, the aerosol number concentration during the whole period was mainly focused at 10–500 nm, which accounted for 99% of the total number concentration (Figure 6). The coarse mode particle aerosols had high growth multiples, although their number concentrations were low (100 cm−3·nm−1). For example, in the explosion stage, the aerosol number concentrations at 10–800 nm were 0.88–2.43 (with an average of 1.60) and 0.87–2.48 (with an average of 1.45) times the values on rainy days and sunny days; however, the concentrations at 800 nm–10 μm were 5.01–53.87 and 4.10–14.02 times larger than the values on rainy and sunny days.
Figure 7 displays the size distribution of aerosol surface area concentrations during the different dust stages. The surface area concentrations of aerosol exhibited four peaks at different dust stages and trimodal distributions during the non-dust episode. The peaks in the earliest dust stage were similar to those in non-dust episode, except for particles of 2 to 5 μm impacted by the dust. During the explosion, duration and dissipation stages, the first peaks were uniformly located at 150–160 nm, which shifted to fine particle segments compared to those of the non-dust episode. The peaks of surface area concentration were intensively impacted by the different dust stages. The peaks at 230 nm and 520 nm were affected greatly during the earliest stage. In the explosion stage, the peaks at 2–7 μm had the largest values and reached 241 μm2·cm−3·nm−1 at 3.7 μm, which was 13.6, 4.9 and 5.5 times larger than the levels on sunny days and during the earliest and dissipation dust stages, respectively. The four peaks during the duration stage were generally high with a maximum value of 864 μm2·cm−3·nm−1 at 150 nm. The size distribution during the dissipation stage was similar to that of the duration stage with the exception of a descendent peak value at 2–7 μm. In conclusion, the surface area concentration of fine particles first increased when the dust periphery reached Nanjing. During the explosion dust stage, the surface area concentrations of coarse particles increased sharply, resulting in a rapid decrease of visibility. In the duration stage, the surface area concentrations reached their maximum values, and the particles at the whole sizes rapidly increased, leading to the worst air quality. During the dissipation stage, the surface area concentrations of coarse particles decreased, while the fine particles maintained high levels, suggesting an impact of the dust on fine particles.

4. Conclusions

A large-range heavy dust episode occurred from 3 to 8 May 2017 in China, with an influence area exceeding 1.63 million km2. Along with the southerly movement of a Mongolian cyclone, the YRD region was seldom impacted by this long-range dust transport episode. The PM and WSIs elevated inordinately during the dust episode. The average concentrations of PM2.5, PM10, and ions of Ca2+, Mg2+, Cl, SO42−, NO3, and NH4+ were 66.2, 233.9, 1.1, 1.5, 1.1, 11.4, 7.8 and 4.4 μg·m−3, respectively, which were 4.4, 5.8, 3.7, 15, 1.38, 1.84, 1.66 and 1.83 times higher than values before the episode and 2.2, 3.3, 5.5, 5.0, 1.57, 1.97, 1.39 and 1.69 times the levels after the episode, respectively. Dusts were demonstrated to have different impacts on water soluble gases in the air. During the dust episode, the concentrations of HCl, SO2 and NH3 were comparably low, while those of HNO2 and HNO3 were high. The diurnal variations of pollutants, including SO2, HNO3, Cl, Ca2+, Mg2+ PM2.5 and PM10, were impacted strongly by the dust. However, those of NH3, NO3, SO42 and NH4+ were slightly influenced.
This dust episode was divided into four stages. I: the earliest stage, II: the explosion stage, III: the duration stage, and IV: the dissipation stage. Additionally, the non-dust period was classified into rainy days and sunny days. The concentrations of SO2, PM10, PM2.5, Ca2+ and Mg2+ were comparably high during the explosion and duration stages. HNO2 had relatively high concentrations during the earliest and duration stages. HNO3 had the highest concentration during the explosion and duration stages. The ion concentration of Cl was much larger during the explosion stage as compared to the levels at other dust stages. The concentrations of HCl, NO3, SO42− and NH4+ had minor discrepancies between different dust stages. During the earliest stage, the number concentration spectrum had the lowest peak level and the largest peak width at 20–100 nm. During the explosion stage, the spectrum had a unimodal distribution and had the highest peak value at 30–35 nm. During the duration and dissipation stages, the spectra distributions were bimodal, which peaked at 30–40 nm and 90–100 nm during the duration stage and at 40–50 nm and 90–100 nm during the dissipation stage, respectively. The surface area concentrations exhibited four peaks during different dust stages and trimodal distributions during the non-dust episode. The surface area concentrations of fine particles increased first, and those of coarse particles also ultimately increased when the dust affected Nanjing. However, the surface area concentrations of the coarse particles first decreased during the dissipation stage.

Author Contributions

Conceptualization, H.W.; Methodology, X.W., L.S. and Z.G.; Visualization, L.S. and Z.G.; Investigation, Z.G. and H.X.; Writing-Original Draft Preparation, Z.G. and L.S.; and Writing-Review and Editing, L.S., Z.G., X.W. and H.W.

Funding

This research was funded by the National Key Research and Development Program of China (2017YFC0212603), the National Natural Science Foundation of China (41805096 and 41575132), the Natural Science Foundation of Jiangsu Province (BK20180801), the Natural Science Research Project for Universities of Jiangsu Province, China (18KJB170011), Opening Project of Shanghai Key Laboratory of Atmospheric Particle Pollution and Prevention (LAP3) (FDLAP18006) and the Startup Foundation for Introducing Talent of NUIST (2016r040).

Conflicts of Interest

The authors declare no conflict of interest.

References

  1. Zender, C.S.; Miller, R.; Tegen, I. Quantifying mineral dust mass budgets: Terminology, constraints, and current estimates. Eos Trans. Am. Geophys. Union 2004, 85, 509–512. [Google Scholar] [CrossRef]
  2. Andreae, M.O. Climatic effects of changing atmospheric aerosol levels. World Surv. Climatol. 1995, 16, 347–398. [Google Scholar]
  3. Slingo, A.; Ackerman, T.P.; Allan, R.P.; Kassianov, E.I.; McFarlane, S.A.; Robinson, G.J.; Barnard, J.C.; Miller, M.A.; Harries, J.E.; Russell, J.E.; et al. Observations of the impact of a major Saharan dust storm on the atmospheric radiation balance. Geophys. Res. Lett. 2006, 33. [Google Scholar] [CrossRef]
  4. Kumar, R.; Barth, M.C.; Pfister, G.G.; Naja, M.; Brasseur, G.P. WRF-Chem simulations of a typical pre-monsoon dust storm in northern India: Influences on aerosol optical properties and radiation budget. Atmos. Chem. Phys. 2014, 14, 2431–2446. [Google Scholar] [CrossRef]
  5. Li, T.; Wang, Y.; Zhou, J.; Wang, T.; Ding, A.; Nie, W.; Xue, L.; Wang, X.; Wang, W. Evolution of trace elements in the planetary boundary layer in southern China: Effects of dust storms and aerosol-cloud interactions. J. Geophys. Res. 2017, 122, 3492–3506. [Google Scholar] [CrossRef]
  6. Kumar, P.; Nenes, A.; Sokolik, I.N. Importance of adsorption for CCN activity and hygroscopic properties of mineral dust aerosol. Geophys. Res. Lett. 2009, 36. [Google Scholar] [CrossRef]
  7. Zhang, H.; McFarquhar, G.M.; Saleeby, S.M.; Cotton, W.R. Impacts of Saharan dust as CCN on the evolution of an idealized tropical cyclone. Geophys. Res. Lett. 2007, 34. [Google Scholar] [CrossRef]
  8. Ren, Y.Q.; Wang, G.H.; Li, J.J.; Wu, C.; Cao, C.; Li, J.; Wang, J.; Ge, S.; Xie, Y.; et al. Evolution of aerosol chemistry in Xi’an during the spring dust storm periods: Implications for heterogeneous formation of secondary organic aerosols on the dust surface. Chemosphere 2019, 215, 413–421. [Google Scholar] [CrossRef]
  9. Krueger, B.J.; Grassian, V.H.; Cowin, J.P.; Laskin, A. Heterogeneous chemistry of individual mineral dust particles from different dust source regions: The importance of particle mineralogy. Atmos. Environ. 2004, 38, 6253–6261. [Google Scholar] [CrossRef]
  10. Wu, C.; Wang, G.; Cao, C.; Li, J.; Li, J.; Wu, F.; Huang, R.; Cao, J.; Han, Y.; Ge, S.; et al. Chemical characteristics of airborne particles in Xi’an, inland China during dust storm episodes: Implications for heterogeneous formation of ammonium nitrate and enhancement of N-deposition. Environ. Pollut. 2019, 244, 877–884. [Google Scholar] [CrossRef]
  11. Wang, S.; Wang, J.; Zhou, Z.; Shang, K. Regional characteristics of three kinds of dust storm events in China. Atmos. Environ. 2005, 39, 509–520. [Google Scholar] [CrossRef]
  12. Han, Y.; Fang, X.; Zhao, T.; Kang, S. Long range trans-Pacific transport and deposition of Asian dust aerosols. J. Environ. Sci. 2008, 20, 424–428. [Google Scholar] [CrossRef]
  13. Prospero, J.M. Long-range transport of mineral dust in the global atmosphere: Impact of African dust on the environment of the southeastern United States. Proc. Natl. Acad. Sci. USA 1999, 96, 3396–3403. [Google Scholar] [CrossRef] [PubMed]
  14. Huang, J.; Wang, T.; Wang, W.; Li, Z.; Yan, H. Climate effects of dust aerosols over East Asian arid and semiarid regions. J. Geophys. Res. 2014, 119, 11–398. [Google Scholar] [CrossRef]
  15. Huang, J.; Minnis, P.; Yan, H.; Yi, Y.; Chen, B.; Zhang, L.; Ayers, J.K. Dust aerosol effect on semi-arid climate over Northwest China detected from A-Train satellite measurements. Atmos. Chem. Phys. 2010, 10, 6863–6872. [Google Scholar] [CrossRef]
  16. Tegen, I.; Schepanski, K. The global distribution of mineral dust. In IOP Conference Series: Earth and Environmental Science; IOP Publishing: Bristol, UK, 2009; Volume 7, p. 012001. [Google Scholar]
  17. Zhou, T.; Xie, H.; Bi, J.; Huang, Z.; Huang, J.; Shi, J.; Zhang, B.; Zhang, W. Lidar Measurements of Dust Aerosols during Three Field Campaigns in 2010, 2011 and 2012 over Northwestern China. Atmosphere 2018, 9, 173. [Google Scholar] [CrossRef]
  18. Zhang, X.Y.; Gong, S.L.; Zhao, T.L.; Arimoto, R.; Wang, Y.Q.; Zhou, Z.J. Sources of Asian dust and role of climate change versus desertification in Asian dust emission. Geophys. Res. Lett. 2003, 30, 2272. [Google Scholar] [CrossRef]
  19. Song, H.; Zhang, K.; Piao, S.; Wan, S. Spatial and temporal variations of spring dust emissions in northern China over the last 30 years. Atmos. Environ. 2016, 126, 117–127. [Google Scholar] [CrossRef]
  20. Wang, X.; Dong, Z.; Zhang, J.; Liu, L. Modern dust storms in China: An overview. J. Arid Environ. 2004, 58, 559–574. [Google Scholar] [CrossRef]
  21. Li, X.; Liu, X.; Yin, Z.Y. The Impacts of Taklimakan Dust Events on Chinese Urban Air Quality in 2015. Atmosphere 2018, 9, 281. [Google Scholar] [CrossRef]
  22. Zhang, X.Y.; Arimoto, R.; An, Z.S. Dust emission from chinese desert sources linked to variations in atmospheric circulation. J. Geophys. Res.-Atmos. 1997, 102, 28041–28047. [Google Scholar] [CrossRef]
  23. Uno, I.; Eguchi, K.; Yumimoto, K.; Takemura, T.; Shimizu, A.; Uematsu, M.; Liu, Z.; Wang, Z.; Hara, Y.; Sugimoto, N. Asian dust transported one full circuit around the globe. Nat. Geosci. 2009, 2, 557. [Google Scholar] [CrossRef]
  24. Kwon, H.J.; Cho, S.H.; Chun, Y.; Lagarde, F.; Pershagen, G. Effects of the Asian dust events on daily mortality in Seoul, Korea. Environ. Res. 2002, 90, 1–5. [Google Scholar] [CrossRef] [PubMed]
  25. Chen, Y.S.; Sheen, P.C.; Chen, E.R.; Liu, Y.K.; Wu, T.N.; Yang, C.Y. Effects of Asian dust storm events on daily mortality in Taipei, Taiwan. Environ. Res. 2004, 95, 151–155. [Google Scholar] [CrossRef] [PubMed]
  26. Parrington, J.R.; Zoller, W.H.; Aras, N.K. Asian dust: Seasonal transport to the Hawaiian Islands. Science 1983, 220, 195–197. [Google Scholar] [CrossRef] [PubMed]
  27. Shimizu, A.; Sugimoto, N.; Matsui, I.; Arao, K.; Uno, I.; Murayama, T.; Kagawa, N.; Aoki, K.; Uchiyama, A.; Yamazaki, A. Continuous observations of Asian dust and other aerosols by polarization lidars in China and Japan during ACE-Asia. J. Geophys. Res. 2004, 109, 109. [Google Scholar] [CrossRef]
  28. Mori, I.; Nishikawa, M.; Tanimura, T.; Quan, H. Change in size distribution and chemical composition of kosa (Asian dust) aerosol during long-range transport. Atmos. Environ. 2003, 37, 4253–4263. [Google Scholar] [CrossRef]
  29. Seinfeld, J.H.; Carmichael, G.R.; Arimoto, R.; Conant, W.C.; Brechtel, F.J.; Bates, T.S.; Cahill, T.A.; Clarke, A.D.; Doherty, S.J.; Flatau, P.J.; et al. ACE-ASIA: Regional climatic and atmospheric chemical effects of Asian dust and pollution. Bull. Am. Meteorol. Soc. 2004, 85, 367–380. [Google Scholar] [CrossRef]
  30. Huang, J.; Minnis, P.; Lin, B.; Wang, T.; Yi, Y.; Hu, Y.; Sun-Mack, S.; Ayers, K. Possible influences of Asian dust aerosols on cloud properties and radiative forcing observed from MODIS and CERES. Geophys. Res. Lett. 2006, 33. [Google Scholar] [CrossRef]
  31. Chen, S.; Huang, J.; Kang, L.; Wang, H.; Ma, X.; He, Y.; Yuan, T.; Yang, B.; Huang, Z.; Zhang, G. Emission, transport, and radiative effects of mineral dust from the Taklimakan and Gobi deserts: Comparison of measurements and model results. Atmos. Chem. Phys. 2017, 17, 2401–2421. [Google Scholar] [CrossRef]
  32. Guo, J.; Lou, M.; Miao, Y.; Wang, Y.; Zeng, Z.; Liu, H.; He, J.; Xu, H.; Wang, F.; Min, M.; Zhai, P. Trans-Pacific transport of dust aerosols from East Asia: Insights gained from multiple observations and modeling. Environ. Pollut. 2017, 230, 1030–1039. [Google Scholar] [CrossRef] [PubMed]
  33. Li, L.; Sokolik, I. Analysis of Dust Aerosol Retrievals Using Satellite Data in Central Asia. Atmosphere 2018, 9, 288. [Google Scholar] [CrossRef]
  34. Xiao, Z.M.; Zhang, Y.F.; Hong, S.M.; Bi, X.H.; Jiao, L.; Feng, Y.C.; Wang, Y.Q. Estimation of the main factors influencing haze, based on a long-term monitoring campaign in Hangzhou, China. Aerosol Air Qual. Res. 2011, 11, 873–882. [Google Scholar] [CrossRef]
  35. Huang, X.X.; Wang, T.J.; Jiang, F.; Liao, J.B.; Cai, Y.F.; Yin, C.Q.; Zhu, J.; Han, Y. Studies on a severe dust storm in East Asia and its impact on the air quality of Nanjing, China. Aerosol Air Qual. Res. 2013, 13, 179–193. [Google Scholar] [CrossRef]
  36. Wang, L.; Du, H.; Chen, J.; Zhang, M.; Huang, X.; Tan, H.; Kong, L.; Geng, F. Consecutive transport of anthropogenic air masses and dust storm plume: Two case events at Shanghai, China. Atmos. Res. 2013, 127, 22–33. [Google Scholar] [CrossRef]
  37. Huang, K.; Zhuang, G.; Li, J.; Wang, Q.; Sun, Y.; Lin, Y.; Fu, J.S. Mixing of Asian dust with pollution aerosol and the transformation of aerosol components during the dust storm over China in spring 2007. J. Geophys. Res. 2010, 115. [Google Scholar] [CrossRef]
  38. Wang, H.; An, J.; Shen, L.; Zhu, B.; Pan, C.; Liu, Z.; Liu, X.; Duan, Q.; Liu, X.; Wang, Y. Mechanism for the formation and microphysical characteristics of submicron aerosol during heavy haze pollution episode in the Yangtze River Delta, China. Sci. Total Environ. 2014, 490, 501–508. [Google Scholar] [CrossRef] [PubMed]
  39. Ten Brink, H.; Otjes, R.; Jongejan, P.; Slanina, S. An instrument for semi-continuous monitoring of the size-distribution of nitrate, ammonium, sulphate and chloride in aerosol. Atmos. Environ. 2007, 41, 2768–2779. [Google Scholar] [CrossRef]
  40. Du, H.; Kong, L.; Cheng, T.; Chen, J.; Du, J.; Li, L.; Xia, X.; Leng, C.; Huang, G. Insights into summertime haze pollution events over Shanghai based on online water-soluble ionic composition of aerosols. Atmos. Environ. 2011, 45, 5131–5137. [Google Scholar] [CrossRef]
  41. Wang, F.; Sun, Y.; Tao, Y.; Guo, Y.; Li, Z.; Zhao, X.; Zhou, S. Pollution characteristics in a dusty season based on highly time-resolved online measurements in northwest China. Sci. Total Environ. 2019, 650, 2545–2558. [Google Scholar] [CrossRef]
  42. Draxler, R.R.; Rolph, G.D. HYSPLIT (HYbrid Single-Particle Lagrangian Integrated Trajectory) Model access via NOAA ARL READY; NOAA Air Resources Laboratory: Silver Spring, MD, USA, 2012. [Google Scholar]
  43. Cesari, D.; Donateo, A.; Conte, M.; Merico, E.; Giangreco, A.; Giangreco, F.; Contini, D. An inter-comparison of PM2.5 at urban and urban background sites: Chemical characterization and source apportionment. Atmos. Res. 2016, 174, 106–119. [Google Scholar] [CrossRef]
  44. Zhang, Q.; Zhu, B.; Su, J.; Wang, H. Characteristics of Aerosol Water-Soluble Inorganic Ions in Three Types Air Pollution Incidents of Nanjing City. Environ. Sci. 2012, 33, 1944–1951. (In Chinese) [Google Scholar]
  45. Wang, H.; Shen, L.; Lv, S.; Li, L.; Yuan, J.; Zhang, X.; Wang, F. Distribution characteristics of aerosol size and water-soluble ions during a heavy pollution event in Yangtze River Delta. Ecol. Environ. Monit. Three Gorges 2018, 3, 34–47. [Google Scholar]
  46. Sun, Q.; Shao, L.; Li, H. Concentration Variation of Airborn Particles PM10 and PM2.5 Chemical Composition and Their Sources during Dust Events. China Powder Sci. Technol. 2010, 16, 35–40. [Google Scholar]
  47. Shen, Z.; Cao, J.; Arimoto, R.; Han, Z.; Zhang, R.; Han, Y.; Liu, S.; Okuda, T.; Nakao, S.; Tanaka, S. Ionic composition of TSP and PM2.5 during dust storms and air pollution episodes at Xi’an, China. Atmos. Environ. 2009, 43, 2911–2918. [Google Scholar] [CrossRef]
  48. Tao, J.; Zhang, L.; Engling, G.; Zhang, R.; Yang, Y.; Cao, J.; Zhu, C.; Wang, Q.; Luo, L. Chemical composition of PM2.5 in an urban environment in Chengdu, China: Importance of springtime dust storms and biomass burning. Atmos. Res. 2013, 122, 270–283. [Google Scholar] [CrossRef]
  49. Shen, Z.; Wang, X.; Zhang, R.; Ho, K.; Cao, J.; Zhang, M. Chemical composition of water-soluble ions and carbonate estimation in spring aerosol at a semi-arid site of Tongyu, China. Aerosol Air Qual. Res. 2011, 11, 360–368. [Google Scholar] [CrossRef]
  50. Nie, W.; Ding, A.; Wang, T.; Kerminen, V.; George, C.; Xue, L.; Wang, W.; Zhang, Q.; Petäjä, T.; Qi, X.; et al. Polluted dust promotes new particle formation and growth. Sci. Rep. 2014, 4, 6634. [Google Scholar] [CrossRef]
  51. Wang, H.; Zhu, B.; Shen, L.; Xu, H.; An, J.; Xue, G.; Cao, J. Water-soluble ions in atmospheric aerosols measured in five sites in the Yangtze River Delta, China: Size-fractionated, seasonal variations and sources. Atmos. Environ. 2015, 123, 370–379. [Google Scholar] [CrossRef]
  52. Wang, H.; An, J.; Cheng, M.; Shen, L.; Zhu, B.; Li, Y.; Wang, Y.; Duan, Q.; Sullivan, A.; Xia, L. One year online measurements of water-soluble ions at the industrially polluted town of Nanjing, China: Sources, seasonal and diurnal variations. Chemosphere 2016, 148, 526–536. [Google Scholar] [CrossRef]
  53. Contini, D.; Cesari, D.; Genga, A.; Siciliano, M.; Ielpo, P.; Guascito, M.R.; Conte, M. Source apportionment of size-segregated atmospheric particles based on the major water-soluble components in Lecce (Italy). Sci. Total Environ. 2014, 472, 248–261. [Google Scholar] [CrossRef] [PubMed]
Figure 1. Site information and the daily backward trajectories at 12:00 LST and 1000 m a.s.l. during the observation periods.
Atmosphere 10 00068 g001
Figure 2. Time series of air pollutants and meteorological elements during the observation period.
Atmosphere 10 00068 g002
Figure 3. Diurnal variations of chemical components during the dust and non-dust episodes.
Atmosphere 10 00068 g003
Figure 4. Diurnal variations of meteorological elements during the dust and non-dust episodes.
Atmosphere 10 00068 g004
Figure 5. Concentrations of chemical components and PMs at different dust stages.
Atmosphere 10 00068 g005
Figure 6. Size distribution of aerosol number concentrations during the different dust stages.
Atmosphere 10 00068 g006
Figure 7. Size distribution of aerosol surface area concentrations during the different dust stages.
Atmosphere 10 00068 g007
Table 1. Pollutant concentrations and meteorological elements during the dust and non-dust episodes.
Before the DustDuring the DustAfter the Dust
HCl (μg·m−3)0.50.40.3
HNO2 (μg·m−3)2.55.13.9
HNO3 (μg·m−3)0.81.20.9
SO2 (μg·m−3)9.78.72.4
NH3 (μg·m−3)10.28.610.1
Cl (μg·m−3)0.81.10.7
NO3 (μg·m−3)4.77.85.6
SO42− (μg·m−3)6.211.45.8
NH4+ (μg·m−3)2.44.42.6
Mg2+ (μg·m−3)0.11.50.3
Ca2+ (μg·m−3)0.31.10.2
RH (%)75.663.671.8
Visibility (km)8.75.88.4
PM2.5 (μg·m−3)15.066.230.1
PM10 (μg·m−3)40.5233.970.8
Table 2. Mass concentrations of PMs and water-soluble ions in PM2.5.
Cl (μg·m−3)NO3 (μg·m−3)SO42− (μg·m−3)NH4+ (μg·m−3)Mg2+ (μg·m−3)Ca2+ (μg·m−3)PM2.5 (μg·m−3)PM10 (μg·m−3)
Nanjing1.17.811.44.41.51.166.2233.9
Shanghai [36]0.934.186.372.830.22.7670.7182.4
Nanjing [44]0.944.045.461.470.111.9973.33269.22
Nanjing [45]1.111.8711.22.880.161.1257.93302.07
Beijing [46]-5.6012.552.300.453.80116.15592.91
Xi’an [47]2.23.111.71.40.24.3137.6-
Chengdu [48]3.05.712.60.70.37.3242.5-
Tongyu [49]1.96.512.60.61.113.9637.9-
Notes: “-” represents a missing measurement. The water-soluble ions concentrations in article 44 and 45 refer to the corresponding contents in PM2.1.

