Article

Evaluation of Multi-Reanalysis Solar Radiation Products Using Global Surface Observations

1
School of Geography and Ocean Science, Jiangsu Provincial Key Laboratory of Geographic Information Science and Technology, Nanjing University, Nanjing 210023, China
2
Collaborative Innovation Center of Novel Software Technology and Industrialization, Nanjing University, Nanjing 210023, China
3
Nuclear and Radiation Safety Center, Ministry of Ecology and Environment of the People’s Republic of China, Beijing 100082, China
*
Authors to whom correspondence should be addressed.
Atmosphere 2019, 10(2), 42; https://doi.org/10.3390/atmos10020042
Submission received: 3 December 2018 / Revised: 11 January 2019 / Accepted: 19 January 2019 / Published: 22 January 2019
(This article belongs to the Section Biosphere/Hydrosphere/Land–Atmosphere Interactions)

Abstract

:
Solar radiation incident at the Earth’s surface is an essential driver of the energy exchange between the atmosphere and the surface and is also an important input variable in the research on the surface eco-hydrological process. The reanalysis solar radiation dataset is characterized by a long time series and wide spatial coverage and is used in the research of large-scale eco-hydrological processes. Due to certain errors in their production process of the reanalysis of solar radiation products, reanalysis products should be evaluated before application. In this study, three global solar-radiation reanalysis products (ERA-Interim; JRA-55; and NCEP-DOE) in different temporal scales and climate zones were evaluated using surface solar-radiation observations from the National Meteorological Information Center of the China Meteorological Administration (CMA, Beijing, China) and the Global Energy Balance Archive (GEBA, Zürich, Switzerland) from 2000 to 2009. All reanalysis products (ERA-Interim; JRA-55; and NCEP-DOE) overestimated with an annual bias of 14.86 W/m2, 22.61 W/m2, and 31.85 W/m2; monthly bias of 15.17 W/m2, 21.29 W/m2, and 36.91 W/m2; and seasonal bias of 15.08 W/m2, 21.21 W/m2, and 36.69 W/m2, respectively. In different Köppen climate zones, the annual solar radiation of ERA-Interim performed best in cold regions with a bias of 10.30 W/m2 and absolute relative error (ARE) of 8.98%. However, JRA-55 and NCEP-DOE showed the best performance in tropical regions with a bias of 20.08 W/m2 and −0.12 W/m2, and ARE of 11.00% and 9.68%, respectively. Overall, through the evaluations across different temporal and spatial scales, the rank of the three reanalysis products in order was the ERA-Interim, JRA-55, and NCEP-DOE. In addition, based on the evaluation, we analyzed the relationship between the error (ARE) of the reanalysis products and cloud cover, aerosol, and water vapor, which significantly influences solar radiation and we found that cloud was the main cause for errors in the three solar radiation reanalysis products. The above can provide a reference for the application and downscaling of the three solar radiation reanalysis products.

1. Introduction

Solar radiation is the main energy source on the Earth’s surface and the main driving force for global atmospheric, hydrologic, ecological, and biological processes [1,2,3]. Solar radiation mainly includes direct radiation and diffuse radiation. Direct radiation is part of the energy of solar rays that attenuate after passing through the atmosphere without changing direction. Diffuse radiation refers to the part of the energy of solar rays that return to the ground after being scattered by atmospheric particles, aerosols, and other matters. Over complex terrain, reflected radiation from the surrounding terrain is also important, especially over snow surfaces. Therefore, solar radiation varies spatially due to different climatic characteristics, land cover, and topographic reliefs. For the eco-hydrological and atmospheric processes model, the solar radiation dataset is an important input [4,5,6].
There are mainly four solutions for solar radiation modeling from a global scale or local scale: the atmospheric radiation transfer model, remote sensing retrieval, calculation based on the empirical equations, and solar radiation reanalysis datasets. Atmospheric radiation transfer models have a relatively good physical mechanism, but are computationally very expensive. In the recent years, several remote sensing products were released with high spatial and temporal resolution. However, remote sensing solar radiation products are still limited by the temporal resolution of polar satellite and spatial coverage for geostationary satellite [7,8,9,10]. The method based on empirical equations rely on surface observation data of which the sparsity will limit its application [11]. In comparison, reanalysis products can provide solar radiation data with a relatively long time series and high space coverage.
The National Center for Environmental Prediction (NCEP, College Park, MD, USA), the European Centre for Medium-Range Weather Forecasts (ECMWF, Reading, UK), and the Japan Meteorological Agency (JMA, Tokyo, Japan) are three representative organizations that produce reanalysis datasets. The reanalysis products of the above organizations are widely used in studies on climate change and eco-hydrology. For example, reanalysis datasets of solar radiation are used to detect long-term climate trends [12,13,14], generate atmospheric forcing data [15], and investigate the water and energy exchanges between the Earth’s surface and the atmosphere [16,17]. As such, solar radiation is an important component of reanalysis products. However, solar radiation reanalysis products are generated by the assimilation system based on observation data and numerical weather prediction models, so it is still required to evaluate the errors and adaptability before its practical application due to the sparsity of observation sites and the model errors of the assimilation system [16,18,19,20].
Solar radiation reanalysis has been verified at different temporal and spatial scales based on ground station observation data [19,21,22,23]. Xia et al. [24] evaluated the NCEP solar radiation products in China using the China Meteorological Administration’s (CMA, Beijing, China) ground observation data, and found that the monthly bias of the NCEP reanalysis dataset was between 40 W/m2 and 100 W/m2. Jia et al. [25] evaluated two solar radiation reanalysis products (ERA-Interim and NCEP-DOE) using the CMA’s ground observation data in China and found that the monthly mean biases of two reanalysis datasets were 25.1 W/m2 (ERA-Interim) and 46.1 W/m2 (NCEP-DOE). By using observation sites taken from GEBA, Hicke et al. [26] found that the annual mean bias of NCEP-DOE was 46.55 W/m2 at a global scale. Based on nine stations of CAMP/Tibet, Wang and Zeng [27] found that in the area of the Qinghai–Tibet Plateau, six reanalysis products (MERRA, NCEP-NCAR, ERA-40, ERA-Interim, CFSR, and GLDAS) overestimated ground-observation, and daily solar radiation bias ranged from about 1.56 W/m2 to 5.00 W/m2. The evaluations of the solar radiation reanalysis datasets in the above-mentioned studies are from aspects of monthly and annual bias at a regional scale, and few are for exploring the performance of reanalysis data from the global scale and different climate zones. As such, these studies can neither characterize the overall accuracy of reanalysis products at a global scale, nor provide strong evidence for the applicability of solar radiation datasets to different climate regions. Therefore, we evaluated three solar radiation reanalysis datasets using global ground observations, and the errors were assessed from different temporal scales (monthly, seasonal, and annual) and in different climate zones (Köppen’s climatic zones) to provide reasonable suggestions for the application of solar radiation reanalysis products at different temporal and spatial scales or climate zones.
Furthermore, the error sources of the reanalysis surface radiation products were explored in this paper. Solar radiation reaching the ground is significantly affected by the Earth’s atmosphere including cloud, aerosols, water vapor, and atmospheric gases [28,29,30], leading to a very large spatial-temporal difference in solar radiation on the ground in different regions. Therefore, the relationship between aerosol, cloud cover, and water vapor remotely-sensed datasets and the error of the solar radiation reanalysis datasets were calculated for different products and different climate zones to find the main error sources for each solar radiation reanalysis dataset in different climate zones.
The rest of the paper is organized as follows. The data source and evaluation indicator used in this study are introduced in Section 2. Section 3 evaluates three solar radiation reanalysis datasets (ERA-Interim, JRA-55, and NCEP-DOE) based on the ground station solar radiation data from two observation networks (GEBA and CMA), and Section 4 discusses the error source of the reanalysis datasets in different climate zones. Our conclusions are presented in Section 5.

2. Data and Methods

2.1. Data Source

Ground observation data from the Global Energy Balance Archive (GEBA, Zürich, Switzerland) and China Meteorological Administration (CMA, Beijing, China) between 2000 and 2009 were used to evaluate the reanalysis datasets including the ERA-Interim, NCEP-DOE, and JRA-55. The MOD08 dataset including water vapor content, cloud cover, the optical thickness of the cloud, and the optical thickness of aerosols was used to analyze the error sources of the solar radiation reanalysis dataset. Details of the datasets used in this paper are shown in Table 1.

2.1.1. Ground Observation Data

The GEBA is a flux observation data archive for global energy that was developed and maintained by ETH Zurich (Switzerland). The GEBA provides more than 2500 station-observed data, and the database contains 15 surface energy flux variables. The data are collected from the World Radiation Data Centre (WRDC) in St. Petersburg (Russia), meteorological service centers of various countries, multiple observation networks (BSRN, ARM, and SURFRAD), and some data records. The monthly average relative random error (root mean square error) of the GEBA observation value of solar radiation is 5%, and the annual mean error is 2% [31]. The CMA dataset shows monthly and yearly meteorological data from normal weather stations published by the National Meteorological Information Center of China and includes variables like solar radiation, temperature drop, and air temperature. The distribution of the observation sites used in this study is shown in Figure 1.

2.1.2. ERA-Interim

ERA-Interim is a global atmospheric reanalysis dataset produced by the European Centre for Medium-Range Weather Forecasts (ECMWF, Reading, UK) with data available since 1979. ERA-Interim projects began in 2006 with the aim of improving the previous reanalysis data, the ERA-40. The data assimilation system used for generating ERA-Interim data is IFS (Cy31r2) launched by ECMWF in 2006. Compared with ERA-40, the spatial resolution of the ERA-Interim dataset has improved by 0.75° (about 80 km) and the temporal resolution is 3 h. The solar radiation calculation is based on the rapid radiation transfer model (RRTM) [33].

2.1.3. JRA-55

The time coverage of JRA-55 covers 1958 to 2013. Compared with JRA-25, JRA-55 is based on a new data assimilation and prediction system and has reduced many defaults in the JRA-25 reanalysis. Its improvements include the use of a network with higher spatial resolution (0.5625°), the 4D-Var with variational bias correction (VarBC) for satellite radiation, and the import of greenhouse gases of which the density changes over time. The products thus obtained are much better than the JRA-25 products [34].

2.1.4. NCEP-DOE

NCEP-DOE was jointly developed by the National Center for Environmental Prediction (NCEP, College Park, MD, USA) and the United States Department of Energy (DOE, Washington, DC, USA), and can be deemed as the continuation of the NCEP/NCAR plan for global atmosphere reanalysis data from 1979 to the present. The numerical prediction model, assimilation scheme, and observation systems used are roughly the same as the NCEP/NCAR, but there are some existing error problems in the NCEP/NCAR, which are known to have been revised. Furthermore, it can be taken as basic data for the verification of the Second Atmospheric Model Intercomparison Project (AMIP). Its horizontal resolution is 1.9°, the temporal resolution is 6 h, and the vertical resolution is 28 layers [35].

2.1.5. MOD08

To analyze the error sources of reanalysis solar radiation datasets, we used the aerosol optical thickness, cloud cover, cloud optical thickness, and water vapor from MOD08 that is a monthly 1 × 1 degree grid average atmosphere product from MODIS. The product provides means, standard deviations, uncertainty estimates, and statistics of atmosphere parameters for fractions of pixels that satisfy some condition [36].

2.2. Evaluation Indicator

The evaluation was carried out based on the bias, absolute relative error (ARE), correlation coefficient (R), and root mean square error (RMSE) between the reanalysis data and observations. Bias was used to measure the deviation of the predicted value of the reanalysis data from the observation data. ARE can be used to compare the quality of different reanalysis data and the observation data at the same level more precisely. RMSE can be taken as another indicator for measuring the accuracy of the reanalysis data results. R can be used to represent the consistency of the reanalysis data with the observation data. In addition, the partial correlation coefficient (PCC) was used to measure the relationship between the atmospheric parameters of cloud cover, AOD, and water vapor and error (ARE) of solar radiation. PCC can measure the correlation between one climatic factor among multiple mutually influenced climatic factors and evaluate reanalysis products. The calculation equations are
B i a s = i = 1 N ( y i x i ) N
A R E = i = 1 N | y i x i | x i N   ×   100
R M S E = ( y i x i ) 2 n
R = t = 1 n ( x t x ¯ ) ( y t y ¯ ) t = 1 n ( x t x ¯ ) 2 t = 1 n ( y t y ¯ ) 2
where y i refers to the predicted data; x i refers to the observation data; and N refers to the number of observation sites [37].
P C C y u = r u   m + 1 r u u r m + 1   m + 1 ( y > u )
R x y = [ R 1   1 R 1   2 R 2   1 R 2   2 R 1   m R 1   m + 1 R 2   m R 2   m + 1           R m   1 R m   2 R m + 1   1 R m + 1   2 R m   m R m   m + 1 R m + 1   m R m + 1   m + 1 ]
where R x y is the correlation coefficient matrix between y (the ( m + 1 ) -th variable) and x 1 , x 2 , , x m , and R x y 1 , whose ( u , v ) -th element is r u v , is the inverse of the matrix R x y . Therefore, the partial correlation coefficient between the y and u -th variable is shown as Equation (5) [38].

2.3. Köppen Climatic Classification

The accuracy of solar radiation products is affected by different climate types [39]. Therefore, the surface solar radiation needs to be evaluated in different climatic zones. The Köppen climate classification is one of the most widely used climate classification systems. It was first published by the Russian climatologist Wladimir Köppen (1846–1940). The climate classification system has been modified by his collaborators and successors. It is still in widespread use. Based on a large global data set of long-term monthly precipitation and temperature station time series, Peel et al. [40] updated the global map of the Köppen–Geiger climate classification. The updated world Köppen–Geiger climate map is freely available electronically [41]. Because of the complex classification and limited observation sites, we adopt five basic climatic zones (i.e., arid, cold, polar, temperate, and tropical), as shown in Figure 1.

3. Validation Results of Reanalysis Solar Radiation Using Ground Measurements

Solar radiation from ERA-Interim, JRA-55, and NCEP-DOE from 2000–2009 were evaluated using 804 global ground stations that were selected by quality control files from the GEBA and CMA, respectively. We compared the reanalysis solar radiation with ground observations directly because the interpolations of station measurements to reduce the scale effects between points and the grid cell will also introduce other errors [27] and the monthly representation errors of surface sites are relatively small [42]. The annual, seasonal, and monthly solar radiation were evaluated at a global scale and different climate zones, respectively. Four seasons were classified as MAM (March, April, and May), JJA (June, July, and August), SON (September, October, and November), and DJF (December, January and February).

3.1. Evaluation of Reanalysis Solar Radiation at a Global Scale

Table 2 shows the evaluation results of the annual, seasonal, and monthly solar radiation of three reanalysis products using ground measurements. The annual solar radiation reanalysis products showed an overestimation with biases of 14.86 W/m2, 22.61 W/m2, and 31.85 W/m2 for the ERA-Interim, JRA-55, and NCEP-DOE, respectively. The monthly and seasonal solar radiation reanalysis also performed an overestimation. In different seasons, the bias was the lowest in DJF and the highest in MAM for all reanalysis products. Comparing the biases of three solar radiation reanalysis products at different temporal scales, we found that the bias of ERA-Interim was the lowest and that of NCEP-DOE was the highest, which indicates that ERA-Interim performed better with relatively low bias.
ARE, unlike from bias, can quantify the precision of different reanalysis data at the same level. It showed a consistency in bias at all temporal scales where ERA-Interim performed the best and NCEP-DOE performed the worst out of all products by comparing the AREs of three solar radiation reanalysis datasets. For solar radiation reanalysis with different temporal scales, three products performed best with AREs of 11.62% for ERA-Interim, 16.27% for JRA-55, and 24.11% for NCEP-DOE in annual solar radiation when compared with the monthly and seasonal mean solar radiation. Meanwhile, seasonal solar radiation performed best in JJA among the four seasons for all products. For ERA-Interim, the ARE at different temporal scales were below 20%, except in DJF, indicating that ERA-Interim performed well at different temporal scales. However, the ARE of NCEP-DOE was larger than 20%, in particular, 40.05% was shown in DJF, which indicates that NCEP-DOE had larger uncertainty, especially in DJF. As such, ERA-Interim is a better choice for the application.
RMSE is a measure of the variation of reanalysis values around the measured values. From Table 2, we can see that ERA-Interim had a smaller RMSE at all temporal scales than the other two products, indicating that ERA-Interim showed a smaller variation from the ground measurements and was more stable. The smallest RMSE occurred in DJF for JRA-55 and NCEP-DOE, but in SON for ERA-Interim across all temporal scales. The correlation coefficient, which shows the consistency between the reanalysis and ground measured solar radiation, also indicated that ERA-Interim performed the best across different temporal scales among the three reanalysis products.
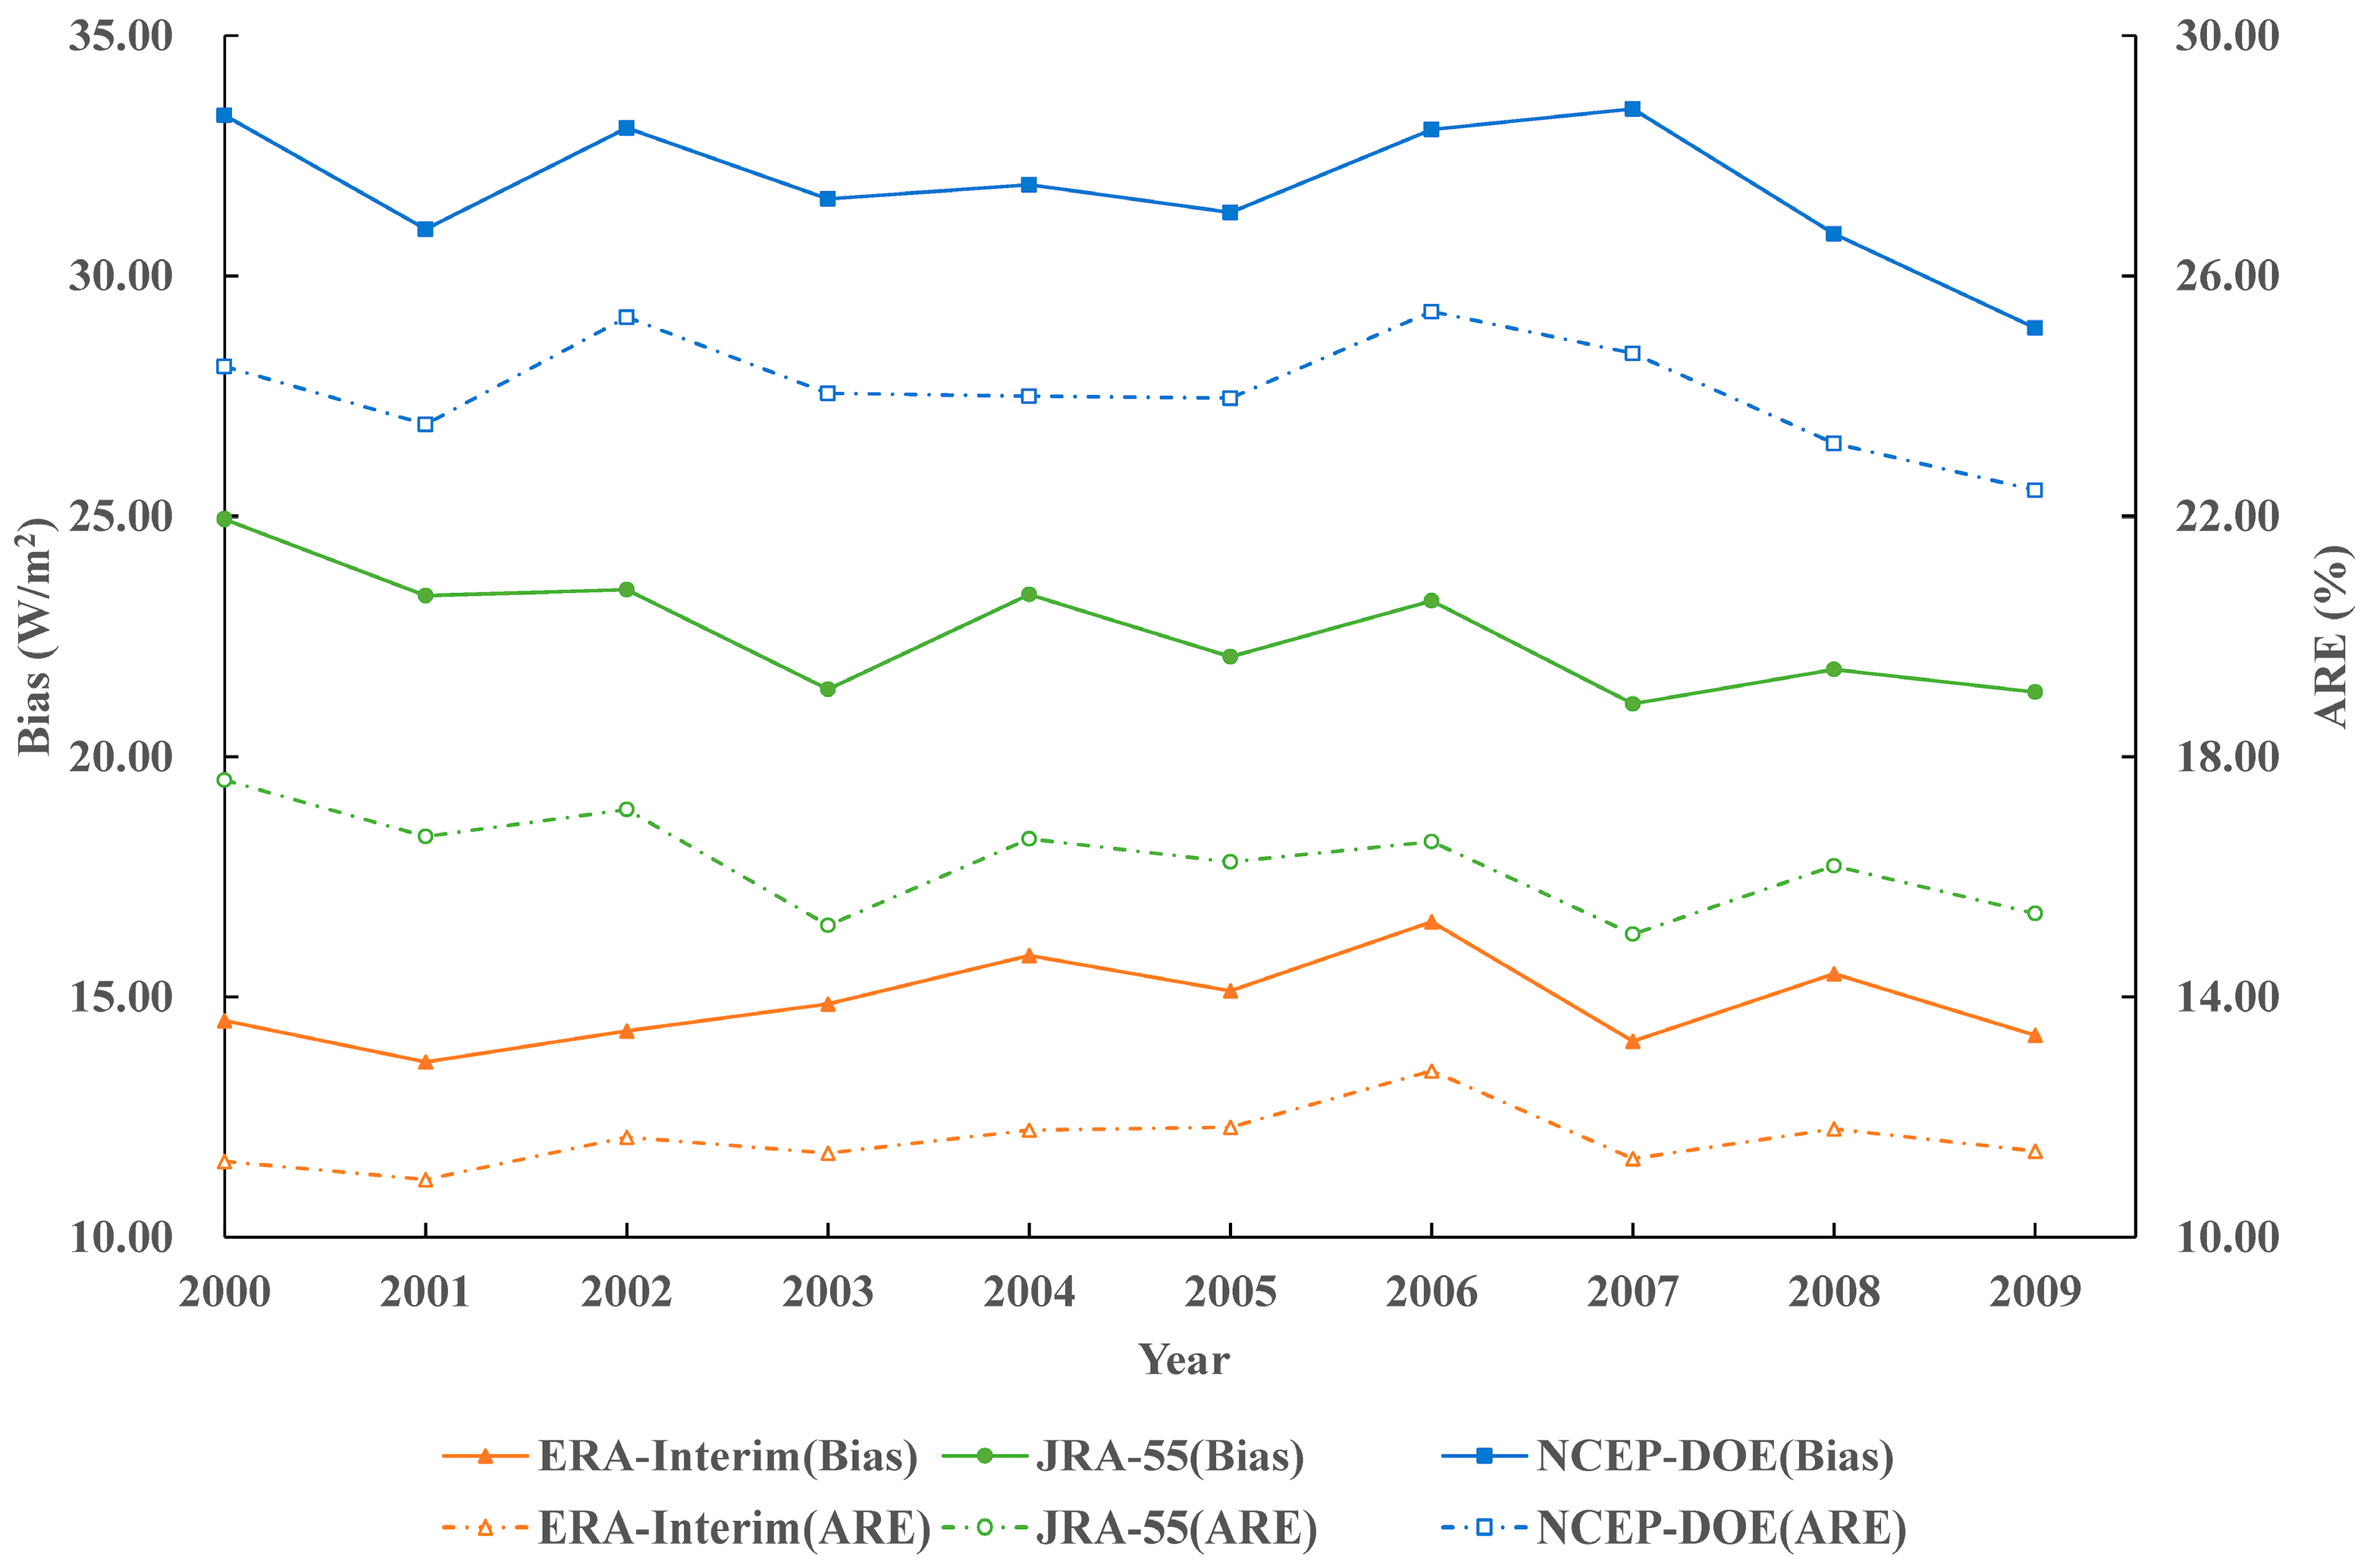
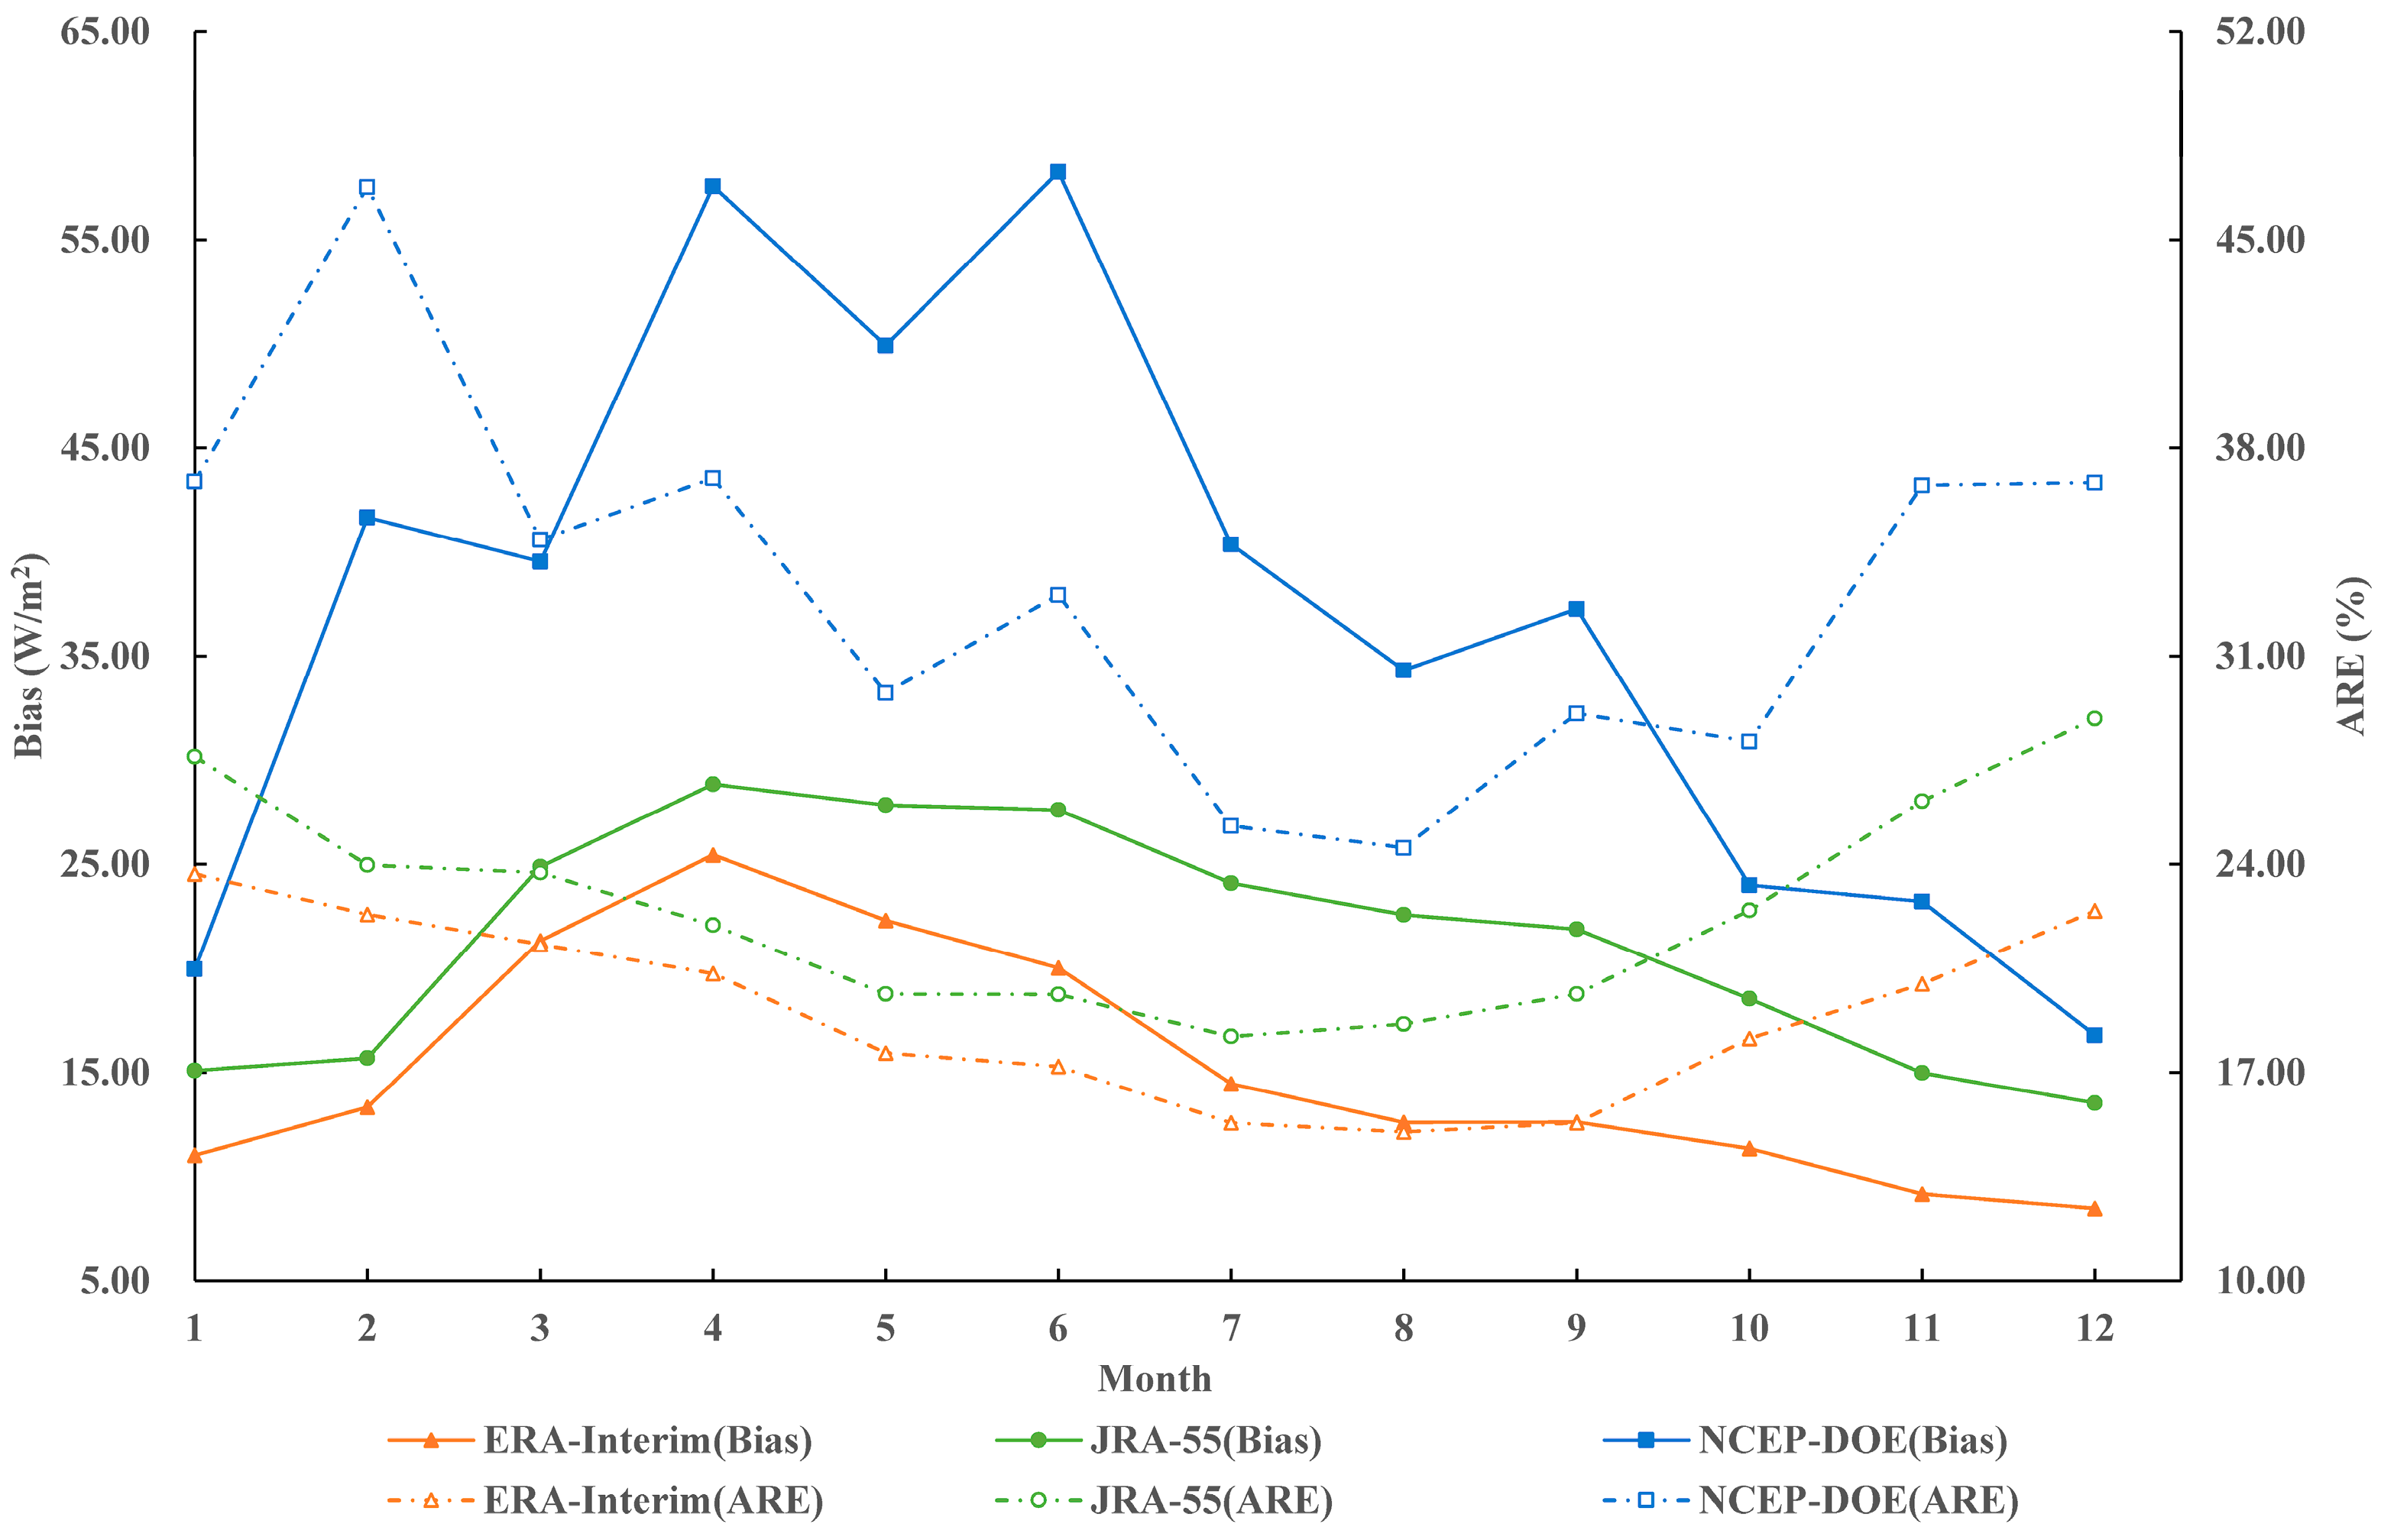
Figure 2 and Figure 3 show the annual and monthly changes of bias and ARE between 2000 and 2009. Based on Figure 2, it indicates that ERA-Interim very clearly performed the best in all years. During the 10 years, the annual bias of NCEP-DOE had the largest fluctuation value of −0.49 W/m2, followed by JRA-55 with a fluctuation value of −0.40 W/m2. The annual bias of ERA-Interim had the smallest fluctuation value of −0.03 W/m2. Based on the inter-annual change of ARE, it showed the same trend with changes of bias during 2000 and 2009; however, between the three reanalysis products, the annual changes of bias or ARE showed a different pattern. Compared to the previous year, the bias and ARE of the ERA-Interim increased in 2003 and 2008, and decreased in 2007. However, NCEP-DOE had the opposite trend when compared with ERA-Interim. JRA-55 only showed a different trend to ERA-Interim in 2003. According to Figure 3, it was found that the trend of monthly bias was opposite to the monthly ARE. The monthly bias in the three products increased from January, peaked around April, then decreased. However, the monthly ARE decreased from January, reached a valley around July, and then increased. The reason for this may be that the solar radiation in July and August was larger, leading to the smaller ARE.
Overall, ERA-Interim performed the best during the period between 2000 and 2009 when compared with JRA-55 and NCEP-DOE under all evaluation indices. At different temporal scales, annual solar radiation performed the best for all products. Among the four seasons, the three products performed best in JJA by ARE, but had the lowest bias in DJF. NCEP-DOE in DJF should be carefully used as it had a relatively large ARE of 40.05%.

3.2. Evaluation of Solar Radiation in Different Climate Zones

We used Köppen’s climate zones [40] of arid, cold, polar, temperate, and tropical to distinguish the different climate types. The annual, seasonal, and monthly solar radiation in the five climatic zones were evaluated respectively to explore the performance of the three reanalysis products in different climate zones. Table 3 shows the evaluation results for the three reanalysis datasets in different climatic zones from 2000 to 2009. We only used the bias and ARE to evaluate the performance as the bias can measure the system bias and the ARE can represent the absolute error.
ERA-Interim overestimated in all climate zones, except in the Polar region in SON and DJF, which had a negative bias. We also found that ERA-Interim showed the lowest bias in the polar region with values of 2.12, 1.92, and 1.94 W/m2 for the annual, monthly, and seasonal solar radiation when compared with other climate zones. Based on the ARE, ERA-Interim performed the best in the cold region for annual solar radiation with an ARE of 8.98%. However, for monthly solar radiation, ARE in arid, cold, and polar regions were similar (about 15%) and smaller than in temperate and tropical regions with AREs of 18.77% and 16.35%, respectively. In all climate zones, ERA-Interim exhibited a smaller ARE in JJA when compared with the other seasons.
In contrast with ERA-Interim, JRA-55 overestimated in all climate zones and all temporal scales and showed a larger bias than ERA-Interim. The area with the lowest bias was the Arid region, which was also different with ERA-Interim. Based on ARE, the annual, monthly and seasonal solar radiation of JRA-55 performed better in tropical and arid regions than in other climate zones.
NCEP-DOE also showed overestimation in all times and all climate zones, except for annual solar radiation in the tropical region with a bias of −0.12 W/m2. It had a very large bias in cold and temperate regions in all temporal scales. For annual, seasonal, and monthly solar radiation, NCEP-DOE showed a better performance in the tropical region with AREs of 9.68, 18.74, and 17.94%, respectively. In addition, NCEP-DOE had a large ARE with 40.43% and 47.87% in DJF in cold and temperate regions, respectively.
Overall, the solar radiation reanalysis products showed an overestimation in most seasons and climate zones. ERA-Interim had a better performance in arid, cold, and polar regions; however, JRA-55 had better accuracy in arid and tropical regions. Compared with other reanalysis datasets, NCEP-DOE had a larger bias and only had a minor error in the tropical region.

3.3. Evaluation of Reanalysis Solar Radiation products at Different Elevation Zones

We also analyzed the performance of three reanalysis datasets at different elevations. The results of bias and ARE of annual, monthly and seasonal mean solar radiation are shown in Figure 4. We classified all sites into four elevation zones, i.e., I zone (0–500 m), II zone (500–1000 m), III zone (1000–2000 m), and IV zone (more than 2000 m).
It can be found, based on Figure 4, that bias and ARE of ERA-Interim are smaller than JRA-55 and NCEP-DOE in all elevation zones and different time scales. ERA-Interim shows the largest bias at low altitude zone (I zone) for annual mean solar radiation, but at III zone for seasonal and monthly mean solar radiation. For JRA-55 and NCEP-DOE, the largest bias was shown in III zone in different time scales. In addition, we found that the bias increment is more significant for JRA-55 than NCEP-DOE and ERA-Interim as the elevation increases. Based on the ARE variations at different elevation zones from Figure 4, we can find that AREs show a decreasing trend as the elevation increases for all products in different time scales. However, annual mean JRA-55 solar radiation shows an increase for ARE at III elevation zone.
Overall, it can be found that ERA-Interim performs best at different elevations among the three products. Bias of JRA-55 increases more significantly than ERA-Interim and NCEP-DOE, and ARE of annual mean JRA-55 increases in III elevation zones which indicates that JRA-55 solar radiation is influenced by elevation.

4. Error Sources of Reanalysis Solar Radiation Products

Due to the different atmospheric factors affecting the solar radiation in different seasons, the correlation relationship analysis was carried out in four seasons [43]. The partial correlation coefficient (PCC) was used to calculate the correlation between the ARE of the solar radiation products and different atmospheric factors because the different atmospheric factors are mutually influenced. The partial correlation coefficients of eight atmospheric factors of the four seasons were obtained using monthly mean of aerosol optical thickness, cloud cover, cloud optical thickness, water vapor, and their respective standard deviations from the MODIS product of MOD08. The greater the partial correlation coefficient, the more significant the influence of the atmospheric factor on the error of the solar radiation reanalysis products. Table 4 summarizes the atmospheric factors that had the most significant partial correlation coefficient of each reanalysis product in different climate zones and seasons. The WV, C, and AOD in Table 4 represent the influence factor of water vapor, cloud cover or cloud optical thickness, and aerosol optical thickness, respectively, which had the largest PCC when compared with other climate factors.
As can be seen from Table 4, the solar radiation reanalysis was affected by aerosols, clouds, and water vapor in different climatic zones and different seasons. In MAM, the three products were greatly influenced by cloud and water vapor. In JJA and SON, they were greatly influenced by the cloud. In DJF, the three products were mainly influenced by water vapor; however, ERA-Interim was also influenced by aerosols, and JRA-55 and NCEP-DOE were also influenced by the cloud in the cold region.
In the cold region, cloud is the main influencing factor for the three products. In addition, in the polar region, due to limited data, only the performance of ERA-Interim was found to be significantly influenced by cloud. In the temperate region, the three influence factors of water vapor, cloud, and aerosol affected the three reanalysis datasets, which explained the poor performance of the three solar radiation reanalysis datasets in the temperate region from Table 3.
In addition, it was found from Table 4 and the ARE of annual solar radiation in Table 3 that the climatic zone that showed a better performance for each product had relatively few influence factors. The ERA-Interim data performed well in cold, polar, and tropical regions, and the number of significant influence factors in these climatic zones in Table 4 were small with 2, 2, and 1, respectively. The JRA-55 data had a relatively small ARE in the Tropical climatic zone, and it was also found that its only one significant influence factor was cloud. In the same way, NCEP-DOE performed best in the Tropical climatic zone with only one significant influence factor of AOD. Therefore, the influence factors in Table 4 for the solar radiation reanalysis products in different climate regions can be used as a reference for the application of solar radiation reanalysis products and factor selection for the statistical downscaling of solar radiation reanalysis.
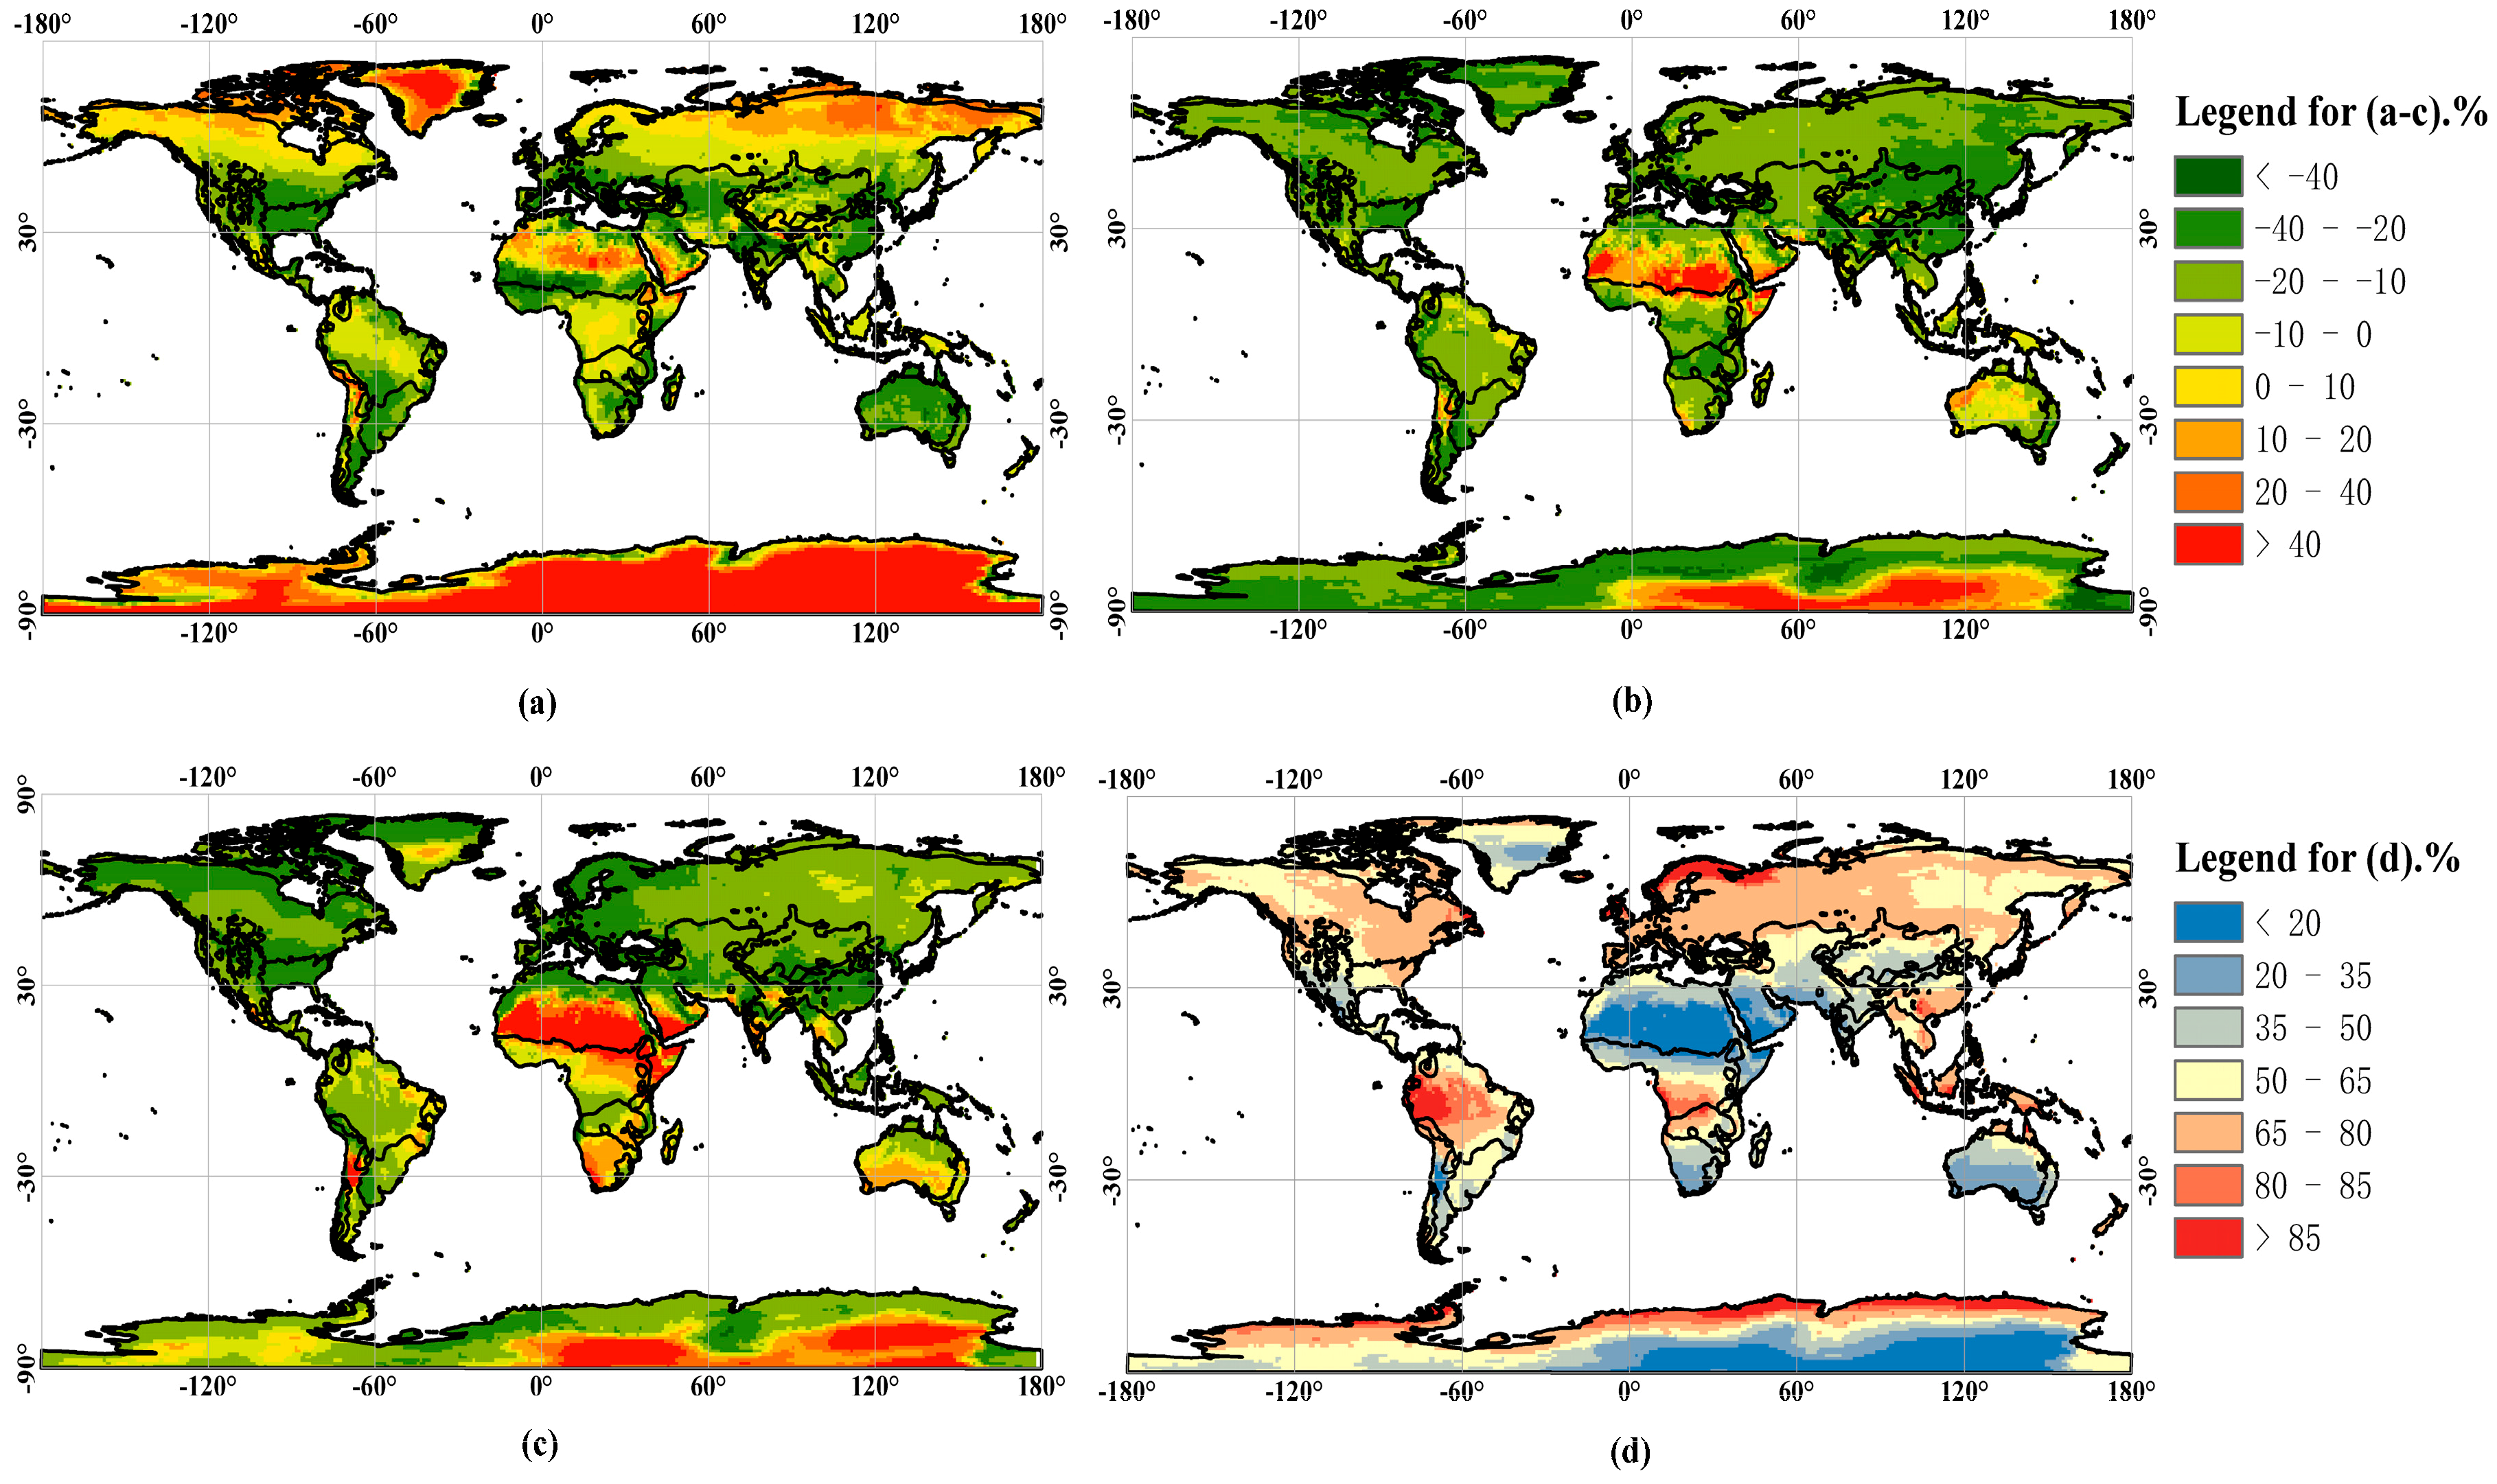
Based on the influence factor analysis results, it was found that solar radiation reanalysis was greatly influenced by cloud overall. Therefore, we compared the annual mean cloud cover from the three reanalysis products with the MODIS cloud cover product from MOD08, and the results are shown in Figure 5. We also calculated the ARE of the cloud cover data of the three reanalysis products by comparing them with MOD08 as shown in Table 5. From Figure 5d of the MODIS annual cloud cover distribution, we found that there was less cloud in the arid and polar climatic zones, but showed more in the tropical climatic zone than in the other climatic zones.
Figure 5a–c show the ARE of the cloud cover from the three reanalysis datasets compared with MOD08 as the true value. It was found that the cloud cover of the reanalysis data underestimated in most regions of the world. In addition, based on Table 5, it was found that the accuracy of the ERA-Interim cloud cover was the highest (18.61%), followed by JRA-55 (28.63%), and NCEP-DOE (29.26%), which was consistent with the evaluation results of the solar radiation reanalysis.
Meanwhile, we calculated the correlation coefficient between the ARE of cloud cover and of solar radiation from the three reanalysis products in different climatic zones (Table 5), (ERA-Interim: 0.93, JRA55: 0.74, NCEP: 0.75). It showed a very large correlation coefficient, which demonstrated that the underestimation of cloud cover of the three reanalysis datasets was one of the main reasons for the overestimation of solar radiation.
According to Table 5, although the ARE of annual solar radiation from ERA-Interim (10.13%) and JRA-55 (11.47%) in the Arid climate zone were similar, the error of cloud cover in these two climate zones were very different (ERA-Interim: 19.55%, JRA-55: 25.12%), which is possibly caused by that water vapor also influenced the solar radiation of these two products from Table 4. Similarly, in the tropical region, although the error of cloud cover of the three products was different (ERA-Interim: 18.00%, JRA-55: 16.64%, NCEP-DOE: 11.47%), the error of solar radiation was similar (ERA-Interim: 9.98%, JRA-55: 11.00%, NCEP-DOE: 9.68%). As the significant influence factors of the three reanalysis products were different, i.e., they were water vapor, cloud, and aerosols for ERA-Interim, JRA-55, and NCEP-DOE, respectively. The smaller error of cloud cover of JRA-55 in the tropical climatic zone may also be the reason that the error of solar radiation was significantly smaller than in other climatic zones.
Generally, the underestimation of cloud cover was the main reason for the overestimation of solar radiation for the three reanalysis products. However, the overall interaction between the aerosols, water vapor, and cloud cover were also important for the solar radiation reanalysis product.

5. Conclusions

The current study presented the validation of the solar radiation provided by three representative global reanalysis products (ERA-Interim, JRA-55, and NCEP-DOE) using the global surface observation data at different temporal and climate zones, and the error sources of the solar radiation reanalysis products in different climate zones were also analyzed.
It was found that the three reanalysis products overestimated the solar radiation when compared with the ground observation data. Overall, the range of monthly bias between the three reanalysis products at a global scale was 15.17 W/m2 to 36.91 W/m2, and the range of annual bias was 14.86 W/m2 to 31.85 W/m2. Among the three products, the performance of ERA-Interim was the best and the performance of NCEP-DOE was the worst. Regarding different climate regions, ERA-Interim had better performance in arid, cold, polar, and tropical regions; however, JRA-55 had better accuracy in arid and tropical regions. Compared with other reanalysis datasets, NCEP-DOE had a larger bias and only had a minor error in the tropical region. It is possible that NCEP-DOE performs worst among all products because the resolution of NCEP-DOE is coarse, which leads to more uncertainty in the evaluation due to the spatial mismatch. Generally, seasonal radiation has an opposite behavior in the southern and northern hemispheres. A more detailed assessment of the reanalysis product could be conducted from the seasonal characteristics of the two hemispheres which is a possible future research direction.
The error sources of the three solar radiation reanalysis products in different climate zones were analyzed and we found that the three products were mainly influenced by the water vapor and cloud. In the cold region, cloud was the main influencing factor for the three products. In the temperate region, the effects of water vapor, cloud, and aerosols all influenced the accuracy of the three reanalysis datasets. Overall, cloud was the main influence factor for all products. The evaluation results and error sources analysis can be references for the application of solar radiation reanalysis products in different areas and its downscaling in different regions.

Author Contributions

Conceptualization, X.P., J.S., and S.Z.; Methodology, X.P. and S.Z.; Formal Analysis, X.P. and S.Z.; Data Curation, X.P. and S.Z.; Writing—Original Draft Preparation, X.P.; Writing—Review and Editing, X.P., J.S., S.Z., J.T., and Y.L.; Supervision, J.S., S.Z., J.T., and Y.L.; Funding Acquisition, J.S., and S.Z.

Funding

This research was funded by China Postdoctoral Science Foundation (2018M632281), the National Natural Science Foundation of China (grants 1871293 and 41871293).

Acknowledgments

Reanalysis datasets were kindly provided by the European Centre for Medium Weather Forecasts (ECMWF) and NCAR (NCEP-DOE and JRA-55). The surface observation data of the surface incident solar radiation were downloaded from the GEBA and CMA.

Conflicts of Interest

The authors declare no conflict of interest.

References

  1. Brock, T.D. Calculating solar radiation for ecological studies. Ecol. Model. 1981, 14, 1–19. [Google Scholar] [CrossRef]
  2. Budyko, M.I. The effect of solar radiation variations on the climate of the Earth. Tellus 1969, 21, 611–619. [Google Scholar] [CrossRef]
  3. Monteith, J.L. Solar radiation and productivity in tropical ecosystems. J. Appl. Ecol. 1972, 9, 747–766. [Google Scholar] [CrossRef]
  4. Harshvardhan, D.R.; Randall, D.A.; Corsetti, T.G. A fast radiation parameterization for atmospheric circulation models. J. Geophys. Res. Atmos. 1987, 92, 1009–1016. [Google Scholar] [CrossRef] [Green Version]
  5. Wigmosta, M.S.; Vail, L.W.; Lettenmaier, D.P. A distributed hydrology-vegetation model for complex terrain. Water Resour. Res. 1994, 30, 1665–1679. [Google Scholar] [CrossRef]
  6. Chen, H.; Ma, H.; Li, X.; Sun, S. Solar influences on spatial patterns of Eurasian winter temperature and atmospheric general circulation anomalies. J. Geophys. Res. Atmos. 2015, 120, 8642–8657. [Google Scholar] [CrossRef]
  7. Hammer, A.; Heinemann, D.; Hoyer, C.; Kuhlemann, R.; Lorenz, E.; Müller, R.; Beyer, H.G. Solar energy assessment using remote sensing technologies. Remote Sens. Environ. 2003, 86, 423–432. [Google Scholar] [CrossRef] [Green Version]
  8. Pinker, R.T.; Frouin, R.; Li, Z. A review of satellite methods to derive surface shortwave irradiance. Remote Sens. Environ. 1995, 51, 108–124. [Google Scholar] [CrossRef]
  9. Polo, J.; Wilbert, S.; Ruiz-Arias, J.A.; Meyer, R.; Gueymard, C.; Súri, M.; Martín, L.; Mieslinger, T.; Blanc, P.; Grant, I.; et al. Preliminary survey on site-adaptation techniques for satellite-derived and reanalysis solar radiation datasets. Sol. Energy 2016, 132, 25–37. [Google Scholar] [CrossRef]
  10. Rigollier, C.; Lefèvre, M.; Wald, L. The method Heliosat-2 for deriving shortwave solar radiation from satellite images. Sol. Energy 2004, 77, 159–169. [Google Scholar] [CrossRef] [Green Version]
  11. Li, Z.; Moreau, L.; Arking, A. On solar energy disposition: A perspective from observation and modeling. Bull. Am. Meteorol. Soc. 1996, 78, 53–70. [Google Scholar] [CrossRef]
  12. Bony, S.; Sud, Y.; Lau, K.M.; Susskind, J.; Saha, S. Comparison and satellite assessment of NASA/DAO and NCEP–NCAR reanalyses over tropical ocean: Atmospheric hydrology and radiation. J. Clim. 1997, 10, 1441–1462. [Google Scholar] [CrossRef]
  13. Trenberth, K.E.; Guillemot, C.J. Evaluation of the atmospheric moisture and hydrological cycle in the NCEP/NCAR reanalyses. Clim. Dyn. 1998, 14, 213–231. [Google Scholar] [CrossRef]
  14. Troy, T.J.; Wood, E.F. Comparison and evaluation of gridded radiation products across northern Eurasia. Environ. Res. Lett. 2009, 4, 045008. [Google Scholar] [CrossRef] [Green Version]
  15. Berg, A.A.; Famiglietti, J.S.; Walker, J.P.; Houser, P.R. Impact of bias correction to reanalysis products on simulations of North American soil moisture and hydrological fluxes. J. Geophys. Res. Atmos. 2003, 108, 4490. [Google Scholar] [CrossRef]
  16. Betts, A.K.; Ball, J.H.; Bosilovich, M.; Viterbo, P.; Zhang, Y.; Rossow, W.B. Intercomparison of water and energy budgets for five Mississippi subbasins between ECMWF reanalysis (ERA-40) and NASA Data Assimilation Office fvGCM for 1990–1999. J. Geophys. Res. Atmos. 2003, 108, 8618. [Google Scholar] [CrossRef]
  17. Roads, J.; Betts, A. NCEP NCAR and ECMWF reanalysis surface water and energy budgets for the Mississippi river basin. J. Hydrometeorol. 1999, 1, 88–94. [Google Scholar] [CrossRef]
  18. Qin, H.; Kawai, Y.; Kawamura, H. Comparison of downward surface solar radiation derived from GMS5/VISSR and of reanalysis products. J. Oceanogr. 2006, 62, 577–586. [Google Scholar] [CrossRef]
  19. Schroeder, T.A.; Hember, R.; Coops, N.C.; Liang, S. Validation of solar radiation surfaces from MODIS and reanalysis data over topographically complex terrain. J. Appl. Meteorol. Climatol. 2008, 48, 2441–2458. [Google Scholar] [CrossRef]
  20. You, Q.; Sanchez-Lorenzo, A.; Wild, M.; Folini, D.; Fraedrich, K.; Ren, G.; Kang, S. Decadal variation of surface solar radiation in the Tibetan Plateau from observations, reanalysis and model simulations. Clim. Dyn. 2013, 40, 2073–2086. [Google Scholar] [CrossRef]
  21. Babst, F.; Mueller, R.W.; Hollmann, R. Verification of NCEP reanalysis shortwave radiation with mesoscale remote sensing data. IEEE Geosci. Remote Sens. 2008, 5, 34–37. [Google Scholar] [CrossRef]
  22. Brotzge, J.A. A two-year comparison of the surface water and energy budgets between two OASIS sites and NCEP–NCAR reanalysis data. J. Hydrometeorol. 2004, 5, 311–326. [Google Scholar] [CrossRef]
  23. Che, H.Z.; Shi, G.Y.; Zhang, X.Y.; Arimoto, R.; Zhao, J.Q.; Xu, L.; Wang, B.; Chen, Z.H. Analysis of 40 years of solar radiation data from China, 1961–2000. Geophys. Res. Lett. 2005, 32, L06803. [Google Scholar] [CrossRef]
  24. Xia, X.A.; Wang, P.C.; Chen, H.B.; Liang, F. Analysis of downwelling surface solar radiation in China from National Centers for Environmental Prediction reanalysis, satellite estimates, and surface observations. J. Geophys. Res. Atmos. 2006, 111, D09103. [Google Scholar] [CrossRef]
  25. Jia, B.; Xie, Z.; Dai, A.; Shi, C.; Chen, F. Evaluation of satellite and reanalysis products of downward surface solar radiation over East Asia: Spatial and seasonal variations. J. Geophys. Res. Atmos. 2013, 118, 3431–3446. [Google Scholar] [CrossRef] [Green Version]
  26. Hicke, J.A. NCEP and GISS solar radiation data sets available for ecosystem modeling: Description, differences, and impacts on net primary production. Glob. Biogeochem. Cycles 2005, 19, GB2006. [Google Scholar] [CrossRef]
  27. Wang, A.; Zeng, X. Evaluation of multireanalysis products with in situ observations over the Tibetan Plateau. J. Geophys. Res. Atmos. 2012, 117, D05102. [Google Scholar] [CrossRef]
  28. Cess, R.D.; Zhang, M.H.; Minnis, P.; Corsetti, L.; Dutton, E.G.; Forgan, B.W.; Garber, D.P.; Gates, W.L.; Hack, J.J.; Harrison, E.F.; et al. Absorption of solar radiation by clouds: Observations versus models. Science 1995, 267, 496–499. [Google Scholar] [CrossRef]
  29. Kim, D.; Ramanathan, V. Solar radiation budget and radiative forcing due to aerosols and clouds. J. Geophys. Res. Atmos. 2008, 113, D02203. [Google Scholar] [CrossRef]
  30. Hatzianastassiou, N.; Matsoukas, C.; Drakakis, E.; Stackhouse, P.W., Jr.; Koepke, P.; Fotiadi, A.; Pavlakis, K.G.; Vardavas, I. The direct effect of aerosols on solar radiation based on satellite observations, reanalysis datasets, and spectral aerosol optical properties from Global Aerosol Data Set (GADS). Atmos. Chem. Phys. 2007, 7, 2585–2599. [Google Scholar] [CrossRef] [Green Version]
  31. Gilgen, H.; Ohmura, A. The global energy balance archive. Bull. Am. Meteorol. Soc. 1999, 80, 831–850. [Google Scholar] [CrossRef]
  32. CMA. Available online: http://cdc.nmic.cn/home.do (accessed on 8 June 2017).
  33. Dee, D.P.; Uppala, S.M.; Simmons, A.J.; Berrisford, P.; Poli, P.; Kobayashi, S.; Andrae, U.; Balmaseda, M.A.; Balsamo, G.; Bauer, P.; et al. The ERA-Interim reanalysis: Configuration and performance of the data assimilation system. Q. J. R. Meteorol. Soc. 2011, 137, 553–597. [Google Scholar] [CrossRef]
  34. Kobayashi, S.; Ota, Y.; Harada, Y.; Ebita, A.; Moriya, M.; Onoda, H.; Onogi, K.; Kamahori, H.; Kobayashi, C.; Endo, H. The JRA-55 Reanalysis: General Specifications and Basic Characteristics. J. Meteorol. Soc. Jpn. Ser. II 2015, 93, 5–48. [Google Scholar] [CrossRef] [Green Version]
  35. Kanamitsu, M.; Ebisuzaki, W.; Woollen, J.; Yang, S.K.; Hnilo, J.J.; Fiorino, M.; Potter, G.L. NCEP-DOE AMIP-II reanalysis (R-2). Bull. Am. Meteorol. Soc. 2002, 83, 1631–1643. [Google Scholar] [CrossRef]
  36. Platnick, S. MODIS Atmosphere L3 Monthly Product. NASA MODIS Adaptive Processing System, Goddard Space Flight Center, USA. 2015. Available online: https://modis-images.gsfc.nasa.gov/MOD08_M3/doi.html (accessed on 27 March 2018).
  37. Iqbal, M.; Valnicek, B. INDEX—An Introduction to Solar Radiation; Academic Press: Cambridge, MA, USA, 1983; pp. 387–390. [Google Scholar]
  38. Sato, T.; Yamanishi, Y.; Horimoto, K.; Kanehisa, M.; Toh, H. Partial correlation coefficient between distance matrices as a new indicator of protein-protein interactions. Bioinformatics 2006, 22, 2488–2492. [Google Scholar] [CrossRef] [PubMed] [Green Version]
  39. Jia, A.; Liang, S.; Jiang, B.; Zhang, X.; Wang, G. Comprehensive assessment of global surface net radiation products and uncertainty analysis. J. Geophys. Res. Atmos. 2018, 123, 1970–1989. [Google Scholar] [CrossRef]
  40. Peel, M.C.; Finlayson, B.L.; Mcmahon, T.A. Updated world map of the Köppen-Geiger climate classification. Hydrol. Earth Syst. Sci. 2007, 4, 439–473. [Google Scholar] [CrossRef]
  41. Köppen Climatic Classification. Available online: http://www.hydrol-earth-syst-sci.net/11/1633/2007/hess-11-1633-2007-supplement.zip (accessed on 1 March 2018).
  42. Zhang, X.; Liang, S.; Wang, G.; Yao, Y.; Jiang, B.; Cheng, J. Evaluation of the reanalysis surface incident shortwave radiation products from NCEP, ECMWF, GSFC, and JMA using satellite and surface observations. Remote Sens. 2016, 8, 225. [Google Scholar] [CrossRef]
  43. Ma, Q.; Wang, K.; Wild, M. Impact of geolocations of validation data on the evaluation of surface incident shortwave radiation from Earth System Models. J. Geophys. Res. Atmos. 2015, 120, 6825–6844. [Google Scholar] [CrossRef] [Green Version]
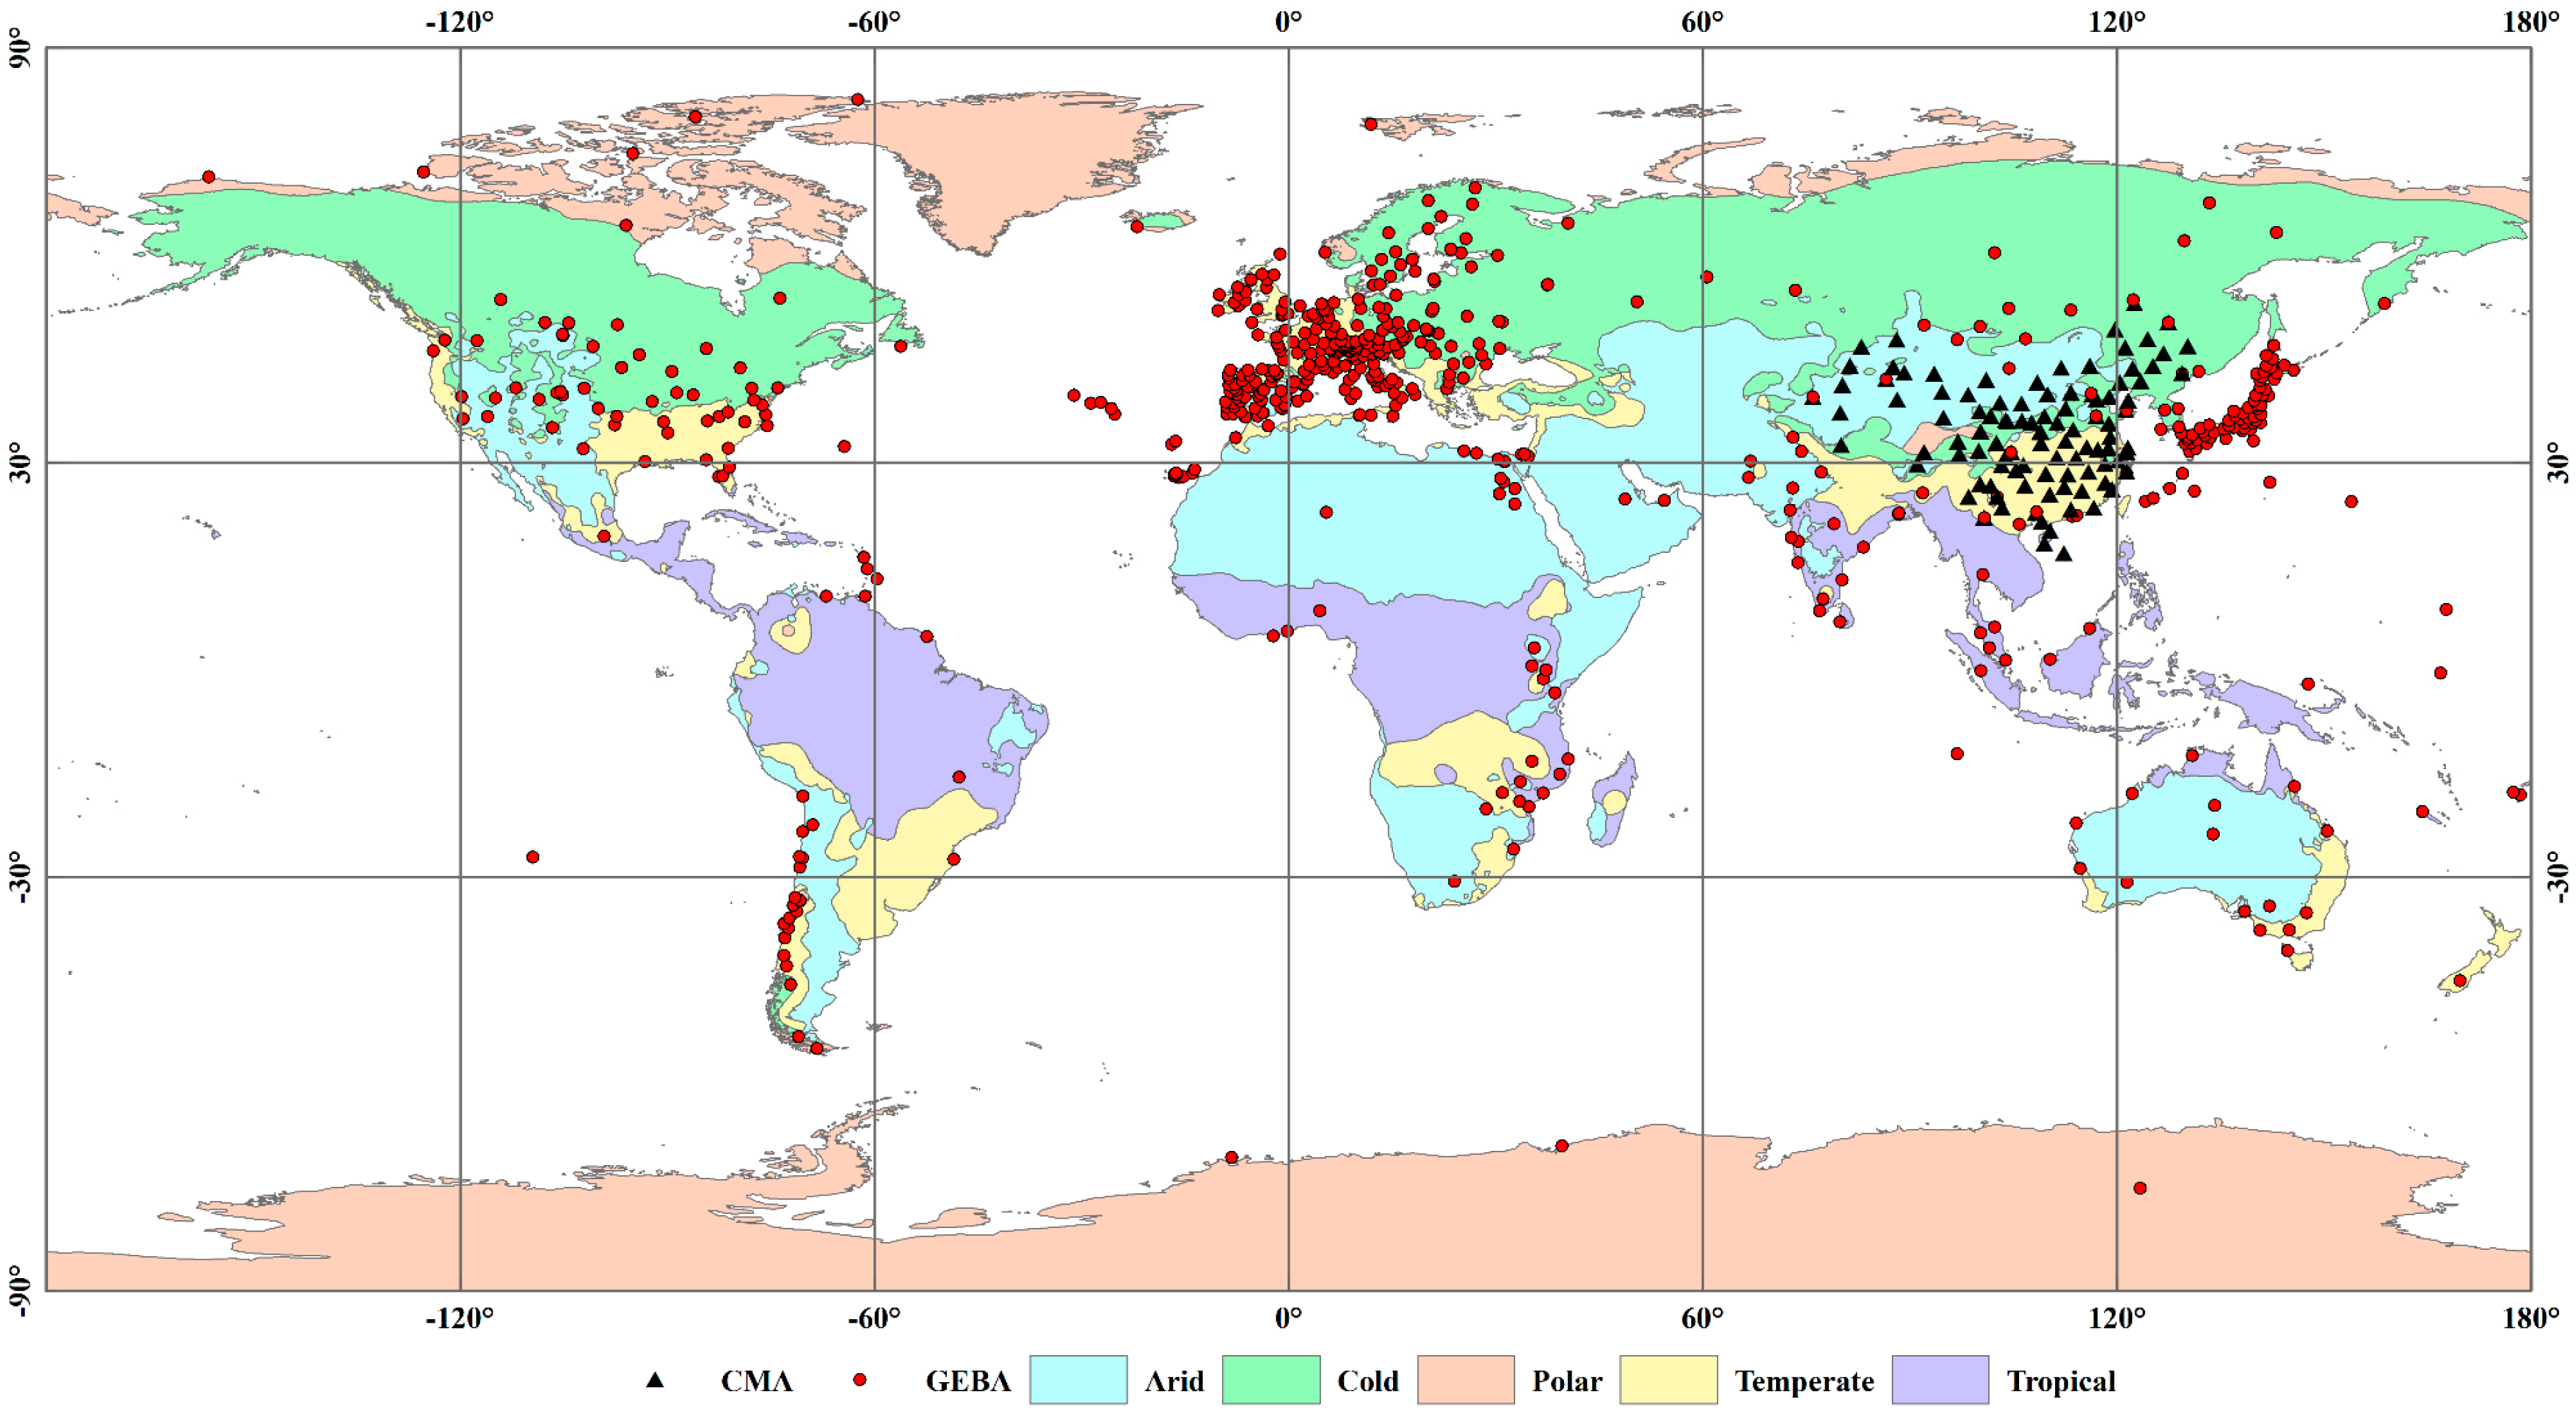
Figure 1. Geographical distribution of observation sites and Köppen climate zones.
Atmosphere 10 00042 g001
Figure 2. Annual series of bias and ARE of the three solar radiation reanalysis products from 2000 to 2009.
Atmosphere 10 00042 g002
Figure 3. Monthly variation of bias and ARE of the three solar radiation reanalysis products.
Atmosphere 10 00042 g003
Figure 4. Evaluation results of the annual, seasonal, and monthly solar radiation from three reanalysis datasets across all percentiles at different elevations (unit of bias: W/m2, ARE: %): (a) Bias of annual solar radiation; (b) ARE of annual solar radiation; (c) Bias of monthly mean solar radiation; (d) ARE of monthly mean solar radiation; (e) Bias of seasonal mean solar radiation; (f) ARE of seasonal mean solar radiation.
Atmosphere 10 00042 g004
Figure 5. Annual MODIS cloud cover and ARE between the reanalyzed cloud cover and the MODIS cloud cover averaged from 2001 to 2009: (a) ARE of ERA-Interim; (b) ARE of JRA-55; (c) ARE of NCEP-DOE; (d) MODIS annual cloud cover.
Atmosphere 10 00042 g005
Table 1. Details of the data products used in this paper.
Data SourceData PeriodTemporal ResolutionSpatial ResolutionReference
GEBA1922–2008monthlyN/A(station)[31]
CMA1957–presentmonthlyN/A(station)[32]
ERA-Interim1979–present3 h0.75° × 0.75°[33]
JRA-551958–20133 h0.56° × 0.56°[34]
NCEP-DOE1979–present6 h1.9° × 1.9°[35]
MOD082000–presentmonthly1° × 1°[36]
Table 2. Evaluation of three annual, seasonal, and monthly solar radiation reanalysis products at a global scale (unit of Bias and RMSE: W/m2, ARE: %)
Temporal ScalesMAMJJASONDJFAnnual MeanMonthly Mean
ERA-InterimBias22.7515.5811.1410.8314.8615.17
ARE19.7315.8117.8323.2311.6219.05
RMSE30.8027.3521.2322.8622.0026.82
R86.7790.5394.8396.4463.7791.53
JRA-55Bias26.9724.6318.5914.6622.6121.29
ARE21.7318.7922.7027.0816.2722.53
RMSE35.4135.2526.8824.8827.7931.34
R82.6587.4793.1295.9164.2989.65
NCEP-DOEBias48.6743.9128.3625.8031.8536.91
ARE33.7227.5631.2240.0524.1133.25
RMSE58.2354.5638.0937.7240.0648.34
R67.4680.8788.1092.6453.2282.56
Table 3. Evaluation results of the annual, seasonal, and monthly solar radiation from three reanalysis datasets in different climatic zones (unit of bias: W/m2, ARE: %)
ERA-Interim
Temporal ScalesBiasARE
MAMJJASONDJFSeasonal MeanMonthly MeanAnnual MeanMAMJJASONDJFSeasonal MeanMonthly MeanAnnual Mean
Arid24.1720.5115.1915.4818.8418.9916.7714.6412.3613.8320.8815.4315.5110.13
Cold19.1411.876.014.0810.2810.0710.3014.7611.3614.0119.2514.8515.078.98
Polar3.018.99−2.56−1.671.941.922.1215.5912.0216.6221.7416.4915.679.13
Temperate27.0116.6613.1514.0817.7317.6617.8420.1614.8116.5723.8718.8518.7713.92
Tropical22.109.6223.0723.7319.6320.2415.7413.3712.6816.7922.6216.3716.359.98
Mean19.0913.5310.9711.1413.6813.7812.5515.7012.6515.5621.6716.4016.2710.43
JRA-55
Temporal ScalesBiasARE
MAMJJASONDJFSeasonal MeanMonthly MeanAnnual MeanMAMJJASONDJFSeasonal MeanMonthly MeanAnnual Mean
Arid18.7319.9913.5612.4516.1816.6316.3313.7813.4715.7321.8616.2116.3611.47
Cold27.9331.3016.8910.3221.6121.2121.8818.1316.2220.7024.6919.9419.9615.70
Polar21.6438.9512.508.4120.3820.9323.9316.7821.7518.5424.3320.3519.7916.33
Temperate33.2325.1622.8518.9825.0625.0026.4523.1217.0822.3828.7622.8422.7219.33
Tropical21.1920.2029.8123.2923.6224.4720.0813.2515.5619.1522.6617.6617.7911.00
Mean24.5427.1219.1214.6921.3721.6521.7317.0116.8219.3024.4619.4019.3214.77
NCEP-DOE
Temporal ScalesBiasARE
MAMJJASONDJFSeasonal MeanMonthly MeanAnnual MeanMAMJJASONDJFSeasonal MeanMonthly MeanAnnual Mean
Arid39.6342.4923.9419.9231.5031.7925.1123.7322.2122.1326.8823.7423.8117.93
Cold56.9954.9329.5022.3040.9340.4136.0033.5227.3433.5140.4333.7033.6325.54
Polar39.7660.7019.6011.8132.9734.6629.2624.3932.6225.1426.8327.2527.1919.91
Temperate57.3744.7934.4236.2543.2143.0438.2337.0826.6332.1547.8735.9335.6327.93
Tropical8.141.0116.8816.7010.6810.66−0.1213.4516.6219.2422.4517.9418.749.68
Mean40.3840.7824.8721.4031.8632.1125.7026.4325.0826.4332.8927.7127.8020.20
Table 4. Influence factors of three products in the different seasons and different climatic zones.
Climatic ZonesSeason
MAMJJASONDJF
ERA-InterimAridWVCCWV
Cold C AOD
PolarC C
TemperateWVCAODAOD
TropicalWV
JRA-55AridC WVWV
ColdCC C
Polar
TemperateWVAODCWV
Tropical C
NCEP-DOEAridCCCWV
ColdAODCWVC
Polar
TemperateWVCCWV
TropicalAOD
Note: AOD: aerosol optical depth, C: cloud cover or cloud optical thickness, WV: water vapor.
Table 5. Specify that ARE of the cloud cover is obtained by comparison of reanalysis with MODIS (MOD08) data (ARE unit: %; SR: solar radiation, CC: cloud cover).
Climatic ZonesERA-InterimJRA-55NCEP-DOE
ARE
(SR)
ARE
(CC)
ARE
(SR)
ARE
(CC)
ARE
(SR)
ARE
(CC)
Arid10.1319.5511.4725.1217.9326.01
Cold8.9816.8115.7033.4125.5436.50
Polar9.1317.2816.3337.3119.9141.19
Temperate13.9221.3919.3330.6727.9331.12
Tropical9.9818.0011.0016.649.6811.47
Mean10.4318.6114.7728.6320.2029.26
Note: SR: solar radiation, CC: cloud cover.