Observed Changes in Temperature and Precipitation Extremes Over the Yarlung Tsangpo River Basin during 1970–2017


1
Asian International Rivers Center, Yunnan University, Kunming 650091, China
2
Yunnan Key Laboratory of International Rivers and Transboundary Eco-Security, Yunnan University, Kunming 650091, China
*
Author to whom correspondence should be addressed.
Atmosphere 2019, 10(12), 815; https://doi.org/10.3390/atmos10120815
Submission received: 13 November 2019
/
Revised: 5 December 2019
/
Accepted: 12 December 2019
/
Published: 15 December 2019
(This article belongs to the Special Issue Climates of the Himalayas: Present, Past and Future)
Abstract
:Twenty-five climate indices based on daily maximum and minimum temperature and precipitation at 15 meteorological stations were examined to investigate changes in temperature and precipitation extremes over the Yarlung Tsangpo River Basin (1970–2017). The trend-free prewhitening (TFPW) Mann–Kendall test and Pettitt’s test were used to identify trends and abrupt changes in the time series, respectively. The results showed widespread significant changes in extreme temperature indices associated with warming, most of which experienced abrupt changes in the 1990s. Increases in daily minimum and maximum temperature were detected, and the magnitude of daily minimum temperature change was greater than that of the daily maximum temperature, revealing an obvious decrease in the diurnal temperature range. Warm days and nights became more frequent, whereas fewer cold days and nights occurred. The frequency of frost and icing days decreased, while summer days and growing season length increased. Moreover, cold spell length shortened, whereas warm spell length increased. Additionally, changes in the precipitation extreme indices exhibited much less spatial coherence than the temperature indices. Spatially, mixed patterns of stations with positive and negative trends were found, and few trends in the precipitation extreme indices at individual stations were statistically significant. Generally, precipitation extreme indices showed a tendency toward wetter conditions, and the contribution of extreme precipitation to total precipitation has increased. However, no significant regional trends and abrupt changes were detected in total precipitation or in the frequency and duration of precipitation extremes.
1. Introduction
Global mean surface temperature rose by approximately 0.85 °C during 1880–2012, and warming is projected to continue because of the future emission of greenhouse gases [1,2]. In recent decades, observed climate data and climate models have shown that warming of the climate system leads to increases in extreme weather and climate events, such as heatwaves, cold spells, floods, droughts, and rainstorms [3,4,5,6,7]. There is general agreement that changes in the frequency or intensity of extreme weather and climate events would have a profound socioeconomic and environmental impact [5,8,9]. For instance, between 1998 and 2017, more than 526,000 people died worldwide and losses of US $3.47 trillion were incurred as the direct result of more than 11,500 extreme weather events [10]. Therefore, understanding changes in climate extremes within the context of global warming is of vital importance to policymakers.
Temperature and precipitation extremes have been studied both on global [3,6,11,12] and on regional scales [13,14,15,16,17]. Previous studies have found widespread significant changes in temperature extremes associated with warming, however, spatial patterns of changes in extreme precipitation trends appear mixed on regional scales [3,9]. Therefore, regional assessment in various climatic and geographic regions is needed to understand the uncertainties in change trends of extreme climate events. To offer a generally applicable measure of climatic extremes, and to enable interregional comparison and analysis, the Expert Team on Climate Change Detection and Indices (ETCCDI) defined a set of extreme climate indices [18,19]. These indices have been applied widely to facilitate investigation of climate extremes based on observational climate records [13], satellite-based data [20,21], reanalysis data [22], and climate model output [23,24].
The Yarlung Tsangpo River Basin (YTRB), which is located in southern parts of the Tibetan Plateau (TP), is known as the highest great river in the world, with a mean elevation of >4000 m above sea level [25]. It contains vulnerable ecological environments and is sensitive to climate change [26]. For instance, the basin is typically covered by vast areas of snow, glaciers, permafrost, and seasonally frozen soil, all of which are highly sensitive to changes in temperature and precipitation. Thus, the regional hydrological process is expected to change within the context of global warming [27,28]. Moreover, extreme precipitation-induced natural disasters, such as floods, droughts, glacier debris flows, and landslides have become more serious and more frequent since the 1990s [29]. The YTRB is one of the main centers of human economic activity in Tibet [30]; however, it generally has high vulnerability to climate change and relatively low adaptive capacity. Therefore, understanding the variability of climate extremes in the YTRB is of great importance for the sustainable development of Tibet [31].
Many studies have performed analysis of climate extremes over the entire TP or specific localized regions, such as the eastern and central TP [32], western TP [33], southeastern Tibet [29], and the “three-river headwaters” region [34,35]. However, few studies have examined climate extremes over the YTRB [25,36]. Although some studies have analyzed the changes in both the mean temperature and mean precipitation over the YTRB [26,30,31,37], a more detailed analysis of temperature and precipitation extremes is required. Moreover, as climate data accumulate, the changes in climate extremes over the YTRB should be studied further.
The objective of this study was to examine 25 climate indices (recommended by the ETCCDI) based on daily maximum and minimum temperature and precipitation at 15 meteorological stations to investigate the spatial and temporal changes in temperature and precipitation extremes over the YTRB during 1970–2017. In addition, the relationship between the extreme climate indices and Asian summer monsoon indices was analyzed. The findings of this study, which enhance the understanding of historical changes in temperature and precipitation extremes, represent a valuable reference regarding the formulation of policies for disaster mitigation and climate change adaptation in the YTRB.
2. Study Area and Data
2.1. Study Area
The Yarlung Tsangpo River, also called the Brahmaputra River in India or Jamuna River in Bangladesh, originates from the Chamyungdung glacier at an elevation of 5200 m in central-southern parts of the TP and discharges into the Bay of Bengal after flowing through Bangladesh (Figure 1). The length of the river in China is approximately 2229 km with a drainage area of 2.4 × 10⁵ km2 [25]. The YTRB is characterized by low air temperature with a large diurnal temperature range but low intra-annual temperature range [38]. The annual air temperature range from 1960 to 2009 was −0.3 to 8.8 °C [39]. Precipitation within the basin varies regionally. Annual precipitation in upstream, midstream, and downstream region was <300, 300–600, and >2000 mm, respectively [26]. Precipitation is mainly concentrated in the wet season (May–September). The main sources of water supplied to the river are the melting of ice and snow on the TP and precipitation brought by the southwest summer monsoon.
2.2. Data Source
Daily maximum and minimum temperature and precipitation data were obtained from the National Meteorological Information Centre of China (http://data.cma.cn/). There are 23 meteorological stations in the YTRB and adjacent areas; however, most of these meteorological stations started operations after 1970. For maximum spatial and temporal data coverage, 15 stations with data records covering 1970–2017 were selected for analysis (Table 1). The quality of the data was checked by the National Meteorological Information Centre based on a series method. Routine quality control and homogeneity assessment were further performed using the RClimDex (Version 1.0) and RHtestV3 programs, respectively (http://etccdi.pacificclimate.org/index.shtml) [15].
The East Asian subtropical monsoon index (EASMI) and South Asian subtropical monsoon index (SASMI), developed by Li and Zeng [40], were used in this study (http://ljp.gcess.cn/dct/page/1). The EASMI was defined as an area-averaged seasonally (JJA) dynamical normalized seasonality at 850 hPa within the East Asian monsoon domain (10°–40° N, 110°–140° E). Similarly, the SASMI was defined as an area-averaged seasonally (JJAS) dynamical normalized seasonality at 850 hPa within the South Asian domain (5.0°–22.5° N, 35.0°–97.5° E).
3. Extreme Climate Indices and Methodology
The 25 indices (recommended by the ETCCDI) selected for use in this study comprised 15 temperature indices and 10 precipitation indices. Detailed definitions of these indices are shown in Table 2 and Table 3. The RClimDex program was used to calculate these indices following data quality control and homogeneity assessment.
The Mann–Kendall (MK) test is one of the nonparametric tests widely used for trend analysis in hydrometeorological time series [15,41,42]. However, hydrometeorological time series may frequently display a statistically significant serial correlation. In such cases, the existence of serial correlation will increase the probability that the MK test detects a significant trend [43]. To eliminate the influence of a serial correlation occurring on the MK test, prewhitening has been applied in trend-detection studies of hydrometeorological time series [44]. In this study, a trend-free prewhitening (TFPW) procedure was used prior to applying a trend test. The slope of the trend was computed using the Theil–Sen regression estimator [45,46]. The detailed procedure of the TFPW Mann–Kendall (TFPW-MK) test can be found in the work of Yue et al. [41]. Moreover, the non-parametric Pettitt’s test was applied to assess the phenomenon of abrupt changes in the time series of the climatic data [47]. Pettitt’s test is the most commonly used test for change point detection because it is less sensitive to outliers and skewed distribution and is more sensitive to breaks in the middle of a time series [48].
In addition, trends and abrupt changes were determined for the entire region by performing regional averaging of the index time series. Regionally averaged anomaly series for each index was calculated as follows [49]:
where Rt is the regionally averaged index at year t, rs,t is the index for station s at year t, is the mean from 1970 to 2017 at station s, and nt is the number of stations with data in year t.
4. Results
4.1. Temperature Indices
The regional trends and the percentage of stations with positive, negative, and no trend in the extreme temperature indices during 1970–2017 are summarized in Table 4.
4.1.1. Absolute Indices (TNn, TNx, TXn, and TXx) and Diurnal Temperature Range (DTR)
Regional TNn, TNx, TXn, and TXx showed significant increasing trends during 1970–2017 with change rates of 0.48, 0.34, 0.35, and 0.22 °C/decade, respectively (Table 4 and Figure 2). A remarkable phenomenon was that the trend magnitude of TNn was larger than that of TXn, while the trend magnitude of TNx was greater than that of TXx, indicating a trend toward a smaller temperature difference between day and night. DTR presented a trend of a slight decrease with a rate of 0.06 °C/decade, which confirmed the reduction tendency in the diurnal temperature range (Table 4 and Figure 2). The spatial distributions of change trend for TNn, TNx, TXn, TXx, and DTR over the YTRB are shown in Figure 3. For TNn, 60% of stations presented significant increasing trends, while only two stations (Longzi and Linzhi) had decreasing trends (Figure 3a). All stations showed increasing trends of TNx and TXn, which were statistically significant for approximately 93% and 87% of stations, respectively (Figure 3b,c). For TXx, 93% of stations showed increasing trends, while 7% of stations had no trend (Figure 3d). Around 73% of stations showed decreasing trends in DTR, which were statistically significant for 33% of stations (Figure 3e).
4.1.2. Cooling Indices (TN10p, TX10p, FD, ID, and CSDI)
Cold nights (TN10p), cold days (TX10p), frost days (FD), ice days (ID), and cold spell duration indicator (CSDI) showed trends of decrease during 1970–2017 with change rates of −1.94, −1.66, −4.39, −2.02, and −0.27 d/decade, respectively, and the trends were statistically significant except for CSDI (Table 4 and Figure 4). The magnitudes of the decrease of nighttime-temperature-related indices (TN10p) were significantly higher than daytime-temperature-related indices (TX10p). The spatial distributions of the change trend for TN10p, TX10p, FD, ID, and CSDI over the YTRB are shown in Figure 5. Almost all stations presented significant decreasing trends in TN10p, TX10p, and FD (Figure 5a–c). For ID, 67% of stations showed decreasing trends and the stations with significant trends were distributed in western, southern, and northern regions. Approximately 33% of stations had no trend; these were mainly in midstream and downstream valley regions (Figure 5d). No obvious trend was found for CSDI at all stations (Figure 5e).
4.1.3. Warming Indices (TN90p, TX90p, GSL, SU25, and WSDI)
Warm nights (TN90p), warm days (TX90p), growing season length (GSL), summer days (SU25), and warm spell duration indicator (WSDI) showed significant trends of increase during 1970–2017 with change rates of 3.75, 2.10, 4.33, 1.23, and 2.80 d/decade, respectively (Table 4 and Figure 6). The spatial distributions of the change trend for TN90p, TX90p, GSL, SU25, and WSDI over the YTRB are shown in Figure 7. Almost all stations presented significant increasing trends in TN90p, TX90p, and GSL (Figure 7a–c). For SU25, 47% of stations showed significant increasing trends, and these stations were distributed mainly along the valley of the midstream and downstream regions. The 53% of stations with no trend were located mainly in western, southern, and northern regions (Figure 7d). For WSDI, approximately 60% of stations showed significant trends of increase and the stations with the largest trends were found mainly in midstream and upstream regions (Figure 7e).
4.2. Precipitation Indices
The regional trends and number of stations with positive, negative, and no trend in terms of the precipitation indices during 1970–2017 are summarized in Table 5.
4.2.1. Intensity Indices (SDII, RX1d, RX5d, R95p, and R99p) and Wet Day Precipitation (PRCPTOT)
Wet day precipitation (PRCPTOT) showed a positive trend with a rate of 7.33 mm/decade; however, the trend was not statistically significant (Figure 8a and Table 5). Around 80% of stations showed increasing trends, and these stations were distributed mainly in the middle region. The 20% of stations that showed a decreasing trend were found mainly in western and eastern regions (Figure 9a). Moreover, the annual simple daily intensity index (SDII) was found to present a significant increasing trend with a rate of 0.10 mm/d per decade (Figure 8b and Table 5). Notably, 80% of stations showed increasing trends in SDII, while significant positive trends were detected in 13% of stations (Figure 9b).
The regional average maximum 1-day precipitation amount (RX1d) and maximum 5-day precipitation amount (RX5d) showed increasing trends of 0.21 and 0.69 mm/decade, respectively. However, the trends of RX1d and RX5d were not statistically significant (Figure 8c,d and Table 5). The change trends of RX1d and RX5d were spatially heterogenous (Figure 9c,d), i.e., 53% of stations showed increasing trends in RX1d and RX5d, while 47% of stations showed decreasing trends. Both very wet day precipitation (R95p) and extremely wet day precipitation (R99p) exhibited insignificant increasing trends, the magnitudes of which were 4.01 and 0.92 mm/decade, respectively (Figure 8e,f, and Table 5). At the station scale, 47% of stations showed a positive trend, while 40% of stations showed a negative trend in R95p (Figure 9e). It is worth noting that the majority of stations (93%) within the basin showed no trend in R99p (Figure 9f).
4.2.2. Frequency Indices (R10mm and R20mm) and Duration Indices (CWD and CDD)
The number of heavy precipitation days (R10mm) and very heavy precipitation days (R20mm) showed increasing trends with change rates of 0.37 and 0.11 mm/decade, respectively (Figure 10a,b, and Table 5). For R10mm, 53% of stations showed positive trends, while 40% of stations had no change trend (Figure 11a). All stations presented no change in the trend of R20mm (Figure 11b). Consecutive wet days (CWD) had an insignificant decreasing trend with a rate of 0.06 d/decade (Figure 10c and Table 5). Conversely, consecutive dry days (CDD) had a weak trend of increase with a rate of 0.62 d/decade (Figure 10d and Table 5). Spatially, 73% of stations exhibited no change trend in CWD, and these stations were distributed mainly in the upper and lower parts of the basin (Figure 11c). For CDD, 47% of stations showed positive trends, while 47% of stations showed negative trends (Figure 11d). Generally, at most stations, there was little change in the trends of precipitation frequency and duration indices compared with intensity indices.
4.2.3. Proportion of Heavy Precipitation in Total Precipitation
From 1970 to 2017, very wet day precipitation (R95p) accounted for an average of 20.53% of the total precipitation amount (range: 13.45% to 26.77%). The R95p/PRCPTOT presented a fluctuating increase before 2000, followed by a rapid upward trend thereafter (Figure 12a). In addition, the average contribution of extremely wet day precipitation (R99p) was 6.37% (range: 1.83% to 12.79%). The R99p/PRCPTOT series showed a transition from a weak trend of decrease during 1970–1999 to an increasing trend during 2000–2017 (Figure 12b). Overall, the contribution of heavy precipitation to total precipitation amount increased from 1970 to 2017; the trend magnitude of the R95p/PRCPTOT and R99p/PRCPTOT series was 0.45%/decade and 0.23%/decade, respectively. These results are in accord with previous findings in southwestern China [50,51,52]. Notably, the contributions of R95p and R99p to total precipitation amount have increased rapidly since the 2000s.
4.3. Abrupt Change Analysis
Pettitt’s test is used to detect abrupt changes in the temperature and precipitation extreme indices, the results are shown in Table 6. According to Table 6, during the last 48 years, most of the extreme temperature indices displayed abrupt changes. The absolute indices (TNn, TNx, and TXn) showed significant abrupt changes in the 1990s, when it transformed from a relatively cold period to a relatively warm period. The DTR presented a distinct decrease from 1988. Most of the cold and warm extremes exhibited abrupt changes in the late 1990s, with the exception of SU25, which showed an abrupt change from a period with few summer days to a period with more summer days in 2004. Overall, the temperature extremes experienced abrupt changes in the 1990s. However, there were no significant abrupt changes in the precipitation extreme indices.
5. Discussion
5.1. Correlation Analysis of Extreme Temperature and Precipitation Indices
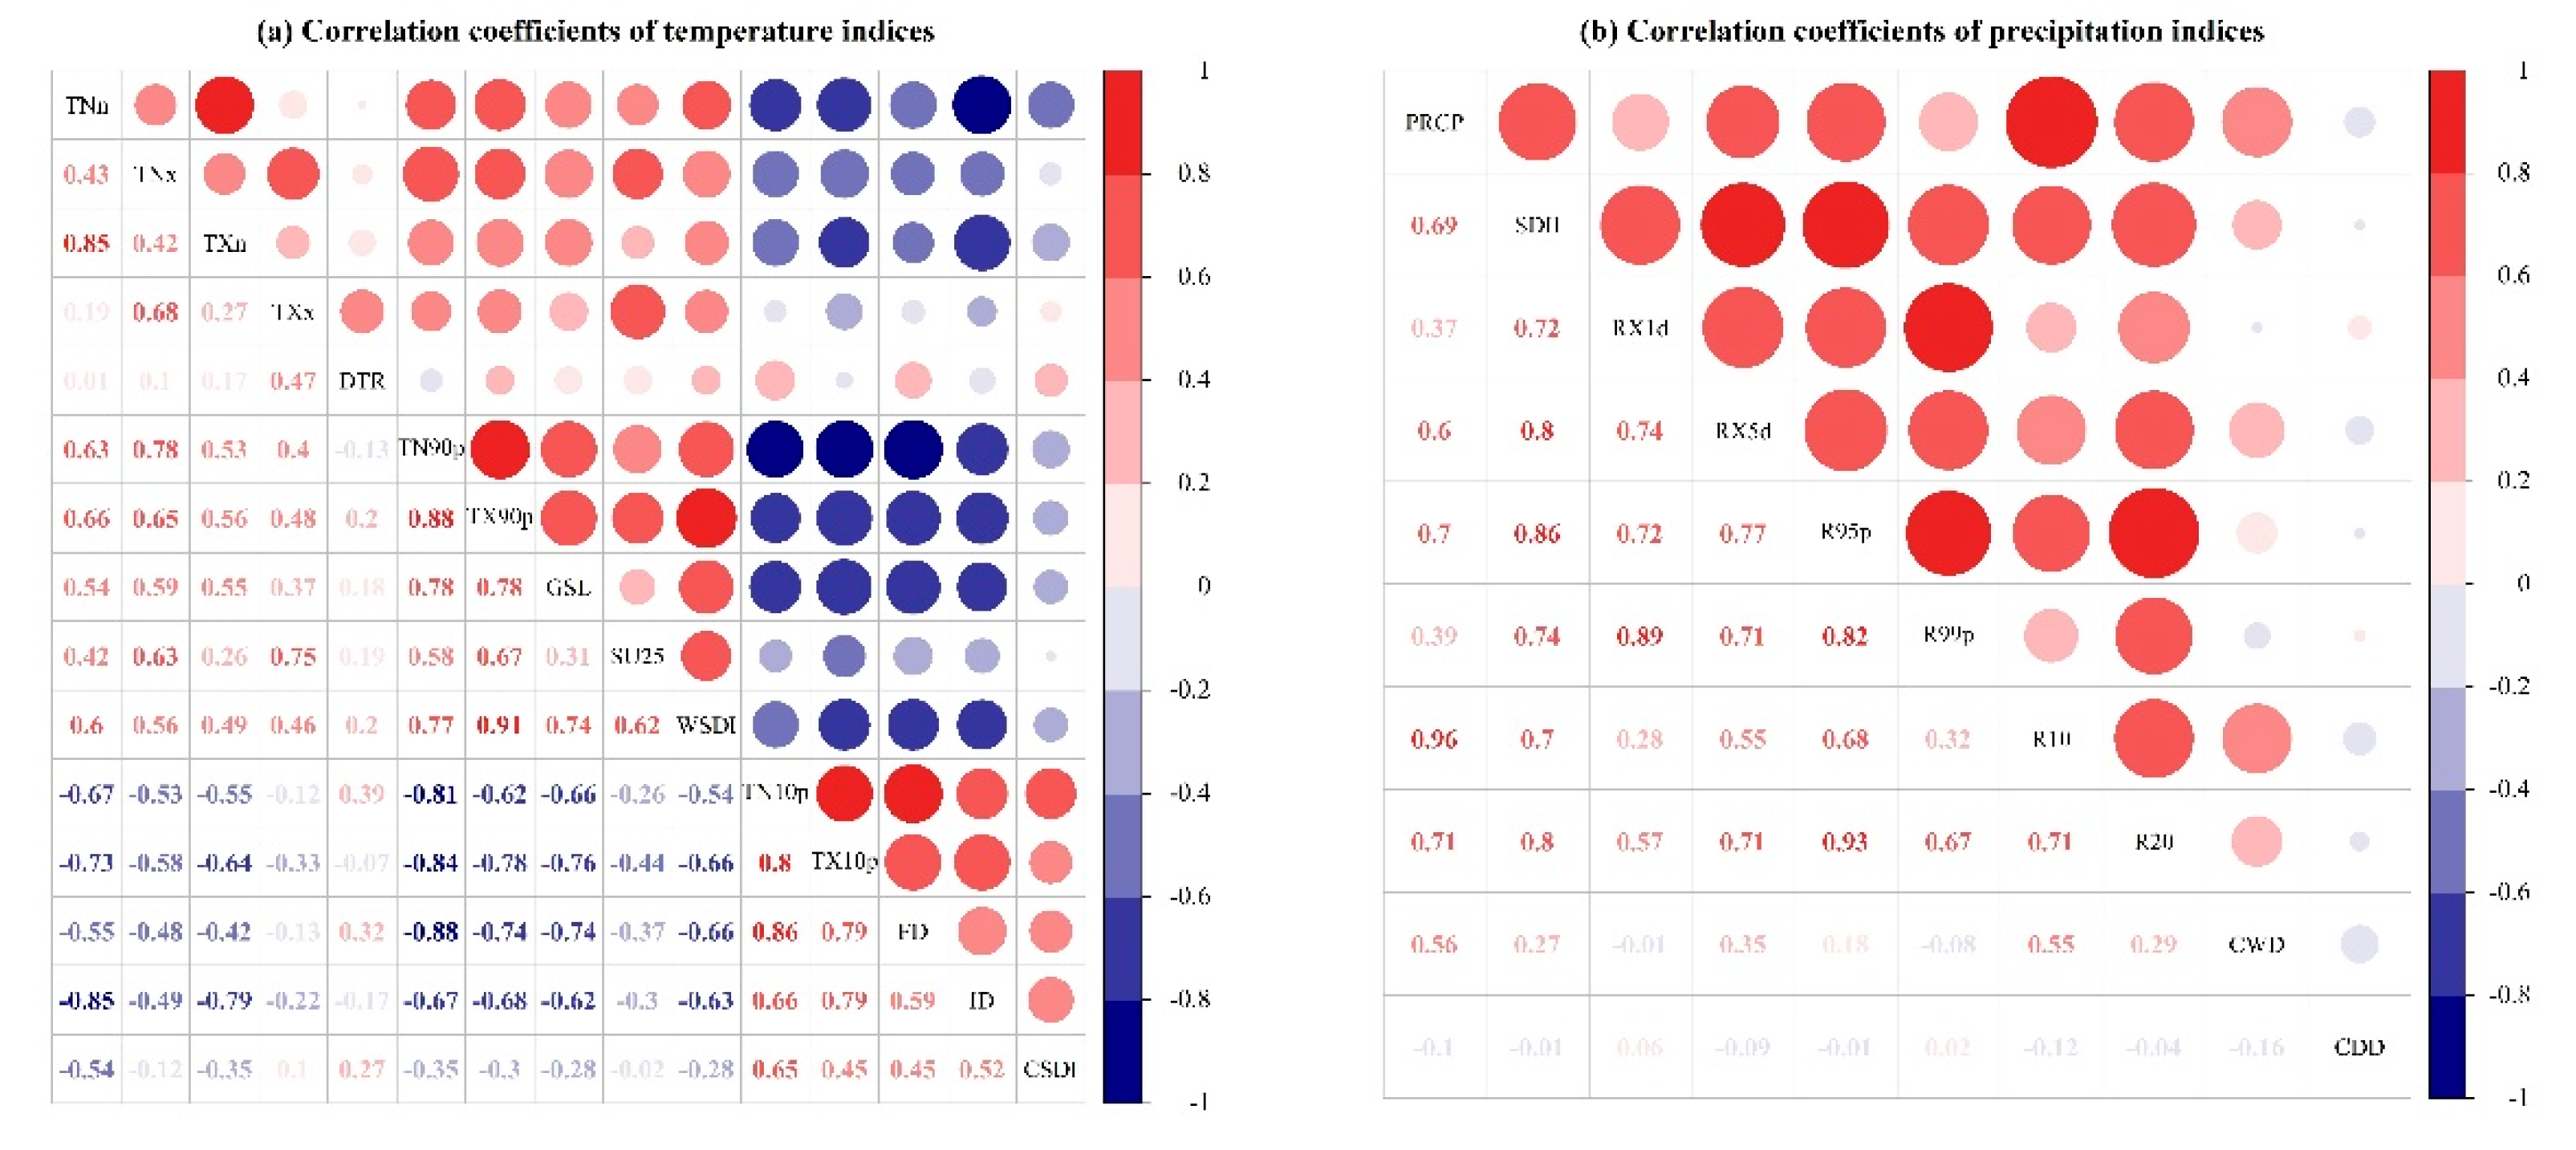
The Pearson correlation coefficients among the different temperature indices are shown in Figure 13a. Positive relationships were found among the absolute indices (TNn, TNx, TXn, and TXx), and TNn exhibited the strongest correlation with TXn with a correlation coefficient of 0.85 (p < 0.01). Positive relationships were also detected among the warming indices (TN90p, TX90p, GSL, SU25, and WSDI), and the highest correlation coefficients were between TX90p and WSDI (0.91, p < 0.01). For the cooling indices (TN10p, TX10p, FD, ID, and CSDI), significant positive correlations were found with correlation coefficients of >0.45 (p < 0.01). The TN10p and FD indices presented the strongest relationship with a correlation coefficient of 0.86 (p < 0.01). In addition, DTR had a weak correlation with the other indices. It is noteworthy that the warming indices were found correlated negatively with the cooling indices. All the above findings indicate that the occurrence of extreme warm events has been increasing, while that of extreme cold events has been decreasing with a definite warming trend reflected in the absolute indices.
Previous studies have indicated that the annual total precipitation is well correlated with extreme precipitation [29,32,34,53]. Figure 13b indicates a strong correlation between total precipitation and each of the precipitation indices (except CDD), of which R95p, R10mm, and R20mm showed the best correlation with total precipitation with a correlation coefficient of >0.70 (p < 0.01). The SDII was also found well correlated with the extreme precipitation indices (except CWD and CDD). As expected, CDD has a negative relationship with each of the other extreme precipitation indices, although none of the correlations found were statistically significant. Therefore, the extreme precipitation indices used in this work could be used to reflect the changes in total precipitation.
5.2. Comparison with Results of Other Studies
For the temperature extremes, trend analysis showed the absolute indices (TNn, TNx, TXn, and TXx) and the warming indices (TN90p, TX90p, GSL, SU25, and WSDI) had significant increasing trends, while the cooling indices (TN10p, TX10p, FD, and ID) exhibited significant decreasing trends. This finding is consistent with studies in adjacent regions, e.g., the western Qinghai–Tibet Plateau [33], central and eastern parts of the Qinghai–Tibet Plateau [32], three-river headwaters region [34,35], Southwest China [50], and China as a whole [13] (Table 7). In addition, the overall warming trends in the extreme indices based on nighttime temperature (TN10p, TN90p, TNn, and TNx) were found greater than those based on daytime temperatures (TX10p, TX90p, TXn, and TXx), indicating an obvious decrease in DTR, consistent with other regions worldwide [3,13,54,55]. Wintertime indices (FD, ID, TNn, and TXn) are likely to increase/decrease more quickly than summertime indices (GSL, SU25, TNx, and TXx) because the magnitude of warming in winter is greater than in summer [35].
For the precipitation extremes, both PRCPTOT and SDII showed increasing trends, indicating a tendency toward wetter climate conditions over the YTRB, consistent with previous studies in adjacent regions and China as a whole (Table 7). Notably, CDD tended to become prolonged and CWD tended to become shortened, while RX1d, RX5d, R95p, R99p, R10 mm, and R20 mm all increased, which suggests that increased precipitation intensity is concentrated on extreme precipitation events. This was also reflected by the increase in the contribution of extreme precipitation to total precipitation during 1970–2017 (Figure 12).
5.3. Relationship between Extreme Precipitation Changes and Monsoon Activities
Previous studies reported that the Asian summer monsoon affects precipitation in southern regions of the TP [29,53]. As shown in Table 8, the South Asian summer monsoon index (SASMI) has a positive correlation with PRCPTOT and R10 mm, indicating that the South Asian summer monsoon has considerable influence on precipitation variation. The South Asian monsoon affects lower-latitude areas in southeastern parts of the Qinghai–Tibet Plateau, bringing abundant water vapor along the valley of the YTRB [30]. For instance, in those years in which the South Asian summer monsoon was prevalent, the water vapor content transported from the Indian Ocean increased significantly and the occurrence of heavy precipitation increased. Moreover, the East Asian summer monsoon index (EASMI) showed significant negative correlation with the extreme precipitation indices (except CDD), probably because a strengthened East Asian summer monsoon limits the northward extension of the South Asian summer monsoon, while an enhanced South Asian summer monsoon limits the westward extension of the East Asian summer monsoon. The significant positive correlation between the EASMI and CDD also indicates that strengthening of the East Asian monsoon will limit the amount of water vapor transported by the South Asian monsoon, resulting in a persistent precipitation deficit. In recent decades, the weakening of the Asian monsoon circulation has been confirmed by numerous studies [50,57,58]. The decline in the strength of the Asian monsoonal circulation has contributed to severe rainfall anomalies [50,51,59].
6. Conclusions
This study analyzed the change of temperature and precipitation extremes over the YTRB during 1970–2017. Temperature extremes showed widespread significant changes associated with warming, i.e., the majority of stations showed statistically significant trends for most temperature indices. The absolute indices (TNn, TNx, TXn, and TXx) exhibited significant trends of increase with rates of 0.48, 0.34, 0.35, and 0.22 °C/decade, respectively. The magnitudes of the change of the daily minimum temperature indices were greater than the daily maximum temperature, indicating an obvious decrease in DTR (−0.06 °C/decade). Warming indices (TN90p, TX90p, GSL, SU25, and WSDI) showed a significant increase of 3.75, 2.10, 4.33, 1.23, and 2.80 d/decade, respectively. Meanwhile, cooling indices (TN10p, TX10p, FD, and ID) showed a significant decrease of −1.94, −1.66, −4.39, and −2.02 d/decade, respectively. Moreover, the warming magnitudes of most of the indices were more evident after the 1990s than before. In addition, change in the extreme precipitation indices exhibited much less spatial coherence than that of the temperature indices. Spatially, mixed patterns of the station with increasing and decreasing trends were found, and few trends in the extreme precipitation indices at individual stations were statistically significant. Precipitation extreme indices showed a tendency toward wetter conditions, and the contribution of extreme precipitation to total precipitation has increased. On average, CDD tended to become prolonged and CWD tended to become shortened, while RX1d, RX5d, R95p, R99p, R10 mm, and R20 mm all increased, which suggests that significant increase in SDII is concentrated on extreme precipitation events. However, no significant regional trends and abrupt changes were detected in total precipitation or in the frequency and duration of precipitation extremes.
One of the most significant potential consequences of climate change may be alterations in regional hydrological cycles and subsequent changes in river flow regimes. Previous studies indicated the glaciers in the YTRB had retreated severely during the last decades [60], and runoff from the glacial melt has been increasing in response to climatic warming [26,61], which increased water availability in the downstream. However, the long-term effects of glacier retreat will be a decrease in regional water supplies, particularly during the dry season [62]. Furthermore, changes in precipitation extremes may have important implications for water-related hazard risk management. Recent temporal fluctuations in precipitation extremes indicated a greater degree of likelihood of flood risk as well as dry events, which pose major challenges to agriculture, water, and other sectors. The midstream region of the YTRB is the main center of human economic activity in Tibet. Given the increase in socioeconomic vulnerability to climate extremes, it is critical to improve the climate risk management strategies in the basin.
Author Contributions
Conceptualization, Y.L.; software, C.L.; data analysis, C.L. and M.Z.; writing—original draft preparation, C.L.; writing—review and editing, Y.L., X.J., and X.L.
Funding
This research was funded by the National Natural Science Foundation of China, grant number 41661144044.
Acknowledgments
We are very grateful to the editors and anonymous reviewers for their valuable comments, which greatly improved the quality of the paper.
Conflicts of Interest
The authors declare no conflict of interest.
References
- IPCC. Working Group I Contribution to the IPCC Fifth Assessment Report, Climate Change 2013: The Physical Science Basis: Summary for Policymakers; Cambridge University Press: Cambridge, UK; New York, NY, USA, 2013. [Google Scholar]
- IPCC. Global Warming of 1.5 °C. An IPCC Special Report on the Impacts of Global Warming of 1.5 °C above Pre-Industrial Levels and Related Global Greenhouse Gas Emission Pathways, in the Context of Strengthening the Global Response to the Threat of Climate Change, Sustainable Development, and Efforts to Eradicate Poverty; World Meteorological Organization: Geneva, Switzerland, 2018. [Google Scholar]
- Alexander, L.V.; Zhang, X.; Peterson, T.C.; Caesar, J.; Gleason, B.; Klein Tank, A.M.G.; Haylock, M.; Collins, D.; Trewin, B.; Rahimzadeh, F.; et al. Global observed changes in daily climate extremes of temperature and precipitation. J. Geophys. Res. 2006, 111, 1–22. [Google Scholar] [CrossRef] [Green Version]
- Li, C.; Zwiers, F.; Zhang, X.; Chen, G.; Lu, J.; Li, G.; Norris, J.; Tan, Y.; Sun, Y.; Liu, M. Larger Increases in More Extreme Local Precipitation Events as Climate Warms. Geophys. Res. Lett. 2019, 46, 6885–6891. [Google Scholar] [CrossRef]
- Easterling, D.R.; Meehl, G.A.; Parmesan, C.; Changnon, S.A.; Karl, T.R.; Mearns, L.O. Climate extremes: Observations, modeling, and impacts. Science 2000, 289, 2068–2074. [Google Scholar] [CrossRef] [PubMed] [Green Version]
- Donat, M.G.; Angelil, O.; Ukkola, A.M. Intensification of precipitation extremes in the world’s humid and water-limited regions. Environ. Res. Lett. 2019, 14, 9. [Google Scholar] [CrossRef]
- Pfleiderer, P.; Schleussner, C.F.; Kornhuber, K.; Coumou, D. Summer weather becomes more persistent in a 2 degrees C world. Nat. Clim. Chang. 2019, 9, 666. [Google Scholar] [CrossRef]
- Zhang, L.B.; Ameca, E.I.; Cowlishaw, G.; Pettorelli, N.; Foden, W.; Mace, G.M. Global assessment of primate vulnerability to extreme climatic events. Nat. Clim. Chang. 2019, 9, 554–561. [Google Scholar] [CrossRef]
- Han, J.Y.; Du, H.B.; Wu, Z.F.; He, H.S. Changes in Extreme Precipitation Over Dry and Wet Regions of China During 1961–2014. J. Geophys. Res. 2019, 124, 5847–5859. [Google Scholar] [CrossRef]
- Eckstein, D.; Hutfils, M.L.H.; Winges, M. Global Climate Risk Index 2019; Germanwatch: Bonn, Germany, 2018. [Google Scholar]
- Donat, M.G.; Alexander, L.V.; Yang, H.; Durre, I.; Vose, R.; Dunn, R.J.H.; Willett, K.M.; Aguilar, E.; Brunet, M.; Caesar, J.; et al. Updated analyses of temperature and precipitation extreme indices since the beginning of the twentieth century: The HadEX2 dataset. J. Geophys. Res. 2013, 118, 2098–2118. [Google Scholar] [CrossRef]
- Alexander, L.V. Global observed long-term changes in temperature and precipitation extremes: A review of progress and limitations in IPCC assessments and beyond. Weather Clim. Extrem. 2016, 11, 4–16. [Google Scholar] [CrossRef] [Green Version]
- Zhou, B.; Xu, Y.; Wu, J.; Dong, S.; Shi, Y. Changes in temperature and precipitation extreme indices over China: Analysis of a high-resolution grid dataset. Int. J. Clim. 2016, 36, 1051–1066. [Google Scholar] [CrossRef]
- Franzke, C.L.E. Local trend disparities of European minimum and maximum temperature extremes. Geophys. Res. Lett. 2015, 42, 6479–6484. [Google Scholar] [CrossRef] [Green Version]
- Zhang, X.; Aguilar, E.; Sensoy, S.; Melkonyan, H.; Tagiyeva, U.; Ahmed, N.; Kutaladze, N.; Rahimzadeh, F.; Taghipour, A.; Hantosh, T.H.; et al. Trends in Middle East climate extreme indices from 1950 to 2003. J. Geophys. Res. 2005, 110, 1–12. [Google Scholar] [CrossRef]
- Naveendrakumar, G.; Vithanage, M.; Kwon, H.H.; Chandrasekara, S.S.K.; Iqbal, M.C.M.; Pathmarajah, S.; Fernando, W.; Obeysekera, J. South Asian perspective on temperature and rainfall extremes: A review. Atmos. Res. 2019, 225, 110–120. [Google Scholar] [CrossRef]
- Sein, K.K.; Chidthaisong, A.; Oo, K.L. Observed Trends and Changes in Temperature and Precipitation Extreme Indices over Myanmar. Atmosphere 2018, 9, 477. [Google Scholar] [CrossRef] [Green Version]
- Zhang, X.B.; Alexander, L.; Hegerl, G.C.; Jones, P.; Tank, A.K.; Peterson, T.C.; Trewin, B.; Zwiers, F.W. Indices for monitoring changes in extremes based on daily temperature and precipitation data. Wiley Interdiscip. Rev. Clim. Chang. 2011, 2, 851–870. [Google Scholar] [CrossRef]
- Frich, P.; Alexander, L.V.; Della-Marta, P.; Gleason, B.; Haylock, M.; Tank, A.; Peterson, T. Observed coherent changes in climatic extremes during the second half of the twentieth century. Clim. Res. 2002, 19, 193–212. [Google Scholar] [CrossRef] [Green Version]
- Dietzsch, F.; Andersson, A.; Ziese, M.; Schröder, M.; Raykova, K.; Schamm, K.; Becker, A. A Global ETCCDI-Based Precipitation Climatology from Satellite and Rain Gauge Measurements. Climate 2017, 5, 9. [Google Scholar] [CrossRef] [Green Version]
- Yin, H.; Donat, M.G.; Alexander, L.V.; Sun, Y. Multi-dataset comparison of gridded observed temperature and precipitation extremes over China. Int. J. Clim. 2015, 35, 2809–2827. [Google Scholar] [CrossRef]
- You, Q.; Fraedrich, K.; Ren, G.; Pepin, N.; Kang, S. Variability of temperature in the Tibetan Plateau based on homogenized surface stations and reanalysis data. Int. J. Clim. 2013, 33, 1337–1347. [Google Scholar] [CrossRef] [Green Version]
- You, Q.; Jiang, Z.; Wang, D.; Pepin, N.; Kang, S. Simulation of temperature extremes in the Tibetan Plateau from CMIP5 models and comparison with gridded observations. Clim. Dyn. 2017, 51, 355–369. [Google Scholar] [CrossRef] [Green Version]
- Chen, H.; Sun, J. Changes in climate extreme events in China associated with warming. Int. J. Clim. 2015, 35, 2735–2751. [Google Scholar] [CrossRef]
- You, Q.; Kang, S.; Wu, Y.; Yan, Y. Climate change over the Yarlung Zangbo River Basin during 1961–2005. J. Geogr. Sci. 2007, 17, 409–420. [Google Scholar] [CrossRef]
- Liu, Z.; Yao, Z.; Huang, H.; Wu, S.; Liu, G. Land Use and Climate Changes and Their Impacts on Runoff in the Yarlung Zangbo River Basin, China. Land Degrad. Devlop. 2014, 25, 203–215. [Google Scholar] [CrossRef]
- Xu, R.; Hu, H.; Tian, F.; Li, C.; Khan, M.Y.A. Projected climate change impacts on future streamflow of the Yarlung Tsangpo-Brahmaputra River. Glob. Planet. Chang. 2019, 175, 144–159. [Google Scholar] [CrossRef] [Green Version]
- Zhong, R.; He, Y.; Chen, X. Responses of the hydrological regime to variations in meteorological factors under climate change of the Tibetan plateau. Atmos. Res. 2018, 214, 296–310. [Google Scholar] [CrossRef]
- Zhang, J.; Shen, X.; Wang, B. Changes in precipitation extremes in Southeastern Tibet, China. Quat. Int. 2015, 380–381, 49–59. [Google Scholar] [CrossRef]
- Li, B.; Zhou, W.; Zhao, Y.; Ju, Q.; Yu, Z.; Liang, Z.; Acharya, K. Using the SPEI to Assess Recent Climate Change in the Yarlung Zangbo River Basin, South Tibet. Water 2015, 7, 5474–5486. [Google Scholar] [CrossRef] [Green Version]
- Sang, Y.; Singh, V.P.; Gong, T.; Xu, K.; Sun, F.; Liu, C.; Liu, W.; Chen, R. Precipitation variability and response to changing climatic condition in the Yarlung Tsangpo River basin, China. J. Geophys. Res. 2016, 121, 8820–8831. [Google Scholar] [CrossRef] [Green Version]
- You, Q.; Kang, S.; Aguilar, E.; Yan, Y. Changes in daily climate extremes in the eastern and central Tibetan Plateau during 1961–2005. J. Geophys. Res. 2008, 113, 1–17. [Google Scholar] [CrossRef] [Green Version]
- Wang, S.; Zhang, M.; Wang, B.; Sun, M.; Li, X. Recent changes in daily extremes of temperature and precipitation over the western Tibetan Plateau, 1973–2011. Quat. Int. 2013, 313–314, 110–117. [Google Scholar] [CrossRef]
- Cao, L.; Pan, S. Changes in precipitation extremes over the “Three-River Headwaters” region, hinterland of the Tibetan Plateau, during 1960–2012. Quat. Int. 2014, 321, 105–115. [Google Scholar] [CrossRef]
- Ding, Z.; Wang, Y.; Lu, R. An analysis of changes in temperature extremes in the Three River Headwaters region of the Tibetan Plateau during 1961–2016. Atmos. Res. 2018, 209, 103–114. [Google Scholar] [CrossRef]
- Fan, J.; Sun, W.; Zhao, Y.; Xue, B.; Zuo, D.; Xu, Z. Trend Analyses of Extreme Precipitation Events in the Yarlung Zangbo River Basin, China Using a High-Resolution Precipitation Product. Sustainability 2018, 10, 1396. [Google Scholar] [CrossRef] [Green Version]
- Shi, Y.; Gao, X.; Zhang, D.; Giorgi, F. Climate change over the Yarlung Zangbo–Brahmaputra River Basin in the 21st century as simulated by a high resolution regional climate model. Quat. Int. 2011, 244, 159–168. [Google Scholar] [CrossRef]
- Li, F.; Xu, Z.; Liu, W.; Zhang, Y. The impact of climate change on runoff in the Yarlung Tsangpo River basin in the Tibetan Plateau. Stoch. Environ. Res. Risk Assess. 2013, 28, 517–526. [Google Scholar] [CrossRef]
- Zeng, C.; Zhang, F.; Lu, X.; Wang, G.; Gong, T. Improving sediment load estimations: The case of the Yarlung Zangbo River (the upper Brahmaputra, Tibet Plateau). Catena 2018, 160, 201–211. [Google Scholar] [CrossRef]
- Li, J.P.; Zeng, Q.C. A unified monsoon index. Geophys. Res. Lett. 2002, 29, 4. [Google Scholar] [CrossRef]
- Yue, S.; Pilon, P.; Phinney, B.; Cavadias, G. The influence of autocorrelation on the ability to detect trend in hydrological series. Hydrol. Process. 2002, 16, 1807–1829. [Google Scholar] [CrossRef]
- Kendall, M. Rank Correlation Methods; Charles Griffin and Company: London, UK, 1955. [Google Scholar]
- Von Storch, H. Misuses of Statistical Analysis in Climate Research; Springer: Berlin, Germany, 1995; pp. 11–26. [Google Scholar]
- Yue, S.; Wang, C.Y. Applicability of prewhitening to eliminate the influence of serial correlation on the Mann-Kendall test. Water Resour. Res. 2002, 38, 7. [Google Scholar] [CrossRef]
- Sen, P. Estimates of regression coefficient based on Kendall’s tau. J. Am. Stat. Assoc. 1968, 63, 1379–1389. [Google Scholar] [CrossRef]
- Theil, H. A Rank-Invariant Method of Linear and Polynomial Regression Analysis. In Advanced Studies in Theoretical and Applied Econometrics; Raj, B., Koerts, J., Eds.; Springer: Dordrecht, The Netherlands, 1992; Volume 23, pp. 345–381. [Google Scholar]
- Pettitt, A. A non-parametric approach to the change-point problem. Appl. Stat. 1979, 28, 126–135. [Google Scholar] [CrossRef]
- Wijngaard, J.B.; Tank, A.; Konnen, G.P. Homogeneity of 20th century European daily temperature and precipitation series. Int. J. Climatol. 2003, 23, 679–692. [Google Scholar] [CrossRef]
- New, M.; Hewitson, B.; Stephenson, D.B.; Tsiga, A.; Kruger, A.; Manhique, A.; Gomez, B.; Coelho, C.A.S.; Masisi, D.N.; Kululanga, E.; et al. Evidence of trends in daily climate extremes over southern and west Africa. J. Geophys. Res. 2006, 111, 1–11. [Google Scholar] [CrossRef]
- Li, Z.; He, Y.; Wang, P.; Theakstone, W.H.; An, W.; Wang, X.; Lu, A.; Zhang, W.; Cao, W. Changes of daily climate extremes in southwestern China during 1961–2008. Glob. Planet. Chang. 2012, 80–81, 255–272. [Google Scholar] [CrossRef]
- Li, Y.; He, D.; Hu, J.; Cao, J. Variability of extreme precipitation over Yunnan Province, China 1960–2012. Int. J. Clim. 2015, 35, 245–258. [Google Scholar] [CrossRef]
- Ge, G.; Shi, Z.; Yang, X.; Hao, Y.; Guo, H.; Kossi, F.; Xin, Z.; Wei, W.; Zhang, Z.; Zhang, X.; et al. Analysis of Precipitation Extremes in the Qinghai-Tibetan Plateau, China: Spatio-Temporal Characteristics and Topography Effects. Atmosphere 2017, 8, 127. [Google Scholar] [CrossRef] [Green Version]
- Xiong, J.; Yong, Z.; Wang, Z.; Cheng, W.; Li, Y.; Zhang, H.; Ye, C.; Yang, Y. Spatial and Temporal Patterns of the Extreme Precipitation across the Tibetan Plateau (1986–2015). Water 2019, 11, 1453. [Google Scholar] [CrossRef] [Green Version]
- Wang, W.; Shao, Q.; Yang, T.; Peng, S.; Yu, Z.; Taylor, J.; Xing, W.; Zhao, C.; Sun, F. Changes in daily temperature and precipitation extremes in the Yellow River Basin, China. Stoch. Environ. Res. Risk Assess. 2012, 27, 401–421. [Google Scholar] [CrossRef]
- Soltani, M.; Laux, P.; Kunstmann, H.; Stan, K.; Sohrabi, M.M.; Molanejad, M.; Sabziparvar, A.A.; Ranjbar SaadatAbadi, A.; Ranjbar, F.; Rousta, I.; et al. Assessment of climate variations in temperature and precipitation extreme events over Iran. Theor. Appl. Climatol. 2015, 126, 775–795. [Google Scholar] [CrossRef] [Green Version]
- Ding, J.; Cuo, L.; Zhang, Y.; Zhu, F. Monthly and annual temperature extremes and their changes on the Tibetan Plateau and its surroundings during 1963–2015. Sci. Rep. 2018, 8, 11860. [Google Scholar] [CrossRef] [Green Version]
- Roxy, M.K.; Ritika, K.; Terray, P.; Murtugudde, R.; Ashok, K.; Goswami, B.N. Drying of Indian subcontinent by rapid Indian Ocean warming and a weakening land-sea thermal gradient. Nat. Commun. 2015, 6, 7423. [Google Scholar] [CrossRef] [PubMed] [Green Version]
- Turner, A.G.; Annamalai, H. Climate change and the South Asian summer monsoon. Nat. Clim. Chang. 2012, 2, 587–595. [Google Scholar] [CrossRef]
- Yuan, J.; Xu, Y.; Wu, L.; Wang, J.; Wang, Y.; Xu, Y.; Dai, X. Variability of precipitation extremes over the Yangtze River Delta, eastern China, during 1960–2016. Theor. Appl. Climatol. 2019, 2019, 1–15. [Google Scholar] [CrossRef]
- Yao, T.; Li, Z.; Yang, W.; Guo, X.; Zhu, L.; Kang, S.; Wu, Y.; Yu, W. Glacial distribution and mass balance in the Yarlung Zangbo River and its influence on lakes. Chin. Sci. Bull. 2010, 55, 2072–2078. [Google Scholar] [CrossRef]
- Liu, Z.; Wang, R.; Yao, Z. Climate change and its impact on water availability of large international rivers over the mainland Southeast Asia. Hydrol. Process. 2018, 32, 3966–3977. [Google Scholar] [CrossRef]
- Yang, T.; Hao, X.; Shao, Q.; Xu, C.-Y.; Zhao, C.; Chen, X.; Wang, W. Multi-model ensemble projections in temperature and precipitation extremes of the Tibetan Plateau in the 21st century. Glob. Planet. Chang. 2012, 80–81, 1–13. [Google Scholar] [CrossRef]
Figure 1.
Location of the study area and the meteorological stations.
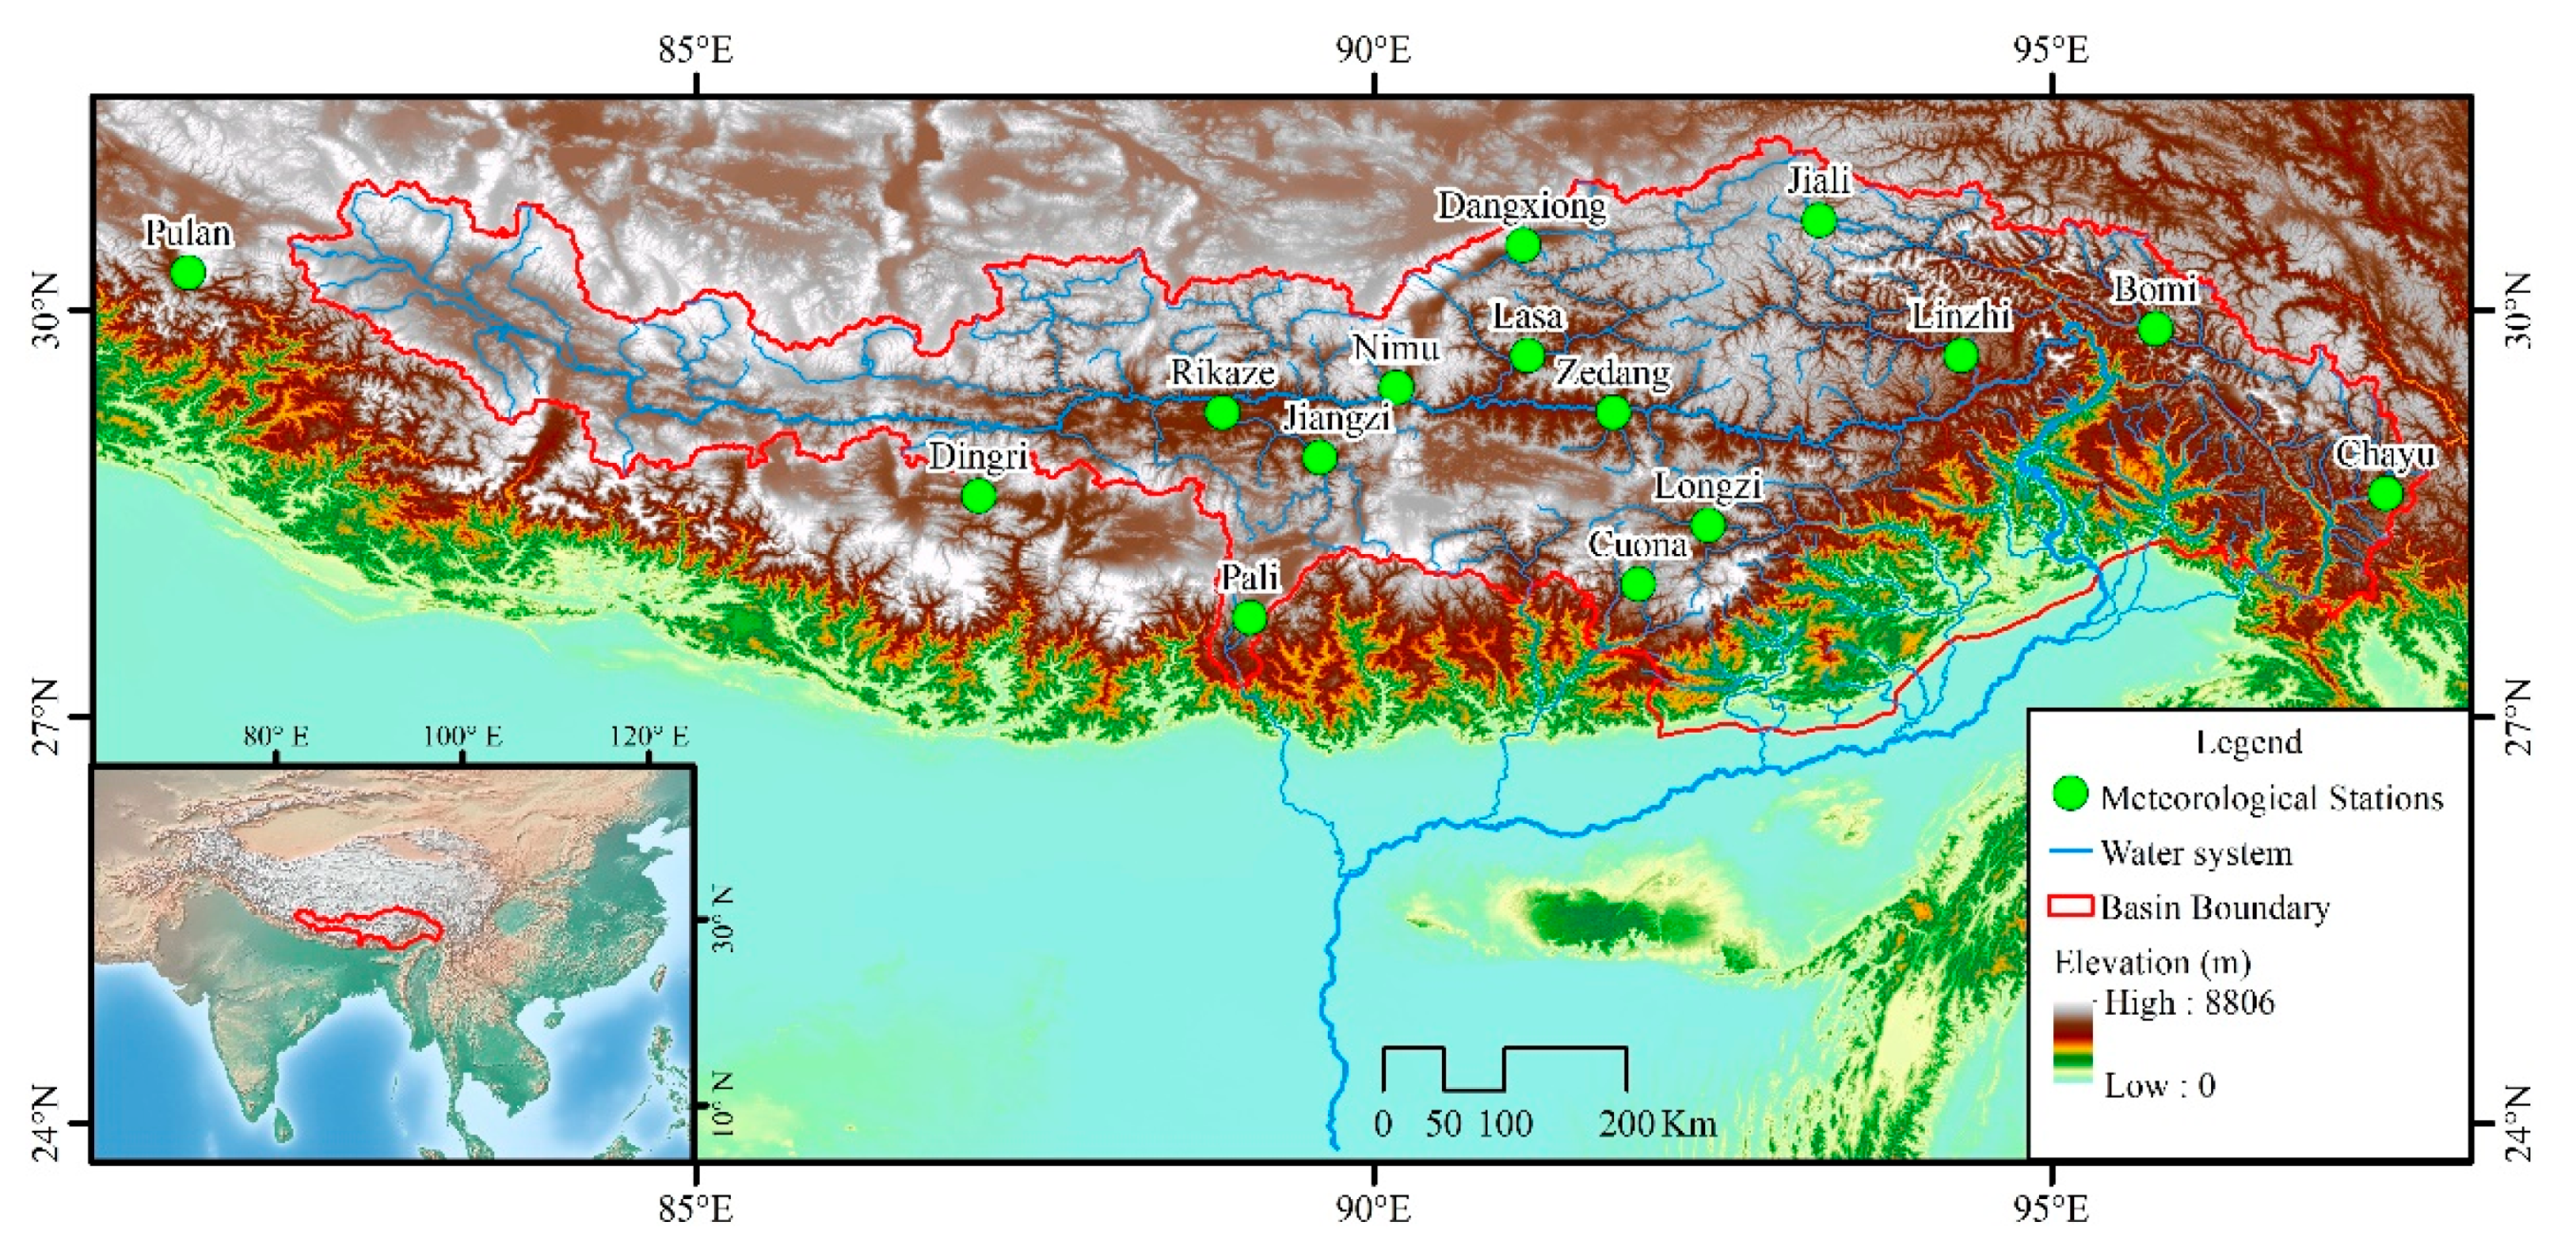
Figure 2.
Regionally averaged anomaly series of (a) TNn, (b) TNx, (c) TXn, (d) TXx, and (e) DTR during 1970–2017. The black dashed line is the linear trend and the solid orange line from Locally Estimated Scatterplot Smoothing (LOESS). Z is the Mann–Kendall test statistic and S is the Sen’s slope.
Figure 2.
Regionally averaged anomaly series of (a) TNn, (b) TNx, (c) TXn, (d) TXx, and (e) DTR during 1970–2017. The black dashed line is the linear trend and the solid orange line from Locally Estimated Scatterplot Smoothing (LOESS). Z is the Mann–Kendall test statistic and S is the Sen’s slope.
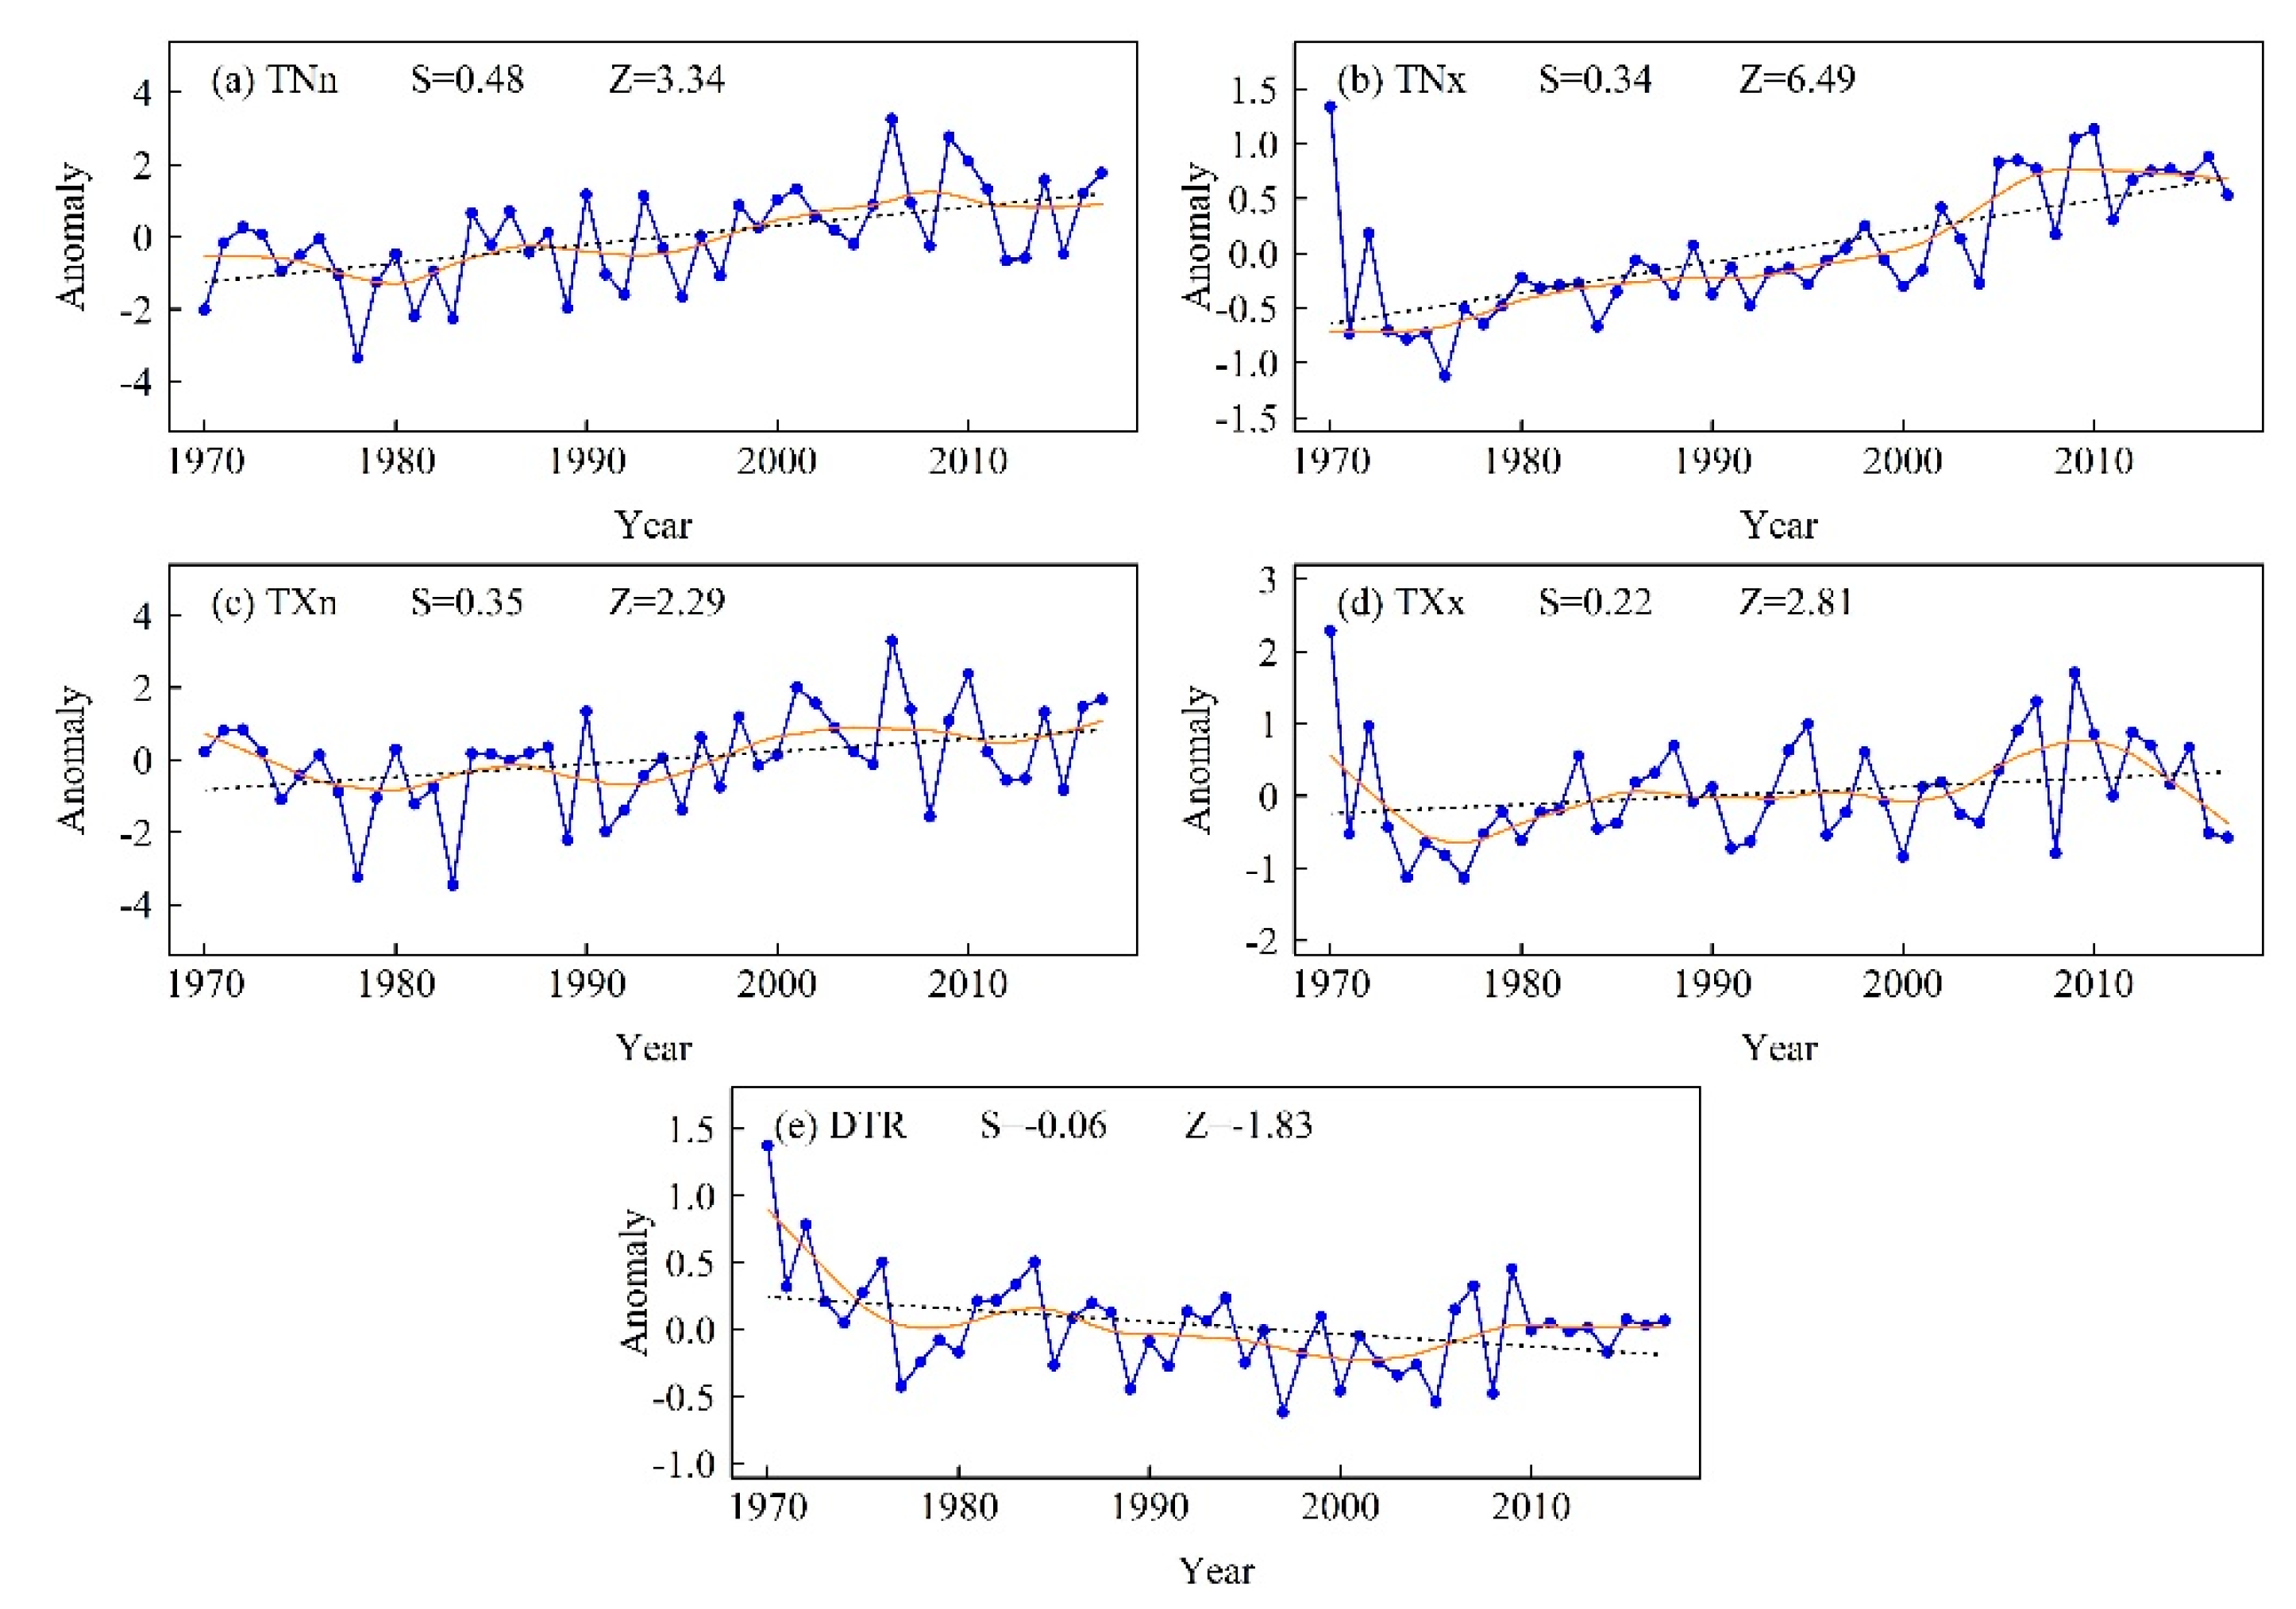
Figure 3.
Spatial distribution of change trends for (a) TNn, (b) TNx, (c) TXn, (d) TXx, and (e) DTR during 1970–2017. Positive/negative trends are shown as up/down triangles. Triangle size is proportional to the magnitude of the trend. Trends significant at the 0.05 level are shown by a black box.
Figure 3.
Spatial distribution of change trends for (a) TNn, (b) TNx, (c) TXn, (d) TXx, and (e) DTR during 1970–2017. Positive/negative trends are shown as up/down triangles. Triangle size is proportional to the magnitude of the trend. Trends significant at the 0.05 level are shown by a black box.
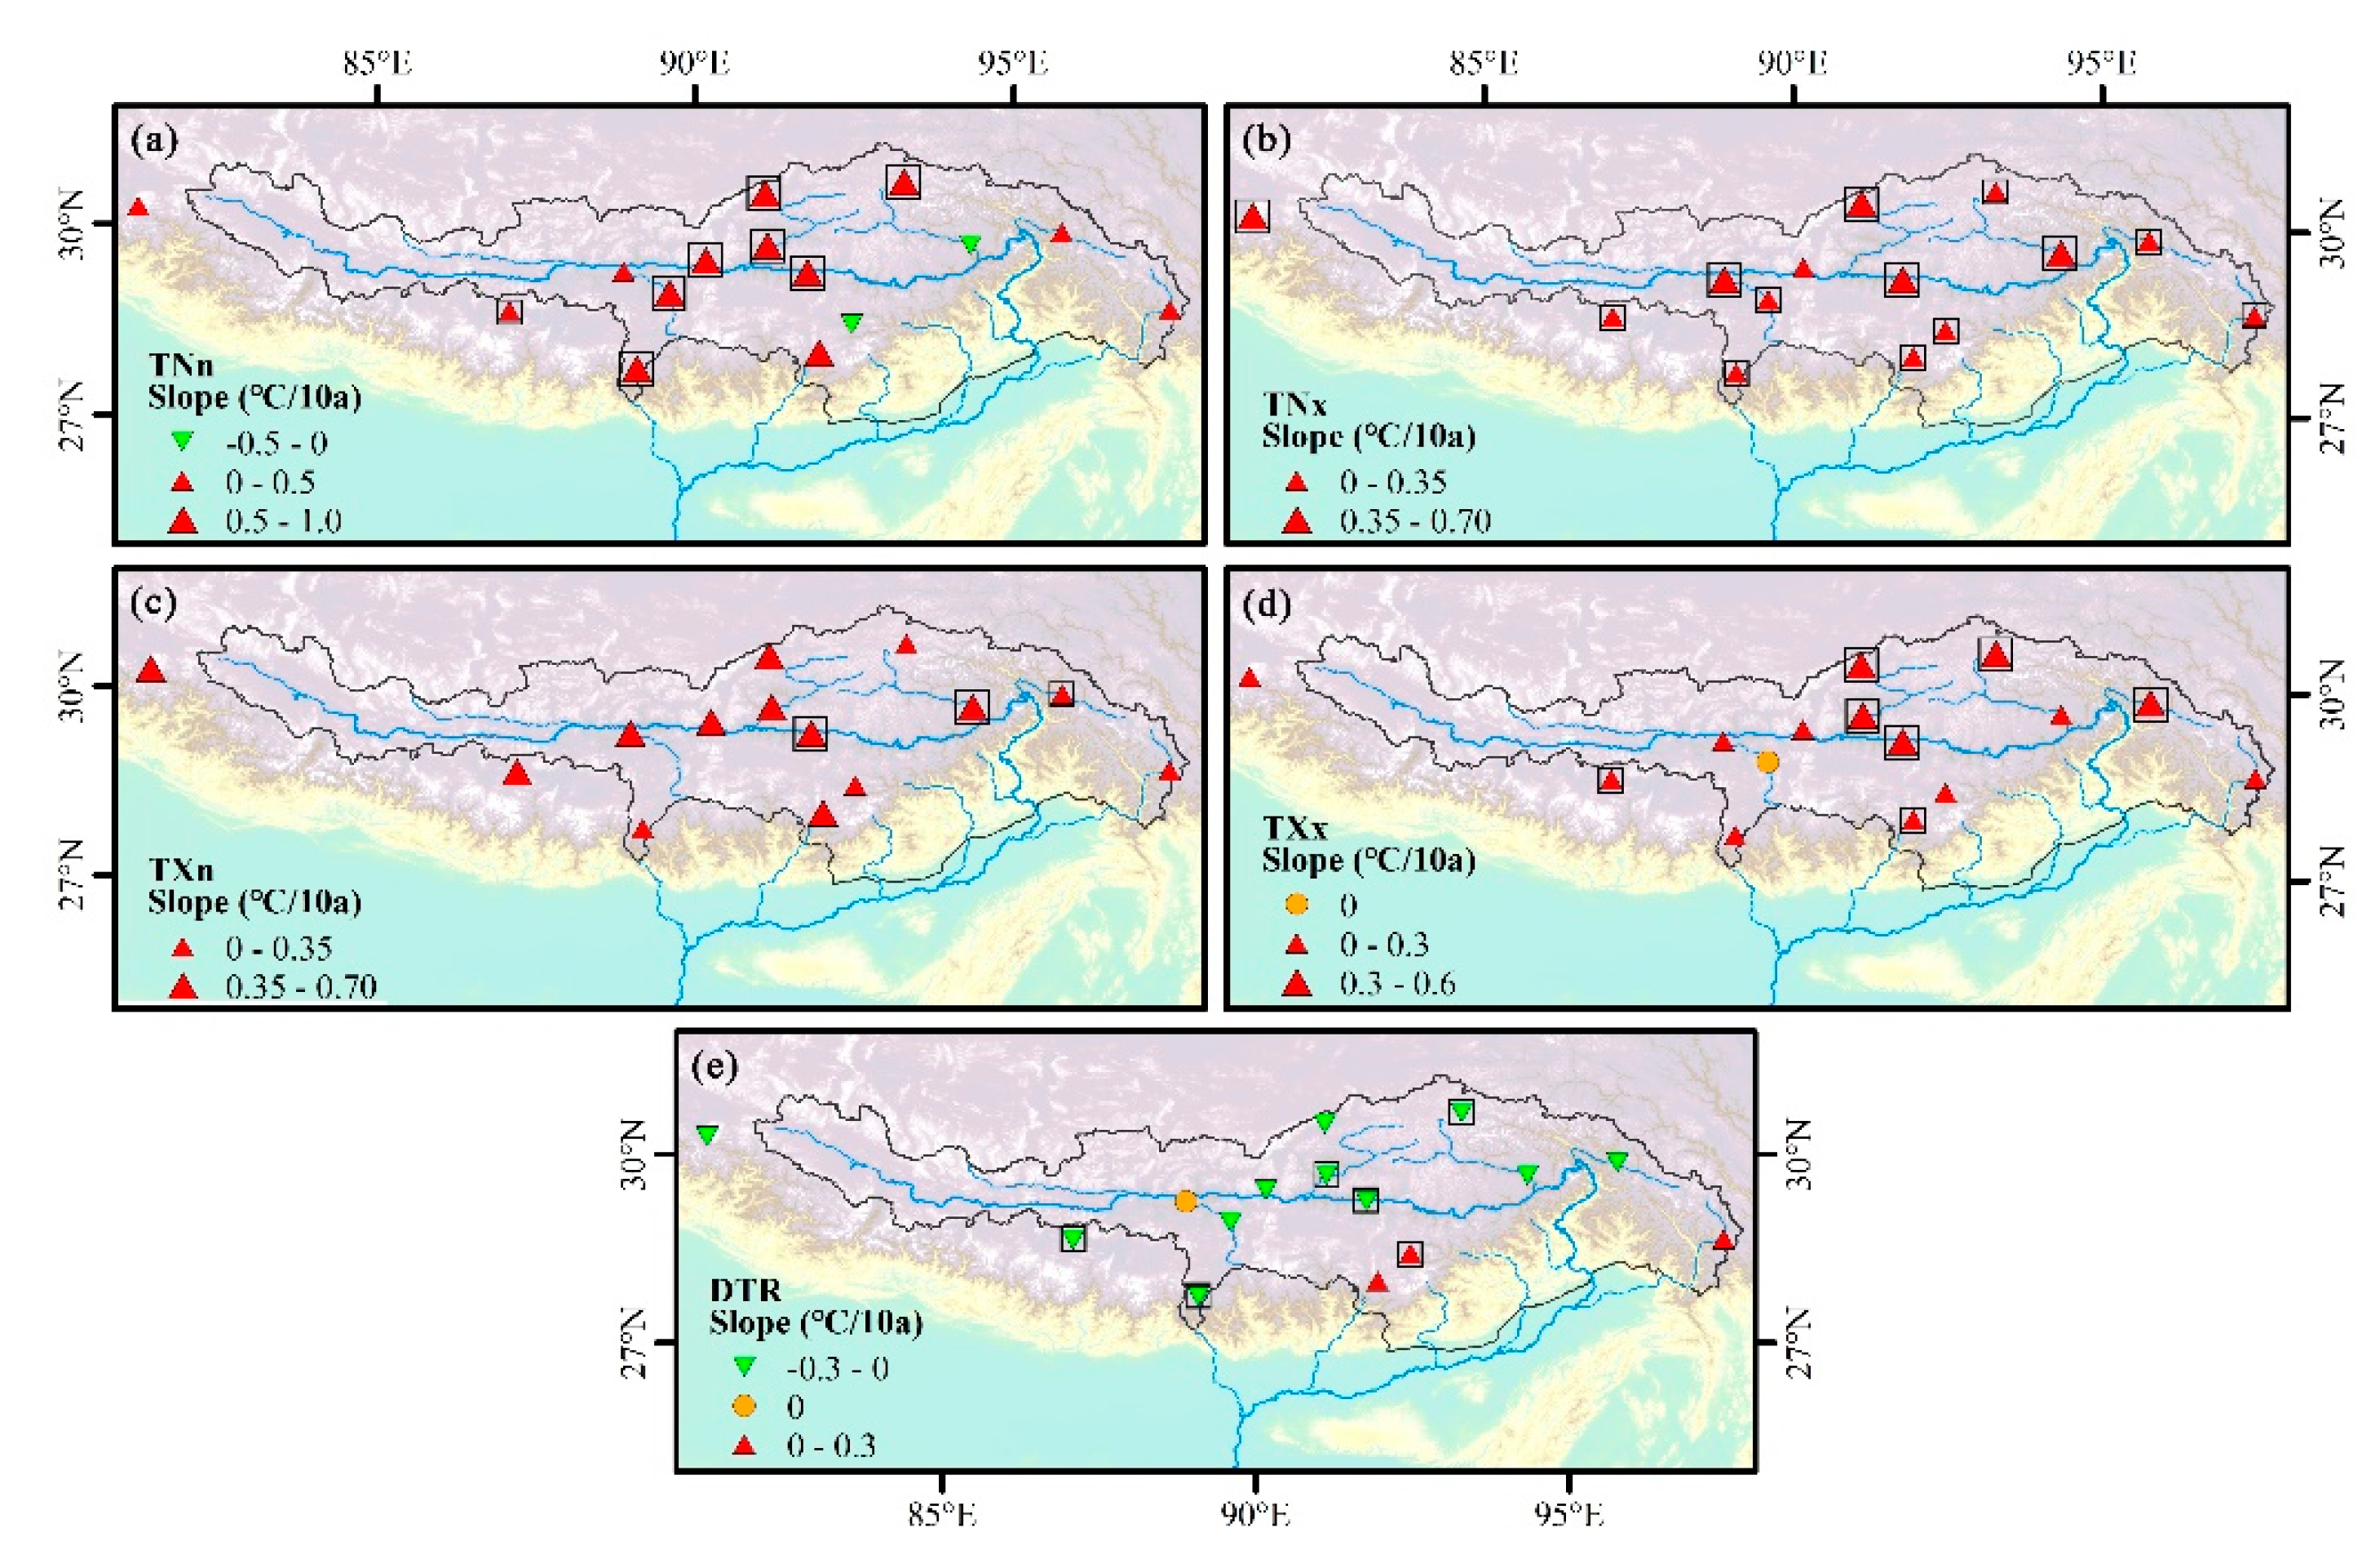
Figure 4.
Regionally averaged anomaly series of (a) TN10p, (b) TX10p, (c) FD, (d) ID, and (e) CSDI during 1970–2017. The black dashed line is the linear trend and the solid orange line from Locally Estimated Scatterplot Smoothing (LOESS). Z is the Mann–Kendall test statistic and S is the Sen’s slope.
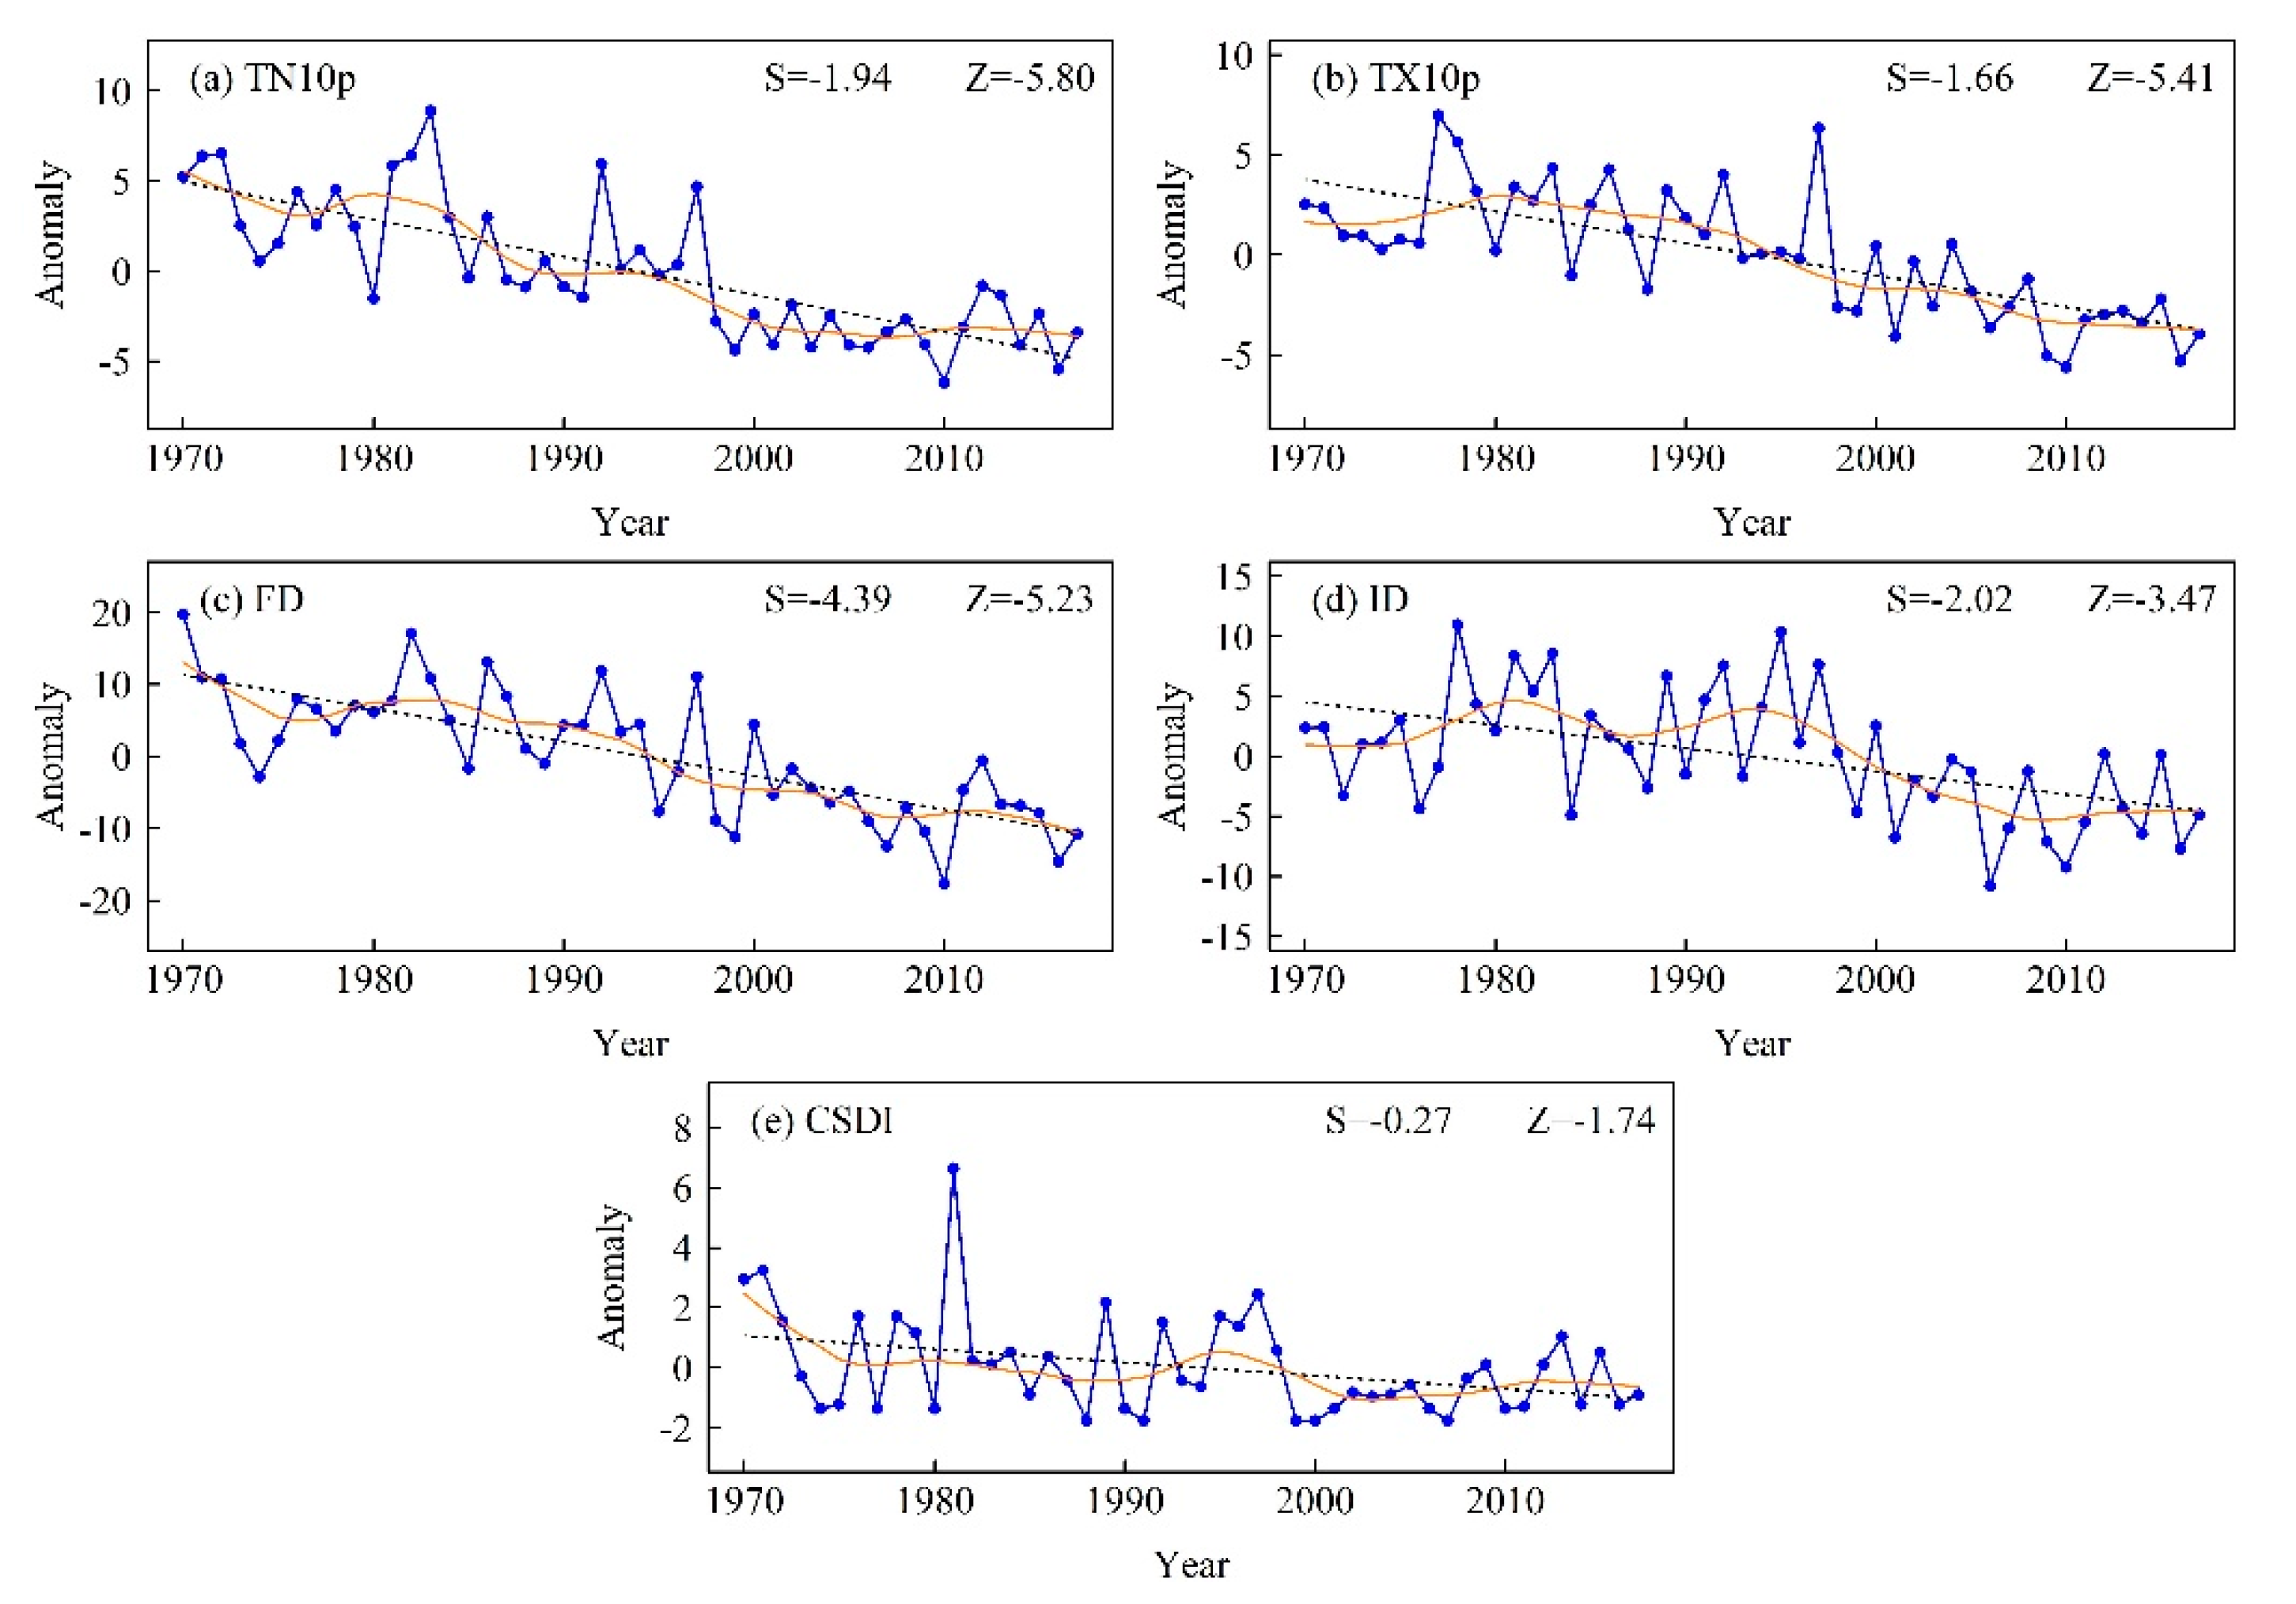
Figure 5.
Spatial distribution of change trends for (a) TN10p, (b) TX10p, (c) FD, (d) ID, and (e) CSDI during 1970–2017. Positive/negative trends are shown as up/down triangles. Triangle size is proportional to the magnitude of the trend. Trends significant at the 0.05 level are shown by a black box.
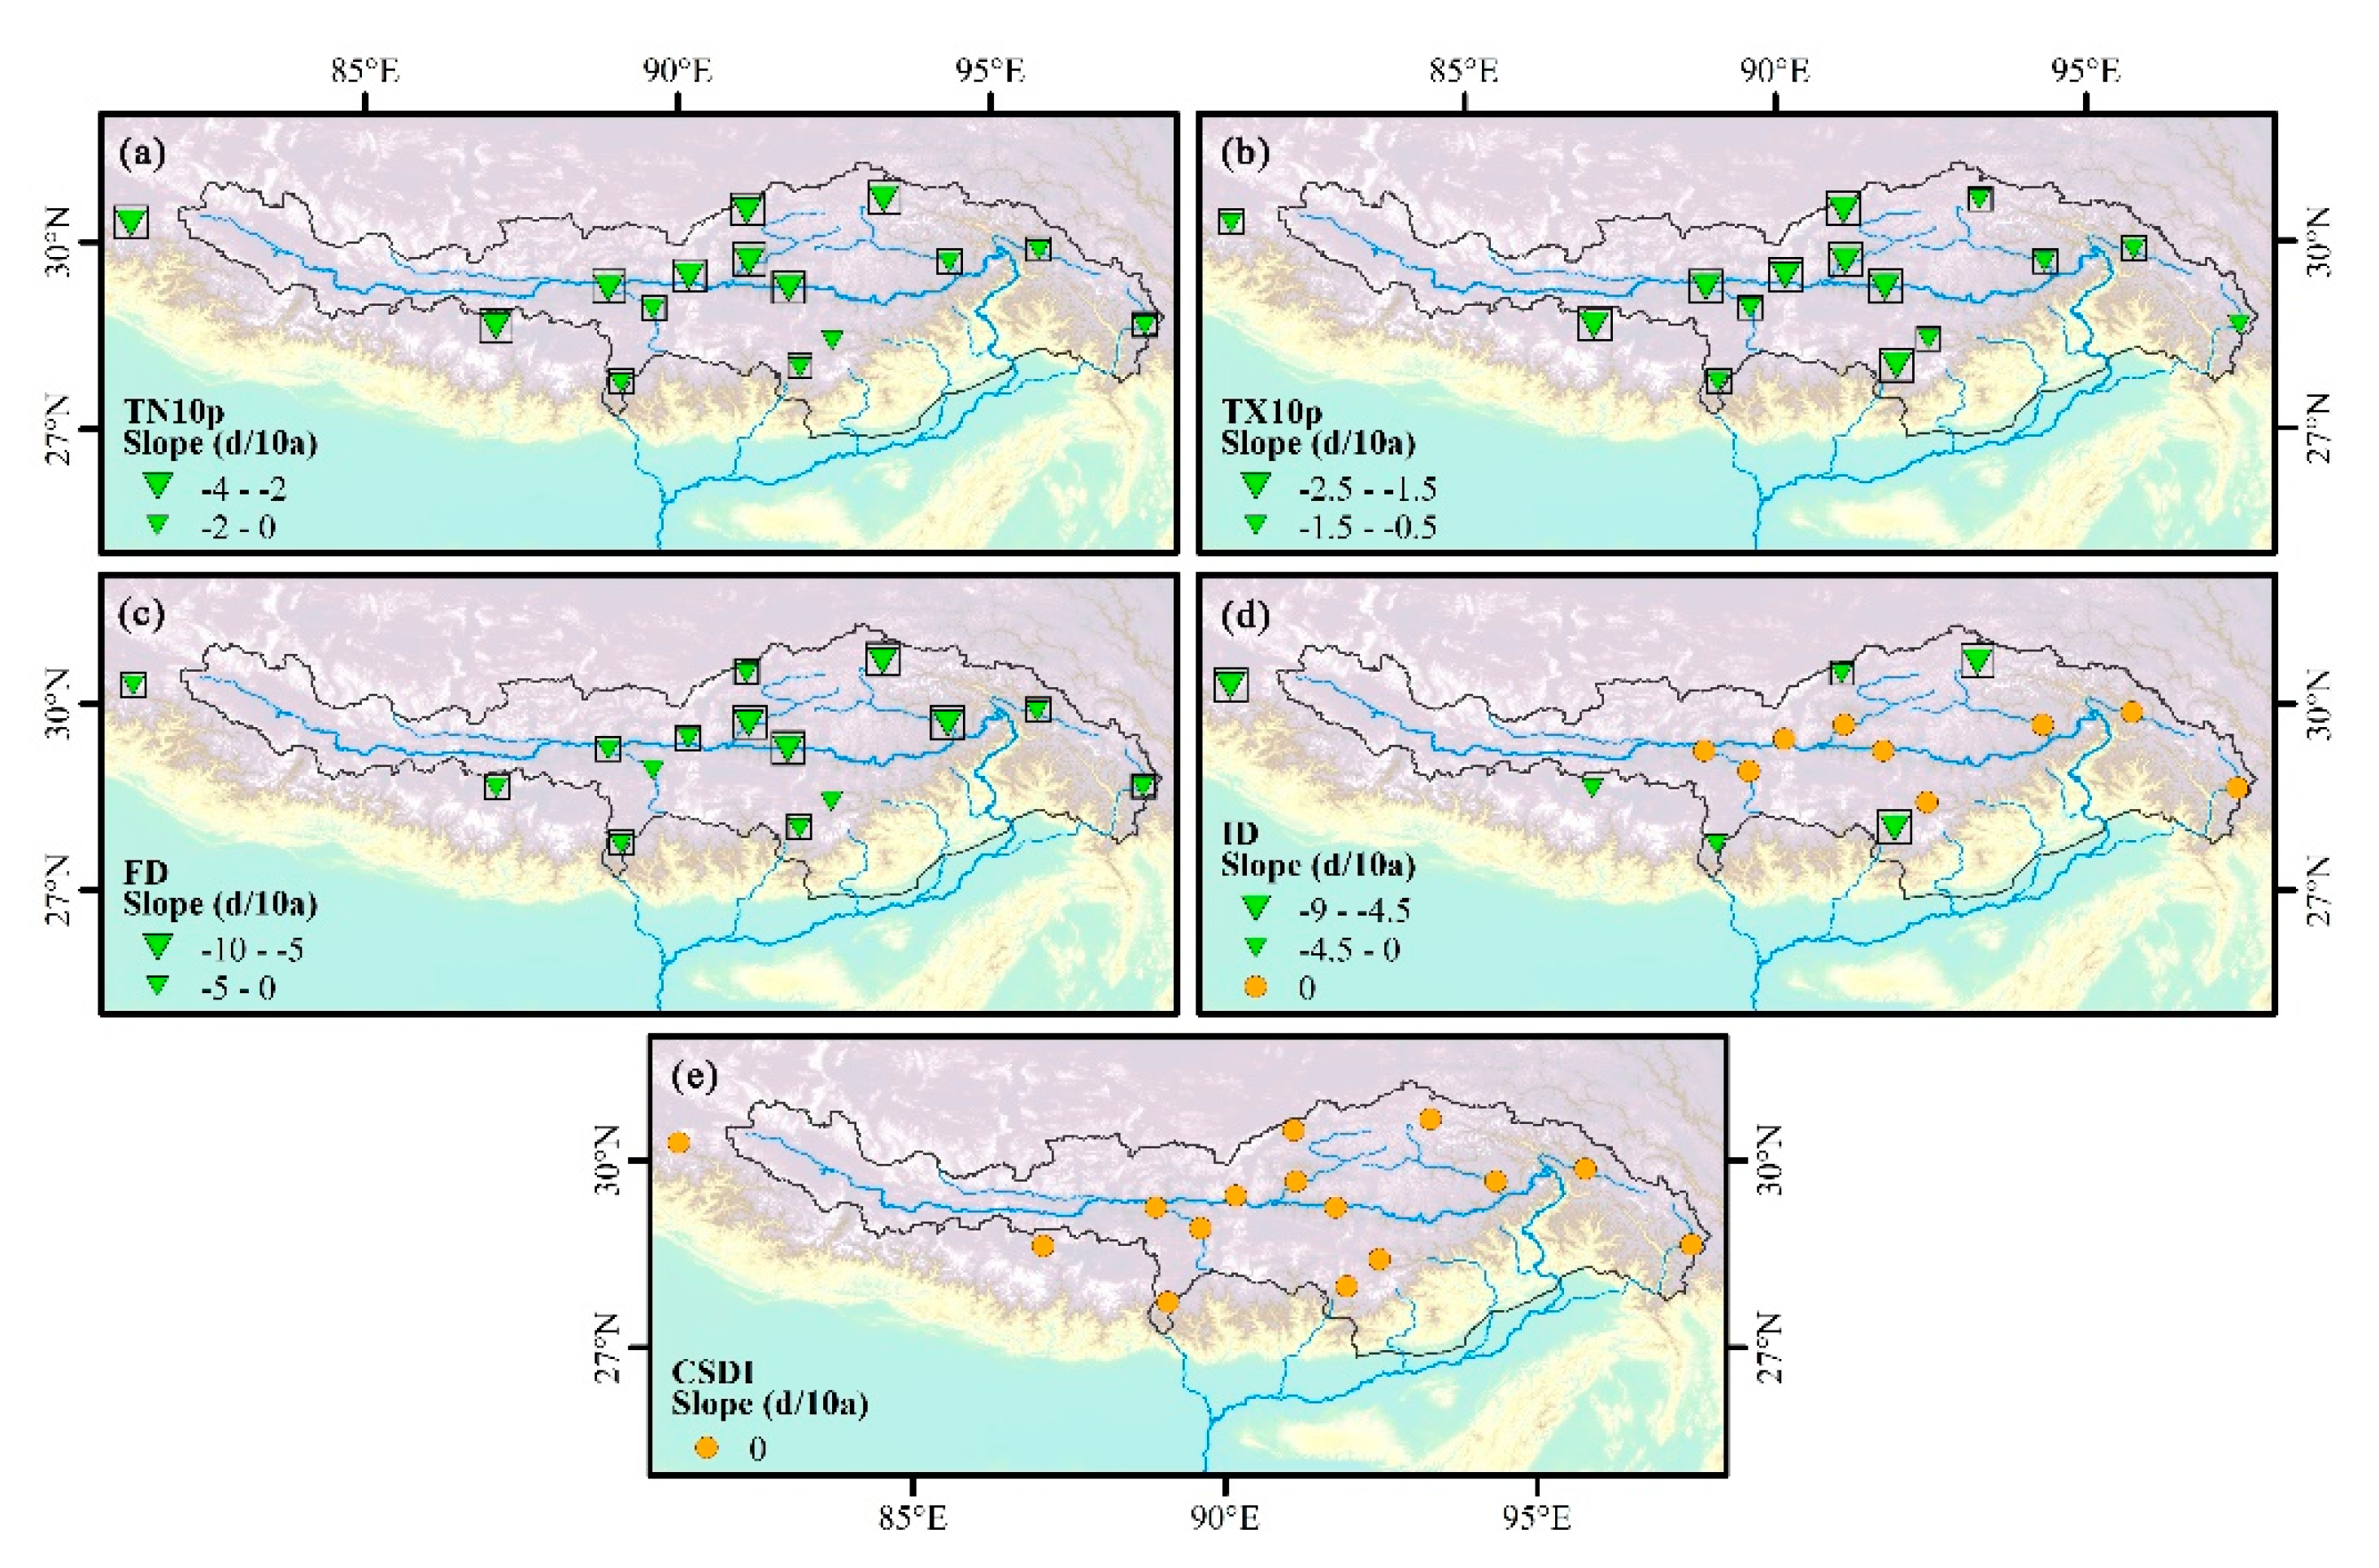
Figure 6.
Regionally averaged anomaly series of (a) TN90p, (b) TX90p, (c) GSL, (d) SU25, and (e) WSDI during 1970–2017. The black dashed line is the linear trend and the solid orange line from Locally Estimated Scatterplot Smoothing (LOESS). Z is the Mann–Kendall test statistic and S is the Sen’s slope.
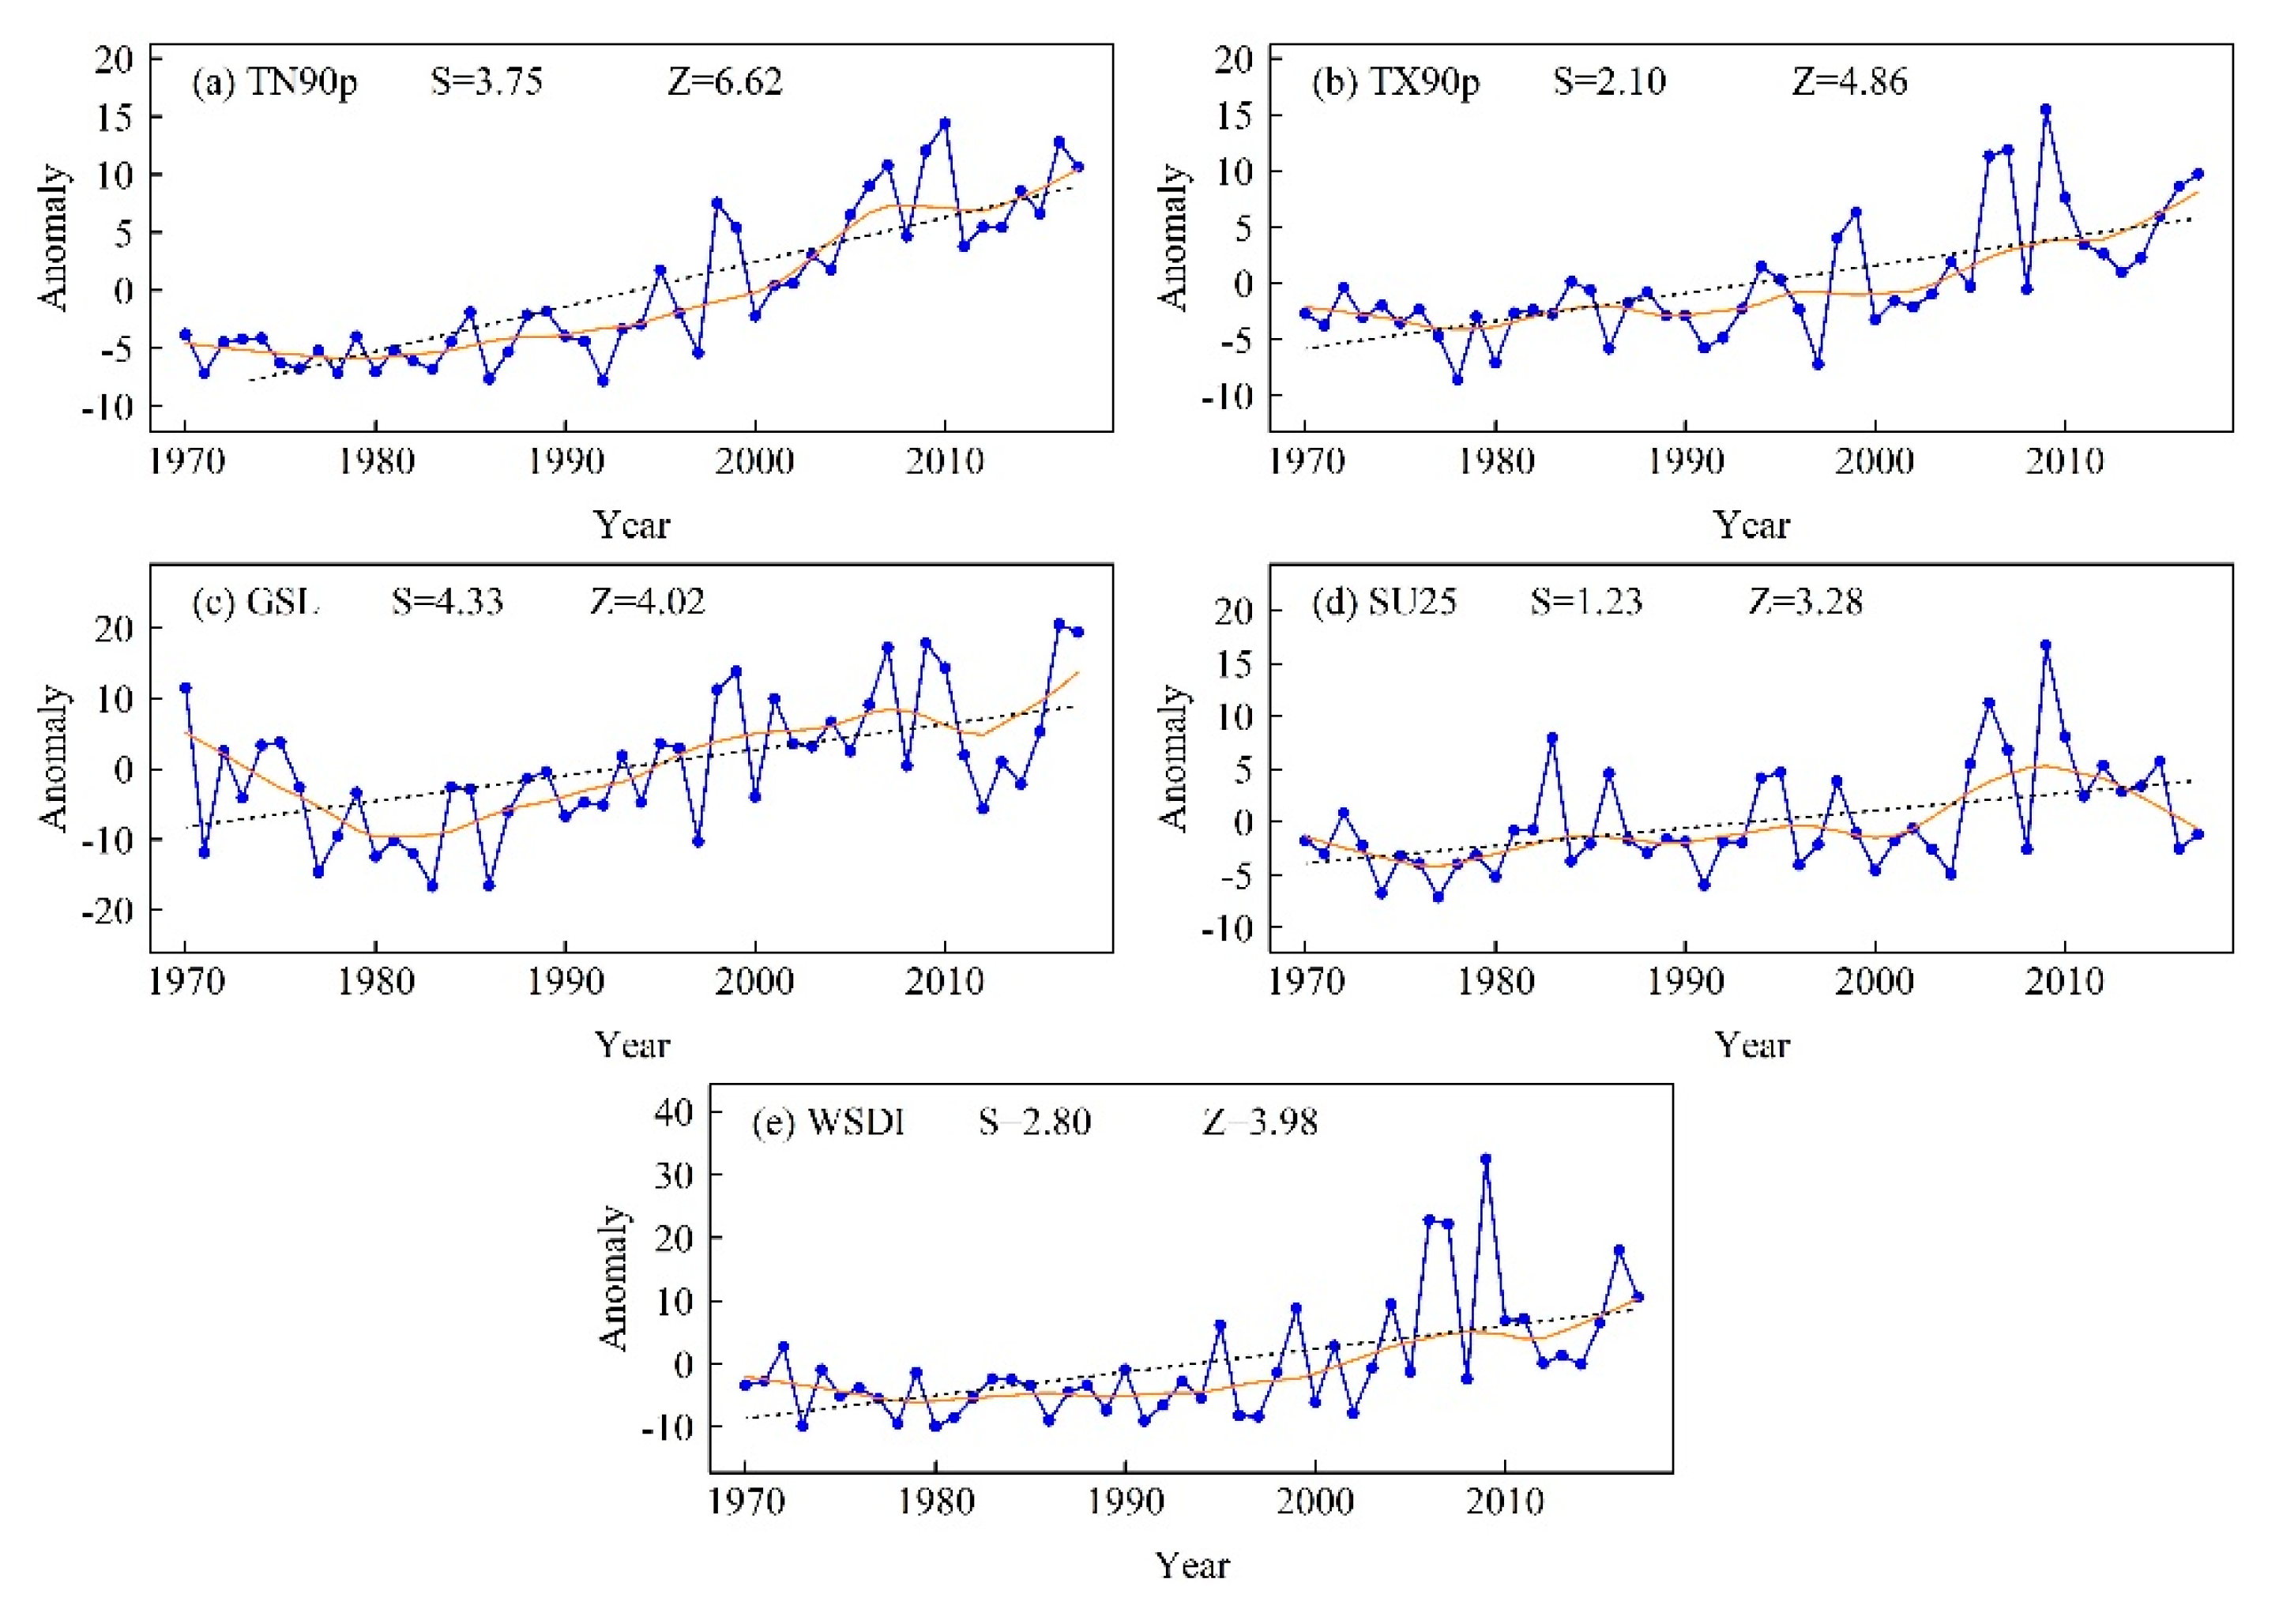
Figure 7.
Spatial distribution of change trends for (a) TN90p, (b) TX90p, (c) GSL, (d) SU25, and (e) WSDI during 1970–2017. Positive/negative trends are shown as up/down triangles. Triangle size is proportional to the magnitude of the trend. Trends significant at the 0.05 level are shown by a black box.
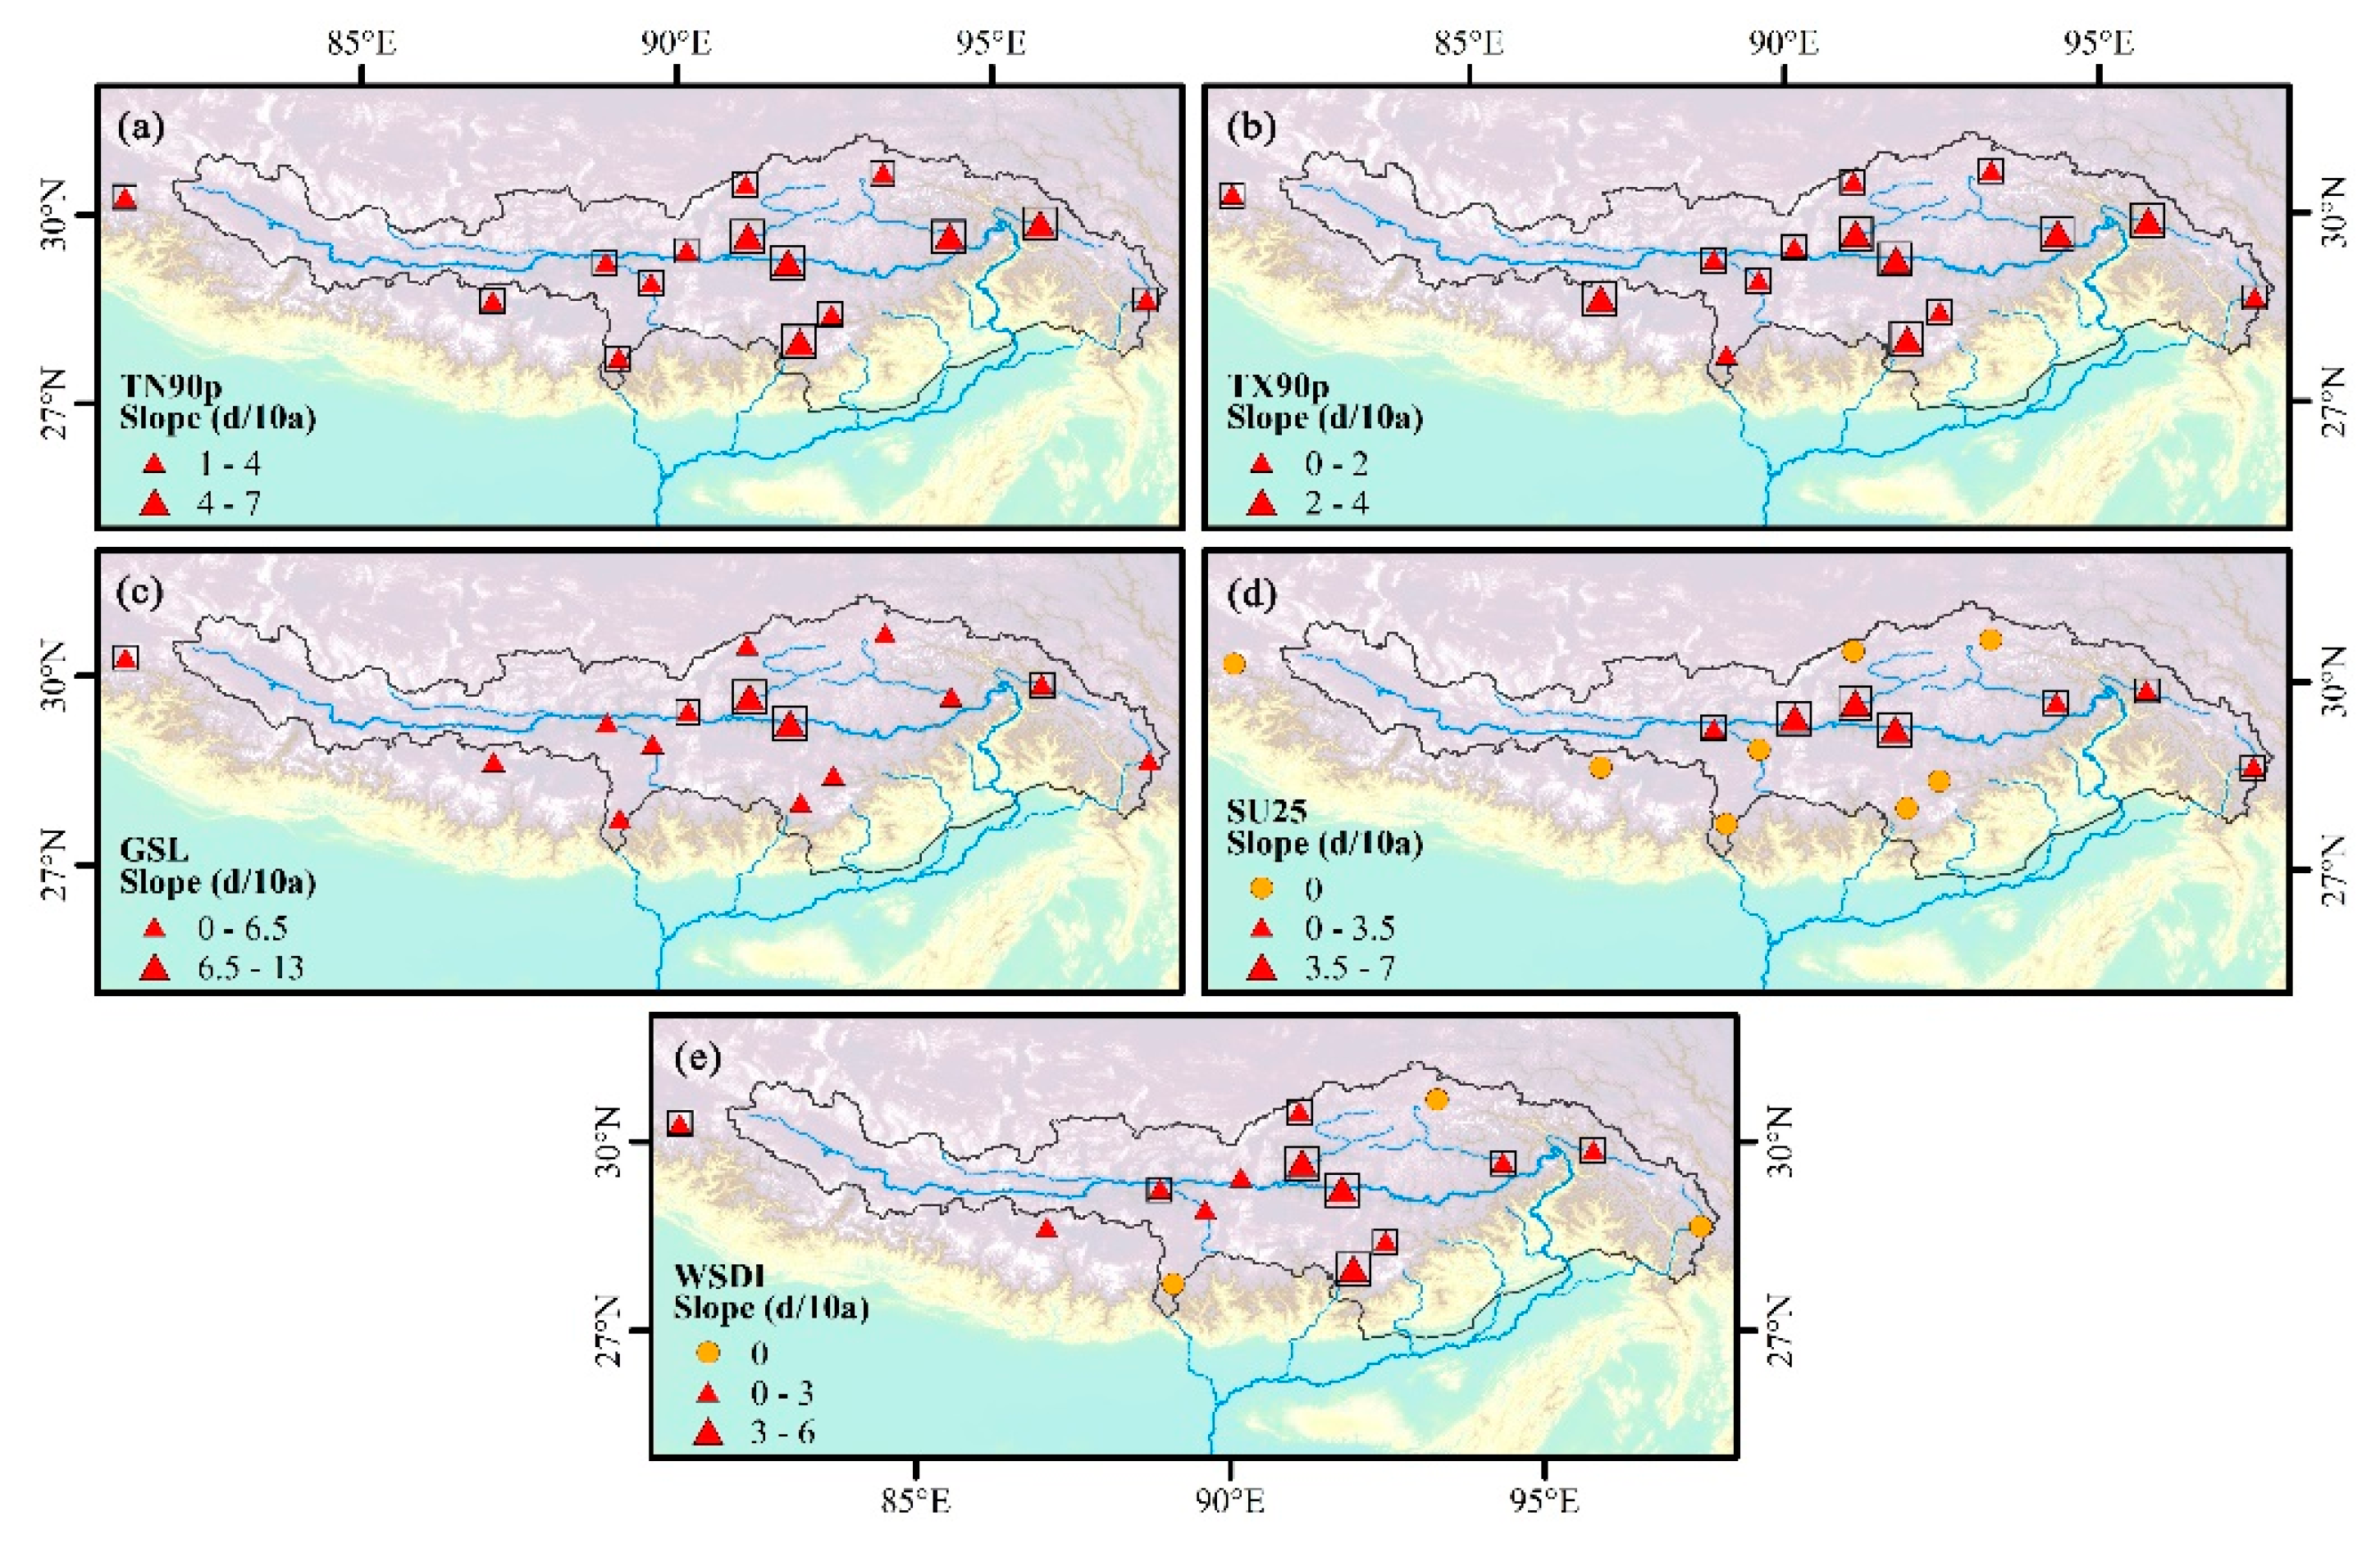
Figure 8.
Regionally averaged anomaly series of (a) PRCPTOT, (b) SDII, (c) RX1d, (d) RX5d, (e) R95p, and (f) R99p during 1970–2017. The black dashed line is the linear trend and the solid orange line from Locally Estimated Scatterplot Smoothing (LOESS). Z is the Mann–Kendall test statistic and S is the Sen’s slope.
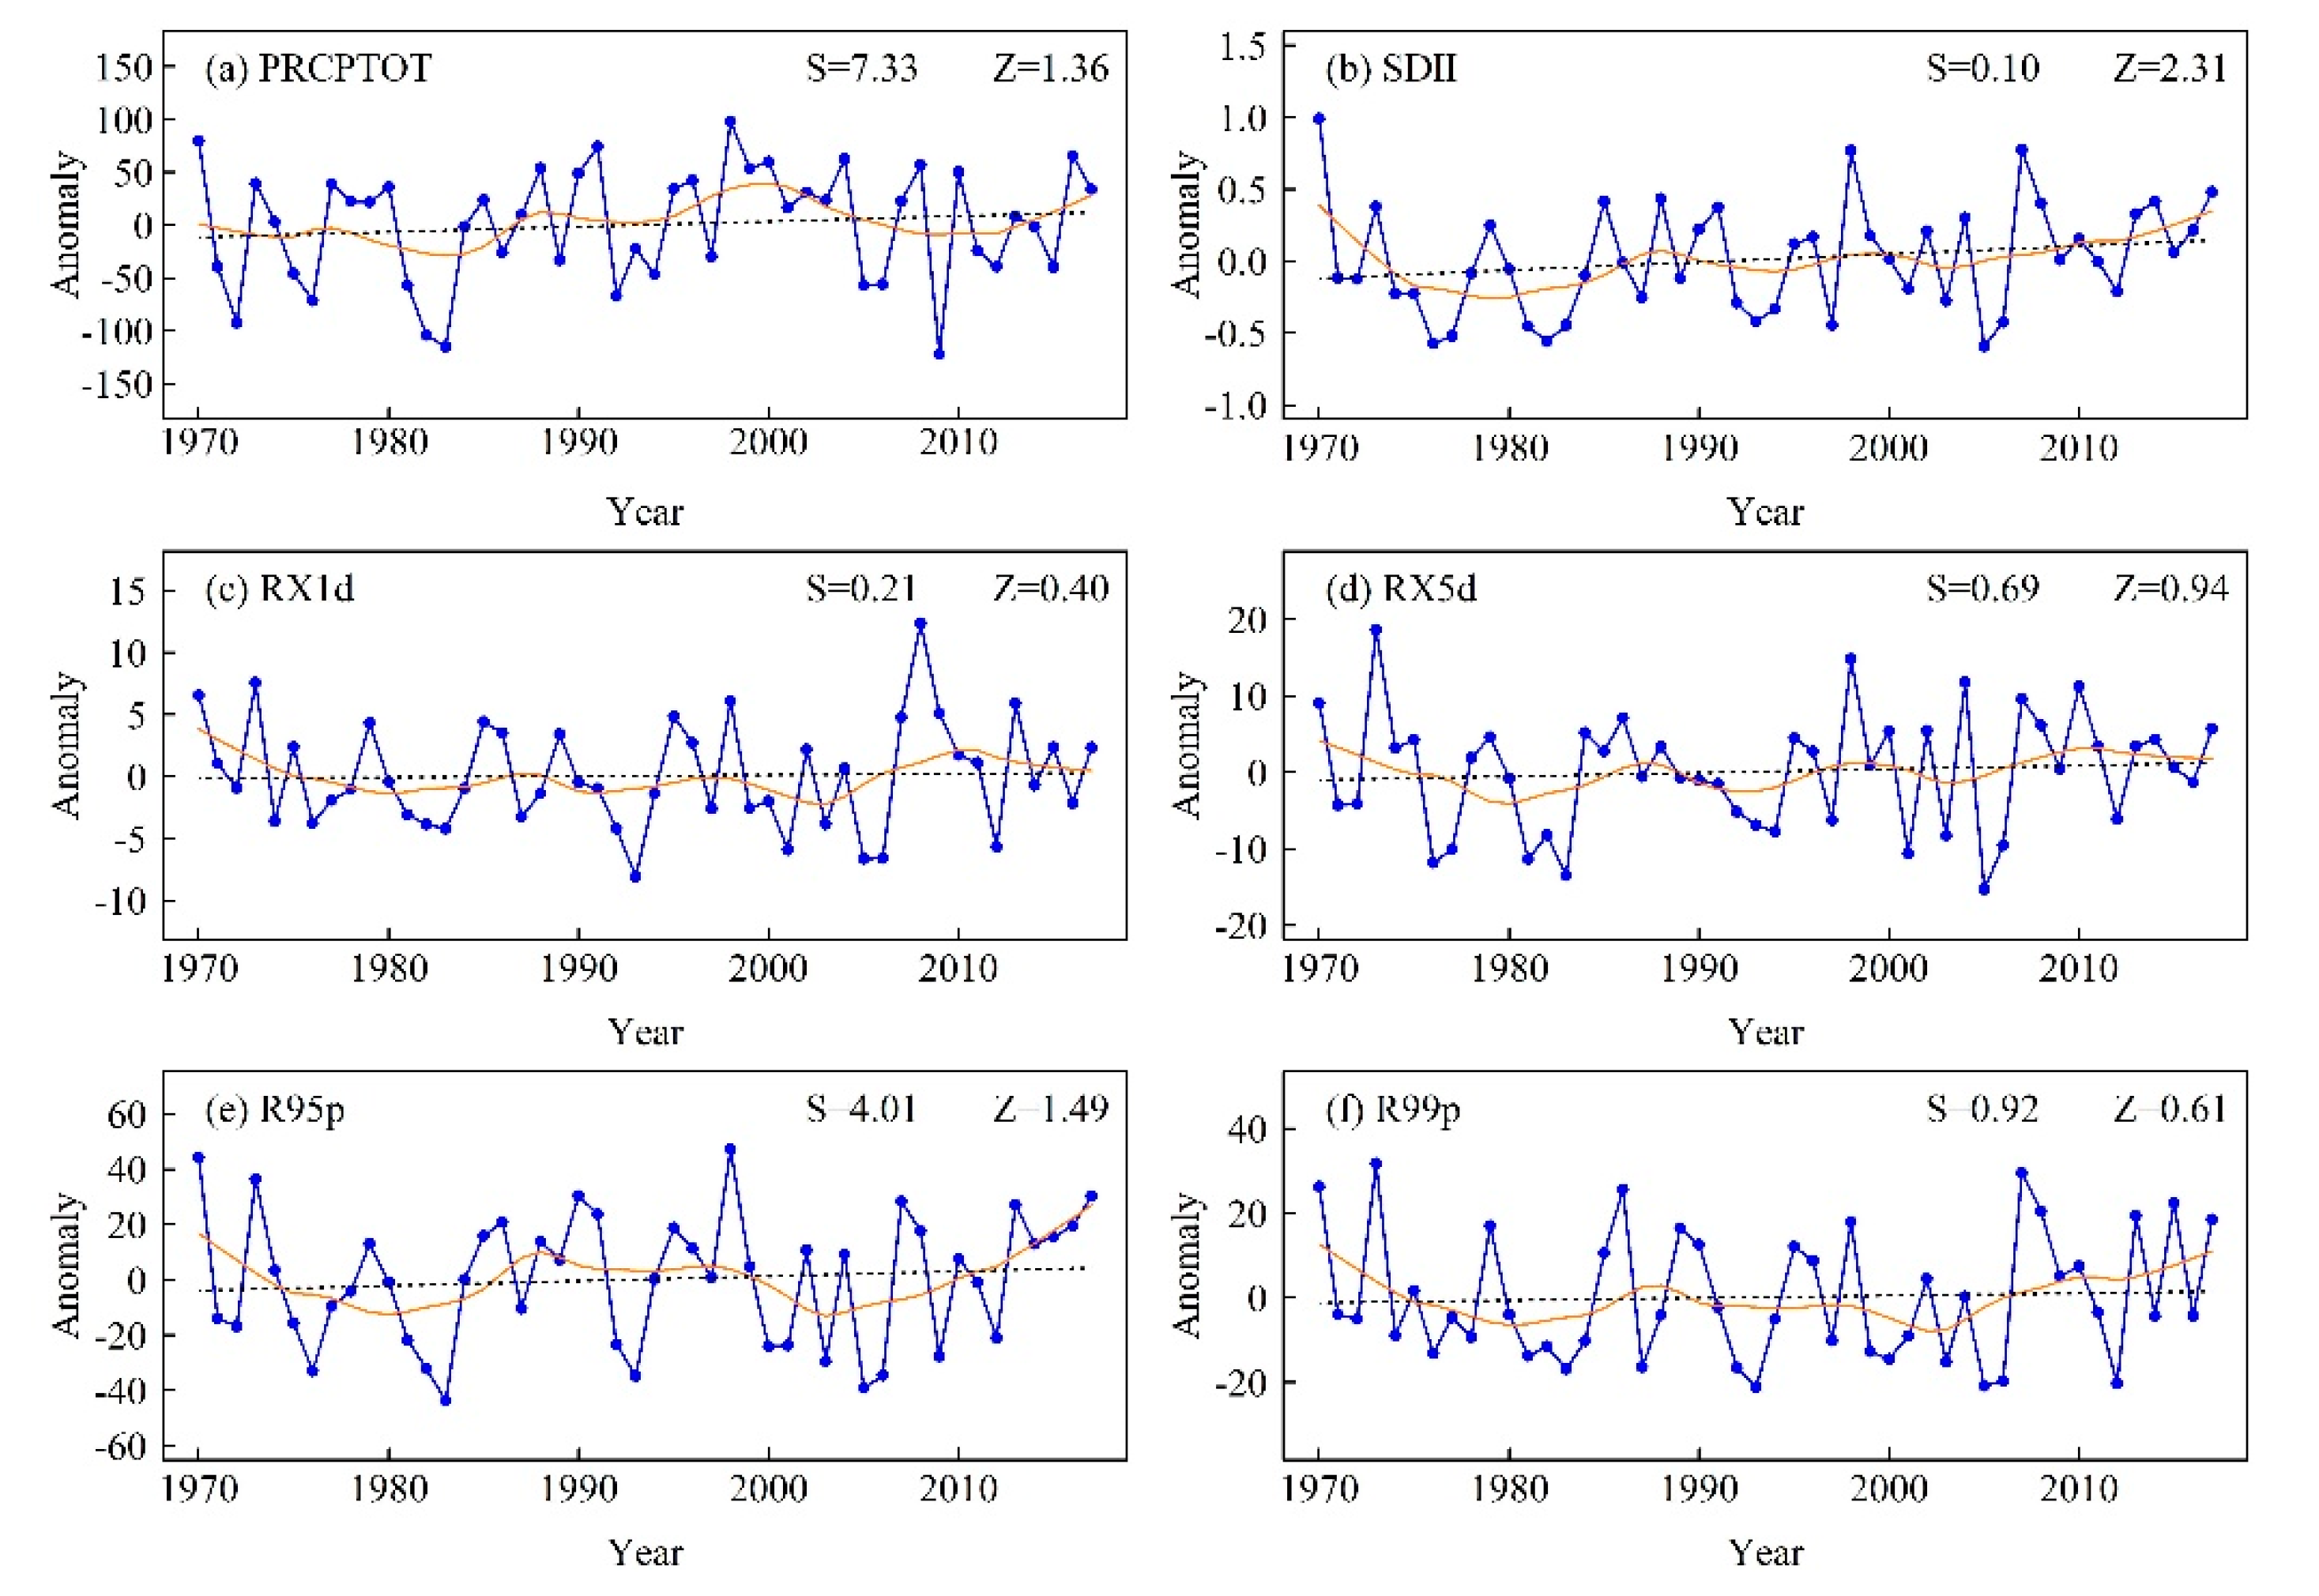
Figure 9.
Spatial distribution of change trends for (a) PRCPTOT, (b) SDII, (c) RX1d, (d) RX5d, (e) R95p, and (f) R99p during 1970–2017. Positive/negative trends are shown as up/down triangles. Triangle size is proportional to the magnitude of the trend. Trends significant at the 0.05 level are shown by a black box.
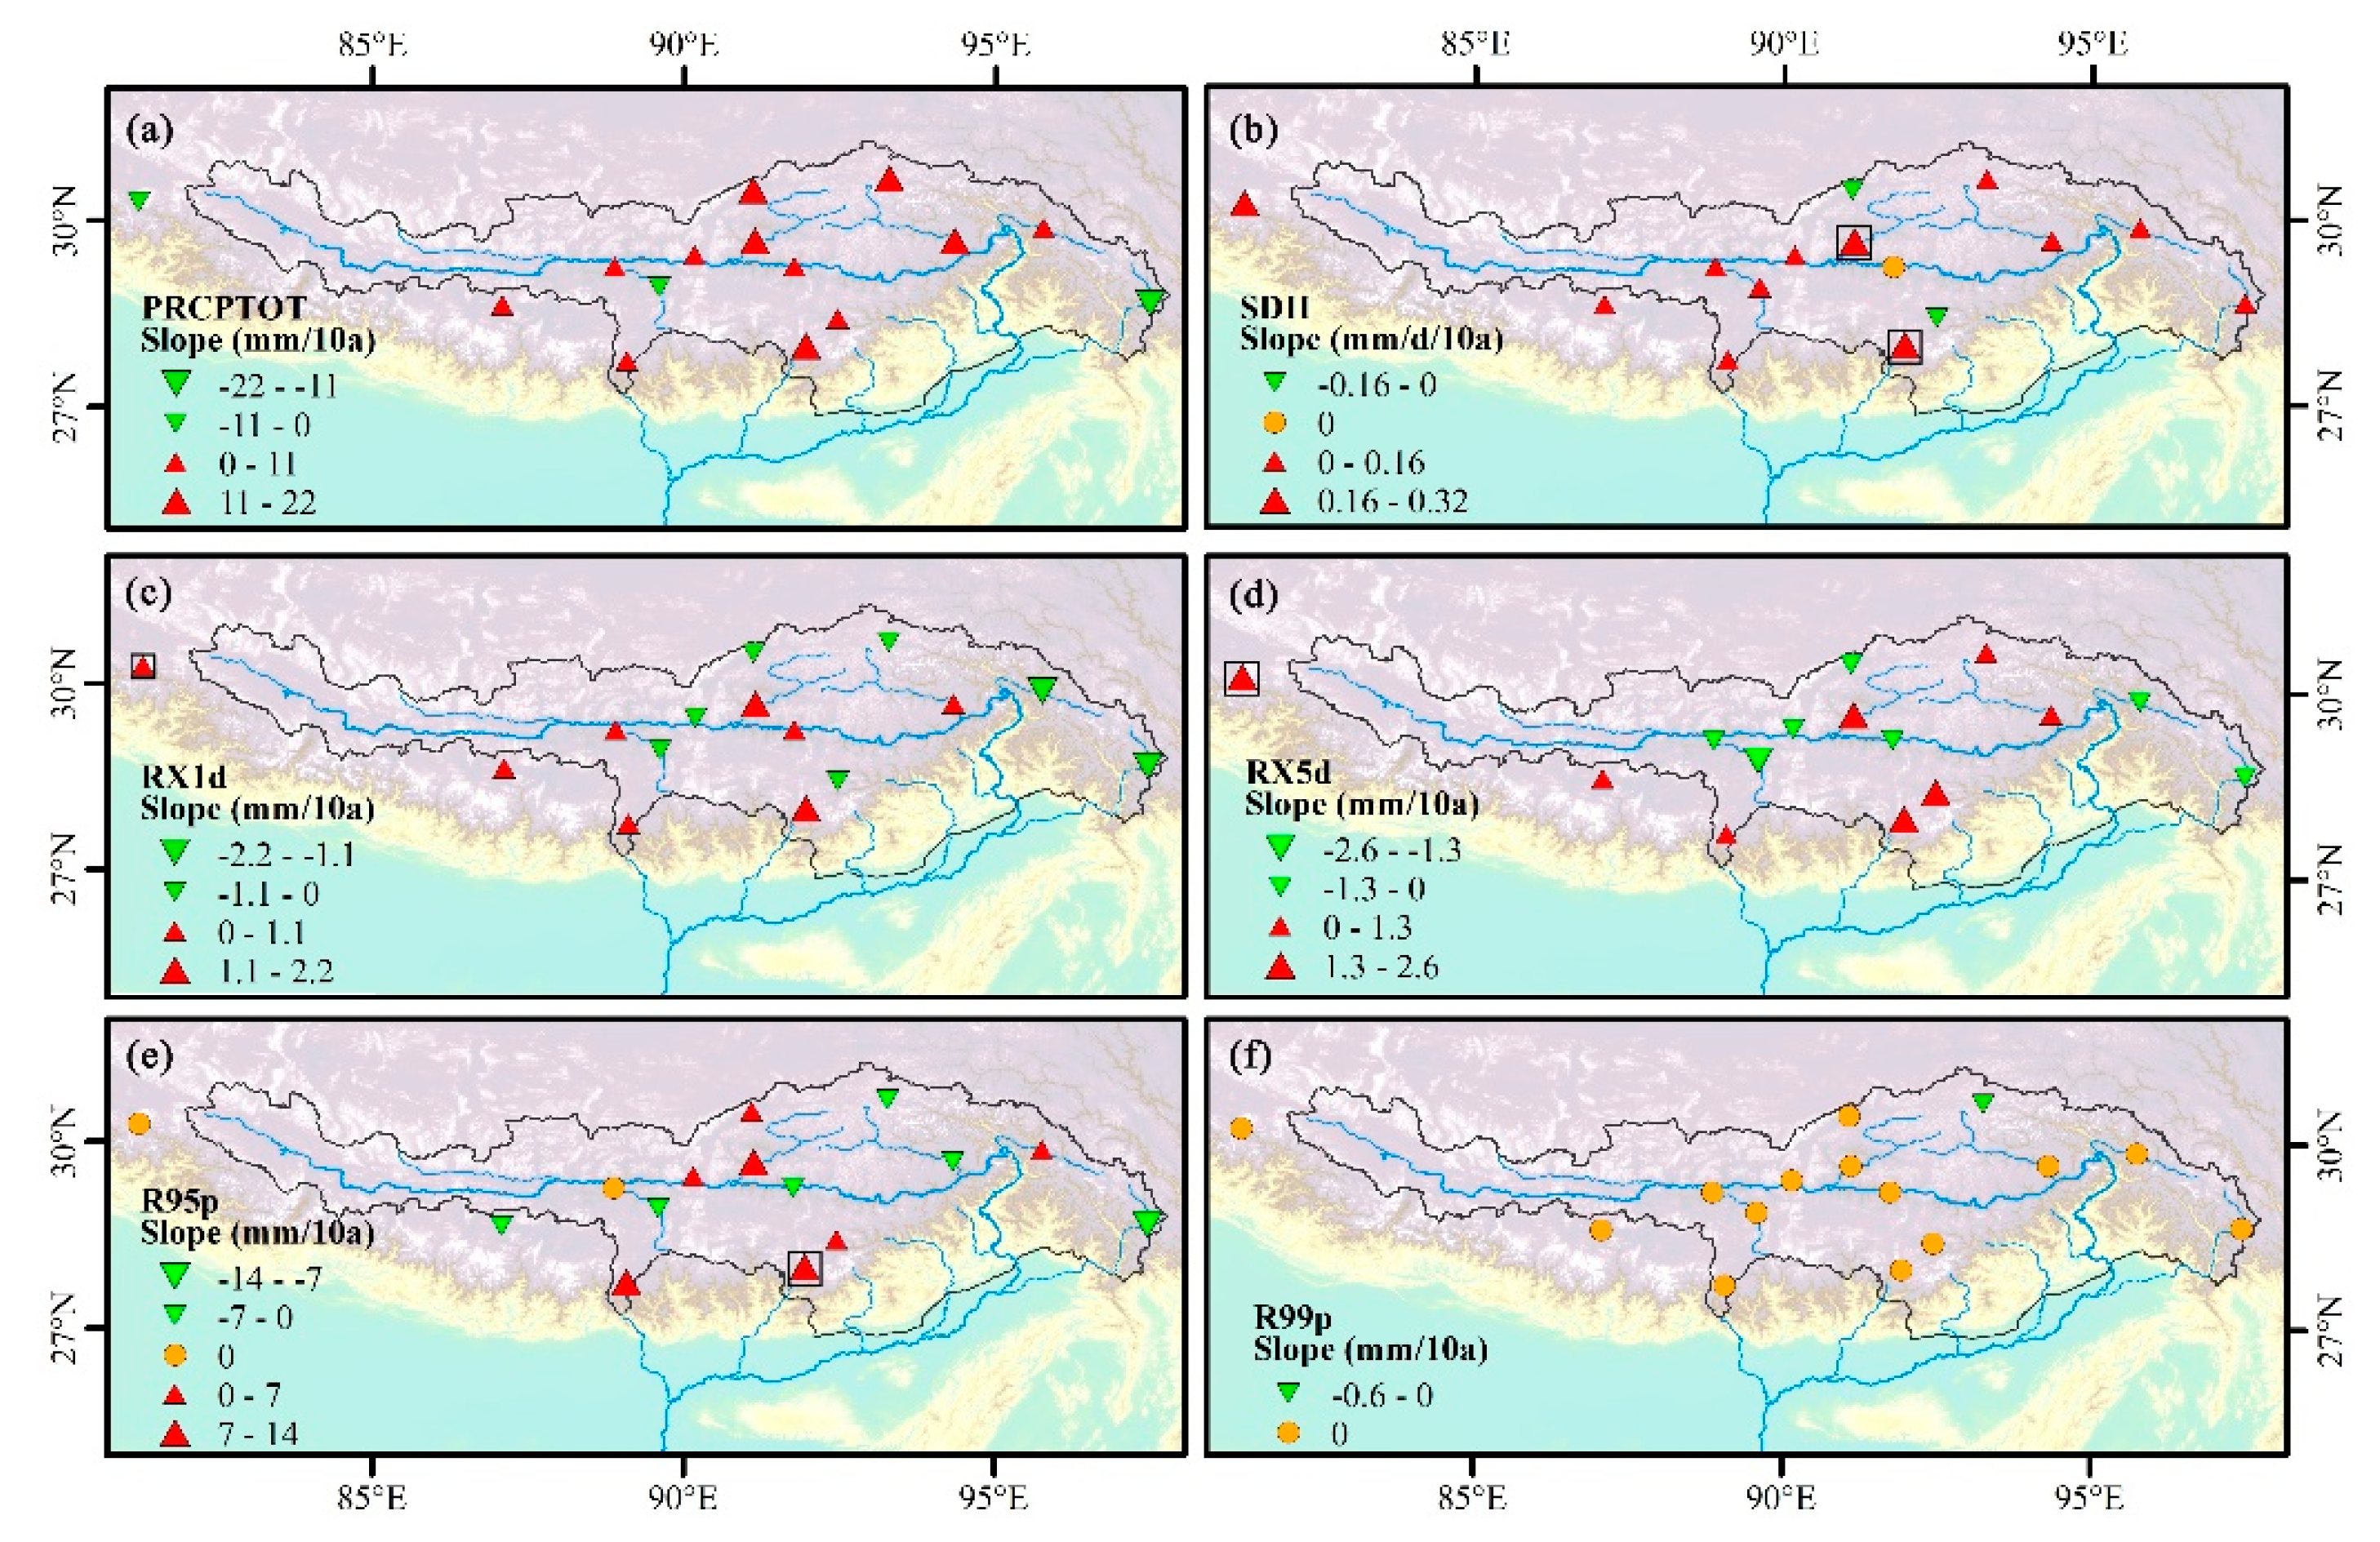
Figure 10.
Regionally averaged anomaly series of (a) R10mm, (b) R20mm, (c) CWD, and (d) CDD during 1970–2017. The black dashed line is the linear trend and the solid orange line from Locally Estimated Scatterplot Smoothing (LOESS). Z is the Mann–Kendall test statistic and S is the Sen’s slope.
Figure 10.
Regionally averaged anomaly series of (a) R10mm, (b) R20mm, (c) CWD, and (d) CDD during 1970–2017. The black dashed line is the linear trend and the solid orange line from Locally Estimated Scatterplot Smoothing (LOESS). Z is the Mann–Kendall test statistic and S is the Sen’s slope.
Figure 11.
Spatial distribution of change trends for (a) R10mm, (b) R20mm, (c) CWD, and (d) CDD during 1970–2017. Positive/negative trends are shown as up/down triangles. Triangle size is proportional to the magnitude of the trend. Trends significant at the 0.05 level are shown by a black box.
Figure 11.
Spatial distribution of change trends for (a) R10mm, (b) R20mm, (c) CWD, and (d) CDD during 1970–2017. Positive/negative trends are shown as up/down triangles. Triangle size is proportional to the magnitude of the trend. Trends significant at the 0.05 level are shown by a black box.
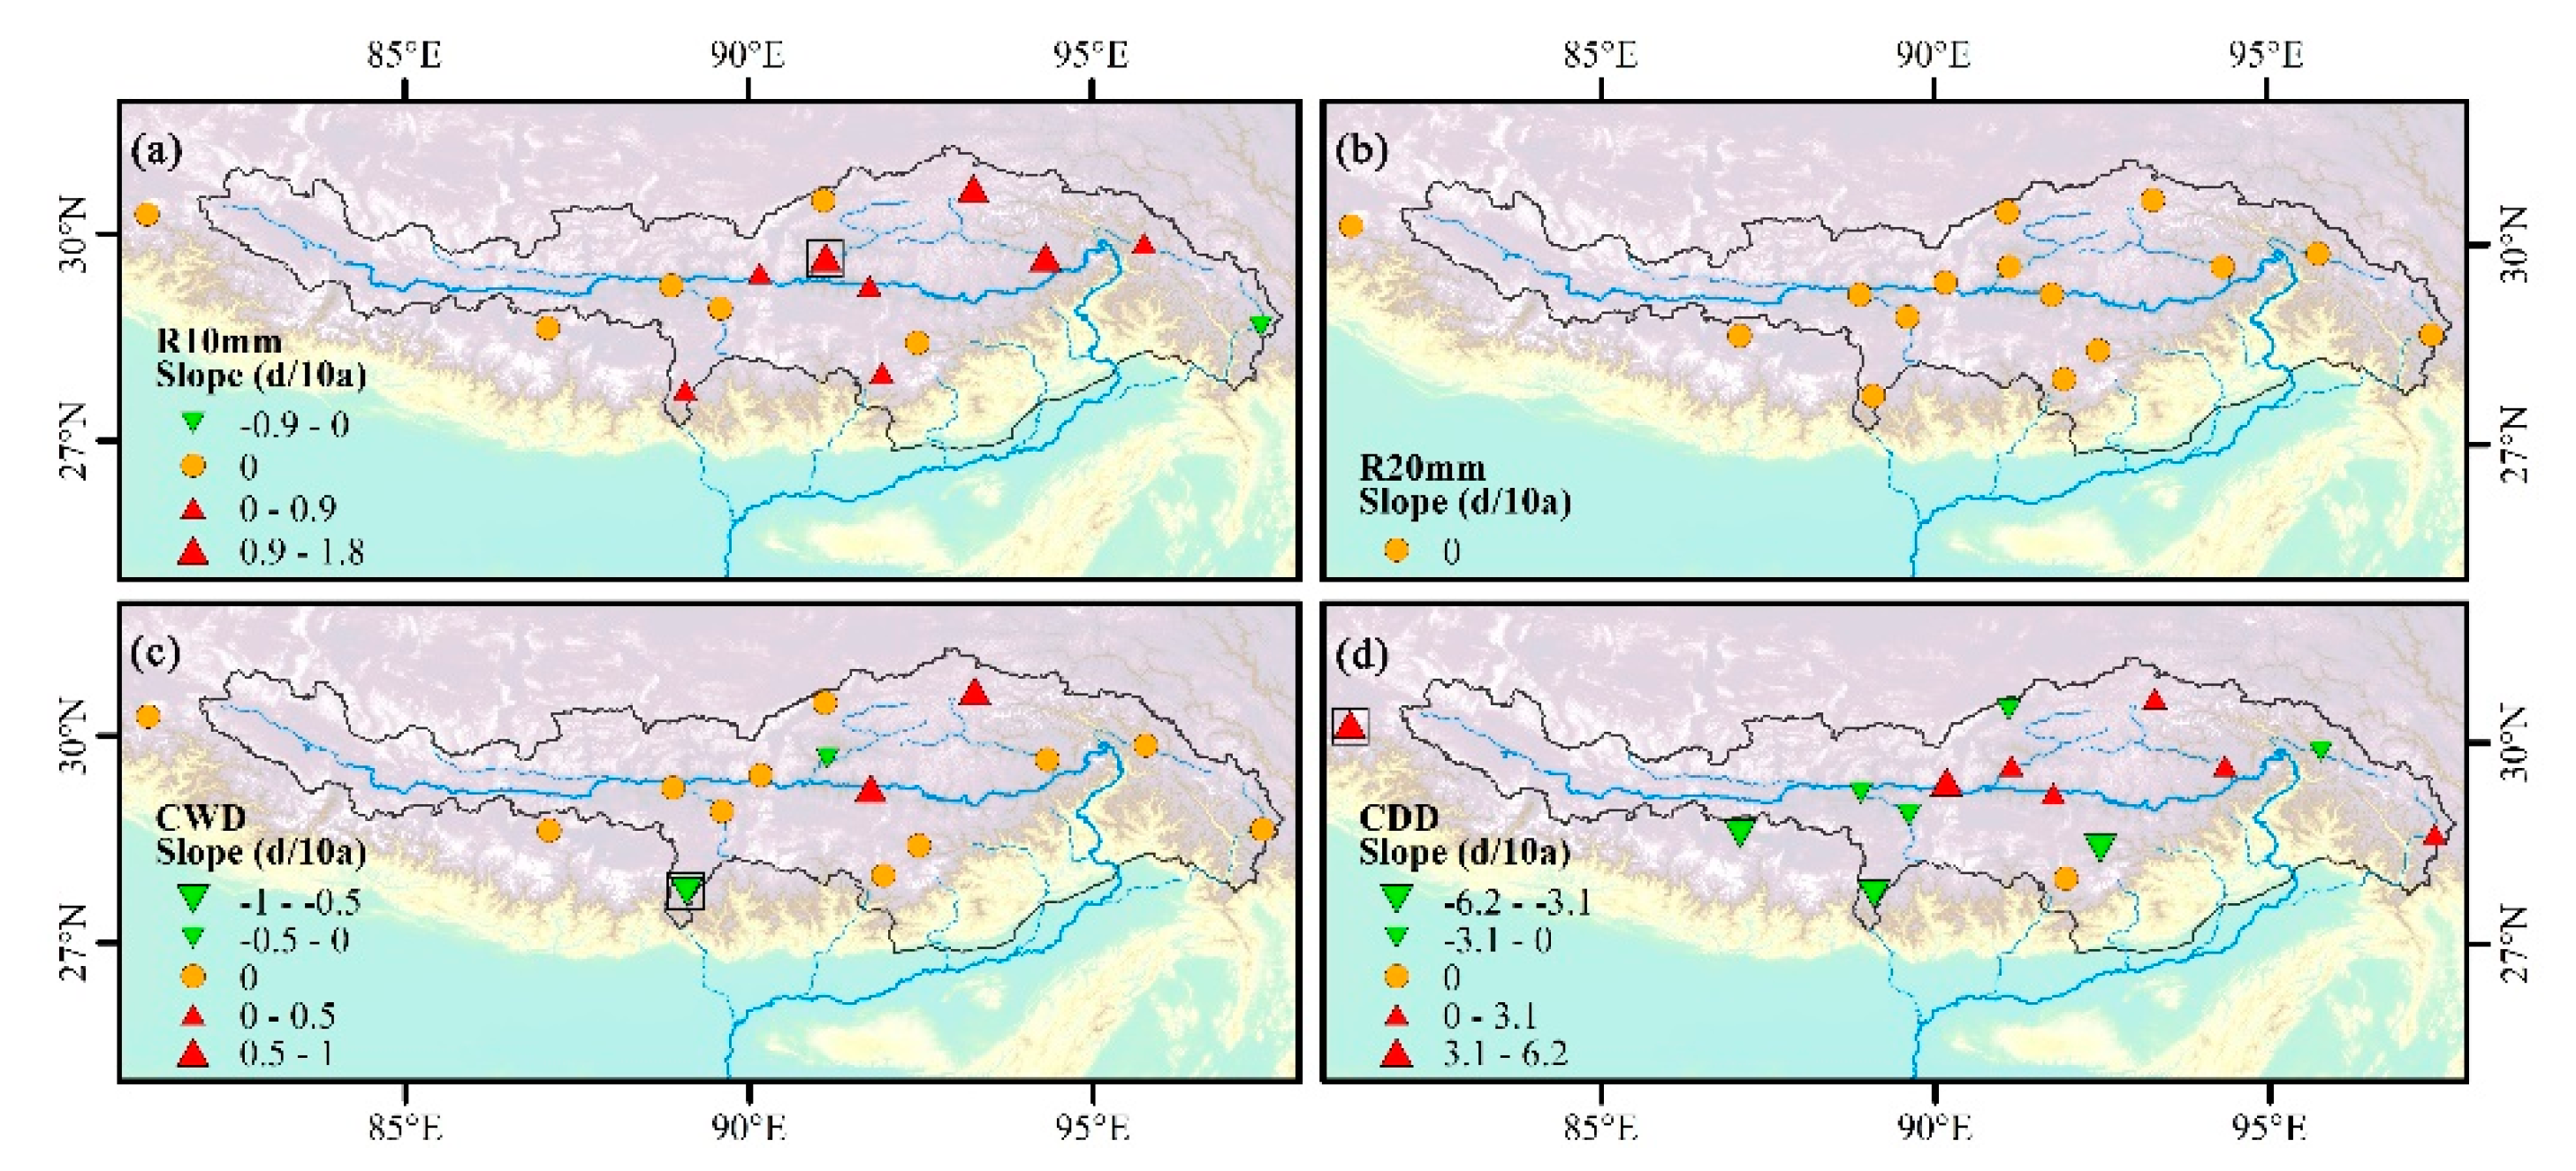
Figure 12.
(a) Ratio of very wet day precipitation (R95p) to total precipitation; (b) ratio of extremely wet day precipitation (R99p) to total precipitation. Green dashed line is the linear trend during 1970–1999, and the red dashed line is the linear trend during 2000–2017.
Figure 12.
(a) Ratio of very wet day precipitation (R95p) to total precipitation; (b) ratio of extremely wet day precipitation (R99p) to total precipitation. Green dashed line is the linear trend during 1970–1999, and the red dashed line is the linear trend during 2000–2017.
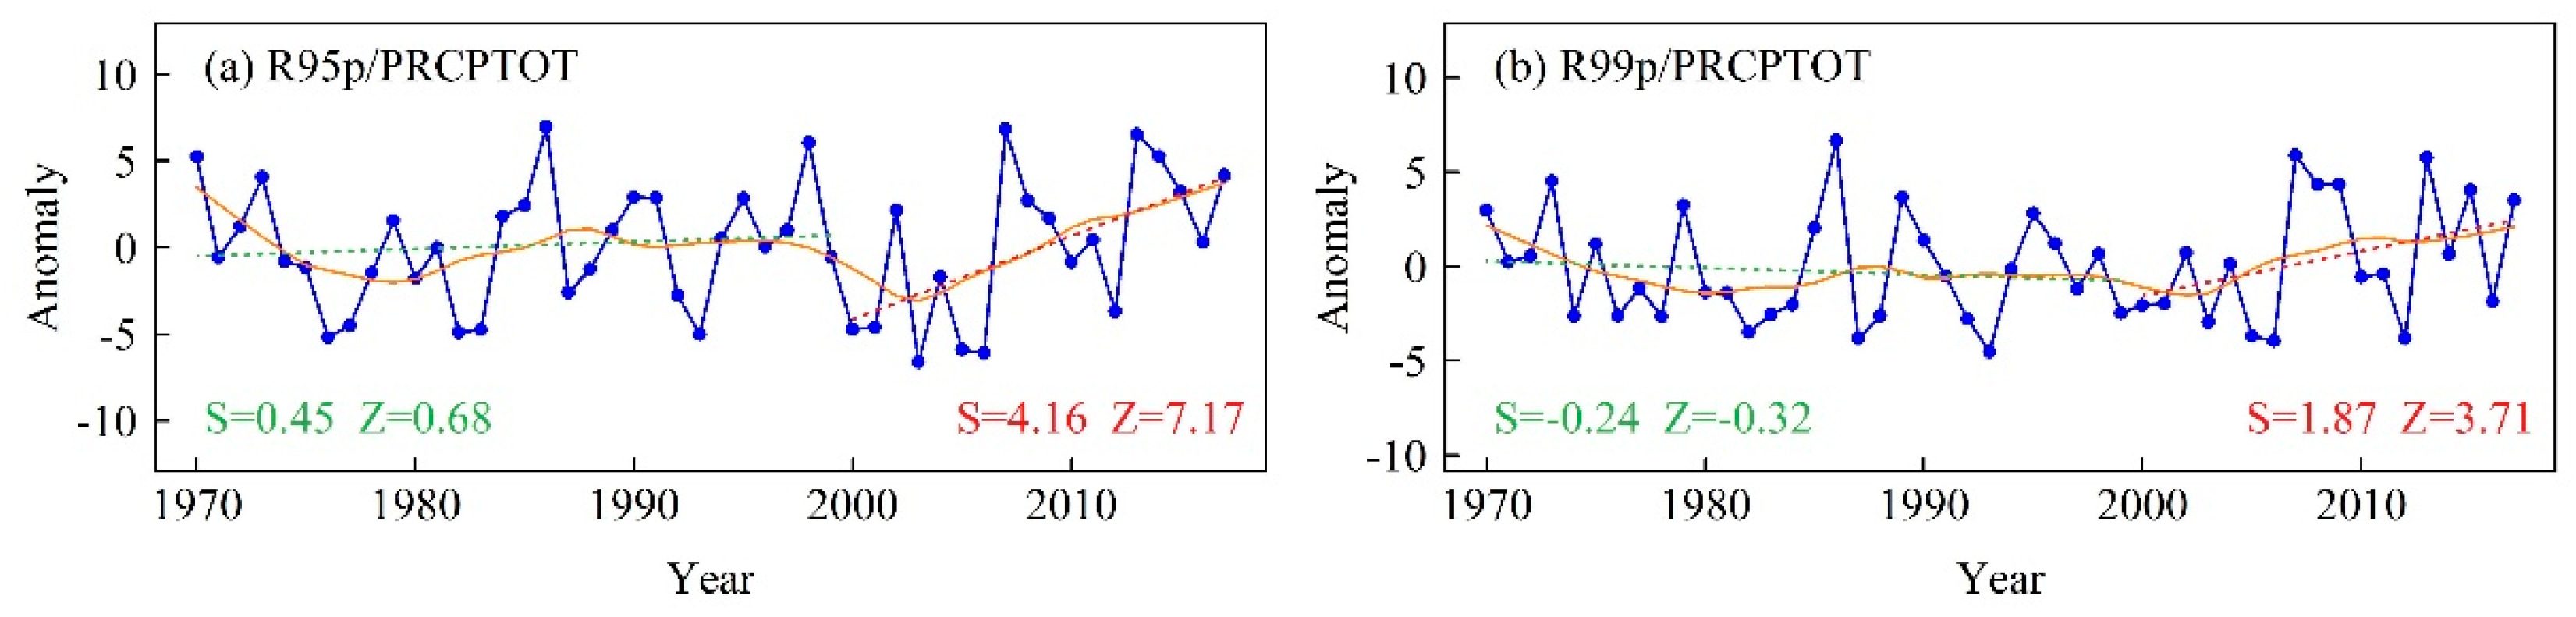
Figure 13.
Pearson correlation analysis of (a) temperature and (b) precipitation indices.

Table 1.
Meteorological stations used in this study.
| ID | Station | Lat (° N) | Lon (° E) | Elevation (m) | Study Periods |
|---|---|---|---|---|---|
| 55437 | Pulan | 30.28 | 81.25 | 4900 | 1973–2017 |
| 55493 | Dangxiong | 30.48 | 91.1 | 4200 | 1970–2017 |
| 55578 | Rikaze | 29.25 | 88.88 | 3836 | 1970–2017 |
| 55585 | Nimu | 29.43 | 90.16 | 3809 | 1973–2017 |
| 55591 | Lasa | 29.66 | 91.13 | 3648 | 1970–2017 |
| 55598 | Zedang | 29.25 | 91.76 | 3551 | 1970–2017 |
| 55664 | Dingri | 28.63 | 87.08 | 4300 | 1970–2017 |
| 55680 | Jiangzi | 28.91 | 89.6 | 4040 | 1970–2017 |
| 55690 | Cuona | 27.98 | 91.95 | 4280 | 1970–2017 |
| 55696 | Longzi | 28.41 | 92.46 | 3860 | 1970–2017 |
| 55773 | Pali | 27.73 | 89.08 | 4300 | 1970–2017 |
| 56202 | Jiali | 30.66 | 93.28 | 4488 | 1970–2017 |
| 56227 | Bomi | 29.86 | 95.76 | 2736 | 1970–2017 |
| 56312 | Linzhi | 29.66 | 94.33 | 2991 | 1970–2017 |
| 56434 | Chayu | 28.65 | 97.46 | 2327 | 1970–2017 |
Table 2.
Definition of the 15 temperature extreme indices used in this study.
| Classification | Abbreviation | Index | Definition | Units |
|---|---|---|---|---|
| Absolute indices and DTR | TNn | Minimum Tmin | Annual lowest TN | °C |
| TNx | Maximum Tmin | Annual highest TN | °C | |
| TXn | Minimum Tmax | Annual lowest TX | °C | |
| TXx | Maximum Tmax | Annual highest TX | °C | |
| DTR | Diurnal temperature range | Annual mean difference between TX and TN | °C | |
| Cooling indices | TN10p | Cold nights | Percentage of days when TN < 10th percentile of 1971–2000 | d |
| TX10p | Cold days | Percentage of days when TX < 10th percentile of 1971–2000 | d | |
| FD | Frost days | Annual count when TN < 0 °C | d | |
| ID | Ice days | Annual count when TX < 0 °C | d | |
| CSDI | Cold spell duration indicator | Annual count of days with at least 6 consecutive days when TN < 10th percentile | d | |
| Warming indices | TN90p | Warm nights | Percentage of days when TN > 90th percentile of 1971–2000 | d |
| TX90p | Warm days | Percentage of days when TX > 90th percentile of 1971–2000 | d | |
| GSL | Growing season length | Annual count between the first span of at least 6 days with daily mean temperature >5 °C after winter and the first span after summer of 6 days with a daily mean temperature < 5 °C | d | |
| SU25 | Summer days | Annual count when TX > 5 °C | d | |
| WSDI | Warm spell duration indicator | Annual count of days with at least 6 consecutive days when TX > 90th percentile | d |
Note: TN refers to daily minimum temperature; TX refers to daily maximum temperature.
Table 3.
Definition of the 10 precipitation extreme indices used in this study.
| Classification | Abbreviation | Index | Definition | Units |
|---|---|---|---|---|
| PRCPTOT and intensity indices | PRCPTOT | Wet day precipitation | Annual total precipitation in wet days | mm |
| SDII | Simple daily intensity index | Average precipitation on wet days | mm/d | |
| RX1d | Maximum 1-d precipitation amount | Annual maximum 1-day precipitation | mm | |
| RX5d | Maximum 5-d precipitation amount | Annual maximum consecutive 5-day precipitation | mm | |
| R95p | Very wet day precipitation | Annual total precipitation when RR >95th percentile of 1971–2000 daily precipitation | mm | |
| R99p | Extremely wet day precipitation | Annual total precipitation when RR > 99th percentile of 1971–2000 daily precipitation | mm | |
| Frequency indices | R10mm | Number of heavy precipitation days | Annual count of days when RR > 10 mm | d |
| R20mm | Number of very heavy precipitation days | Annual count of days when RR > 20 mm | d | |
| Duration indices | CWD | Consecutive wet days | Maximum number of consecutive days with RR > 1 mm | d |
| CDD | Consecutive dry days | Maximum number of consecutive days with RR < 1 mm | d |
Note: RR refers to the daily precipitation amount.
Table 4.
Trends per decade, change range, and percentage of stations with positive, negative, and no trend for regional indices of temperature extremes.
Table 4.
Trends per decade, change range, and percentage of stations with positive, negative, and no trend for regional indices of temperature extremes.
| Index | Regional Trends | Range | Positive Trend (Significant) | Negative Trend (Significant) | No Trend |
|---|---|---|---|---|---|
| TNn | 0.48 | −0.14 to 0.91 | 87% (60%) | 13% (0%) | 0% |
| TNx | 0.34 | 0.18 to 0.70 | 100% (93%) | 0% (0%) | 0% |
| TXn | 0.35 | 0.05 to 0.60 | 100% (87%) | 0% (0%) | 0% |
| TXx | 0.22 | 0.00 to 0.57 | 93% (47%) | 0% (0%) | 7% |
| DTR | −0.06 | −0.27 to 0.17 | 20% (7%) | 73% (33%) | 7% |
| TN10p | −1.94 | −3.64 to −0.03 | 0% (0%) | 100% (93%) | 0% |
| TX10p | −1.66 | −2.14 to −0.55 | 0% (0%) | 100% (93%) | 0% |
| FD | −4.39 | −9.64 to −0.83 | 0% (0%) | 100% (87%) | 0% |
| ID | −2.02 | −8.66 to 0.00 | 0% (0%) | 67% (27%) | 33% |
| CSDI | −0.27 | 0.00 | 0% (0%) | 0% (0%) | 100% |
| TN90p | 3.75 | 1.94 to 6.22 | 100% (100%) | 0% (0%) | 0% |
| TX90p | 2.10 | 0.25 to 3.41 | 100% (93%) | 0% (0%) | 0% |
| GSL | 4.33 | 0.04 to 12.34 | 100% (27%) | 0% (0%) | 0% |
| SU25 | 1.23 | 0.00 to 6.46 | 47% (47%) | 0% (0%) | 53% |
| WSDI | 2.80 | 0.00 to 5.00 | 80% (60%) | 0% (0%) | 20% |
Note: Trends marked in bold are statistically significant at the 0.05 level.
Table 5.
Trends per decade, change range, and percentage of stations with positive, negative, and no trend in regional precipitation extreme indices.
Table 5.
Trends per decade, change range, and percentage of stations with positive, negative, and no trend in regional precipitation extreme indices.
| Index | Regional Trends | Range | Positive Trend (Significant) | Negative Trend (Significant) | No Trend |
|---|---|---|---|---|---|
| PRCPTOT | 7.33 | −17.80 to 20.27 | 80% (0%) | 20% (0%) | 0% |
| SDII | 0.10 | −0.10 to 0.31 | 80% (13%) | 13% (0%) | 7% |
| RX1d | 0.21 | −2.06 to 1.80 | 53% (7%) | 47% (0%) | 0% |
| RX5d | 0.69 | −1.77 to 2.44 | 53% (7%) | 47% (0%) | 0% |
| R95p | 4.01 | −9.24 to 13.27 | 47% (7%) | 40% (0%) | 13% |
| R99p | 0.92 | −0.60 to 0.00 | 0% (0%) | 7% (0%) | 93% |
| R10mm | 0.37 | −0.85 to 1.26 | 53% (7%) | 7% (0%) | 40% |
| R20mm | 0.11 | 0.00 | 0% (0%) | 0% (0%) | 100% |
| CWD | −0.06 | −0.84 to 0.59 | 13% (0%) | 13% (7%) | 73% |
| CDD | 0.62 | −6.10 to 5.87 | 47% (7%) | 47% (0%) | 7% |
Note: Trends marked in bold are statistically significant at the 0.05 level.
Table 6.
Pettitt’s test results of the temperature and precipitation extreme indices.
| Index | Change Year | U * | p | Index | Change Year | U * | p |
|---|---|---|---|---|---|---|---|
| TNn | 1997 | 387 | <0.01 | SU25 | 2004 | 316 | 0.01 |
| TNx | 1995 | 459 | <0.01 | WSDI | 1997 | 438 | <0.01 |
| TXn | 1997 | 295 | 0.02 | PRCPTOT | 1987 | 154 | 0.57 |
| TXx | 1992 | 208 | 0.20 | SDII | 2006 | 206 | 0.21 |
| DTR | 1988 | 279 | 0.03 | RX1d | 2006 | 161 | 0.50 |
| TN10p | 1997 | 548 | <0.01 | RX5d | 2006 | 151 | 0.60 |
| TX10p | 1997 | 522 | <0.01 | R95p | 2006 | 143 | 0.67 |
| FD | 1997 | 503 | <0.01 | R99p | 2006 | 175 | 0.39 |
| ID | 1998 | 434 | <0.01 | R10mm | 1987 | 192 | 0.28 |
| CSDI | 1998 | 268 | 0.04 | R20mm | 1983 | 157 | 0.54 |
| TN90p | 1997 | 546 | <0.01 | CWD | 2004 | 207 | 0.21 |
| TX90p | 1997 | 466 | <0.01 | CDD | 1977 | 138 | 0.73 |
| GSL | 1997 | 407 | <0.01 |
Note: U* and p represent the maximum Pettitt’s statistics, and the significance level, respectively.
Table 7.
Trends of temperature and precipitation indices from this study and other sources.
| Indices | The YTRB | TP and Its Surroundings | Eastern and Central TP | Western TP | Three-River Headwaters | Southwestern China | China |
|---|---|---|---|---|---|---|---|
| TNn | 0.48 | 1.04 | - | 0.63 | 0.49 | 0.29 | 0.58 |
| TNx | 0.34 | 0.36 | - | 0.38 | 0.29 | 0.17 | 0.28 |
| TXn | 0.35 | 0.10 | - | 0.67 | 0.26 | 0.13 | 0.32 |
| TXx | 0.22 | 0.30 | - | 0.15 | 0.39 | 0.11 | 0.17 |
| DTR | −0.06 | - | −0.20 | −0.20 | −0.11 | −0.18 | - |
| TN10p | −1.94 | - | −2.38 | −4.92 | −4.63 | −0.37 | −2.00 |
| TX10p | −1.66 | - | −0.85 | −2.84 | −2.47 | −0.13 | −0.80 |
| FD | −4.39 | −4.06 | −4.32 | −5.69 | −4.28 | −0.29 | −3.90 |
| ID | −2.02 | −2.03 | −2.46 | −7.74 | −4.68 | −0.09 | −2.10 |
| CSDI | −0.27 | - | - | −2.55 | - | - | −0.80 |
| TN90p | 3.75 | - | 2.54 | 4.00 | 4.30 | 0.36 | 3.30 |
| TX90p | 2.10 | - | 1.26 | 3.43 | 3.05 | 0.22 | 1.70 |
| GSL | 4.33 | - | 4.25 | 4.35 | 3.94 | 0.12 | 3.40 |
| SU25 | 1.23 | 2.59 | - | 0.42 | 1.20 | - | 1.90 |
| WSDI | 2.80 | - | - | 3.31 | - | - | 3.00 |
| PRCPTOT | 7.33 | 6.98 | 6.66 | 0.47 | 8.33 | 0.03 | 0.30 |
| SDII | 0.10 | 0.08 | 0.03 | 0.01 | 0.02 | 0.03 | 0.70 |
| RX1d | 0.21 | 0.45 | 0.27 | 0.37 | −0.16 | 0.05 | - |
| RX5d | 0.69 | 0.50 | −0.08 | 1.25 | −0.44 | 0.03 | - |
| R95p | 4.01 | 3.24 | 1.28 | 0.48 | 3.83 | 0.04 | 2.10 |
| R99p | 0.92 | 1.96 | 1.09 | 0.41 | 1.90 | 0.05 | - |
| R10mm | 0.37 | 0.27 | 0.23 | 0.06 | 0.16 | 0.00 | - |
| R20mm | 0.11 | 0.07 | - | - | 0.04 | 0.00 | - |
| CWD | −0.06 | −0.02 | −0.07 | 0.17 | −0.16 | −0.08 | 0.20 |
| CDD | 0.62 | −0.87 | −4.64 | 0.52 | −2.06 | −0.05 | −3.50 |
Table 8.
Correlation coefficients between extreme precipitation indices and the East Asian summer monsoon index (EASMI) and South Asian summer monsoon index (SASMI).
Table 8.
Correlation coefficients between extreme precipitation indices and the East Asian summer monsoon index (EASMI) and South Asian summer monsoon index (SASMI).
| Indices | PRCPTOT | SDII | RX1d | RX5d | R95p | R99p | R10mm | R20mm | CWD | CDD |
|---|---|---|---|---|---|---|---|---|---|---|
| EASMI | −0.32 | −0.28 | −0.25 | −0.19 | −0.23 | −0.25 | −0.31 | −0.27 | −0.30 | 0.28 |
| SASMI | 0.21 | 0.11 | 0.01 | −0.04 | 0.09 | 0.07 | 0.24 | 0.09 | 0.08 | 0.14 |
Note: Trends marked in bold are statistically significant at the 0.05 level.
© 2019 by the authors. Licensee MDPI, Basel, Switzerland. This article is an open access article distributed under the terms and conditions of the Creative Commons Attribution (CC BY) license (http://creativecommons.org/licenses/by/4.0/).
Share and Cite
MDPI and ACS Style
Liu, C.; Li, Y.; Ji, X.; Luo, X.; Zhu, M. Observed Changes in Temperature and Precipitation Extremes Over the Yarlung Tsangpo River Basin during 1970–2017. Atmosphere 2019, 10, 815. https://doi.org/10.3390/atmos10120815
AMA Style
Liu C, Li Y, Ji X, Luo X, Zhu M. Observed Changes in Temperature and Precipitation Extremes Over the Yarlung Tsangpo River Basin during 1970–2017. Atmosphere. 2019; 10(12):815. https://doi.org/10.3390/atmos10120815
Chicago/Turabian StyleLiu, Chunyu, Yungang Li, Xuan Ji, Xian Luo, and Mengtao Zhu. 2019. "Observed Changes in Temperature and Precipitation Extremes Over the Yarlung Tsangpo River Basin during 1970–2017" Atmosphere 10, no. 12: 815. https://doi.org/10.3390/atmos10120815
Note that from the first issue of 2016, this journal uses article numbers instead of page numbers. See further details here.