Abstract
Urban air quality is continuing to deteriorate. If we want to do something about this problem, we need to know the cause of the pollution. The big problem, not only in Europe, is the high concentrations of particulate matter (PM) in the urban environment. The origin of these particles can be different, including combustion, transport, industry, natural resources, etc. Particulate matter includes a large amount of the finest PM fractions, which can remain in the air for a long time, easily enter respiratory tracks, and damage human health. Particulate matter is also produced by the abrasion of different parts of roads and vehicle fleets and from resuspension road dust, which concerns matter with larger aerodynamic diameters. For this reason, we carried out a series of measurements at various measuring stations in Žilina, Slovakia, during different measuring seasons. The main objective was to find out the diversity of particulate matter sources in Žilina. The search for the particulate matter origin was carried out by particulate matter measurements, determination of the particulate matter fraction concentrations (PM10, PM2.5, and PM1), an investigation on the effect of secondary factors on the particulate matter concentrations, chemical analyses, and multivariate statistical analyses. Varied behavior of the particulate matter with respect to the measurement station and the measurement season was found. Differences in the concentrations of investigated chemical elements contained in the PM were found. Significant changes in the concentrations of particulate matter are caused not only by primary sources (e.g., road traffic in the city of Žilina), but mainly by the negative events (combination of air pollution sources and meteorological conditions). Maximum concentrations of particulate matter PM10 were measured during the winter season at the measuring station on Komenského Street: PM10 126.2 µg/m3, PM2.5 97.7 µg/m3, and PM1 90.4 µg/m3 were obtained using the gravimetric method. The coarse fraction PM2.5-10 was mainly represented by the chemical elements Mg, Al, Si, Ca, Cr, Fe, and Ba, and the fine fraction PM2.5 was represented by the chemical elements K, S, Cd, Pb, Ni, and Zn. Road transport as a dominant source of PM10 was identified from all measurements in the city of Žilina by using the multivariate statistical methods of principal component analysis (PCA) and factor analysis (FA).
1. Introduction
Particulate matter (PM) air pollution is a persistent problem in an increasingly large area. In particular, cities are affected, where many sources contribute to this pollution. However, do we know which ones? In this study, we performed extensive measurements in Zilina city, Slovakia. They were focused on the sampling of three fractions of particulate matter (PM10, PM2.5, and PM1) [1] and the chemical analysis of PM to determine the presence of selected metals (Mg, Al, Si, K, Ca, S, Cr, Cu, Fe, Cd, Sb, Ba, Pb, Ni, and Zn). Measurements were realized at six different urban measuring stations during different measuring seasons.
Major sources of PM air pollution in urban areas include exhaust emissions, road dust resuspension (traffic related and pavement surface abrasions), and wood and coal household heating [2,3,4,5,6,7,8,9,10]. Road transport emissions directly affect pedestrians in urban areas, while particulate matter concentrations are often alarming and go beyond the limit on protection of human health [11,12].
The fine fraction of PM2.5 accounts for 40%–80% of the weight concentration of PM10 in ambient air in Europe [6,13]. In winter (low temperature), this percentage may be even higher [6,14]. While exhaust emissions from vehicles have declined due to vehicle technology advances, such as particulate filters, the non-exhaust emissions of particulate matter due to wear on brakes, tires, car parts, and road surfaces are increasing. Non-exhaust sources currently account for a large proportion of total particulate emissions from vehicles—about half of PM10 and one third of PM2.5 [9,15]. Resuspension of road dust plays a major role in the formation of particulate matter and also secondary aerosol formation, especially in winter [16].
Health risks of particulate matter are mainly predetermined by their chemical composition [17,18]. They may contain various harmful chemical elements, compounds, etc. [18,19,20]. These chemical elements can come from a variety of sources that occur in and around cities. Backward identification of particulate matter sources based on the knowledge of their chemical composition and the possible origin of individual chemical elements can be an effective tool in the process of eliminating air pollution in cities. For this process, multivariate statistical methods can be used, including principal component analysis (PCA) and factor analysis (FA) [21,22,23,24,25,26].
All activities performed (measurement of particulate matter concentrations, chemical analyses of particulate matter, monitoring of meteorological parameters, multivariate statistical analyses (PCA and FA), and analyses of particulate flow) led to the identification of PM10 sources.
2. Methodology of Particulate Matter Measurements and Evaluation
2.1. Study Area
A proposal for a network for air quality measurements was created in Žilina city, Slovakia. The layout of the measurement sites was chosen based on the idea of covering typical functional urban areas (city center, industry zone, traffic hubs, and living zone) (Figure 1). Measuring points are always a combination of several sources of air pollution.
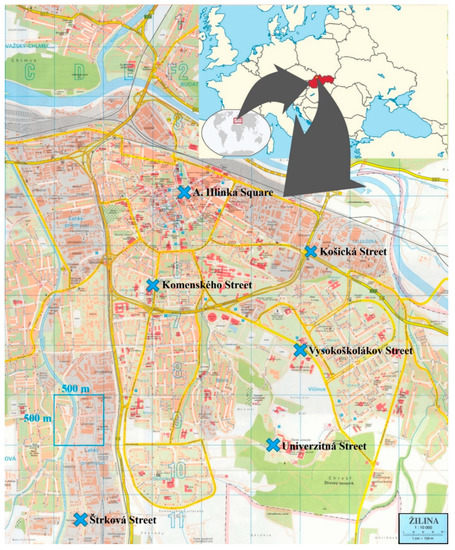
Figure 1.
Location of measurement stations in Žilina city, Slovakia.
Air quality measurements were conducted at each measurement station for 7 days at the following intervals:
- Univerzitná Street (uvp), (49°12’6.61” N, 18°45’14.24” E): 14th–20th November 2017. Measurement place was located in the vicinity of Univerzitná Street and Veľký Diel Street, which is where the Univerzity of Žilina (education) is located. The surroundings consist of forest and green places.
- A. Hlinka Square (hlin), (49°13’29.08” N, 18°44’31.10” E): 22th‒28th February 2018. Typical walking zone without road traffic. Here, there are only a few cars in the local companies.
- Komenského Street (zsk), (49°12’58.64” N, 18°44’15.63” E): 01th‒07th March 2018. Measurement place was near the city centre, in the vicinity of the following crossroad: Komenského Street, Suvorovova Street, and Juraja Fándlyho Street. The surroundings here consist of residential buildings, education buildings, and a building of public administration.
- Košická Street (tep), (49°13’8.30” N, 18°45’36.80” E): 19th–25th April 2018. Important city traffic hub, representing the biggest city crossroad. Here, the city heating plant and shopping centres near the crossroad are located.
- Štrková Street (strk), (49°11’35.27” N, 18°43’37.12” E): 9th–15th May 2018. This measurement place was located in the light industry zone. A measurement device was placed in the vicinity of the road. This road, Štrková Street, is very dirty and there is a high level of heavy road traffic (trucks).
- Vysokoškolákov Street (vys), (49°12’38.20” N, 18°45’29.15” E): 9th–15th April 2019. Here, habitation, some shops, and dormitories are located. The measuring station was located in the vicinity of the road, which is an access road to the biggest habitation Vlčince in the city of Žilina.
2.2. Sample Collection
To establish the amount of particulate matter present in the ambient air, a reference method (the gravimetric method) was applied, pursuant to the standards of STN EN 12341 (2016). The sampling was performed using low-volume flow samplers (LECKEL LVS3, Low-Volume Samplers, company Sven Leckel Ingenieurbüro GmbH). In total, three pieces were used. Three fractions of particulate matter were monitored concurrently, specifically PM10, PM2.5, and PM1. The particulate matter was sampled on the filters for 24 h (10 a.m.–10 a.m. the next day). Finally, using this method, we obtained seven 24-h concentrations for each PM fraction at each measurement station (in sum, 126 exposed filters). Particulate matter was collected on nitrocellulose filters with a diameter of 47 mm at a fixed airflow rate of 2.3 #Nm3/h (normal cubic meters per hour) under standard conditions of 101.325 kPa and 0 °C, and the mass of particulate matter collected on the filters was then determined. The coarse fraction PM2.5-10 was determined as the difference between fractions PM10 and PM2.5. All contamination filters (samples of particulate matter) were used for elemental chemical analysis.
An optical method for determining the hourly particulate matter concentration (PM10, PM2.5, and PM1) was also used. The Fidas® 200 fine dust aerosol spectrometer for simultaneous measurement from the company Palas® was used. The actual aerosol sensor is an optical aerosol spectrometer that determines the particle size using the Lorenz–Mie scattered light analysis of single particles. The single particles move through an optically differentiated measurement volume that is homogeneously illuminated with white light. Each particle generates a scattered light impulse that is detected at an angle of 85° to 95°. The particle number is measured based on the number of scattered light impulses. The level of the scattered light impulse is a measure of the particle size diameter. In total, 168 hourly concentrations were obtained for each fraction of particulate matter at each measurement station (3024 total concentrations).
Meteorological parameters (temperature (temp), wind speed (ws), and wind direction (wd)) were also recorded during monitoring. Hourly meteorological parameters were used for further analysis. The WindSonicTM ultrasonic anemometer from the company Gill Instruments Limited was used for wind speed and direction measurement. The WindSonic measures the times taken for an ultrasonic pulse of sound to travel from the north transducer to the south transducer and compares it with the time taken for a pulse to travel from the S to N transducer. Likewise, times are compared between the west and east and the E and W transducer. The WS300-UMB smart weather sensor from the company G. Lufft Mess- und Regeltechnik GmbH was used for temperature measurement. Using this instrument, temperature is measured by way of a highly accurate negative temperature coefficient (NTC) resistor.
2.3. Sample Chemical Analysis
The particulate matter contains various elements and compounds. In the next phase of the research, we concentrated on the measurement of the selected metals found in the fractions PM10, PM2.5, and PM1. We focused on monitoring 15 metals which we selected based on the assumption and probabilities of their originality (source) (Mg, Al, Si, K, Ca, S, Cr, Cu, Fe, Cd, Sb, Ba, Pb, Ni, and Zn). Each of these metals come from a specific source [2,4,5,6,7,8,9,10].
To identify and determine the amounts of chemical elements (metals) in the samples of particulate matter, spectroscopic methods were utilized (inductively coupled plasma mass spectrometry-ICP-MS). The analyses of the 126 filters (42 filters for each PM fraction) and the determination of metals present in the fractions PM10, PM2.5, and PM1 were performed pursuant to the standard STN EN 14902 (2006).
Particulate matter was captured on cellulose nitrate (CN) membrane filters for element determination. The filters were digested in Teflon vessels with nitric acid (HNO3) at a temperature of 230 °C using a high-temperature and high-pressure microwave digestion system SW-4 (Berghof, Germany). Samples were transferred and appropriately diluted before element determinations on a triple quadrupole ICPMS (Agilent 8800 Triple Quadrupole ICP-MS, Japan). The tests were carried out in the laboratory of the Transport Research Centre in Brno, Czech Republic.
2.4. Used Statistical Methods
The relationship between fine fraction PM2.5 and total fraction PM10 was evaluated using multilayer regression analysis (MRA), as well as the relationship between the course fraction PM2.5-10 and the total fraction PM10 using statistical software “R”.
MRA relates to a group of techniques serving the purpose of linear dependency analysis between the two or multiple variables. It specifies estimates of β parameters in a regressive model:
where xi,1, xi,2, …, xi,m are independent variables (PM10) and yi is to be viewed as a dependent variable (PM2.5 or PM2.5-10). The index of I defines the serial number of monitoring and β1, β2, …, βm are to be understood as regression parameters and b1, b2, …, bm their estimates. An absolute member of β0 is an intersection of regression hyperplane with the y axis. The estimates of b1, b2, …, bm are to be understood as the directions of the regression hyperplane from the direction of xj and are called partial regression parameters (eventually partial regression coefficients for the standardized variables).
Multivariate statistical analyses using PCA and FA were used for identification of particulate matter PM10 sources using statistical software “Statistica”.
The primary goal of PCA is the transformation of the original characters of xj, j = 1, ..., m, (metals) into a smaller number of latent variables yj. These latent variables possess more appropriate and comprehensive properties: their presence is less significant, they capture and represent almost the entire variability of the original characteristics and properties, and they are mutually uncorrelated.
For the first PC, the following relation prevails:
where xj former character, input variable, j = 1, ..., m; v1j coefficients of eigenvectors.
The basic principle of FA lies in the fact that each of the monitored values Xj (j = 1, …, p) (metals) may be expressed as a sum of a linear combination of a lesser amount m of non-observed (hypothetical) random values F1, ..., Fm—so called common factors—and the further source of variability Ej (j = 1, …, p) —so called specific (residual) elements. Let us suppose that the following model prevails:
where λjk factor loadings of the k common factor relevant to the j variable and of k; factor, k = 1,..., m, Fk the k-th common factor, Ej is a random deviation of the exact model, relevant to the k-th value, j = 1, ..., p.
The factor loadings associated with variables may be explained as the correlations between the factors and the variables. They represent the most important unit of information that the interpretation of the factors is based on.
The combination of these two methods achieves the minimum number of latent variables with a maximum original information data (PCA) and then uses the minimum number of latent variables (factors) for FA and puts into them the original characters (metals).
3. Results
3.1. Particulate Matter Concentration and Mass Distribution
Air pollution measurements in Žilina were focused on the measurement of particulate matter of various fractions: PM10, PM2.5, and PM1. Optical method measurement data were used for an evaluation of the particulate matter concentrations and mass distribution.
Values of temperature were plotted two times higher (temp*2) and values of wind speed were plotted 20 times higher (ws*20) (Figure 2). From the measured data, we can observe the negative influence of temperature (lower temperatures—higher concentrations of PM) and the positive influence of wind speed (higher wind speed—lower concentrations of PM) on the concentrations of particulate matter (Figure 2). A significant wind velocity was recorded at the monitoring station located at A. Hlinka Square (1.7 ± 0.5 m/s on average) and Košická Street (1.5 ± 1.1 m/s on average). Low air temperatures were recorded at A. Hlinka Square (−5.8 ± 3.8 °C on average) and Komenského Street (−2.3 ± 2.8 °C on average) during the measurements (Figure 2). During the measurements at Univerzitná Street, lower air temperatures were recorded (2.3 ± 2.6 °C on average). On the contrary, at Štrková Street (16.0 ± 4.5 °C on average) and Košická Street (16.3 ± 5.6 °C on average), the temperatures were higher. Measurements of particulate matter at Vysokoškolákov Street were accompanied by lower night temperatures and higher daily temperatures (8.3 ± 4.2 °C on average), which resulted in increased concentrations of PM2.5 fine particles (Figure 2).
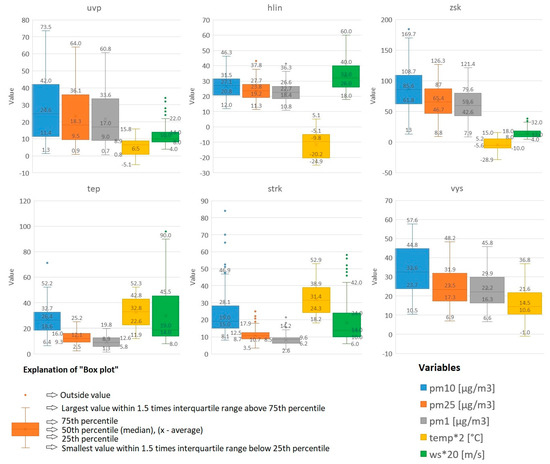
Figure 2.
“Box plot” showing the concentration of particulate matter and meteorological parameters during air quality measurements in Žilina city (temp—temperature, ws—wind speed).
The highest concentrations of PM were measured at the monitoring station on Komenského Street. The average PM10 concentration for the whole measurement period was 86.0 ± 122.0 μg/m3, PM2.5 was 66.9 ± 94.6 μg/m3, and PM1 was 62.2 ± 88.9 μg/m3. Higher concentrations of particulate matter were caused by the combination of such a significant source as road transport and low temperatures, while measurements were realized during the winter season (air pollution source—household heating). The average PM10 concentration at A. Hlinka Square was 26.6 ± 6.7 μg/m3, PM2.5 was 23.8 ± 6.0 μg/m3, and PM1 was 22.7 ± 5.8 μg/m3. During these measurements, a low air temperature was recorded, but a higher wind speed was noted. The average particulate matter concentration PM10 for the whole measurement at the monitoring station on Košická Street was 27.3 ± 11.4 μg/m3, PM2.5 was 12.9 ± 7.1 μg/m3, and PM1 was 9.6 ± 6.5 μg/m3 (Figure 2). During the measurements, a higher temperature and a higher wind speed were recorded. The average PM10 concentration at Univerzitná Street was 27.9 ± 19.2 μg/m3, PM2.5 was 23.3 ± 15.9 μg/m3, and PM1 was 21.7 ± 15.1 μg/m3. The average PM10 concentration at Štrková Street was 22.9 ± 12.0 μg/m3, PM2.5 was 11.0 ± 3.4 μg/m3, and PM1 was 8.1 ± 2.7 μg/m3. The average PM10 concentration at Vysokoškolákov Street was 34.2 ± 12.4 μg/m3, PM2.5 was 25.2 ± 10.8 μg/m3, and PM1 was 23.7 ± 10.3 μg/m3 (Figure 2).
The mass distribution of particulate matter also differed at the measuring stations. From the total measured fraction PM10, the course fraction PM2.5-10 concentration was calculated as the difference between the PM10 and PM2.5 concentration [1]. The course fraction PM2.5-10 was most represented at Košická Street and at Štrková Street, representing 54% and 52% of the total fraction of PM10, respectively. This is due to intense road traffic and a higher wind speed, where road dust resuspension occurs, especially through freight traffic. At Komenského Street, the course fraction PM2.5-10 was 23% of the total PM10 fraction, whilst it was only 12% at A. Hlinka Square and 16% at Univerzitná Street. The high proportion of the fine fraction of PM2.5 at these three monitoring stations is mainly due to the low temperature and low wind speed at Komenského Street and Univerzitná Street. Under these conditions, secondary particle formation can occur, particularly a fine fraction, where gaseous pollutants condense to aerosol [16].
The hourly data were measured using an optical method: the particulate matter concentrations, the wind speed, and the wind direction, were used to obtain the concentration rises by statistical software “R” and open-source tool “Openair” (Figure 3, Figure 4 and Figure 5). Pollution rose is a variant of wind rose, which is useful for considering pollutant concentrations by wind direction (hourly concentrations-counts) or, more specifically, the percentage of time the concentration is in a particular range.
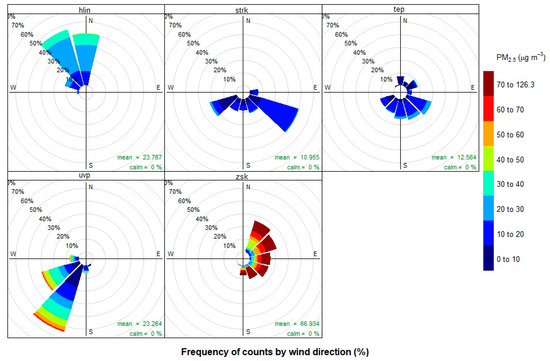
Figure 3.
Pollution rose for PM2.5 (fine fraction) during measurements in Zilina City at different measurement stations.
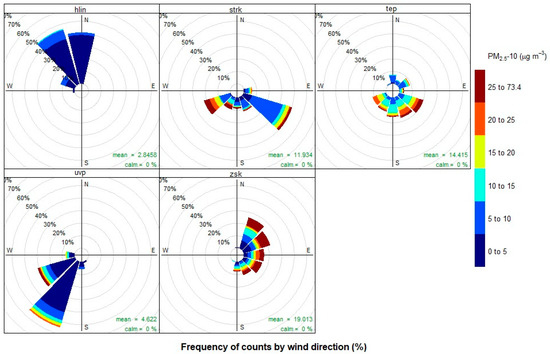
Figure 4.
Pollution rose for PM2.5-10 (course fraction) during measurements in Zilina City at different measurement stations.
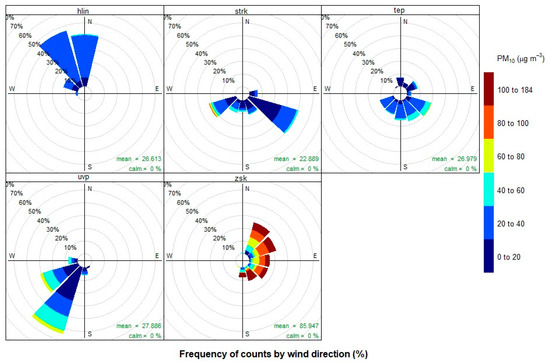
Figure 5.
Pollution rose for PM10 (total fraction) during measurements in Zilina City at different measurement stations.
We can observe the largest concentrations of fine PM2.5 fraction at the Komenského Street measuring station from the northeast, east, and southeast (Figure 3). Depending on the monitoring station location, these concentrations are from the road (street), which is located east in a south–north direction. Higher PM2.5 concentrations were most evident in connection with wind directions from the roadside in the case of the Komenského Street measuring station. The coarse PM2.5-10 fraction was most evident in connection with wind directions from the roadside at the measuring stations on Košická Street and Štrková Street (Figure 4). The total PM10 fraction is mainly influenced by its major fraction—PM2.5 or PM2.5-10 (Figure 5). The proportion of fine fraction PM2.5 is significantly lower at the measuring stations on Košická Street and Štrková Street.
The dominance of the coarse PM2.5-10 fraction in the total PM10 fraction was shown to be increasing. This can also be seen on polar graphs made for PM10, PM2.5, and PM2.5-10 fractions for two measurement stations. The measuring station on Košická Street exhibited measurements with higher temperatures and a higher proportion of course fraction PM2.5-10. The measuring station on Komenského Street displayed measurements with low temperatures and a higher proportion of fine fraction PM2.5. We can observe higher concentrations of PM10 and PM2.5-10 near the measuring station on Košická Street. The higher concentrations are related to a wind speed <4 m/s (from the road in direction W–E) and a wind speed >4 m/s (from the crossroad with the SW position). PM10 is primarily supported by the PM2.5-10 coarse fraction at this measuring station (Figure 6). There are high concentrations of PM10 and PM2.5 from the area of the road (direction N–S) and crossroad (position NE) at the measuring station on Komenského Street. However, they are highly supported by the fine fraction PM2.5 and are associated with a low wind speed <2 m/s (Figure 7).
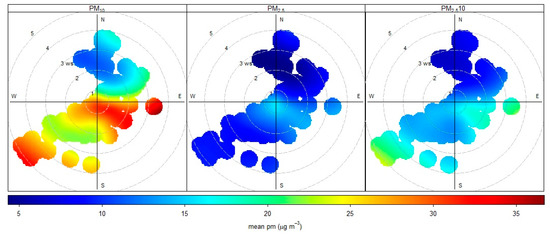
Figure 6.
Polar plot for particulate matter (PM) at the measuring station on Košická Street from 19th to 25th April 2018 (ws—wind speed).
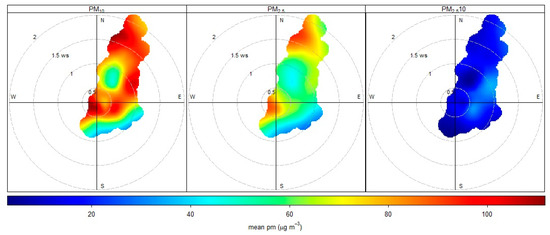
Figure 7.
Polar plot for particulate matter (PM) at the measuring station on Komenského Street from 1st to 7th March 2018 (ws—wind speed).
The relationship between fine fraction PM2.5 and total fraction PM10 was evaluated from all measured data (all measurement stations), as well as the relationship between the course fraction PM2.5-10 and the total fraction PM10. Using scatter plots and regression analysis (MRA), we can observe a very significant relationship between PM2.5 and PM10, especially at low temperatures (Figure 8). The fine fraction PM2.5 is dominant at low temperatures (from −14.5 to −2.43 °C), and we can describe up to 95% of the original data using the model.
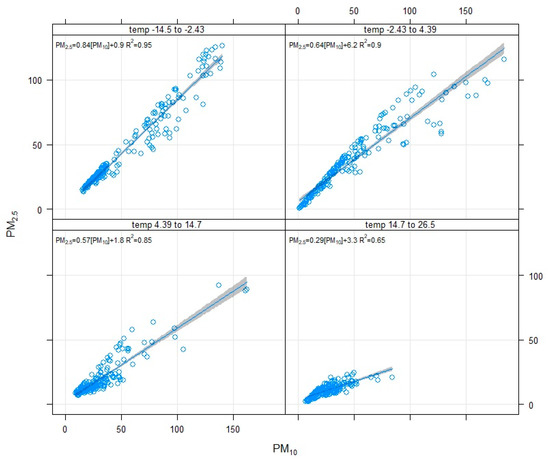
Figure 8.
Scatter plot and MRA for PM2.5 and PM10 variables related to air temperature from all measurements in Zilina City (temp—temperature).
The relationship between the coarse PM2.5-10 fraction and the total PM10 fraction is most significant at higher temperatures (Figure 9). The PM2.5-10 coarse fraction plays a larger role during higher temperature periods. The model can describe up to 92% of the original data variance, which corresponds to the temperature range from 14.7 to 26.5 °C.
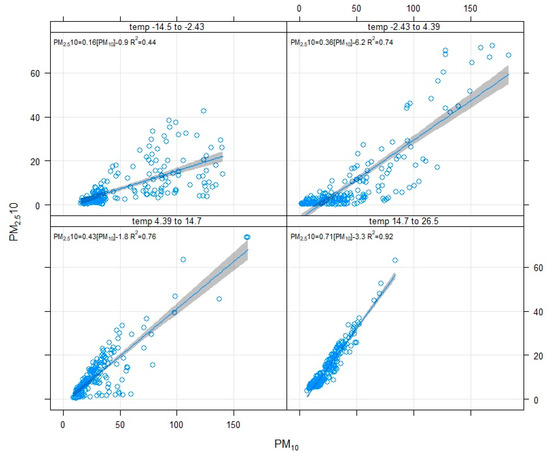
Figure 9.
Scatter plot and MRA for PM2.5-10 and PM10 variables related to air temperature from all measurements in Zilina City (temp—temperature).
3.2. Metal Concentrations in Particulate Matter
Concentrations of chemical elements (metals) in PM fractions (PM10, PM2.5, and PM1) were determined by ICP-MS. A number of metals are well-represented in the coarse fraction PM2.5-10 (>60%), namely Mg, Al, Si, Ca, Cr, Cu, Fe, and Ba (Table 1). Metals well represented in the fine fraction PM2.5 (>60%) include K, S, Cd, Pb, Ni, and Zn (Table 2).

Table 1.
Average concentration of elements in the particulate matter (PM) fraction (PM2.5 and PM2.5-10) at different measuring stations, with more than 60% in the PM2.5-10.
Table 2.
Average concentration of elements in the particulate matter (PM) fraction (PM2.5 and PM2.5-10) at different measuring stations, with more than 60% in the PM2.5.
Elements with a higher proportion in the PM2.5-10 fraction may come mainly from mechanical abrasion and resuspension. Elements with a higher proportion in the PM2.5 fraction may originate more from combustion processes or abrasion in the presence of high temperatures [7].
3.3. Identification of Particulate Matter PM10 Sources
Multivariate statistical analyses using PCA and FA were used for statistical assessment [21,22,23,24,25,26]. The input data for the purposes of the identification of possible PM10 sources consisted of the concentrations of particular chemical elements, specifically metals (ng/m3). The data matrix consisted of 16 variables (metals) and seven objects (measurements) for each measuring station, and 16 variables and 42 objects for all measuring stations (Žilina city). Multivariate statistical analyses and source identification were processed for the PM10.
Each factor consists of several elements (characters). As the most decisive factor loads, the values close to or greater than 0.7 were selected (red values) (Table 3). Based on the representation of elements in particular factors (significant factor loads represented by red values), the following factors may be named, as designated in Table 4.
Table 3.
Factor analysis results for all measuring stations and all measuring stations together, including the number of factors and chemical element factor loads.
Table 4.
Character of significant particulate matter sources at different measuring stations [2,4,5,6,7,9,10].
The process of interpretation (named) of each factor is very difficult. This is mainly because different sources of PM are mixed in the atmosphere and chemical elements can come from various sources. Interpretations of factors as sources of PM10 are therefore mainly based on the assessment area and the potential of some sources in this area. The name of each factor was also confronted with the possibility of the contribution of sources during the year. It also took into account the variability of concentrations of chemical elements in different fractions of PM.
The first factor is the most important and most closely reflects the origin of the particulate matter PM10 at a given monitoring station. The factor with the greatest influence on the particle concentration is listed in the following table (Table 4).
The genesis of particulate matter PM10 from identified sources in the city of Žilina is shown in the following figure (Figure 10). In the summer season, road traffic is the dominant source of particulate matter air pollution. In the winter, combustion is added to the road traffic source, which significantly contributes to deteriorating urban living conditions.
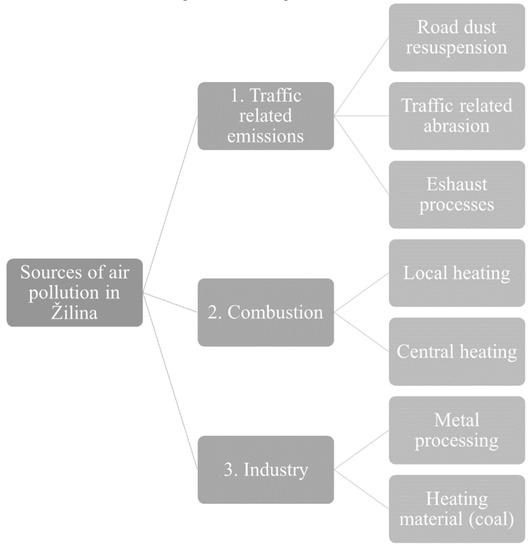
Figure 10.
Assessment of potential sources of air pollution in the city of Žilina.
4. Conclusions
The air quality measurements in Žilina City were realized at six measuring stations, including those located at Univerzitná Street, A. Hlinka Square, Komenského Street, Košická Street, Štrková Street, and Vysokoškolákov Street, which helped us to understand the behavior of the urban aerosol. Some measurements and measuring stations have a similar character, from the point of view of a dominant source of pollution, measured concentrations of particulate matter, or meteorological parameters. In the first group, we can include the monitoring stations at Univerzitná Street, A. Hlinka Square, and Komenského Street. During the measurement at these measuring stations, the following was observed: a low air temperature (Komenského Street and A. Hlinka Square) and a low wind speed (Univerzitná Street and Komenského Street). We observed a higher PM2.5 (fine fraction) proportion in the total measured PM10 fraction at these measuring stations. The second group consists of measurements at measuring stations located at Košická Street and Štrková Street. During measurements at these measuring stations, the following was observed: a higher air temperature and a higher wind speed. The proportion of PM2.5-10 (course fraction) in the total PM10 fraction was higher at these measurement stations. The concentrations of PM2.5 were higher during the measurements with lower air temperatures, and the concentrations of PM2.5-10 were higher during the measurements with higher air temperatures. Higher concentrations of particulate matter flowed mostly from the roadside. The representation of individual investigated chemical elements in particulate matter is different. One group of chemical elements binds to the fine fraction PM2.5 (K, S, Cd, Pb, Ni, and Zn) and the other to the coarse fraction PM2.5-10 (Mg, Al, Si, Ca, Cr, Cu, Fe, and Ba). Using factor analysis, the element concentration data in the total PM10 fraction were evaluated and a model of sources for individual measuring stations was created. The sources have been named by combining all analyses (particulate matter mass distribution, behavior, and their chemical composition). The result is a picture of the diversity of particulate matter sources in the city of Žilina, but above all, knowledge of the dominant source of particulate matter—road transport. As an important marker of road transport, the chemical element barium (Ba) was reflected. Additionally, sulfur (S) was identified as a marker of local (central) heating. Road dust resuspension contributes to significantly increased PM10 concentrations in Žilina city, Slovakia. In future work, we would like to pay attention to the road dust. We want to focus on chemical analyses of road dust and its interconnection with particulate matter in the air.
Author Contributions
Conceptualization, D.J.; Data curation, D.J.; Formal analysis, D.D.; Investigation, D.J. and D.D.; Methodology, D.J. and D.D.; Software, D.J.; Visualization, D.J.; Writing—original draft, D.J.; Writing—review & editing, D.J. and D.D.
Funding
This research was funded by “Vedecká Grantová Agentúra MŠVVaŠ SR a SAV” grant number VEGA 1/0537/17.
Acknowledgments
The paper was supported by means of a VEGA 1/0537/17 grant entitled “The influence of pavement surface morphology on pavement serviceability and emissions production”.
Conflicts of Interest
The authors declare no conflict of interest. The funders had no role in the design of the study; in the collection, analyses, or interpretation of data; in the writing of the manuscript, and in the decision to publish the results.
References
- Whitey, K.T. The physical characteristics of sulfur aerosols. Atmos. Environ. 2007, 41, 25–49. [Google Scholar] [CrossRef]
- Almeida, S.M.; Pio, C.A.; Freitas, M.C.; Reis, M.A.; Trancoso, M.A. Source apportionment of atmospheric urban aerosol based on weekdays/weekend variability: Evaluation of road re-Suspended dust contribution. Atmos. Environ. 2006, 40, 2058–2067. [Google Scholar] [CrossRef]
- Celko, J.; Kovac, M.; Decky, M. Analysis of selected pavement serviceability parameters, Communications. Sci. Lett. Univ. Žilina 2011, 13, 56–62. [Google Scholar]
- Fullova, D.; Durcanska, D.; Hegrova, J.; Fullova, D.; Durcanska, D.; Hegrova, J. Particulate matter mass concentrations produced from pavement surface abrasion. In Proceedings of the MATEC Web of Conferences at the 26th R-S-P Seminar 2017 Theoretical Foundation of Civil Engineering, RSP 2017, Warsaw, Poland, 19–21 August 2017; Volume 117. [Google Scholar]
- Ho, K.F.; Lee, S.C.; Chow, J.C.; Watson, J.G. Characterization of PM10 and PM2.5 source profiles for fugitive dust in Hong Kong. Atmos. Environ. 2003, 37, 1023–1032. [Google Scholar] [CrossRef]
- Jandacka, D.; Durcanska, D.; Bujdos, M. The contribution of road traffic to particulate matter and metals in air pollution in the vicinity of an urban road. Transp. Res. Part D 2017, 50, 397–408. [Google Scholar] [CrossRef]
- Pant, P.; Harrison, R.M. Estimation of the Contribution of Road Traffic Emissions to Particulate Matter Concentrations from Field Measurements: A Review. Atmos. Environ. 2013, 77, 78–97. [Google Scholar] [CrossRef]
- Remisova, E.; Decky, M.; Kovac, M. The influence of the asphalt mixture composition on the pavement surface texture and noise emissions production. In Proceedings of the Paper presented at the International Multidisciplinary Scientific GeoConference Surveying Geology and Mining Ecology Management, Albena, Bulgaria, 17–26 June 2014; Volume 2, pp. 583–590. [Google Scholar]
- Thorpe, A.; Harrison, R.M. Sources and Properties of Non-Exhaust Particulate Matter from Road Traffic: A Review. Sci. Total Environ. 2008, 400, 270–282. [Google Scholar] [CrossRef] [PubMed]
- Zhang, X.Y.; Cao, J.J.; Li, L.M.; Arimoto, R.; Cheng, Y.; Huebert, B.; Wang, D. Characterization of atmospheric aerosol over Xian in the south margin of the Loess Plateau, China. Atmos. Environ. 2002, 36, 4189–4199. [Google Scholar] [CrossRef]
- Sharma, R.; Balasubramanian, R. Assessment and mitigation of indoor human exposure to fine particulate matter (PM2.5) of outdoor origin in naturally ventilated residential apartments: A case study. Atmos. Environ. 2019, 212, 163–171. [Google Scholar] [CrossRef]
- WHO. Air Quality Guidelines for Particulate Matter, Ozone, Nitrogen Dioxide and Sulfur Dioxide—Global Update 2005; World Health Organization: Geneva, Switzerland, 2006; p. 20. [Google Scholar]
- European Environment Agency. Air Quality in Europe—2013 Report; European Environment Agency: Copenhagen, Denmark, 2013; p. 107. [Google Scholar]
- Jandacka, D.; Durcanska, D. Chemical Composition of PM10, PM2.5, PM1 and Influence of Meteorological Conditions on them in Zilina Selfgoverning Region, Slovakia. Solid State Phenom. 2016, 244, 171–181. [Google Scholar]
- European Environment Agency. EEA Signals 2016: Towards Clean and Smart Mobility. Transport and environment in Europe; European Environment Agency: Copenhagen, Denmark, 2016; p. 64. [Google Scholar]
- Choi, J.K.; Heo, J.B.; Ban, S.J.; Yi, S.M.; Zoh, K.D. Chemical characteristics of PM2.5 aerosol in Incheon, Korea. Atmos. Environ. 2012, 60, 583–592. [Google Scholar] [CrossRef]
- Davidson, C.I.; Robert, F.; Phalen, R.F.; Solomon, P.A. Airborne Particulate Matter and Human Health: A Review. Aerosol Sci. Technol. 2005, 39, 737–749. [Google Scholar] [CrossRef]
- Wu, L.; Luo, X.S.; Li, H.; Cang, L.; Yang, J.; Yang, J.; Zhao, Z.; Tang, M. Seasonal Levels, Sources, and Health Risks of Heavy Metals in Atmospheric PM2.5 from Four Functional Areas of Nanjing City, Eastern China. Atmosphere 2019, 10, 419. [Google Scholar] [CrossRef]
- Kukutschova, J.; Moravec, P.; Tomasek, V.; Matejka, V.; Smolík, J.; Schwarz, J.; Seidlerova, J.; Safarova, K.; Filip, P. On airborne nano/micro-Sized wear particles released from low-Metallic automotive brakes. Environ. Pollut. 2011, 159, 998–1006. [Google Scholar] [CrossRef]
- Mikuska, P.; Krumal, K.; Vecera, Z. Characterization of organic compounds in the PM2.5 aerosols in winter in an industrial urban area. Atmos. Environ. 2015, 105, 97–108. [Google Scholar] [CrossRef]
- Guo, H.; Wang, T.; Louie, P.K.K. Source apportionment of ambient non-Methane hydrocarbons in Hong Kong: Application of a principal component analysis/absolute principal component scores (PCA/APCS) receptor model. Environ. Pollut. 2004, 129, 489–498. [Google Scholar] [CrossRef]
- Jain, S.; Sharma, S.K.; Mandal, T.K.; Saxena, M. Source apportionment of PM10 in Delhi, India using PCA/APCS, UNMIX and PMF. Particuology 2018, 37, 107–118. [Google Scholar] [CrossRef]
- Lu, X.; Wang, L.; Li, L.Y.; Lei, K.; Huang, L.; Kang, D. Multivariate statistical analysis of heavy metals in street dust of Baoji, NW China. J. Hazard. Mater. 2010, 173, 744–749. [Google Scholar] [CrossRef]
- Manta, D.S.; Angelone, M.; Bellanca, A.; Neri, R.; Sprovieri, M. Heavy metals in urban soils: A case study from the city of Palermo (Sicily), Italy. Sci. Total Environ. 2002, 300, 229–243. [Google Scholar] [CrossRef]
- Song, Y.; Xie, S.; Zhang, Y.; Zeng, L.; Salmon, L.G.; Zheng, M. Source apportionment of PM2.5 in Beijing using principal component analysis/absolute principal component scores and UNMIX. Sci. Total Environ. 2006, 372, 278–286. [Google Scholar] [CrossRef]
- Yang, Z.; Lu, W.; Long, Y.; Bao, X.; Yang, Q. Assessment of heavy metals contamination in urban topsoil from Changchun City, China. J. Geochem. Explor. 2011, 108, 27–38. [Google Scholar] [CrossRef]
© 2019 by the authors. Licensee MDPI, Basel, Switzerland. This article is an open access article distributed under the terms and conditions of the Creative Commons Attribution (CC BY) license (http://creativecommons.org/licenses/by/4.0/).