Epigenetic Variation in Monozygotic Twins: A Genome-Wide Analysis of DNA Methylation in Buccal Cells


Abstract
:
1. Introduction
2. Experimental
2.1. Subjects
2.2. Buccal DNA Collection
2.3. Infinium HumanMethylation450 BeadChip Data Generation
2.4. Quality Control, Normalization and Data Processing
2.5. Genomic Annotations

2.6. Statistical Analysis of Twin Data
3. Results and Discussion
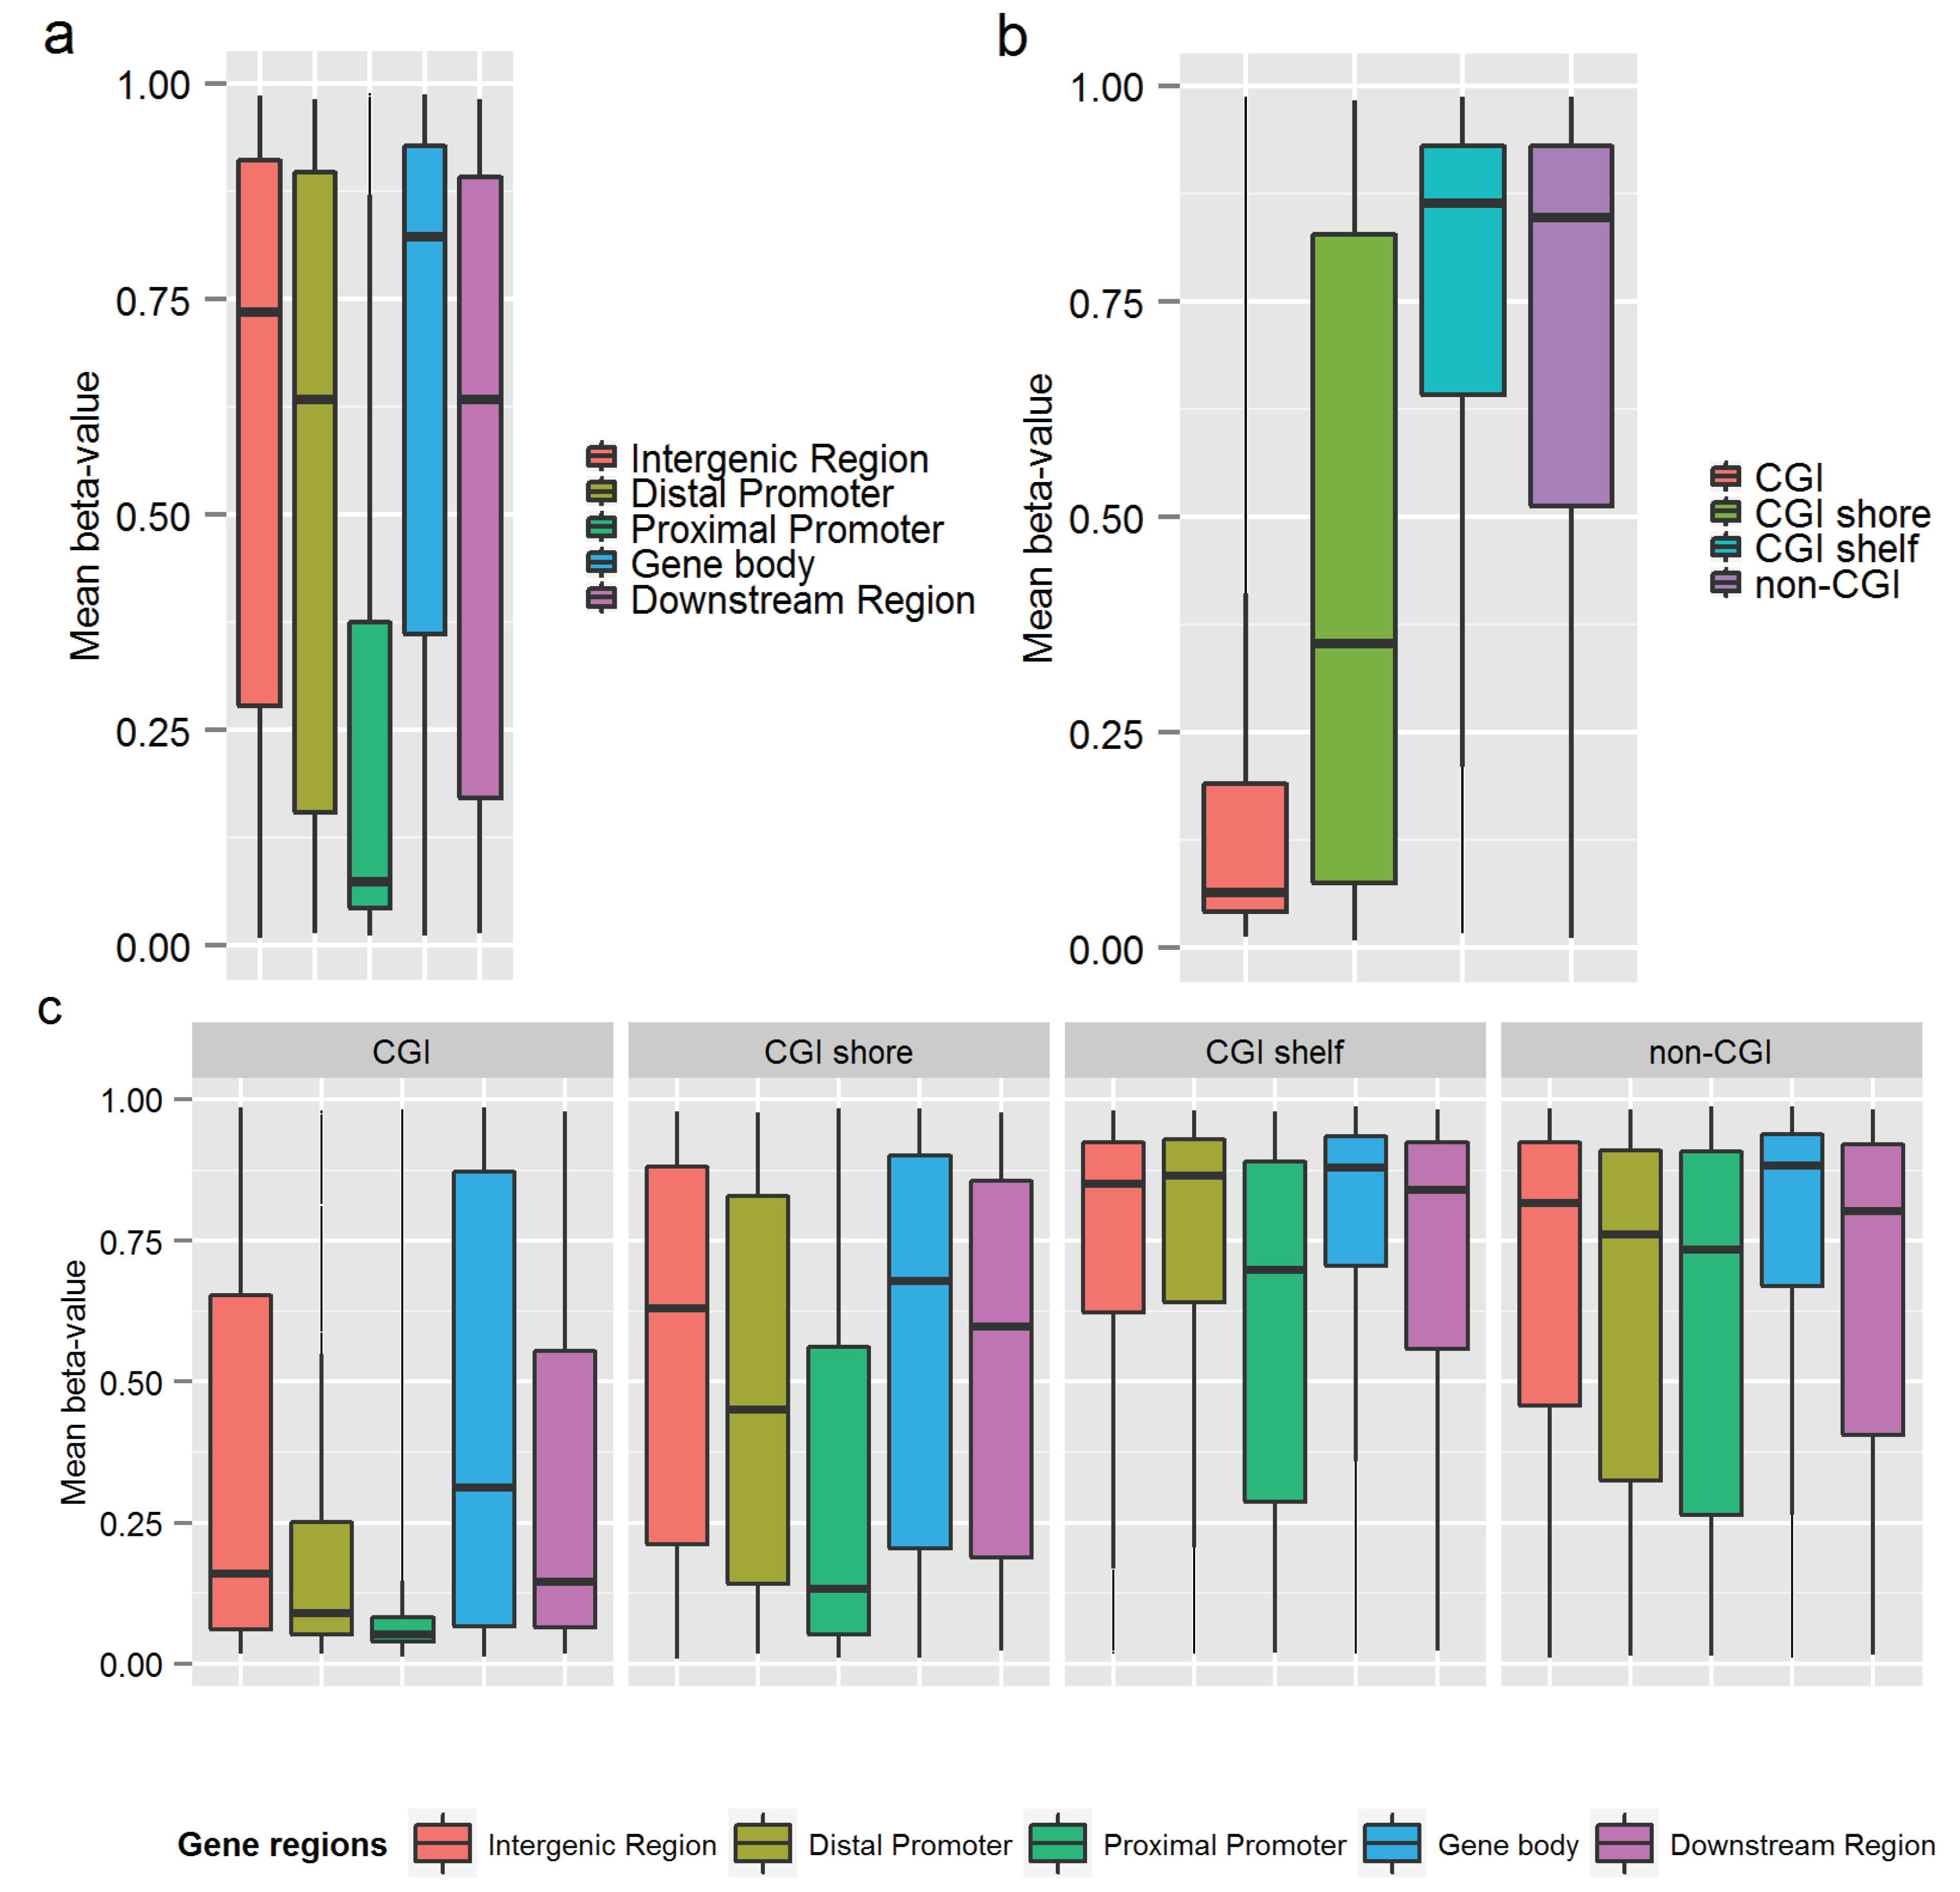
3.1. DNA Methylation Level across the Genome
3.2. Similarity of Genome-Wide Methylation Profiles of MZ Twins


3.3. Similarity of the Methylation Level at Individual CpGs in MZ Twins

| Category | N CpGs | Mean rho | Median rho | Min rho | Max rho |
|---|---|---|---|---|---|
| All CpGs | 59,041 | 0.54 | 0.54 | −0.661 | 1 |
| Gene-centric annotations | N CpGs (%) | Mean rho | Median rho | Min rho | Max rho |
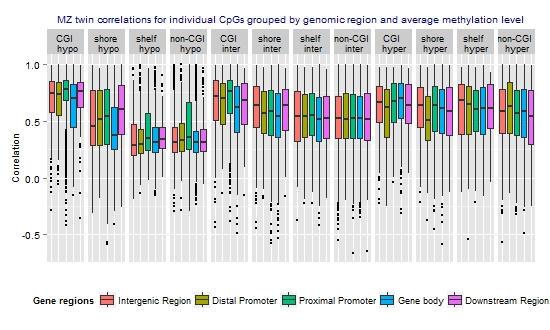
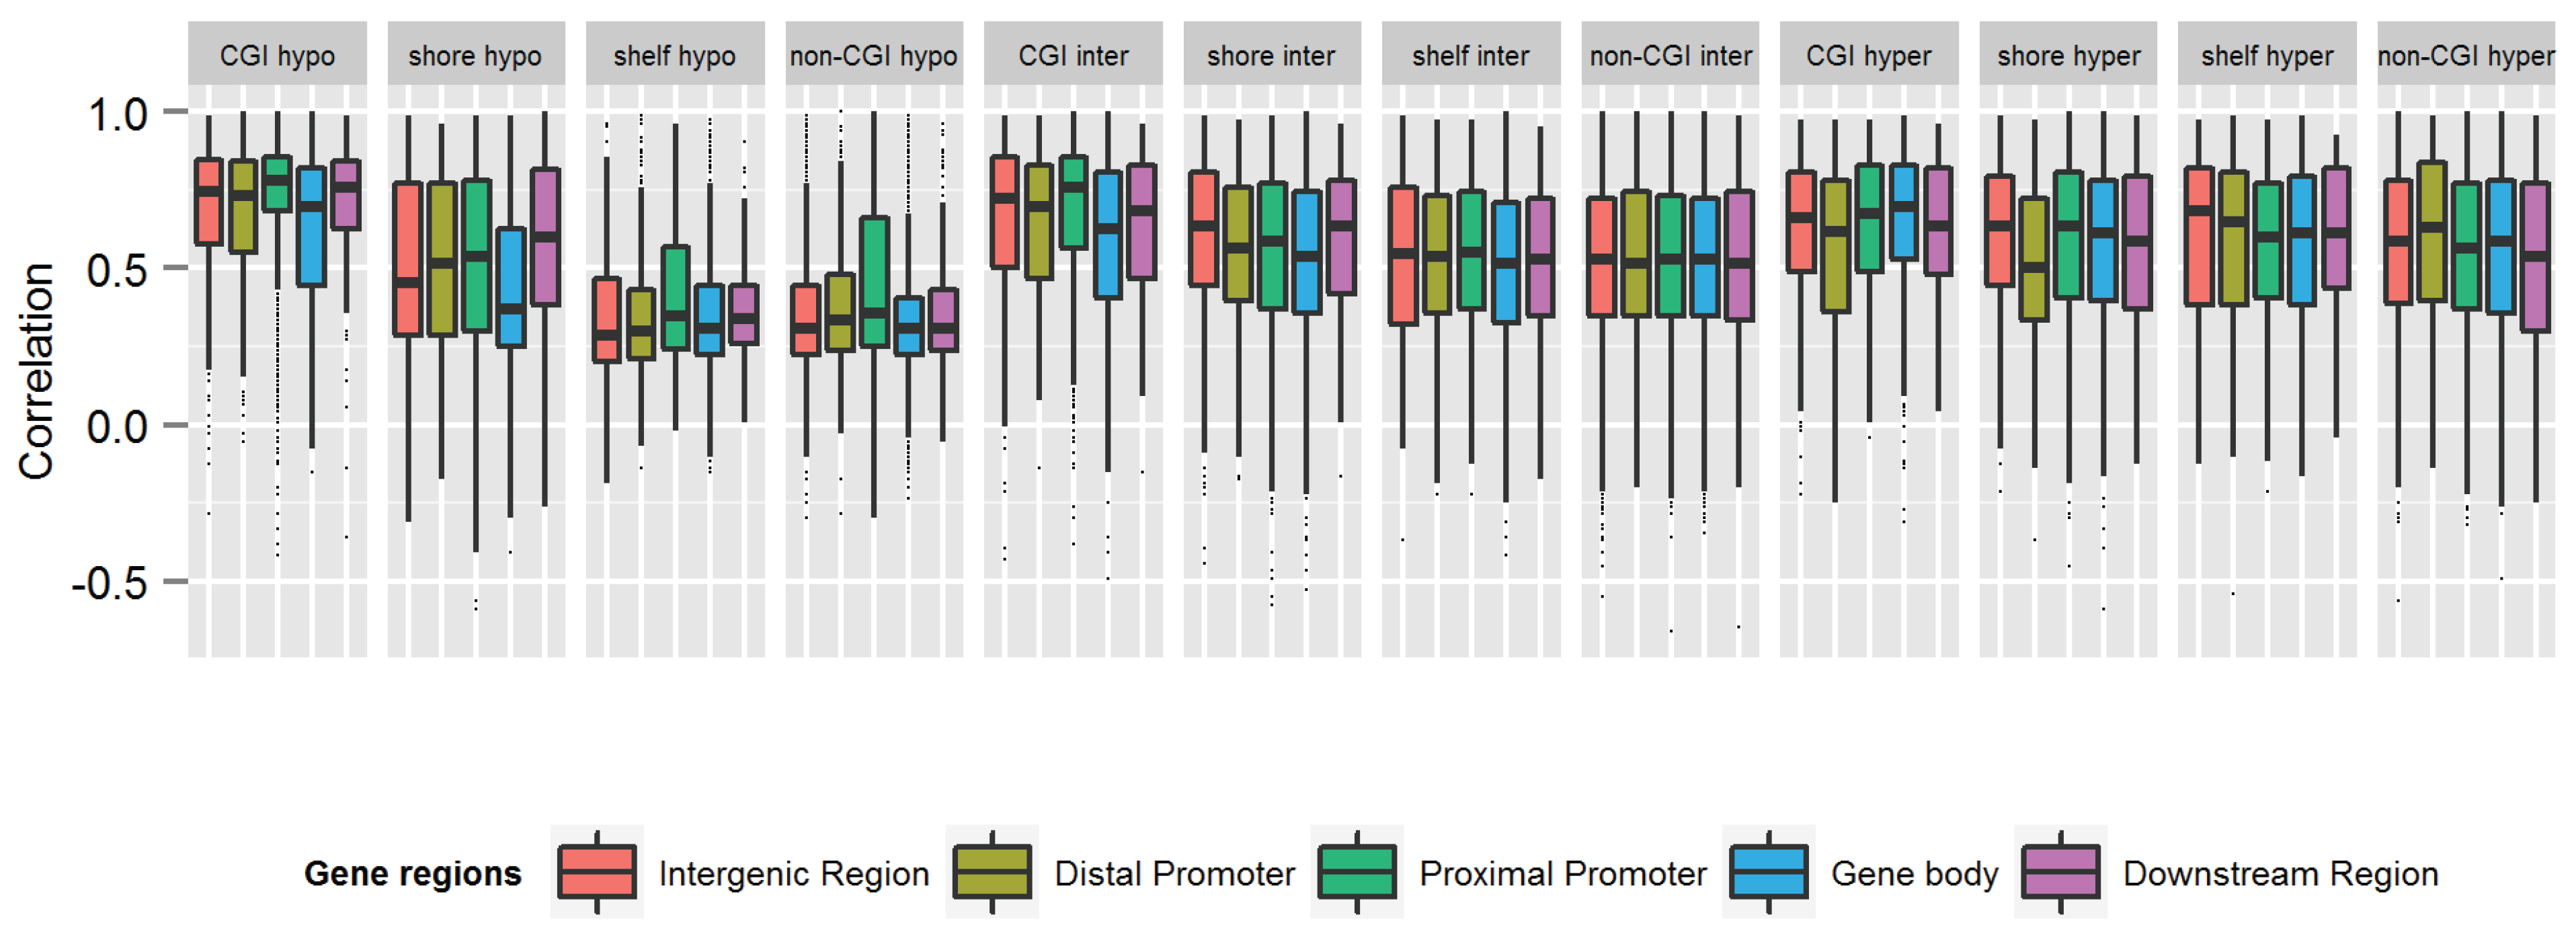
| Intergenic (>10 kb from TSS) | 11,430 (19.4%) | 0.52 | 0.53 | −0.56 | 1 |
| Distal Promoter (−10 kb to −1.5 kb from TSS) | 3193 (5.4%) | 0.53 | 0.53 | −0.54 | 1 |
| Proximal Promoter (−1.5 kb to +500 bp from TSS) | 17,880 (30.3%) | 0.57 | 0.62 | −0.66 | 1 |
| Gene Body (+500 bp to 3' end) | 25,163 (42.6%) | 0.51 | 0.50 | −0.59 | 1 |
| Downstream region (3' end to +5 kb from 3' end) | 1375 (2.3%) | 0.55 | 0.55 | −0.66 | 1 |
| CGI annotations | N CpGs (%) | Mean rho | Median rho | Min rho | Max rho |
| CGI | 10,576 (17.9%) | 0.66 | 0.73 | −0.49 | 1 |
| CGI shore | 14,803 (25.1%) | 0.54 | 0.55 | −0.59 | 1 |
| CGI shelf | 6001 (10.2%) | 0.50 | 0.49 | −0.54 | 1 |
| Non-CGI | 27,661 (46.9%) | 0.49 | 0.47 | −0.66 | 1 |
| Methylation level | N CpGs (%) | Mean rho | Median rho | Min rho | Max rho |
| Hypomethylated (average beta <0.3) | 17,581 (29.8) | 0.48 | 0.42 | −0.59 | 1 |
| Intermediately methylated (average beta ≥0.3–0.7) | 29,519 (50.0) | 0.55 | 0.56 | −0.66 | 1 |
| Hypermethylated (average beta ≥0.7) | 11,941 (20.2) | 0.58 | 0.61 | −0.59 | 1 |
3.4. MZ Twin Resemblance at CpGs in ENCODE Regulatory Regions
3.5. MZ Twin Resemblance at CpGs in Imprinted Genes
3.6. Interpretation and Future Directions
 ), which have better statistical properties, but reduced biological interpretability, compared to β-values [47]. The MZ twin correlations based on M-values were highly similar to those based on β-values and showed a similar genome-wide average (Table S4) and a similar pattern across regions and mean methylation categories (Figure S3). Irrespective of whether the lower resemblance of MZ twins mainly reflects that these sites harbor more biological variation that is unique to MZ twins or reflects that more variation at these sites is related to measurement error, our findings provide useful information for future heritability and mQTL studies. CpGs that are very weakly correlated between MZ twins are not likely to show high heritability or strong effects of DNA variants on the methylation level.
4. Conclusions
Supplementary Files
Acknowledgments
Author Contributions
Conflicts of Interest
References
- Hindorff, L.A.; MacArthur, J.; Morales, J.; Junkins, H.A.; Hall, P.N.; Klemm, A.K.; Manolio, T.A. A Catalog of Published Genome-Wide Association Studies. Available online: http://www.genome.gov/gwastudies/ (accessed on 27 January 2014).
- Hindorff, L.A.; Sethupathy, P.; Junkins, H.A.; Ramos, E.M.; Mehta, J.P.; Collins, F.S.; Manolio, T.A. Potential etiologic and functional implications of genome-wide association loci for human diseases and traits. Proc. Natl. Acad. Sci. USA 2009, 106, 9362–9367. [Google Scholar] [CrossRef]
- The ENCODE Project Consortium. An integrated encyclopedia of DNA elements in the human genome. Nature 2012, 489, 57–74. [Google Scholar] [CrossRef]
- Mill, J.; Heijmans, B.T. From promises to practical strategies in epigenetic epidemiology. Nat. Rev. Genet. 2013, 14, 585–594. [Google Scholar] [CrossRef]
- Goldberg, A.D.; Allis, C.D.; Bernstein, E. Epigenetics: A landscape takes shape. Cell 2007, 128, 635–638. [Google Scholar] [CrossRef]
- Jones, P.A. Functions of DNA methylation: islands, start sites, gene bodies and beyond. Nat. Rev. Genet. 2012, 13, 484–492. [Google Scholar] [CrossRef]
- Slieker, R.C.; Bos, S.D.; Goeman, J.J.; Bovee, J.V.; Talens, R.P.; van der Breggen, R.; Suchiman, H.E.; Lameijer, E.W.; Putter, H.; van den Akker, E.B.; et al. Identification and systematic annotation of tissue-specific differentially methylated regions using the Illumina 450k array. Epigenetics Chromatin 2013. [Google Scholar] [CrossRef]
- Maunakea, A.K.; Nagarajan, R.P.; Bilenky, M.; Ballinger, T.J.; D’Souza, C.; Fouse, S.D.; Johnson, B.E.; Hong, C.; Nielsen, C.; Zhao, Y.; et al. Conserved role of intragenic DNA methylation in regulating alternative promoters. Nature 2010, 466, 253–257. [Google Scholar] [CrossRef]
- Bird, A. DNA methylation patterns and epigenetic memory. Genes Dev. 2002, 16, 6–21. [Google Scholar] [CrossRef]
- Horvath, S.; Zhang, Y.; Langfelder, P.; Kahn, R.S.; Boks, M.P.; van Eijk, K.; van den Berg, L.H.; Ophoff, R.A. Aging effects on DNA methylation modules in human brain and blood tissue. Genome Biol. 2012. [Google Scholar] [CrossRef]
- Ziller, M.J.; Gu, H.; Muller, F.; Donaghey, J.; Tsai, L.T.; Kohlbacher, O.; de Jager, P.L.; Rosen, E.D.; Bennett, D.A.; Bernstein, B.E.; et al. Charting a dynamic DNA methylation landscape of the human genome. Nature 2013, 500, 477–481. [Google Scholar] [CrossRef]
- Kuehnen, P.; Mischke, M.; Wiegand, S.; Sers, C.; Horsthemke, B.; Lau, S.; Keil, T.; Lee, Y.A.; Grueters, A.; Krude, H. An Alu element-associated hypermethylation variant of the POMC gene is associated with childhood obesity. PLoS Genet. 2012, 8, e1002543. [Google Scholar] [CrossRef]
- Dempster, E.L.; Pidsley, R.; Schalkwyk, L.C.; Owens, S.; Georgiades, A.; Kane, F.; Kalidindi, S.; Picchioni, M.; Kravariti, E.; Toulopoulou, T.; et al. Disease-associated epigenetic changes in monozygotic twins discordant for schizophrenia and bipolar disorder. Hum. Mol. Genet. 2011, 20, 4786–4796. [Google Scholar] [CrossRef]
- Talens, R.P.; Boomsma, D.I.; Tobi, E.W.; Kremer, D.; Jukema, J.W.; Willemsen, G.; Putter, H.; Slagboom, P.E.; Heijmans, B.T. Variation, patterns, and temporal stability of DNA methylation: Considerations for epigenetic epidemiology. FASEB J. 2010, 24, 3135–3144. [Google Scholar] [CrossRef]
- Bell, J.T.; Pai, A.A.; Pickrell, J.K.; Gaffney, D.J.; Pique-Regi, R.; Degner, J.F.; Gilad, Y.; Pritchard, J.K. DNA methylation patterns associate with genetic and gene expression variation in HapMap cell lines. Genome Biol. 2011. [Google Scholar] [CrossRef]
- Heijmans, B.T.; Tobi, E.W.; Stein, A.D.; Putter, H.; Blauw, G.J.; Susser, E.S.; Slagboom, P.E.; Lumey, L.H. Persistent epigenetic differences associated with prenatal exposure to famine in humans. Proc. Natl. Acad. Sci. USA 2008, 105, 17046–17049. [Google Scholar] [CrossRef]
- Jeffries, A.R.; Perfect, L.W.; Ledderose, J.; Schalkwyk, L.C.; Bray, N.J.; Mill, J.; Price, J. Stochastic choice of allelic expression in human neural stem cells. Stem Cells 2012, 30, 1938–1947. [Google Scholar] [CrossRef]
- Waterland, R.A.; Dolinoy, D.C.; Lin, J.R.; Smith, C.A.; Shi, X.; Tahiliani, K.G. Maternal methyl supplements increase offspring DNA methylation at Axin Fused. Genesis 2006, 44, 401–406. [Google Scholar]
- Van Dongen, J.; Slagboom, P.E.; Draisma, H.H.; Martin, N.G.; Boomsma, D.I. The continuing value of twin studies in the omics era. Nat. Rev. Genet. 2012, 13, 640–653. [Google Scholar] [CrossRef]
- Ye, K.; Beekman, M.; Lameijer, E.W.; Zhang, Y.; Moed, M.H.; van den Akker, E.B.; Deelen, J.; Houwing-Duistermaat, J.J.; Kremer, D.; et al. Aging as accelerated accumulation of somatic variants: Whole-genome sequencing of centenarian and middle-aged monozygotic twin pairs. Twin Res. Hum. Genet. 2013, 16, 1026–1032. [Google Scholar] [CrossRef]
- Gordon, L.; Joo, J.E.; Powell, J.E.; Ollikainen, M.; Novakovic, B.; Li, X.; Andronikos, R.; Cruickshank, M.N.; Conneely, K.N.; Smith, A.K.; et al. Neonatal DNA methylation profile in human twins is specified by a complex interplay between intrauterine environmental and genetic factors, subject to tissue-specific influence. Genome Res. 2012, 22, 1395–1406. [Google Scholar] [CrossRef]
- Martino, D.; Loke, Y.J.; Gordon, L.; Ollikainen, M.; Cruickshank, M.N.; Saffery, R.; Craig, J.M. Longitudinal, genome-scale analysis of DNA methylation in twins from birth to 18 months of age reveals rapid epigenetic change in early life and pair-specific effects of discordance. Genome Biol. 2013. [Google Scholar] [CrossRef]
- Fraga, M.F.; Ballestar, E.; Paz, M.F.; Ropero, S.; Setien, F.; Ballestar, M.L.; Heine-Suner, D.; Cigudosa, J.C.; Urioste, M.; Benitez, J.; et al. Epigenetic differences arise during the lifetime of monozygotic twins. Proc. Natl. Acad. Sci. USA 2005, 102, 10604–10609. [Google Scholar] [CrossRef]
- Bocklandt, S.; Lin, W.; Sehl, M.E.; Sanchez, F.J.; Sinsheimer, J.S.; Horvath, S.; Vilain, E. Epigenetic predictor of age. PLoS One 2011, 6, e14821. [Google Scholar]
- Talens, R.P.; Christensen, K.; Putter, H.; Willemsen, G.; Christiansen, L.; Kremer, D.; Suchiman, H.E.; Slagboom, P.E.; Boomsma, D.I.; Heijmans, B.T. Epigenetic variation during the adult lifespan: Cross-sectional and longitudinal data on monozygotic twin pairs. Aging Cell 2012, 11, 694–703. [Google Scholar] [CrossRef]
- Boks, M.P.; Derks, E.M.; Weisenberger, D.J.; Strengman, E.; Janson, E.; Sommer, I.E.; Kahn, R.S.; Ophoff, R.A. The relationship of DNA methylation with age, gender and genotype in twins and healthy controls. PLoS One 2009, 4, e6767. [Google Scholar] [CrossRef]
- Coolen, M.W.; Statham, A.L.; Qu, W.; Campbell, M.J.; Henders, A.K.; Montgomery, G.W.; Martin, N.G.; Clark, S.J. Impact of the genome on the epigenome is manifested in DNA methylation patterns of imprinted regions in monozygotic and dizygotic twins. PLoS One 2011, 6, e25590. [Google Scholar] [CrossRef]
- Gervin, K.; Hammero, M.; Akselsen, H.E.; Moe, R.; Nygard, H.; Brandt, I.; Gjessing, H.K.; Harris, J.R.; Undlien, D.E.; Lyle, R. Extensive variation and low heritability of DNA methylation identified in a twin study. Genome Res. 2011, 21, 1813–1821. [Google Scholar] [CrossRef]
- Heijmans, B.T.; Kremer, D.; Tobi, E.W.; Boomsma, D.I.; Slagboom, P.E. Heritable rather than age-related environmental and stochastic factors dominate variation in DNA methylation of the human IGF2/H19 locus. Hum. Mol. Genet. 2007, 16, 547–554. [Google Scholar] [CrossRef]
- Ollikainen, M.; Smith, K.R.; Joo, E.J.; Ng, H.K.; Andronikos, R.; Novakovic, B.; Abdul Aziz, N.K.; Carlin, J.B.; Morley, R.; Saffery, R.; et al. DNA methylation analysis of multiple tissues from newborn twins reveals both genetic and intrauterine components to variation in the human neonatal epigenome. Hum. Mol. Genet. 2010, 19, 4176–4188. [Google Scholar] [CrossRef]
- Wong, C.C.; Caspi, A.; Williams, B.; Craig, I.W.; Houts, R.; Ambler, A.; Moffitt, T.E.; Mill, J. A longitudinal study of epigenetic variation in twins. Epigenetics 2010, 5, 516–526. [Google Scholar] [CrossRef]
- Kaminsky, Z.A.; Tang, T.; Wang, S.C.; Ptak, C.; Oh, G.H.; Wong, A.H.; Feldcamp, L.A.; Virtanen, C.; Halfvarson, J.; Tysk, C.; et al. DNA methylation profiles in monozygotic and dizygotic twins. Nat. Genet. 2009, 41, 240–245. [Google Scholar] [CrossRef]
- Bell, J.T.; Tsai, P.C.; Yang, T.P.; Pidsley, R.; Nisbet, J.; Glass, D.; Mangino, M.; Zhai, G.; Zhang, F.; Valdes, A.; et al. Epigenome-wide scans identify differentially methylated regions for age and age-related phenotypes in a healthy ageing population. PLoS Genet. 2012, 8, e1002629. [Google Scholar] [CrossRef]
- Grundberg, E.; Meduri, E.; Sandling, J.K.; Hedman, A.K.; Keildson, S.; Buil, A.; Busche, S.; Yuan, W.; Nisbet, J.; Sekowska, M.; et al. Global analysis of DNA methylation variation in adipose tissue from twins reveals links to disease-associated variants in distal regulatory elements. Am. J. Hum. Genet. 2013, 93, 876–890. [Google Scholar] [CrossRef]
- Bibikova, M.; Barnes, B.; Tsan, C.; Ho, V.; Klotzle, B.; Le, J.M.; Delano, D.; Zhang, L.; Schroth, G.P.; Gunderson, K.L.; et al. High density DNA methylation array with single CpG site resolution. Genomics 2011, 98, 288–295. [Google Scholar] [CrossRef]
- Van Beijsterveldt, C.E.; Groen-Blokhuis, M.; Hottenga, J.J.; Franic, S.; Hudziak, J.J.; Lamb, D.; Huppertz, C.; de Zeeuw, E.; Nivard, M.; Schutte, N.; et al. The Young Netherlands Twin Register (YNTR): Longitudinal twin and family studies in over 70,000 children. Twin Res. Hum. Genet. 2013, 16, 252–267. [Google Scholar] [CrossRef]
- Estourgie-van Burk, G.F.; Bartels, M.; Hoekstra, R.A.; Polderman, T.J.; Delemarre-van de Waal, H.A.; Boomsma, D.I. A twin study of cognitive costs of low birth weight and catch-up growth. J. Pediatr. 2009, 154, 29–32. [Google Scholar] [CrossRef]
- Willemsen, G.; de Geus, E.J.; Bartels, M.; van Beijsterveldt, C.E.; Brooks, A.I.; Estourgie-van Burk, G.F.; Fugman, D.A.; Hoekstra, C.; Hottenga, J.J.; Kluft, K.; et al. The Netherlands Twin Register biobank: A resource for genetic epidemiological studies. Twin Res. Hum. Genet. 2010, 13, 231–245. [Google Scholar] [CrossRef]
- Meulenbelt, I.; Droog, S.; Trommelen, G.J.; Boomsma, D.I.; Slagboom, P.E. High-yield noninvasive human genomic DNA isolation method for genetic studies in geographically dispersed families and populations. Am. J. Hum. Genet. 1995, 57, 1252–1254. [Google Scholar]
- R Core Team. R: A language and environment for statistical computing. R Foundation for Statistical Computing, Vienna, Austria. Available online: http://www.R-project.org/ (accessed on 27 January 2014).
- Chen, Y.A.; Lemire, M.; Choufani, S.; Butcher, D.T.; Grafodatskaya, D.; Zanke, B.W.; Gallinger, S.; Hudson, T.J.; Weksberg, R. Discovery of cross-reactive probes and polymorphic CpGs in the Illumina Infinium HumanMethylation450 microarray. Epigenetics 2013, 8, 203–209. [Google Scholar] [CrossRef]
- Boomsma, D.I.; Wijmenga, C.; Slagboom, E.P.; Swertz, M.A.; Karssen, L.C.; Abdellaoui, A.; Ye, K.; Guryev, V.; Vermaat, M.; van Dijk, F.; et al. The Genome of the Netherlands: Design, and project goals. Eur. J. Hum. Genet. 2014, 22, 221–227. [Google Scholar] [CrossRef]
- Teschendorff, A.E.; Marabita, F.; Lechner, M.; Bartlett, T.; Tegner, J.; Gomez-Cabrero, D.; Beck, S. A beta-mixture quantile normalization method for correcting probe design bias in Illumina Infinium 450k DNA methylation data. Bioinformatics 2013, 29, 189–196. [Google Scholar] [CrossRef]
- Kent, W.J.; Sugnet, C.W.; Furey, T.S.; Roskin, K.M.; Pringle, T.H.; Zahler, A.M.; Haussler, D. The human genome browser at UCSC. Genome Res. 2002, 12, 996–1006. [Google Scholar] [CrossRef]
- Yuen, R.K.; Jiang, R.; Penaherrera, M.S.; McFadden, D.E.; Robinson, W.P. Genome-wide mapping of imprinted differentially methylated regions by DNA methylation profiling of human placentas from triploidies. Epigenetics Chromatin 2011. [Google Scholar] [CrossRef]
- Pan, H.; Chen, L.; Dogra, S.; Teh, A.L.; Tan, J.H.; Lim, Y.I.; Lim, Y.C.; Jin, S.; Lee, Y.K.; Ng, P.Y.; et al. Measuring the methylome in clinical samples: improved processing of the Infinium Human Methylation450 BeadChip Array. Epigenetics 2012, 7, 1173–1187. [Google Scholar] [CrossRef]
- Du, P.; Zhang, X.; Huang, C.C.; Jafari, N.; Kibbe, W.A.; Hou, L.; Lin, S.M. Comparison of Beta-value and M-value methods for quantifying methylation levels by microarray analysis. BMC Bioinform. 2010. [Google Scholar] [CrossRef]
- Thiede, C.; Prange-Krex, G.; Freiberg-Richter, J.; Bornhauser, M.; Ehninger, G. Buccal swabs but not mouthwash samples can be used to obtain pretransplant DNA fingerprints from recipients of allogeneic bone marrow transplants. Bone Marrow Transpl. 2000, 25, 575–577. [Google Scholar]
© 2014 by the authors; licensee MDPI, Basel, Switzerland. This article is an open access article distributed under the terms and conditions of the Creative Commons Attribution license (http://creativecommons.org/licenses/by/3.0/).
Share and Cite
Van Dongen, J.; Ehli, E.A.; Slieker, R.C.; Bartels, M.; Weber, Z.M.; Davies, G.E.; Slagboom, P.E.; Heijmans, B.T.; Boomsma, D.I. Epigenetic Variation in Monozygotic Twins: A Genome-Wide Analysis of DNA Methylation in Buccal Cells. Genes 2014, 5, 347-365. https://doi.org/10.3390/genes5020347
Van Dongen J, Ehli EA, Slieker RC, Bartels M, Weber ZM, Davies GE, Slagboom PE, Heijmans BT, Boomsma DI. Epigenetic Variation in Monozygotic Twins: A Genome-Wide Analysis of DNA Methylation in Buccal Cells. Genes. 2014; 5(2):347-365. https://doi.org/10.3390/genes5020347
Chicago/Turabian StyleVan Dongen, Jenny, Erik A. Ehli, Roderick C. Slieker, Meike Bartels, Zachary M. Weber, Gareth E. Davies, P. Eline Slagboom, Bastiaan T. Heijmans, and Dorret I. Boomsma. 2014. "Epigenetic Variation in Monozygotic Twins: A Genome-Wide Analysis of DNA Methylation in Buccal Cells" Genes 5, no. 2: 347-365. https://doi.org/10.3390/genes5020347
APA StyleVan Dongen, J., Ehli, E. A., Slieker, R. C., Bartels, M., Weber, Z. M., Davies, G. E., Slagboom, P. E., Heijmans, B. T., & Boomsma, D. I. (2014). Epigenetic Variation in Monozygotic Twins: A Genome-Wide Analysis of DNA Methylation in Buccal Cells. Genes, 5(2), 347-365. https://doi.org/10.3390/genes5020347