Article

Polygenic Models Partially Predict Muscle Size and Strength but Not Low Muscle Mass in Older Women

by
Praval Khanal
1,2,3,*,
Christopher I. Morse
1,
Lingxiao He
1,2,
Adam J. Herbert
4,
Gladys L. Onambélé-Pearson
1,
Hans Degens
5,6,
Martine Thomis
2,
Alun G. Williams
1,7,8 and
Georgina K. Stebbings
1
1
Musculoskeletal Science and Sports Medicine Research Centre, Department of Sport and Exercise Sciences, Manchester Metropolitan University Institute of Sport, Manchester Metropolitan University, Manchester M15 6BH, UK
2
Physical Activity, Sports & Health Research Group, Department of Movement Sciences, KU Leuven, 3001 Leuven, Belgium
3
Department of Medical Biochemistry, Nobel College, Affiliated to Pokhara University, Kathmandu 44600, Nepal
4
Research Centre for Life and Sport Sciences (CLaSS), Department of Sport and Exercise, School of Health Sciences, Birmingham City University, Birmingham B5 5JU, UK
5
Musculoskeletal Science and Sports Medicine Research Centre, Department of Life Sciences, Manchester Metropolitan University Institute of Sport, Manchester Metropolitan University, Manchester M15 6BH, UK
6
Institute of Sport Science and Innovations, Lithuanian Sports University, LT-44221 Kaunas, Lithuania
7
Institute of Sport, Exercise and Health, University College London, London W1T 7HA, UK
8
Applied Sports, Technology, Exercise and Medicine Research Centre (A-STEM), College of Engineering, Swansea University, Swansea SA2 8PP, UK
*
Author to whom correspondence should be addressed.
Genes 2022, 13(6), 982; https://doi.org/10.3390/genes13060982
Submission received: 12 April 2022 / Revised: 17 May 2022 / Accepted: 21 May 2022 / Published: 30 May 2022

Abstract

:
Background: Heritability explains 45-82% of muscle mass and strength variation, yet polygenic models for muscle phenotypes in older women are scarce. Therefore, the objective of the present study was to (1) assess if total genotype predisposition score (GPSTOTAL) for a set of polymorphisms differed between older women with low and high muscle mass, and (2) utilise a data-driven GPS (GPSDD) to predict the variance in muscle size and strength-related phenotypes. Methods: In three-hundred 60- to 91-year-old Caucasian women (70.7 ± 5.7 years), skeletal muscle mass, biceps brachii thickness, vastus lateralis anatomical cross-sectional area (VLACSA), hand grip strength (HGS), and elbow flexion (MVCEF) and knee extension (MVCKE) maximum voluntary contraction were measured. Participants were classified as having low muscle mass if the skeletal muscle index (SMI) < 6.76 kg/m2 or relative skeletal muscle mass (%SMMr) < 22.1%. Genotyping was completed for 24 single-nucleotide polymorphisms (SNPs). GPSTOTAL was calculated from 23 SNPs and compared between the low and high muscle mass groups. A GPSDD was performed to identify the association of SNPs with other skeletal muscle phenotypes. Results: There was no significant difference in GPSTOTAL between low and high muscle mass groups, irrespective of classification based on SMI or %SMMr. The GPSDD model, using 23 selected SNPs, revealed that 13 SNPs were associated with at least one skeletal muscle phenotype: HIF1A rs11549465 was associated with four phenotypes and, in descending number of phenotype associations, ACE rs4341 with three; PTK2 rs7460 and CNTFR rs2070802 with two; and MTHFR rs17421511, ACVR1B rs10783485, CNTF rs1800169, MTHFR rs1801131, MTHFR rs1537516, TRHR rs7832552, MSTN rs1805086, COL1A1 rs1800012, and FTO rs9939609 with one phenotype. The GPSDD with age included as a predictor variable explained 1.7% variance of biceps brachii thickness, 12.5% of VLACSA, 19.0% of HGS, 8.2% of MVCEF, and 9.6% of MVCKE. Conclusions: In older women, GPSTOTAL did not differ between low and high muscle mass groups. However, GPSDD was associated with muscle size and strength phenotypes. Further advancement of polygenic models to understand skeletal muscle function during ageing might become useful in targeting interventions towards older adults most likely to lose physical independence.

1. Introduction

Skeletal muscle phenotypes, particularly muscle mass and muscle strength, are determined by multiple factors [1,2], and it has been reported that heritability may explain 45–82% of these phenotypes [3,4,5]. Over 200 gene variants have been linked with health-related fitness phenotypes [6], and many cross-sectional and longitudinal studies have identified single-nucleotide polymorphisms (SNPs) that are associated with skeletal muscle phenotypes, specifically muscle mass and strength [6,7,8,9]. Yet, only a limited number of these SNPs, such as ACTN3 and ACE, have shown consistent associations with skeletal muscle phenotypes in different populations, while most SNPs have been investigated only once or have shown contradictory results [10,11]. Perhaps part of the problem is that there is considerable (16–20%) inter-individual variability in skeletal muscle mass and strength [12] that is under polygenic control, contributing to the lack of successful replications between these phenotypes and single gene variants [10]. Attempts to explain some of the variability in these phenotypes via single SNP analyses has had some success. ACTN3 R577X, for example, explained 1–1.4% of the variation in knee extension torque [13], but this was less than the 3–9% of variation explained when using a polygenic approach in male coronary artery disease patients [14]. Therefore, the inclusion of multiple gene variants that may influence skeletal muscle phenotypes might explain a greater proportion of the variance observed within skeletal muscle phenotypes. An understanding of the polygenic profile of skeletal muscle phenotypes among the older population may be beneficial for the understanding of the development and risk of disability and sarcopenia in old age [15].
Given that women have a lower muscle mass than men and hence any loss of muscle mass will cause them to cross a disability threshold earlier, it is no surprise that women experience more severe loss of mobility as a result [16]. Considering the importance of muscle mass/strength for maintaining mobility [17], reducing length of hospital stay [18], and delaying mortality during ageing [19], it is necessary to investigate the polygenic influence on important skeletal muscle phenotypes, such as muscle size and strength, in an older population. Below established thresholds of either skeletal muscle mass relative to body mass (%SMMr), or skeletal muscle mass relative to height2, termed the skeletal muscle index (SMI), older individuals can be defined as having low muscle mass equivalent to “pre-sarcopenia” [20,21]. The pre-sarcopenia thresholds for both muscle mass indices have been established to indicate adverse outcomes associated with ageing. For instance, a %SMMr < 22.1% has been linked to higher risk of functional impairment and physical disability in older women [20], while an SMI < 6.76 kg/m2 in older women was associated with elevated risk of physical disability [21]. Given the potential for even independently living older women to fall under this pre-sarcopenic classification of low muscle mass, understanding the polygenic influence on skeletal muscle phenotypes may allow us to identify those at increased risk of experiencing low muscle mass with ageing.
The polygenic concept was first introduced to explore the genetic contribution to elite human performance in hypothetical populations [22], and this approach has been later successful in distinguishing elite athletes in strength-related sports from non-athlete populations [23,24,25,26]. Over time, different approaches have been developed to study the polygenic influence on muscle, but the basis of each approach is to allocate a genotype score (GS) according to the assumed positive/negative effect of alleles on phenotypes [27]. The GPSDD is one example of how the polygenic approach has changed [14,28,29]. GPSDD differs from the GPSTOTAL by only including SNPs that were significantly associated with the phenotype(s) of interest in the analysis. In addition, the incorporation of other factors (such as age, sex, diet, and physical activity) in GPSDD may explain more of the variance in skeletal muscle phenotypes [27].
Recently, our group has identified a set of SNPs related to skeletal muscle phenotypes and low muscle mass using the single candidate gene approach in older women [30,31]. Yet, the cumulative effect of SNPs on ageing muscle phenotypes may be better understood if a polygenic model is adopted. Furthermore, no study has assessed whether there is a difference in GPSTOTAL between a low muscle mass group (equivalent to pre-sarcopenia thresholds of SMI and %SMMr) and a high muscle mass group. The objective of the present study was, therefore, to (1) compare a GPSTOTAL (including 23 SNPs) between older women classified as having a low or high muscle mass on the basis of SMI and %SMMr indices, and (2) assess the predictive power of GPSDD on skeletal muscle phenotypes related to the upper and lower limb, specifically muscle size and strength measures.

2. Methods

2.1. Participants

Three-hundred 60- to 91-year-old Caucasian women (70.7 ± 5.7 years, 66.3 ± 11.3 kg, 1.60 ± 0.06 m; mean ± SD) were recruited in the current study from the University of the Third Age (U3A), who were socially engaged in different recreational activities. Some of the participants were recruited via word-of-mouth between participants. The participants reported no symptoms of cardiovascular, muscular, and bone diseases that could interfere with daily activities. All study protocols were in accordance with the guidelines of the Declaration of Helsinki and approved by the local ethics committee of Manchester Metropolitan University. Participants provided written consent prior to involvement in this study.

2.2. Muscle Mass, Size, and Strength Related Phenotypes

Skeletal muscle mass (SMM) was estimated using bio-impedance analysis (BIA) (Model 1500; Bodystat, Douglas, Isle of Man, UK) validated for use in a Caucasian population [32] and then used to calculate the skeletal muscle index (SMI) as SMM/height2 and %SMMr as 100% × SMM/body mass.
Biceps brachii thickness and vastus lateralis muscle anatomical cross-sectional area (VLACSA) were measured with B-mode ultrasound (My LabTwice, Esaote Biomedical, Genoa, Italy). The measurements were performed at 60% length of humerus (measured from proximal end) for biceps brachii thickness, and at 50% of vastus lateralis muscle length for VLACSA. Intraclass correlation coefficient (ICC), based on measurements from 6 participants, for biceps brachii thickness and VLACSA, was high in our population (ICC = 0.98 for biceps brachii thickness, ICC = 0.99 for VLACSA) [33]. The detailed procedure for obtaining the biceps brachii thickness and VLACSA using ultrasonography has been described previously [33].
Handgrip strength (HGS) was calculated as the highest value of six trials (three trials each with the left and right hand) using a digital load cell handgrip dynamometer (JAMAR plus, JLW Instruments, Chicago, IL, USA) [31]. The reliability of assessment of HGS is high (ICC = 0.99) [34].
A custom-built dynamometer with participants sitting and maintaining a knee angle at 120° extension (180° is equivalent to straight position) was used to assess the knee extension torque (MVCKE) of the dominant leg through a calibrated load cell (Zemic, EtenLeur, The Netherlands). Three trials were completed, and the highest force value was recorded and converted to torque (N·m) as
MVCKE = Force × distance from rotation point of dynamometer to ankle strap × Cos 30°
Similarly, the same dynamometer was used to assess elbow flexion torque (MVCEF) with participants seated and elbow flexed at 60° (0° is a straight position). Three trials were completed, and the highest force was recorded and subsequently the output was converted to torque (N·m) as
MVCEF = Force × Radius length × Cos 30°
ICC for measuring both MVCEF (ICC = 0.95) and MVCKE (ICC = 0.96) were reported as high with this method [33].

2.3. Pre-Sarcopenia/Low Muscle Mass Assessment

Using SMI and %SMMr, participants were separated into two groups, either “high muscle mass” or “low muscle mass”, on the basis of pre-sarcopenic thresholds defined in our previous study and others [31]. Individuals with SMI < 6.76 kg/m2 were defined as pre-sarcopenic and allocated to the low muscle mass group [21], and with the %SMMr approach, individuals with %SMMr < 22.1% were defined as pre-sarcopenic and allocated to the low muscle mass group [20].

2.4. SNPs Selection, DNA Extraction, and Genotyping

Twenty-four SNPs were chosen on the basis of their previous association with skeletal muscle mass, or similar, phenotypes (Table S1). Participants were asked to provide either a venous blood (collected from a superficial forearm vein in EDTA tubes and stored at −20 °C) or saliva (in DNA Saliva kits (Oragene®DNA, OG-500, Ottawa, ON, Canada) and stored at room temperature) sample. Genomic DNA was extracted using the Qiagen DNA Blood Mini kit (Qiagen, Crawley, UK).
An EP1 Fluidigm system was used for genotyping as per the manufacturer’s instructions. All samples were analysed in duplicate to minimise the occurrence of genotyping errors [35]. When duplicate samples did not agree (≈1%), they were analysed again using a StepOnePlus instrument (Applied Biosystems, Paisley, UK). The detailed process for genotyping the samples has been explained in our previous paper [31].

2.5. Statistical Analysis

All statistical analyses were performed in IBM SPSS Version 27.0, and statistical significance was set at p < 0.05. The assessment of Hardy–Weinberg equilibrium (HWE) for all SNPs was performed using the chi-squared test. Then SNPs were examined for linkage disequilibrium (LD), checking for the heterozygotes and homozygotes similarity between the associated SNPs. For two SNPs (PTK2 rs7460 and PTK2 rs7843014), there was high LD between the SNPs (LD > 0.8), and only PTK2 rs7460 was retained for further analyses. GS was assigned to each genotype for all remaining SNPs (n = 23), as described previously [22], where the favourable (predisposing) allele—on the basis of previous literature, in the instance of insufficient evidence within the literature using the present dataset—was allocated a score of 1 and least favourable allele as 0; thus, the favourable homozygous genotype was scored 2, heterozygote as 1, and least favourable homozygous genotype as 0 (Table S1). Where there was insufficient evidence in the literature to determine the favourable allele, we coded the direction for allocating a GS on the basis of the β-coefficient as tested by regression (with HGS (a commonly assessed muscle phenotype) as the dependent variable and SNP coding value as the independent variable). If there was a positive β-coefficient value, the scoring of genotypes was retained, while for a negative β-coefficient value, the scoring was reversed. GPSTOTAL of the participants was calculated as the sum of all 23 GSs (Table S1). An independent samples t-test was performed to identify the differences in GPSTOTAL between high muscle mass and low muscle mass groups, using both the %SMMr threshold (%SMMr < 22.1%) [20] and SMI threshold (SMI < 6.76 kg/m2) [21].
To establish a GPSDD, a backward linear regression with age and individual SNP GSs included in the model was performed to identify the SNPs associated with investigated skeletal muscle phenotypes (biceps brachii thickness, VLACSA, HGS, MVCEF, and MVCKE). The significance levels for entry and exit in the model were 0.1 and 0.05, respectively. In the instance when the β coefficient was negative, the scoring of the predisposing allele was reversed from the initial scoring. Then, a GPS was calculated for each phenotype by summing GSs of only those SNPs associated with the selected skeletal muscle phenotype in the backward linear regression (p < 0.1) as described previously [29]. Finally, linear regressions were carried out with GPS and age as independent variables, and skeletal muscle phenotypes as dependent variables.
For each phenotype, GPSs were grouped according to the number of predisposing alleles possessed, and the mean value was calculated for each group [28]. When a group had few (≤17, <6.0%) participants, it was merged with the group with the nearest number of predisposing alleles.

3. Results

Participant characteristics are presented in Table 1. Those in the low muscle mass group according to the SMI threshold (SMI < 6.76 kg/m2) had lower %SMMr (−7.4%, p < 0.001), biceps brachii thickness (−4.9%, p = 0.016), VLACSA (−12.5%, p < 0.001), HGS (−6.1%, p = 0.003), MVCEF (−9.5%, p < 0.001), and MVCKE (−8.6%, p = 0.022) than the high muscle mass group. Similarly, the low muscle mass group based on the %SMMr threshold (%SMMr < 22.1%) had lower SMI (−9.5%, p < 0.001), SMMr (−24.8%, p < 0.001), body mass (−16.9%, p < 0.001), and MVCKE (−11.3%, p = 0.041), and higher BMI (16.8%, p < 0.001) than the high muscle mass group.
All the SNPs selected were in HWE (p > 0.05).

3.1. Total Genotype Predisposition Score and Pre-Sarcopenia/Low Muscle Mass

There was no significant difference in GPSTOTAL between low muscle mass and high muscle mass groups using the SMI (t (298) = −0.074, p = 0.941) or %SMMr (t (298) = −1.351, p = 0.178) to classify low muscle mass.

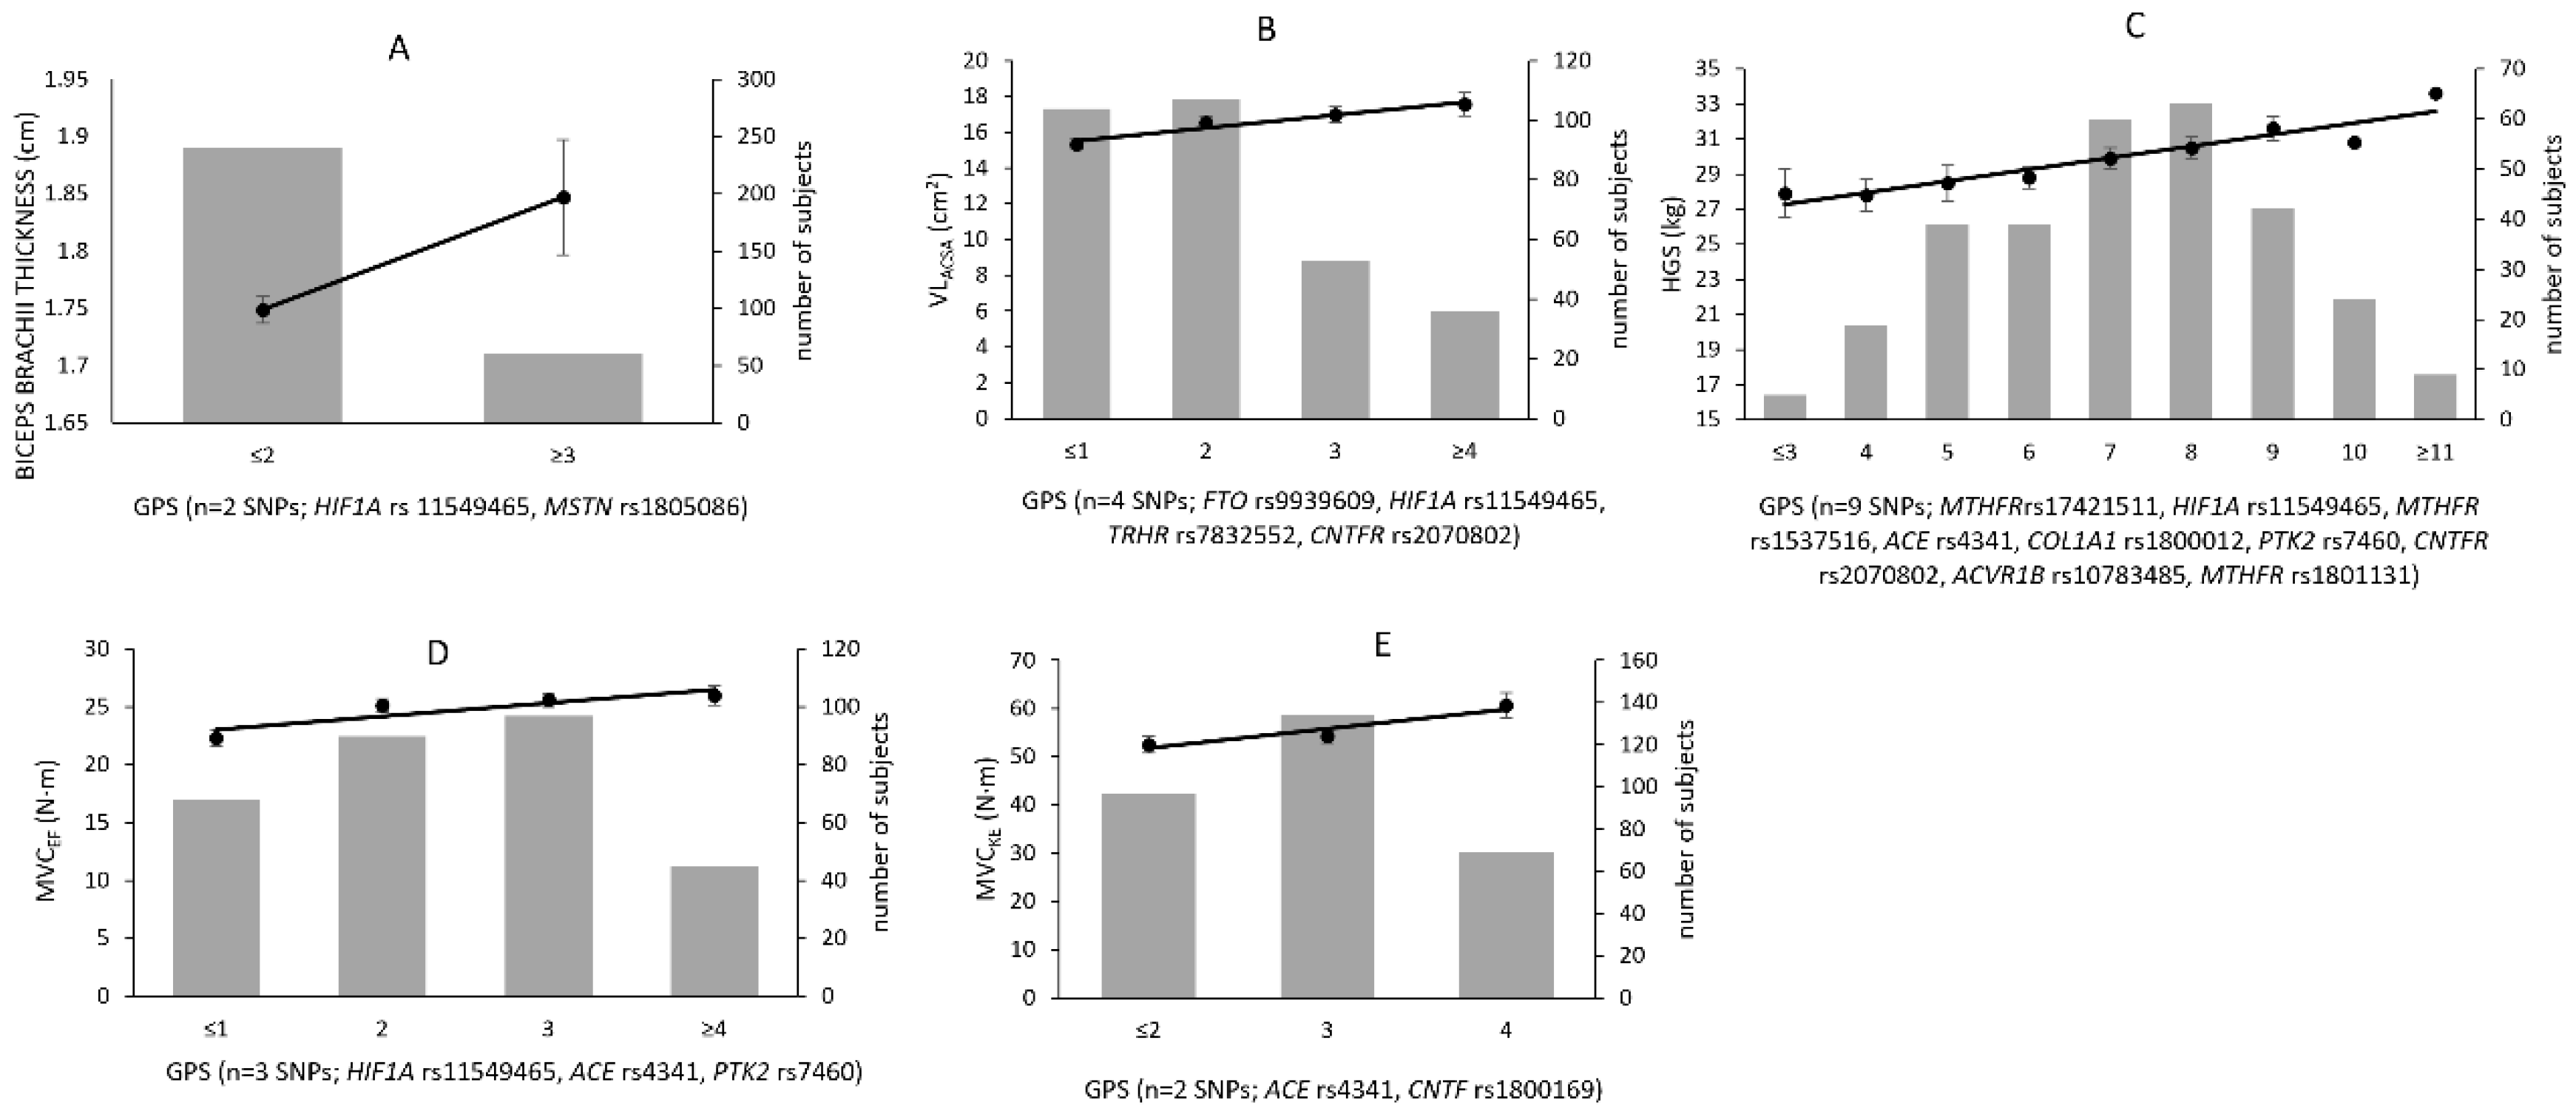
3.2. Data-Driven GPS and Skeletal Muscle Phenotypes

The GPSDD model explained 1.7% of the variance in biceps brachii thickness, 12.5% in VLACSA, 19.0% in HGS, 8.2% in MVCEF, and 9.6% in MVCKE (Table 2). On the basis of the backward regression analysis, 13 out of 23 SNPs were found to be associated with at least one of the phenotypes under investigation. HIF1A rs11549465 was associated with four out of five investigated skeletal muscle phenotypes and, in descending number of phenotype associations, ACE rs4341 with three; PTK2 rs7460 and CNTFR rs2070802 with two; MTHFR rs17421511, ACVR1B rs10783485, CNTF rs1800169, MTHFR rs1801131, MTHFR rs1537516, TRHR rs7832552, MSTN rs1805086, COL1A1 rs1800012, and FTO rs9939609 with one phenotype (Table 2). Similarly, HGS was associated with nine SNPs, VLACSA with four, MVCEF with three, and biceps brachii thickness and MVCKE each with two (Table 2).
There was an increment in most of the muscle size and muscle strength phenotypes in older women according to each additional predisposing allele (Figure 1). For example, subjects possessing ≤1 predisposing allele for VLACSA had 15.3 ± 0.3 cm2 area, those possessing two had 16.5 ± 0.4 cm2, those with three had 17.0 ± 0.4 cm2, and those possessing ≥4 had 17.6 ± 0.6 cm2 (Figure 1 B). Similarly, those possessing ≤1 predisposing allele for MVCEF had 22.3 ± 0.7 N·m, those with two had 25.2 ± 0.6 N·m, those with three had 25.6 ± 0.6 N·m, and those possessing ≥4 had 26.0 ± 0.8 N·m (values are mean ± SE) (Figure 1D).

4. Discussion

The present study observed that GPSTOTAL, containing 23 SNPs, did not differ between low and high muscle mass groups of older women. We report that a GPSDD model was successful in explaining 2–19% of the observed variance in muscle size and strength phenotypes. The GPSDD model showed that 13 of the 23 selected candidate gene variants were associated with muscle phenotypes, and HIF1A rs11549465 was associated with four phenotypes. These results imply that older women possessing fewer predisposing alleles for skeletal muscle size/strength might be more susceptible to early muscle loss, limiting their ability to maintain independence in later life.
Previously, applying a single candidate gene approach, we reported an association of four gene variants (FTO rs9939609, TRHR rs7832552, NOS3 rs1799983, and ESR1 rs4870044) with muscle mass in this same population [31]. However, after combining muscular phenotype-driven SNPs, there was no difference in GPSTOTAL between low and high muscle mass groups (defined on the basis of thresholds of %SMMr and SMI), which aligns with other studies using other polygenic approaches with muscle phenotypes or athletic status [27,36]. Perhaps this unexpected observation is attributable to the fact that a positive score for one SNP may be cancelled by the negative score of another SNP. In addition, the number of SNPs considered in the present study is relatively small compared to what is possible in principle, and we are aware that muscle phenotypes are also very likely to depend on many other gene variants not included in the current study. Genome wide association studies might be useful in identifying more SNPs that are associated with skeletal muscle phenotypes, but the technique is more expensive and requires a larger sample.
The associations between GPSDD and muscle size and strength measures imply that having more favourable alleles, and thus higher GPS score, is beneficial for a larger muscle size and a greater muscle strength. For instance, our study shows that with an increment of one predisposing allele, older women can expect approximate increases in biceps brachii thickness of 0.10 cm, VLACSA of 0.71 cm2, HGS of 0.7 kg, MVCEF of 1.1 N·m, and MVCKE of 3.7 N·m. In coronary artery disease patients (age 60.5 ± 9.6 years), previous use of a GPSDD model demonstrated a comparable association between GPS and increment in rectus femoris diameter after five months of aerobic exercise training [14]. In another way, our study showed that having a low number of predisposing alleles results in small muscle size and low muscle strength, and therefore elderly women with those conditions may lose independence earlier than those with more predisposing alleles for muscle size and strength-related phenotypes. We do, however, acknowledge that different muscles experience differing rates of muscle loss with ageing, and the genetic influence on different muscle groups may vary. It is plausible, therefore, that if axial muscle groups, for example, were considered in the present study, the polygenic profiling may be different from what has been observed in the muscle size and related strength parameters of the selected appendicular muscles in the current study. Our study shows that a regression model that includes GPS and age could explain up to 19% observed variance for HGS in the present older women.
The GPSDD model used in the present study is similar to that of previous studies that investigated the genetic influence on peak VO2 [28]; muscle size, muscle strength, and trainability [14]; VO2 max training response [37]; and knee extension strength [27,29] in different groups and populations. The variance explained by GPS and age for the skeletal muscle phenotypes in the present study was, however, lower than that observed previously in people ranging from 19 to 73 years of age (for instance, 42.3% variance was explained for knee extension [27]). It should be noted that, apart from the GPS, age was the only additional independent variable used in the present study, while a previous study included age, sex, energy expenditure during sports, and protein intake [27]. In the current study, HIF1A rs11549465 was associated with most of the phenotypes, which could be possibly explained by the biological role of HIF1 protein, specifically affecting the transcriptional level of genes involved in cellular proliferation [38]. Overall, the SNPs associated with skeletal muscle phenotypes in the present study are consistent with previous studies showing associations with similar muscle size, strength, and other performance-related phenotypes [39,40,41,42,43,44,45,46,47,48,49,50,51,52,53].

Limitations

The GPSDD did not consider the possibility that some of the heterozygotes may show complete dominance or over-dominance, because more data regarding each SNP are required to make that refinement. Moreover, the GPS we utilised attributed equal explanatory weight to every SNP, which is unlikely to be accurate—again, more data are required to be able to adjust this accordingly. Furthermore, the analysis did not directly consider potential gene–gene interactions, although the regression approach we used should exclude a SNP if its association with a phenotype is not independent from other such SNP-phenotype associations in the model. In addition, the GPS was constructed and applied to the same dataset, and cross-validation of the observed results is required in another independent older population to evaluate the true (probably lower) proportion of variability explained. The polygenic models used in the current study were based on the selection of SNPs from our previous data [30,31] and the most relevant extant data at the time of analysis [10,54,55]. As with the nature of genotype–phenotype association studies, new candidate genes and SNPS are identified regularly, such that recent research [56,57] have identified new SNPs (e.g., VCAN [58]) and some of the same candidate genes that we have chosen (e.g., FTO) in the present study, that would form the basis of future genotype–phenotype association studies. The validity of the novel associations identified in our present polygenic models remains valid, with the potential for stronger associations to be found in future research as more candidate genes are identified.

5. Conclusions

Although there was no difference in GPSTOTAL between the low and high muscle mass group, the GPSDD model explained up to 19% of the observed muscle phenotype variance, in older women. We conclude that there is a polygenic association with skeletal muscle phenotypes, which needs further investigation, and may help in targeting appropriate interventions for the maintenance of muscle function and thus independence among older adults.

Supplementary Materials

The following supporting information can be downloaded at https://www.mdpi.com/article/10.3390/genes13060982/s1. Table S1: Previous associations of single nucleotide polymorphisms with body composition/muscle-related phenotypes/performance (references [59,60,61,62,63,64,65,66,67,68,69,70,71,72,73,74,75,76,77,78,79,80,81,82,83,84] are cited in Supplementary Materials).

Author Contributions

Conceptualisation, P.K., H.D., G.K.S., G.L.O.-P., A.G.W., M.T. and C.I.M.; data curation, P.K. and L.H.; formal analysis, P.K., L.H., G.L.O.-P., A.G.W., M.T. and C.I.M.; funding acquisition, H.D., G.K.S., G.L.O.-P., A.G.W., M.T. and C.I.M.; investigation, P.K., L.H. and A.J.H.; methodology, P.K., L.H. and A.J.H.; supervision, H.D., G.K.S., G.L.O.-P., A.G.W., M.T. and C.I.M.; visualisation, H.D. and G.K.S.; writing—original draft, P.K., C.I.M. and G.K.S.; writing—review and editing, L.H., G.K.S., G.L.O.-P., A.G.W., M.T. and C.I.M. All authors have read and agreed to the published version of the manuscript.

Funding

The current study was funded by the European Commission through MOVE-AGE, an Erasmus Mundus Joint Doctorate program (2011-0015) for Praval Khanal, with the project titled “The genetics of sarcopenia”.

Institutional Review Board Statement

The study was conducted according to the guidelines of the Declaration of Helsinki and approved by the Ethics Committee of Manchester Metropolitan University (approval number: 09.02.16(i)).

Informed Consent Statement

Informed consent was obtained from all subjects involved in the study.

Data Availability Statement

The data used in the present study are available from reasonable request from corresponding author.

Acknowledgments

We would like to thank the European Commission, MOVE-AGE program for providing grants as a part of Erasmus Mundus Joint Doctorate programme (2011-0015) for conducting this study. We also like to thank all the volunteers who participated in this study.

Conflicts of Interest

The authors declare that they have no conflict of interest. The present study forms the part of main author’s (P.K) thesis submitted at Manchester Metropolitan University, UK, and KU Leuven, Belgium, for the fulfilment of joint doctorate degree, with the thesis entitled “The genetics of sarcopenia and skeletal muscle phenotypes in elderly Caucasian women”.

References

  1. Prior, S.J.; Roth, S.M.; Wang, X.; Kammerer, C.; Miljkovic-Gacic, I.; Bunker, C.H.; Wheeler, V.W.; Patrick, A.L.; Zmuda, J.M. Genetic and environmental influences on skeletal muscle phenotypes as a function of age and sex in large, multigenerational families of African heritage. J. Appl. Physiol. 2007, 103, 1121–1127. [Google Scholar] [CrossRef] [PubMed]
  2. Tiainen, K.; Sipila, S.; Alen, M.; Heikkinen, E.; Kaprio, J.; Koskenvuo, M.; Tolvanen, A.; Pajala, S.; Rantanen, T. Heritability of maximal isometric muscle strength in older female twins. J. Appl. Physiol. 2004, 96, 173–180. [Google Scholar] [CrossRef] [PubMed]
  3. Abney, M.; McPeek, M.S.; Ober, C. Broad and narrow heritabilities of quantitative traits in a founder population. Am. J. Hum. Genet. 2001, 68, 1302–1307. [Google Scholar] [CrossRef] [PubMed] [Green Version]
  4. Silventoinen, K.; Magnusson, P.K.; Tynelius, P.; Kaprio, J.; Rasmussen, F. Heritability of body size and muscle strength in young adulthood: A study of one million Swedish men. Genet. Epidemiol. 2008, 32, 341–349. [Google Scholar] [CrossRef]
  5. Thomis, M.; Beunen, G.; Leemputte, M.V.; Maes, H.; Blimkie, C.; Claessens, A.; Marchal, G.; Willems, E.; Vlietinck, R. Inheritance of static and dynamic arm strength and some of its determinants. Acta Physiol. Scand. 1998, 163, 59–71. [Google Scholar] [CrossRef]
  6. Bray, M.S.; Hagberg, J.M.; Perusse, L.; Rankinen, T.; Roth, S.M.; Wolfarth, B.; Bouchard, C. The human gene map for performance and health-related fitness phenotypes: The 2006–2007 update. Med. Sci. Sports Exerc. 2009, 41, 34–72. [Google Scholar] [CrossRef]
  7. Beenakker, K.G.; Koopman, J.J.; van Bodegom, D.; Kuningas, M.; Slagboom, P.E.; Meij, J.J.; Maier, A.B.; Westendorp, R.G. Variants of the IL-10 gene associate with muscle strength in elderly from rural Africa: A candidate gene study. Aging Cell 2014, 13, 862–868. [Google Scholar] [CrossRef] [Green Version]
  8. Cao, Y.; Zhang, Q.; Chen, J.; Li, Z.; Zhou, Z.; Shen, J.; Wang, D.; Pan, D.; Wang, Z.; Ke, D. Polymorphism of the PPARD Gene and Dynamic Balance Performance in Han Chinese Children. Hereditas 2019, 156, 15. [Google Scholar] [CrossRef]
  9. Klimentidis, Y.C.; Bea, J.W.; Thompson, P.; Klimecki, W.T.; Hu, C.; Wu, G.; Nicholas, S.; Ryckman, K.K.; Chen, Z. Genetic variant in ACVR2B is associated with lean mass. Med. Sci. Sports Exerc. 2016, 48, 1270. [Google Scholar] [CrossRef] [Green Version]
  10. Tan, L.-J.; Liu, S.-L.; Lei, S.-F.; Papasian, C.J.; Deng, H.-W. Molecular genetic studies of gene identification for sarcopenia. Hum. Genet. 2012, 131, 1–31. [Google Scholar] [CrossRef]
  11. Loos, R.J.F.; Hagberg, J.M.; Pérusse, L.; Roth, S.M.; Sarzynski, M.A.; Wolfarth, B.; Rankinen, T.; Bouchard, C. Advances in exercise, fitness, and performance genomics in 2014. Med. Sci. Sports Exerc. 2015, 47, 1105. [Google Scholar] [CrossRef] [PubMed] [Green Version]
  12. Stebbings, G.K.; Morse, C.I.; Williams, A.G.; Day, S.H. Variability and distribution of muscle strength and its determinants in humans. Muscle Nerve 2014, 49, 879–886. [Google Scholar] [CrossRef] [PubMed]
  13. Walsh, S.; Liu, D.; Metter, E.J.; Ferrucci, L.; Roth, S.M. ACTN3 genotype is associated with muscle phenotypes in women across the adult age span. J. Appl. Physiol. 2008, 105, 1486–1491. [Google Scholar] [CrossRef] [PubMed]
  14. Thomaes, T.; Thomis, M.; Onkelinx, S.; Goetschalckx, K.; Fagard, R.; Lambrechts, D.; Vanhees, L. Genetic predisposition scores associate with muscular strength, size, and trainability. Med. Sci. Sports Exerc. 2013, 45, 1451–1459. [Google Scholar] [CrossRef] [Green Version]
  15. Degens, H.; Korhonen, M.T. Factors contributing to the variability in muscle ageing. Maturitas 2012, 73, 197–201. [Google Scholar] [CrossRef]
  16. Leveille, S.G.; Penninx, B.; Melzer, D.; Izmirlian, G.; Guralnik, J.M. Sex differences in the prevalence of mobility disability in old age: The dynamics of incidence, recovery, and mortality. J. Gerontol. Ser. B 2000, 55, S41–S50. [Google Scholar]
  17. Sallinen, J.; Stenholm, S.; Rantanen, T.; Heliövaara, M.; Sainio, P.; Koskinen, S. Hand-grip strength cut points to screen older persons at risk for mobility limitation. J. Am. Geriatr. Soc. 2010, 58, 1721–1726. [Google Scholar] [CrossRef] [Green Version]
  18. Kerr, A.; Syddall, H.; Cooper, C.; Turner, G.; Briggs, R.; Sayer, A.A. Does admission grip strength predict length of stay in hospitalised older patients? Age Ageing 2006, 35, 82–84. [Google Scholar] [CrossRef] [Green Version]
  19. García-Hermoso, A.; Cavero-Redondo, I.; Ramírez-Vélez, R.; Ruiz, J.R.; Ortega, F.B.; Lee, D.-C.; Martínez-Vizcaíno, V. Muscular strength as a predictor of all-cause mortality in an apparently healthy population: A systematic review and meta-analysis of data from approximately 2 million men and women. Arch. Phys. Med. Rehabil. 2018, 99, 2100–2113.e2105. [Google Scholar] [CrossRef]
  20. Janssen, I.; Heymsfield, S.B.; Ross, R. Low relative skeletal muscle mass (sarcopenia) in older persons is associated with functional impairment and physical disability. J. Am. Geriatr. Soc. 2002, 50, 889–896. [Google Scholar] [CrossRef] [Green Version]
  21. Janssen, I.; Baumgartner, R.N.; Ross, R.; Rosenberg, I.H.; Roubenoff, R. Skeletal muscle cutpoints associated with elevated physical disability risk in older men and women. Am. J. Epidemiol. 2004, 159, 413–421. [Google Scholar] [CrossRef] [PubMed]
  22. Williams, A.G.; Folland, J.P. Similarity of polygenic profiles limits the potential for elite human physical performance. J. Physiol. 2008, 586, 113–121. [Google Scholar] [CrossRef] [PubMed] [Green Version]
  23. Santiago, C.; Ruiz, J.R.; Muniesa, C.A.; González-Freire, M.; Gómez-Gallego, F.; Lucia, A. Does the polygenic profile determine the potential for becoming a world-class athlete? Insights from the sport of rowing. Scand. J. Med. Sci. Sports 2010, 20, e188–e194. [Google Scholar] [CrossRef] [PubMed]
  24. Ruiz, J.R.; Gómez-Gallego, F.; Santiago, C.; González-Freire, M.; Verde, Z.; Foster, C.; Lucia, A. Is there an optimum endurance polygenic profile? J. Physiol. 2009, 587, 1527–1534. [Google Scholar] [CrossRef]
  25. Massidda, M.; Scorcu, M.; Calò, C.M. New genetic model for predicting phenotype traits in sports. Int. J. Sports Physiol. Perform. 2014, 9, 554–560. [Google Scholar] [CrossRef]
  26. Drozdovska, S.; Dosenko, V.; Ahmetov, I.; Ilyin, V. The association of gene polymorphisms with athlete status in Ukrainians. Biol. Sport 2013, 30, 163. [Google Scholar] [CrossRef] [Green Version]
  27. Charlier, R.; Caspers, M.; Knaeps, S.; Mertens, E.; Lambrechts, D.; Lefevre, J.; Thomis, M. Limited potential of genetic predisposition scores to predict muscle mass and strength performance in Flemish Caucasians between 19 and 73 years of age. Physiol. Genom. 2016, 49, 160–166. [Google Scholar] [CrossRef] [Green Version]
  28. Thomaes, T.; Thomis, M.; Onkelinx, S.; Fagard, R.; Matthijs, G.; Buys, R.; Schepers, D.; Cornelissen, V.; Vanhees, L. A genetic predisposition score for muscular endophenotypes predicts the increase in aerobic power after training: The CAREGENE study. BMC Genet. 2011, 12, 84. [Google Scholar] [CrossRef] [Green Version]
  29. He, L.; Van Roie, E.; Bogaerts, A.; Morse, C.I.; Delecluse, C.; Verschueren, S.; Thomis, M. Genetic predisposition score predicts the increases of knee strength and muscle mass after one-year exercise in healthy elderly. Exp. Gerontol. 2018, 111, 17–26. [Google Scholar] [CrossRef] [Green Version]
  30. Khanal, P.; He, L.; Herbert, A.J.; Stebbings, G.K.; Onambele-Pearson, G.L.; Degens, H.; Morse, C.I.; Thomis, M.; Williams, A.G. The Association of Multiple Gene Variants with Ageing Skeletal Muscle Phenotypes in Elderly Women. Genes 2020, 11, 1459. [Google Scholar] [CrossRef]
  31. Khanal, P.; He, L.; Stebbings, G.; Onambele-Pearson, G.L.; Degens, H.; Williams, A.; Thomis, M.; Morse, C.I. Prevalence and association of single nucleotide polymorphisms with sarcopenia in older women depends on definition. Sci. Rep. 2020, 10, 2913. [Google Scholar] [CrossRef] [PubMed] [Green Version]
  32. Janssen, I.; Heymsfield, S.B.; Baumgartner, R.N.; Ross, R. Estimation of skeletal muscle mass by bioelectrical impedance analysis. J. Appl. Physiol. 2000, 89, 465–471. [Google Scholar] [CrossRef] [PubMed] [Green Version]
  33. He, L.; Khanal, P.; Morse, C.I.; Williams, A.; Thomis, M. Associations of combined genetic and epigenetic scores with muscle size and muscle strength: A pilot study in older women. J. Cachexia Sarcopenia Muscle 2020, 11, 1548–1561. [Google Scholar] [CrossRef] [PubMed]
  34. Villafañe, J.H.; Valdes, K.; Buraschi, R.; Martinelli, M.; Bissolotti, L.; Negrini, S. Reliability of the handgrip strength test in elderly subjects with Parkinson disease. Hand 2016, 11, 54–58. [Google Scholar] [CrossRef] [Green Version]
  35. Tintle, N.; Gordon, D.; Van Bruggen, D.; Finch, S. The cost effectiveness of duplicate genotyping for testing genetic association. Ann. Hum. Genet. 2009, 73, 370–378. [Google Scholar] [CrossRef]
  36. Yvert, T.; Miyamoto-Mikami, E.; Murakami, H.; Miyachi, M.; Kawahara, T.; Fuku, N. Lack of replication of associations between multiple genetic polymorphisms and endurance athlete status in Japanese population. Physiol. Rep. 2016, 4, e13003. [Google Scholar] [CrossRef]
  37. Bouchard, C.; Sarzynski, M.A.; Rice, T.K.; Kraus, W.E.; Church, T.S.; Sung, Y.J.; Rao, D.C.; Rankinen, T. Genomic predictors of the maximal O2 uptake response to standardized exercise training programs. J. Appl. Physiol. 2010, 110, 1160–1170. [Google Scholar] [CrossRef] [Green Version]
  38. Lee, J.-W.; Bae, S.-H.; Jeong, J.-W.; Kim, S.-H.; Kim, K.-W. Hypoxia-inducible factor (HIF-1) α: Its protein stability and biological functions. Exp. Mol. Med. 2004, 36, 1–12. [Google Scholar] [CrossRef]
  39. Stebbings, G.K.; Williams, A.G.; Morse, C.I.; Day, S.H. Polymorphisms in PTK2 are associated with skeletal muscle specific force: An independent replication study. Eur. J. Appl. Physiol. 2017, 117, 713–720. [Google Scholar] [CrossRef] [Green Version]
  40. Erskine, R.M.; Williams, A.G.; Jones, D.A.; Stewart, C.E.; Degens, H. Do PTK2 gene polymorphisms contribute to the interindividual variability in muscle strength and the response to resistance training? A preliminary report. J. Appl. Physiol. 2012, 112, 1329–1334. [Google Scholar] [CrossRef] [Green Version]
  41. Frayling, T.M.; Timpson, N.J.; Weedon, M.N.; Zeggini, E.; Freathy, R.M.; Lindgren, C.M.; Perry, J.R.B.; Elliott, K.S.; Lango, H.; Rayner, N.W. A common variant in the FTO gene is associated with body mass index and predisposes to childhood and adult obesity. Science 2007, 316, 889–894. [Google Scholar] [CrossRef] [PubMed] [Green Version]
  42. Livingstone, K.M.; Celis-Morales, C.; Papandonatos, G.D.; Erar, B.; Florez, J.C.; Jablonski, K.A.; Razquin, C.; Marti, A.; Heianza, Y.; Huang, T. FTO genotype and weight loss: Systematic review and meta-analysis of 9563 individual participant data from eight randomised controlled trials. BMJ 2016, 354, i4707. [Google Scholar] [CrossRef] [PubMed] [Green Version]
  43. Al-Serri, A.; Al-Bustan, S.A.; Kamkar, M.; Thomas, D.; Alsmadi, O.; Al-Temaimi, R.; Mojiminiyi, O.A.; Abdella, N.A. Association of FTO rs9939609 with Obesity in the Kuwaiti Population: A Public Health Concern? Med. Princ. Pract. 2018, 27, 145–151. [Google Scholar] [CrossRef] [PubMed] [Green Version]
  44. Sonestedt, E.; Gullberg, B.; Ericson, U.; Wirfält, E.; Hedblad, B.; Orho-Melander, M. Association between fat intake, physical activity and mortality depending on genetic variation in FTO. Int. J. Obes. 2011, 35, 1041. [Google Scholar] [CrossRef] [PubMed] [Green Version]
  45. Livshits, G.; Malkin, I.; Moayyeri, A.; Spector, T.D.; Hammond, C.J. Association of FTO gene variants with body composition in UK twins. Ann. Hum. Genet. 2012, 76, 333–341. [Google Scholar] [CrossRef] [PubMed] [Green Version]
  46. Roth, S.M.; Schrager, M.A.; Ferrell, R.E.; Riechman, S.E.; Metter, E.J.; Lynch, N.A.; Lindle, R.S.; Hurley, B.F. CNTF genotype is associated with muscular strength and quality in humans across the adult age span. J. Appl. Physiol. 2001, 90, 1205–1210. [Google Scholar] [CrossRef] [PubMed] [Green Version]
  47. Walsh, S.; Kelsey, B.K.; Angelopoulos, T.J.; Clarkson, P.M.; Gordon, P.M.; Moyna, N.M.; Visich, P.S.; Zoeller, R.F.; Seip, R.L.; Bilbie, S. CNTF 1357 G→ A polymorphism and the muscle strength response to resistance training. J. Appl. Physiol. 2009, 107, 1235–1240. [Google Scholar] [CrossRef]
  48. Arking, D.E.; Fallin, D.M.; Fried, L.P.; Li, T.; Beamer, B.A.; Xue, Q.L.; Chakravarti, A.; Walston, J. Variation in the ciliary neurotrophic factor gene and muscle strength in older Caucasian women. J. Am. Geriatr. Soc. 2006, 54, 823–826. [Google Scholar] [CrossRef]
  49. De Mars, G.; Windelinckx, A.; Beunen, G.; Delecluse, C.; Lefevre, J.; Thomis, M.A.I. Polymorphisms in the CNTF and CNTF receptor genes are associated with muscle strength in men and women. J. Appl. Physiol. 2007, 102, 1824–1831. [Google Scholar] [CrossRef] [Green Version]
  50. Liu, X.-G.; Tan, L.-J.; Lei, S.-F.; Liu, Y.-J.; Shen, H.; Wang, L.; Yan, H.; Guo, Y.-F.; Xiong, D.-H.; Chen, X.-D. Genome-wide association and replication studies identified TRHR as an important gene for lean body mass. Am. J. Hum. Genet. 2009, 84, 418–423. [Google Scholar] [CrossRef] [Green Version]
  51. Kostek, M.A.; Angelopoulos, T.J.; Clarkson, P.M.; Gordon, P.M.; Moyna, N.M.; Visich, P.S.; Zoeller, R.F.; Price, T.B.; Seip, R.L.; Thompson, P.D. Myostatin and follistatin polymorphisms interact with muscle phenotypes and ethnicity. Med. Sci. Sports Exerc. 2009, 41, 1063. [Google Scholar] [CrossRef] [Green Version]
  52. Santiago, C.; Ruiz, J.R.; Rodríguez-Romo, G.; Fiuza-Luces, C.; Yvert, T.; Gonzalez-Freire, M.; Gómez-Gallego, F.; Morán, M.; Lucia, A. The K153R polymorphism in the myostatin gene and muscle power phenotypes in young, non-athletic men. PLoS ONE 2011, 6, e16323. [Google Scholar] [CrossRef] [PubMed]
  53. Seibert, M.J.; Xue, Q.L.; Fried, L.P.; Walston, J.D. Polymorphic variation in the human myostatin (GDF-8) gene and association with strength measures in the Women’s Health and Aging Study II cohort. J. Am. Geriatr. Soc. 2001, 49, 1093–1096. [Google Scholar] [CrossRef] [PubMed]
  54. Stebbings, G.; Williams, A.; Herbert, A.J.; Lockey, S.; Heffernan, S.; Erskine, R.; Morse, C.; Day, S. TTN genotype is associated with fascicle length and marathon running performance. Scand. J. Med. Sci. Sports 2018, 28, 400–406. [Google Scholar] [CrossRef] [PubMed]
  55. Heffernan, S.M.; Stebbings, G.; Kilduff, L.P.; Erskine, R.; Day, S.H.; Morse, C.; McPhee, J.; Cook, C.; Vance, B.; Ribbans, W.J. Fat mass and obesity associated (FTO) gene influences skeletal muscle phenotypes in non-resistance trained males and elite rugby playing position. BMC Genet. 2017, 18, 4. [Google Scholar] [CrossRef] [Green Version]
  56. Ahisar, Y.; Thanassoulis, G.; Huang, K.; Ohayon, S.; Afilalo, J. Intersecting Genetics of Frailty and Cardiovascular Disease. J. Nutr. Health Aging 2021, 25, 1023–1027. [Google Scholar] [CrossRef]
  57. Cordero, A.I.H.; Gonzales, N.M.; Parker, C.C.; Sokolof, G.; Vandenbergh, D.J.; Cheng, R.; Abney, M.; Sko, A.; Douglas, A.; Palmer, A.A. Genome-wide associations reveal human-mouse genetic convergence and modifiers of myogenesis, CPNE1 and STC2. Am. J. Hum. Genet. 2019, 105, 1222–1236. [Google Scholar] [CrossRef] [Green Version]
  58. Karasik, D.; Zillikens, M.C.; Hsu, Y.-H.; Aghdassi, A.; Akesson, K.; Amin, N.; Barroso, I.; Bennett, D.A.; Bertram, L.; Bochud, M. Disentangling the genetics of lean mass. Am. J. Clin. Nutr. 2019, 109, 276–287. [Google Scholar] [CrossRef]
  59. Ahmetov, I.I.; Hakimullina, A.M.; Lyubaeva, E.V.; Vinogradova, O.L.; Rogozkin, V.A. Effect of HIF1A gene polymorphism on human muscle performance. Bull. Exp. Biol. Med. 2008, 146, 351–353. [Google Scholar] [CrossRef]
  60. Cenikli, A.; Nursal, A.; Tural, E.; Polat, Y.; Tasmektepligil, M.; Yigit, S. The Correlation Between Rs1800795 Variant of IL-6 and sports performance among turkish elite athletes. Int. J. Humanit. Soc. Sci. Educ. 2016, 3, 1–5. [Google Scholar]
  61. Charbonneau, D.E.; Hanson, E.D.; Ludlow, A.T.; Delmonico, M.J.; Hurley, B.F.; Roth, S.M. ACE genotype and the muscle hypertrophic and strength responses to strength training. Med. Sci. Sports Exerc. 2008, 40, 677. [Google Scholar] [CrossRef] [PubMed] [Green Version]
  62. Chen, W.; Zhang, B.; Li, Y.; Liang, T. Association Between rs1815739 Polymorphism of ACTN3 Gene and Athletic Ability in Chinese Sprinters. J. Sci. Sport Exerc. 2020, 2, 113–119. [Google Scholar] [CrossRef] [Green Version]
  63. Cho, J.; Lee, I.; Kang, H. ACTN3 gene and susceptibility to sarcopenia and osteoporotic status in older Korean adults. BioMed Res. Int. 2017, 2017, 4239648. [Google Scholar] [CrossRef] [PubMed]
  64. Cięszczyk, P.; Zarębska, A.; Jastrzębski, Z.; Sawczyn, M.; Kozakiewicz-Drobnik, I.; Leońska-Duniec, A.; Kaczmarczyk, M.; Maciejewska-Skrendo, A.; Żmijewski, P.; Trybek, G. Does the MTHFR A1298C Polymorphism Modulate the Cardiorespiratory Response to Training? J. Hum. Kinet. 2016, 54, 43–53. [Google Scholar] [CrossRef] [Green Version]
  65. Corsi, A.M.; Ferrucci, L.; Gozzini, A.; Tanini, A.; Brandi, M.L. Myostatin polymorphisms and age-related sarcopenia in the Italian population. J. Am. Geriatr. Soc. 2002, 50, 1463. [Google Scholar] [CrossRef]
  66. Eider, J.; Ficek, K.; Kaczmarczyk, M.; Maciejewska-Karłowska, A.; Sawczuk, M.; Cięszczyk, P. Endothelial nitric oxide synthase g894t (rs1799983) gene polymorphism in polish athletes. Open Life Sci. 2014, 9, 260–267. [Google Scholar] [CrossRef]
  67. Gómez-Gallego, F.; Ruiz, J.R.; Buxens, A.; Artieda, M.; Arteta, D.; Santiago, C.; Rodríguez-Romo, G.; Lao, J.I.; Lucia, A. The− 786 T/C polymorphism of the NOS3 gene is associated with elite performance in power sports. Eur. J. Appl. Physiol. 2009, 107, 565–569. [Google Scholar] [CrossRef]
  68. González-Freire, M.; Rodríguez-Romo, G.; Santiago, C.; Bustamante-Ara, N.; Yvert, T.; Gómez-Gallego, F.; Rexach, J.A.S.; Ruiz, J.R.; Lucia, A. The K153R variant in the myostatin gene and sarcopenia at the end of the human lifespan. Age 2010, 32, 405–409. [Google Scholar] [CrossRef] [Green Version]
  69. Hand, B.D.; Mccole, S.D.; Brown, M.D.; Park, J.J.; Ferrell, R.E.; Huberty, A.; Douglass, L.W.; Hagberg, J.M. NOS3 gene polymorphisms and exercise hemodynamics in postmenopausal women. Int. J. Sports Med. 2006, 27, 951–958. [Google Scholar] [CrossRef]
  70. Hopkinson, N.S.; Li, K.W.; Kehoe, A.; Humphries, S.E.; Roughton, M.; Moxham, J.; Montgomery, H.; Polkey, M.I. Vitamin D receptor genotypes influence quadriceps strength in chronic obstructive pulmonary disease. Am. J. Clin. Nutr. 2008, 87, 385–390. [Google Scholar] [CrossRef] [Green Version]
  71. Kostek, M.C.; Devaney, J.M.; Gordish-Dressman, H.; Harris, T.B.; Thompson, P.D.; Clarkson, P.M.; Angelopoulos, T.J.; Gordon, P.M.; Moyna, N.M.; Pescatello, L.S. A polymorphism near IGF1 is associated with body composition and muscle function in women from the Health, Aging, and Body Composition Study. Eur. J. Appl. Physiol. 2010, 110, 315–324. [Google Scholar] [CrossRef] [PubMed] [Green Version]
  72. Lunardi, C.C.; Lima, R.M.; Pereira, R.W.; Leite, T.K.M.; Siqueira, A.B.M.; Oliveira, R.J. Association between polymorphisms in the TRHR gene, fat-free mass, and muscle strength in older women. Age 2013, 35, 2477–2483. [Google Scholar] [CrossRef] [PubMed] [Green Version]
  73. Prior, S.J.; Hagberg, J.M.; Phares, D.A.; Brown, M.D.; Fairfull, L.; Ferrell, R.E.; Roth, S.M. Sequence variation in hypoxia-inducible factor 1α (HIF1A): Association with maximal oxygen consumption. Physiol. Genom. 2003, 15, 20–26. [Google Scholar] [CrossRef] [PubMed] [Green Version]
  74. Roth, S.M.; Zmuda, J.M.; Cauley, J.A.; Shea, P.R.; Ferrell, R.E. Vitamin D receptor genotype is associated with fat-free mass and sarcopenia in elderly men. J. Gerontol. Ser. A Biol. Sci. Med. Sci. 2004, 59, B10–B15. [Google Scholar] [CrossRef] [Green Version]
  75. Ruiz, J.R.; Buxens, A.; Artieda, M.; Arteta, D.; Santiago, C.; Rodríguez-Romo, G.; Lao, J.I.; Gómez-Gallego, F.; Lucia, A. The −174 G/C polymorphism of the IL6 gene is associated with elite power performance. J. Sci. Med. Sport 2010, 13, 549–553. [Google Scholar] [CrossRef]
  76. Sessa, F.; Chetta, M.; Petito, A.; Franzetti, M.; Bafunno, V.; Pisanelli, D.; Sarno, M.; Iuso, S.; Margaglione, M. Gene polymorphisms and sport attitude in Italian athletes. Genet. Test. Mol. Biomark. 2011, 15, 285–290. [Google Scholar] [CrossRef]
  77. Svendstrup, M.; Appel, E.V.R.; Sandholt, C.H.; Ahluwalia, T.S.; Ängquist, L.H.; Thuesen, B.H.; Jørgensen, M.E.; Pedersen, O.; Grarup, N.; Hansen, T. Prospective studies exploring the possible impact of an ID3 polymorphism on changes in obesity measures. Obesity 2018, 26, 747–754. [Google Scholar] [CrossRef] [Green Version]
  78. Van Pottelbergh, I.; Goemaere, S.; Nuytinck, L.; De Paepe, A.; Kaufman, J.M. Association of the type I collagen alpha1 Sp1 polymorphism, bone density and upper limb muscle strength in community-dwelling elderly men. Osteoporos. Int. 2001, 12, 895–901. [Google Scholar] [CrossRef]
  79. Voisin, S.; Guilherme, J.P.F.L.; Yan, X.; Pushkarev, V.P.; Cieszczyk, P.; Massidda, M.; Calò, C.M.; Dyatlov, D.A.; Kolupaev, V.A.; Pushkareva, Y.E. ACVR1B rs2854464 is associated with sprint/power athletic status in a large cohort of Europeans but not Brazilians. PLoS ONE. 2016, 11, e0156316. [Google Scholar] [CrossRef] [Green Version]
  80. Windelinckx, A.; De Mars, G.; Beunen, G.; Aerssens, J.; Delecluse, C.; Lefevre, J.; Thomis, M.A.I. Polymorphisms in the vitamin D receptor gene are associated with muscle strength in men and women. Osteoporos. Int. 2007, 18, 1235–1242. [Google Scholar] [CrossRef]
  81. Windelinckx, A.; De Mars, G.; Huygens, W.; Peeters, M.W.; Vincent, B.; Wijmenga, C.; Lambrechts, D.; Delecluse, C.; Roth, S.M.; Metter, E.J. Comprehensive fine mapping of chr12q12-14 and follow-up replication identify activin receptor 1B (ACVR1B) as a muscle strength gene. Eur. J. Hum. Genet. 2011, 19, 208. [Google Scholar] [CrossRef] [PubMed]
  82. Zarebska, A.; Ahmetov, I.I.; Sawczyn, S.; Weiner, A.S.; Kaczmarczyk, M.; Ficek, K.; Maciejewska-Karlowska, A.; Sawczuk, M.; Leonska-Duniec, A.; Klocek, T. Association of the MTHFR 1298A> C (rs1801131) polymorphism with speed and strength sports in Russian and Polish athletes. J. Sports Sci. 2014, 32, 375–382. [Google Scholar] [CrossRef] [PubMed]
  83. Zempo, H.; Tanabe, K.; Murakami, H.; Iemitsu, M.; Maeda, S.; Kuno, S. ACTN3 polymorphism affects thigh muscle area. Int. J. Sports Med. 2010, 31, 138–142. [Google Scholar] [CrossRef] [PubMed] [Green Version]
  84. Zmijewski, P.; Cieszczyk, P.; Ahmetov, I.I. The NOS3 G894T (rs1799983) and-786T/C (rs2070744) polymorphisms are associated with elite swimmer status. Biol. Sport 2018, 35, 313–319. [Google Scholar] [CrossRef]
Figure 1. Genetic predisposition score and muscle-related phenotype measures. Participant frequency distribution (bars) and GPS (line) for (A) biceps brachii thickness, (B) VLACSA (vastus lateralis anatomical cross-sectional area), (C) HGS (hand grip strength), (D) MVCEF (elbow flexion maximum voluntary contraction), and (E) MVCKE (knee extension maximum voluntary contraction). Dot and error bar represent mean and standard error of the mean, respectively.
Genes 13 00982 g001
Table 1. Characteristics of all participants and according to pre-sarcopenia grouping.
SMI Threshold %SMMr Threshold
All
(n = 300)
Low
(n = 181)
High
(n = 119)
Low
(n = 41)
High
(n = 259)
Age (years)70.7 ± 5.771.0 ± 5.270.3 ± 6.371.8 ± 5.870.6 ± 5.6
Body mass (kg)66.3 ± 11.363.3 ± 9.270.8 ± 12.677.6 ± 13.3 *64.5 ± 9.8
Height (kg/m2)1.60 ± 0.061.60 ± 0.061.59 ± 0.051.60 ± 0.051.60 ± 0.06
BMI (kg/m2)25.9 ± 4.224.6 ± 3.2 *27.8 ± 4.630.3 ± 5.5 *25.2 ± 3.4
SMI (kg/m2)6.56 ± 0.826.04 ± 0.51 *7.34 ± 0.536.01 ± 0.95 *6.64 ± 0.76
%SMMr25.7 ± 3.824.9 ± 3.326.9 ± 4.220.0 ± 1.326.6 ± 3.3
BB thickness (cm)1.77 ± 0.321.73 ± 0.32 *1.82 ± 0.311.85 ± 0.361.76 ± 0.31
VLACSA (cm2)16.3 ± 3.415.4 ± 3.1 *17.6 ± 3.316.9 ± 3.916.2 ± 3.3
HGS (kg)30.0 ± 5.029.2 ± 4.3 *31.1 ± 5.628.7 ± 4.930.2 ± 5.0
MVCEF (N·m)24.8 ± 5.823.8 ± 5.5 *26.3 ± 6.023.3 ± 5.025.0 ± 5.9
MVCKE (N·m)55.2 ± 18.353.2 ± 17.3 *58.2 ± 19.349.7 ± 19.3 *56.0 ± 18.0
GPSTOTAL21.5 ± 2.821.5 ± 2.721.5 ± 2.921.0 ± 2.421.6 ± 2.8
Abbreviations: BMI, body mass index; SMI, skeletal muscle index; BB, biceps brachii; VLACSA, vastus lateralis anatomical cross-sectional area; HGS, hand grip strength; MVCEF, isometric elbow flexion maximum voluntary contraction; MVCKE, isometric knee extension maximum voluntary contraction; GPSTOTAL, Total Genotype Predisposition Score. Values are mean ± SD. * indicates the significant difference from high muscle mass group.
Table 2. Regression models for GPSDD and skeletal muscle phenotypes including age as an independent variable.
Phenotypes GPSDDAgeAdj r2Associated SNPs (Predisposing Allele)
Biceps brachii thickness (cm)estimate0.101−0.003 HIF1A rs11549465 (T), MSTN rs1805086 (T)
β value0.146−0.0581.7%
partial r0.146−0.058
p0.0140.327
VLACSA (cm2)estimate0.710−0.172 FTO rs9939609 (A), HIF1A rs11549465 (T), TRHR rs7832552 (T), CNTFR rs2070802 (T)
β value0.251−0.28712.5%
partial r0.258−0.293
p<0.001<0.001
HGS (kg)estimate0.685−0.323 MTHFR rs17421511 (A), HIF1A rs11549465 (T), MTHFR rs1537516 (A), ACE rs4341 (G), COL1A1 rs1800012 (A), PTK2 rs7460 (A), CNTFR rs2070802 (T), ACVR1B rs10783485 (G), MTHFR rs1801131 (T)
β value0.260−0.36819.0%
partial r0.278−0.380
p<0.001<0.001
MVCEF (N·m)estimate1.066−0.220 HIF1A rs11549465 (T), ACE rs4341 (G), PTK2 rs7460 (A)
β value0.203−0.2138.2%
partial r0.208−0.218
p<0.001<0.001
MVCKE (N·m)estimate3.743−0.803 ACE rs4341 (G), CNTF rs1800169 (G)
β value0.172−0.2589.6%
partial r0.178−0.252
p0.002<0.001
Abbreviations: GPSDD, data-driven genotype predisposition score; VLACSA, vastus lateralis anatomical cross-sectional area; HGS, handgrip strength; MVCEF, maximum voluntary contraction—elbow flexion; MVCKE, maximum voluntary contraction—knee extension.
Publisher’s Note: MDPI stays neutral with regard to jurisdictional claims in published maps and institutional affiliations.

