Single-Nucleotide Polymorphisms Sequencing Identifies Candidate Functional Variants at Prostate Cancer Risk Loci


1
Department of Pathology, MCW Cancer Center, Medical College of Wisconsin, 8701 Watertown Plank Road, Milwaukee, WI 53226, USA
2
Department of Laboratory Medicine and Pathology, Mayo Clinic College of Medicine, 200 First Street SW, Rochester, MN 55905, USA
*
Author to whom correspondence should be addressed.
†
These authors contributed equally to this work.
‡
Current Address: Henan Key Laboratory for Esophageal Cancer Research, The First Affiliated Hospital of Zhengzhou University, 40 Daxue Road, Zhengzhou, Henan 450052, China.
Genes 2019, 10(7), 547; https://doi.org/10.3390/genes10070547
Submission received: 21 May 2019
/
Revised: 10 July 2019
/
Accepted: 16 July 2019
/
Published: 18 July 2019
(This article belongs to the Special Issue Prostate Cancer Genetics and the Emergence of Targeted Therapies Based on Molecular Profiling)
Abstract
:Genome-wide association studies have identified over 150 risk loci that increase prostate cancer risk. However, few causal variants and their regulatory mechanisms have been characterized. In this study, we utilized our previously developed single-nucleotide polymorphisms sequencing (SNPs-seq) technology to test allele-dependent protein binding at 903 SNP sites covering 28 genomic regions. All selected SNPs have shown significant cis-association with at least one nearby gene. After preparing nuclear extract using LNCaP cell line, we first mixed the extract with dsDNA oligo pool for protein–DNA binding incubation. We then performed sequencing analysis on protein-bound oligos. SNPs-seq analysis showed protein-binding differences (>1.5-fold) between reference and variant alleles in 380 (42%) of 903 SNPs with androgen treatment and 403 (45%) of 903 SNPs without treatment. From these significant SNPs, we performed a database search and further narrowed down to 74 promising SNPs. To validate this initial finding, we performed electrophoretic mobility shift assay in two SNPs (rs12246440 and rs7077275) at CTBP2 locus and one SNP (rs113082846) at NCOA4 locus. This analysis showed that all three SNPs demonstrated allele-dependent protein-binding differences that were consistent with the SNPs-seq. Finally, clinical association analysis of the two candidate genes showed that CTBP2 was upregulated, while NCOA4 was downregulated in prostate cancer (p < 0.02). Lower expression of CTBP2 was associated with poor recurrence-free survival in prostate cancer. Utilizing our experimental data along with bioinformatic tools provides a strategy for identifying candidate functional elements at prostate cancer susceptibility loci to help guide subsequent laboratory studies.
1. Introduction
Prostate cancer is the second most common cancer and the fifth leading cause of cancer death among men, with almost 1.3 million new cases and 359,000 associated deaths in 2018 worldwide [1]. Histological phenotypes of prostate cancer include adenocarcinoma, squamous cell carcinoma, and neuroendocrine carcinoma. Risk factors of prostate cancer involve age, genetics (family history and ethnicity), environmental and lifestyle (smoking and alcohol consumption), and gene–environment interaction [2,3,4].
To identify genetic determinants of prostate cancer risk, over 39 genome-wide association studies (GWAS) on prostate cancer have reported approximately 482 unique prostate cancer risk single-nucleotide polymorphisms (SNPs), based on the NHGRI-EBI catalogue of published GWASs (http://www.ebi.ac.uk/gwas) [5,6]. Importantly, a significant number of these reported SNPs have subsequently been validated in well-powered case–control studies. However, potential causal variants and their biological mechanisms at risk loci are largely unknown, even though many post-GWAS studies have unraveled new gene networks and signaling pathways associated with germline variants [7]. Because these risk SNPs have been found in noncoding regions of the genome, it is believed that many of these risk SNPs are located in regulatory domains of the genome that control gene expression rather than in coding regions that directly affect protein function [5,6,8].
To molecularly characterize these risk loci, causal SNPs and their target genes have to be identified [6,7]. Expression quantitative trait loci (eQTL) has been widely used to identify SNP–gene association [9]. Previously, we have established a 471 normal prostate tissue-specific eQTL dataset and examined 100 prostate cancer risk regions. We have identified 51 regions with significant eQTL signal that involved 88 genes [10]. Due to a large number of SNPs in each risk loci, however, high-throughput screening tools are needed to identify causal SNPs. Recently, we developed a high-throughput single-nucleotide polymorphisms sequencing (SNPs-seq) technology that takes advantage of the higher retention rate of protein-bound DNA oligos in protein purification system to quantitatively sequence SNP-containing oligos. We have applied the SNPs-seq to simultaneously screen 374 risk SNPs for their allele-dependent protein-binding differences [11]. In the new study, we performed more comprehensive SNPs-seq analysis that covered 903 SNPs at 28 prostate cancer risk loci.
2. Materials and Methods
2.1. Selection of Candidate SNPs
In our previous study [10], we identified 51 regions that showed significant eQTL signals in 88 genes. From the 51 regions with eQTL p value < 1.97 × 10⁻⁷, we extracted all SNPs within 2.2 Mb of these 88 genes and identified a total of 827,507 SNPs. We narrowed this down to 1274 SNPs from 28 regions (36 genes) with risk SNP LD > 0.5 and p value < 3.02 × 10⁻⁸ for further study. Based on our previous publication [11], we further excluded SNP sites with low GC content and finalized 903 SNPs for SNPs-seq analysis (Figure 1 shows workflow of candidate SNP selection, Table 1 shows distribution of SNPs in 28 regions, and Table S1 shows the list of 903 SNPs).
2.2. Cell Culture and Nuclear Extraction
We obtained the human prostate cancer cell line LNCaP from the American Type Culture Collection (Manassas, VA, USA). Cells were cultured in a 10 cm dish with RPMI-1640 containing 10% fetal bovine serum (FBS) and 1% penicillin/streptomycin (Thermo Fisher Scientific, Waltham, MA, USA). For androgen treatment, the medium was replaced by phenol red-free RPMI supplemented with 10% charcoal-stripped FBS (CS-FBS) to achieve deprivation of steroid hormones and growth factors. Twenty-four hours after hormone depletion, the cells were treated with 10 nM dihydrotestosterone (DHT) or 0.1% ethanol (ETH) for 48 hours. We extracted the nuclear protein using Ne-Per nuclear and cytoplasmic extraction reagents (Thermo Fisher Scientific). Protein concentrations were determined using Pierce BCA (bicinchoninic acid) protein assay kit (Thermo Fisher Scientific). The nuclear protein extracts were aliquoted at 25 μL each and stored at −80 °C until use.
2.3. SNPs-seq
For each selected candidate SNP, we synthesized 4 single-strand oligos (variant and reference allele, +/− strand) at 20 μM (21 bp/oligo, SNP in the middle) in 25 μL duplex buffer (Integrated DNA Technologies, Coralville, IA, USA). For oligo annealing, we mixed 10 μL of +/− strand oligos to one well and performed initial denaturation at 95 °C for 3 min, followed by gradual temperature decrease from 95 to 25 °C in 70 min. We pooled all ds-oligos by pipetting 2 μL of each ds-oligo.
For oligo–protein binding assay, we mixed 5 μL ds-oligos pool (~400 ng), 5 μL nuclear extract (~10 μg), and 15 μL binding buffer. After 30 min of incubation at room temperature (20–23 °C), the binding reaction mixtures were passed through the isolation column (Signosis, Santa Clara, CA, USA). After washing 4 times, the protein-bound oligos were collected in 60 μL elution buffer. The collected oligos were further purified using Oligo Clean kit (Zymo research, Irvine, CA, USA). Concentration of the purified oligos was determined using Qubit dsDNA HS Assay kit (Thermo Fisher Scientific). Two repeats were used in each experimental condition to ensure reproducibility and to minimize technical variability.
We prepared sequencing libraries using ThruPLEX DNA-seq kit (Takara Bio, Mountain View, CA, USA) with 2 ng purified eluted oligos. After 15-cycle amplification, the libraries were purified using SPRIselect reagent (Beckman Coulter Life Sciences, Indianapolis, IN, USA) and quantified by Qubit. The libraries were sequenced on Illumina HiSeq2500 with 50 bp single read. A total of 903 SNP sites with 1806 unique sequences were used as template. DNASTAR Genomic Suite was used for sequence mapping and read counting. Only perfect match was allowed during mapping. To determine the allelic protein-binding difference, we calculated the biased allelic binding (BAB) score using this formula: BAB = log2 [test(RCvariant/RCreference)/input(RCvariant/RCreference)]. The test and input represented tested (DHT/ETH) and input control samples, respectively. RCvariant/RCreference represents the ratio of read counts from variant allele and reference allele. The sequences data of SNPs-seq are available upon request.
2.4. Database Search for Potential Functional SNPs
We took advantage of several existing databases to identify potential functional SNPs. First, we searched Regulome DB [12] to identify DNA features and regulatory elements that intersected the coordinate of the SNPs. Then, we used HaploReg [13] to explore chromatin states, conservation, and regulatory motif alterations within sets of genetically linked variants. We also searched published ChIP-seq (chromatin immunoprecipitation sequencing) data for transcription factor (TF) binding at the SNPs [14,15]. Furthermore, we used SNPnexus [16] to screen ENCODE [17] and other datasets for functional annotation of the candidate SNPs. Moreover, we applied the Variant Effect Predictor (VEP) toolset to determine the effect of candidate SNPs on genes, transcripts, and protein sequence, as well as regulatory regions [18]. Lastly, we used MATCH [19] tool to find putative TF binding sites at the SNP sequences.
2.5. Electrophoretic Mobility Shift Assay (EMSA)
To validate the allelic protein-binding difference, we performed electrophoretic mobility shift assay (EMSA) using the LightShift Chemiluminescent EMSA kit (Thermo Fisher Scientific). All oligonucleotides were synthesized from Integrated DNA Technologies. Target oligonucleotide (length 29 bp, SNPs in the middle) was 3’ end labeled with biotin using Biotin 3’ End DNA Labeling kit (Thermo Fisher Scientific). The binding reaction mixtures (20 μL) included 1X binding buffer, 1 μL poly (dI-dC), 3 μL of nuclear extract, 100 fmol of 3’ end-labeled oligo, and 200-fold excess of unlabeled oligo for the competitive assay. Reaction mixtures were subjected to electrophoresis using 6% polyacrylamide gel (0.5X TBE) and then transferred onto Biodyne B Nylon Membrane (Thermo Fisher Scientific). Protein–DNA binding was detected using the Chemiluminescent Nucleic Acid Detection Module. The blot was visualized by C-DiGit Blot Scanner and analyzed by Image Studio Software (LI-COR Biotechnology, Lincoln, NE, USA).
2.6. Clinical Association Analysis
To evaluate the clinical association of selected genes, we analyzed TCGA prostate cancer dataset [20]. We used the Mann–Whitney test to compare gene expression between normal and prostate cancer tissues. We applied log-rank test to assess the association between recurrence-free survival (RFS) and gene expression. Samples were stratified into two groups based on the mean values of gene expression levels. GraphPad was used to perform statistical analyses.
3. Results
3.1. High-Quality SNPs-seq Libraries
To perform protein–DNA binding assay, we used ~400 ng ds-oligos pool as input. After incubation and extensive washing, we purified the protein-bound oligos. Quantification analysis showed that 3–13% (10–50 ng) of original input was protein-bound (Figure 2a). Because the ds-oligos were 21 bp and adaptors were 140 bp, the length of libraries were estimated to be ~160 bp. As expected, the input libraries had a clear sharp band at ~160 bp (Figure 2b). However, sizes of DHT/ETH libraries distributed in a relatively wide range from 150 to 500 bp. This could be explained by nuclear extracts that contain fragmented DNAs from cell nuclei. To estimate mappable rate, we counted sequence reads with a perfect match to one of 1806 oligo template sequences and found that the mappable rate was 75–78% for test samples and 93% for input controls (Figure 2c). We also tested reproducibility for each sample and observed high correlation between two technical replicates (R2 > 0.97) (Figure 2d). To test the reproducibility between different studies, we compared read counts of 116 SNP sequences that were shared between this study and previous SNPs-seq [11] and observed significant correlation (R2 > 0.73) (Figure S1).
3.2. Candidate SNPs with Allele-Dependent Protein Binding
To determine the allele-specific protein binding, we calculated the BAB score using read count ratio between variant allele and reference allele. The BAB score showed a wide-range distribution from −5.02 to 3.81 and demonstrated a strong correlation between DHT- and ETH-treated samples (R2 > 0.87) (Figure 3a). When sorting BAB score from low to high in ETH samples, the BAB score in DHT samples clearly tended to the same direction (Figure 3b). When defining absolute BAB score ≥ 0.58 (meaning 1.5-fold difference) as significant cutoff, 380 (42%) and 403 (45%) SNPs showed significant difference in DHT-treated samples and in ETH-treated samples, respectively. Among those, 348 (39%) SNPs were shared between two treatment conditions, 32 SNPs were specific under DHT treatment, and 55 SNPs were specific under ETH treatment (Figure 3c, Tables S1 and S2). Interestingly, some of these SNPs have been published as functional candidates in previous studies, including rs13215402 (RGS17) [11], rs6579003 and rs7123299 (ASCL2) [11], rs10993994 (MSMB) [21], and rs4907792 (NUDT11) [14].
To estimate whether the 348 shared SNPs were resided in known enhancer regions, we performed association tests using online tools including GREAT [22] and EnhancerAtlas [23]. The GREAT assigns biological meaning to a set of noncoding genomic regions by analyzing the annotations of the nearby genes. EnhancerAtlas provides a set of useful analytic tools that allow users to query and compare enhancers in a particular genomic region or associated with a gene of interest and assign enhancers and their target genes from a custom dataset. When GREAT was applied to annotate the 348 SNPs with nearby genes, we observed that the absolute distance to the transcription start site (TSS) from most SNPs were 5–50 kb (43.45%) and 50–500 kb (44.36%) and more likely resided in enhancer regions (Figure S2). When EnhancerAtlas tool was applied, we found 128 (36.78%) SNP sites at known enhancer regions and 83 (23.85%) SNP sites at known promoter regions in 179 human cell lines. For prostate cancer cell lines (LNCaP and VCaP), we found seven (2.01%) SNP sites at enhancer regions and 83 (23.85%) SNP sites at promoter regions.
3.3. Candidate SNPs to Prioritize Functional Validation
To facilitate discovery of functional candidates on the 348 significant SNPs in both DHT and ETH treatment conditions, we applied Regulome DB and found 95 SNPs with Regulome DB score higher or equal to 4 (Table S3). Then, we searched multiple databases, including HaploReg, SNPnexus, and Variant Effect Predictor, for functional annotations at 348 SNP sites. These analyses revealed, among the 95 SNPs from Regulome DB, 74 promising functional SNPs with modifier impact, motifs change, and histone/transcription factor marks (Figure 4 and Figure S3, Table S3). Lastly, we applied MATCH program to identify potential TF binding proteins at selected SNP sequences. This analysis showed potential disruption of TF binding at six of the 74 SNP sites. For example, the SNP rs113082846 showed a strong eQTL signal with gene NCOA4 (p value = 5.32 × 10−52). In the SNPs-seq analysis, the BAB score of alternate allele C to reference G allele was 2.95 in the DHT-treated sample and 3.14 in the ETH group. When the experimental oligo sequence with the C allele was entered in MATCH, a binding site for ELK1 (transcription activator) was reported with a core match of 1.000 and a matrix match of 0.988. No binding sites were reported for the G allele. These functional annotations on the 348 SNPs are listed in Table S3 and visualized in Figure 4 and Figure S3.
3.4. Validation of Selected Candidate SNPs
In principle, both EMSA and SNPs-seq utilize the same protein–DNA binding assay. To validate SNPs-seq results, we therefore applied EMSA to test allele-dependent protein binding in three SNP sites based on the BAB score and epigenomic annotations from other databases. The EMSA showed that SNP rs12246440 (chr10:125048307, intron variant of C-terminal binding protein 2, or CTBP2) had protein-binding difference between C and T allele. The C allele had lower binding ability than T allele. When unlabeled oligo was used, the signal was significantly reduced, suggesting specific oligo binding. This result was consistent with SNPs-seq (Figure 5 and Table 2). The EMSA also confirmed allele-specific binding at SNP rs7077275 (chr10:125008641, intron variant of CTBP2) and rs113082846 (chr10:46093020, intergenic variant, near nuclear receptor coactivator 4, or NCOA4) (Figures S4 and S5). The functional annotations of the three SNPs are shown in Table S4.
3.5. Association of Candidate Genes with Clinical Outcomes
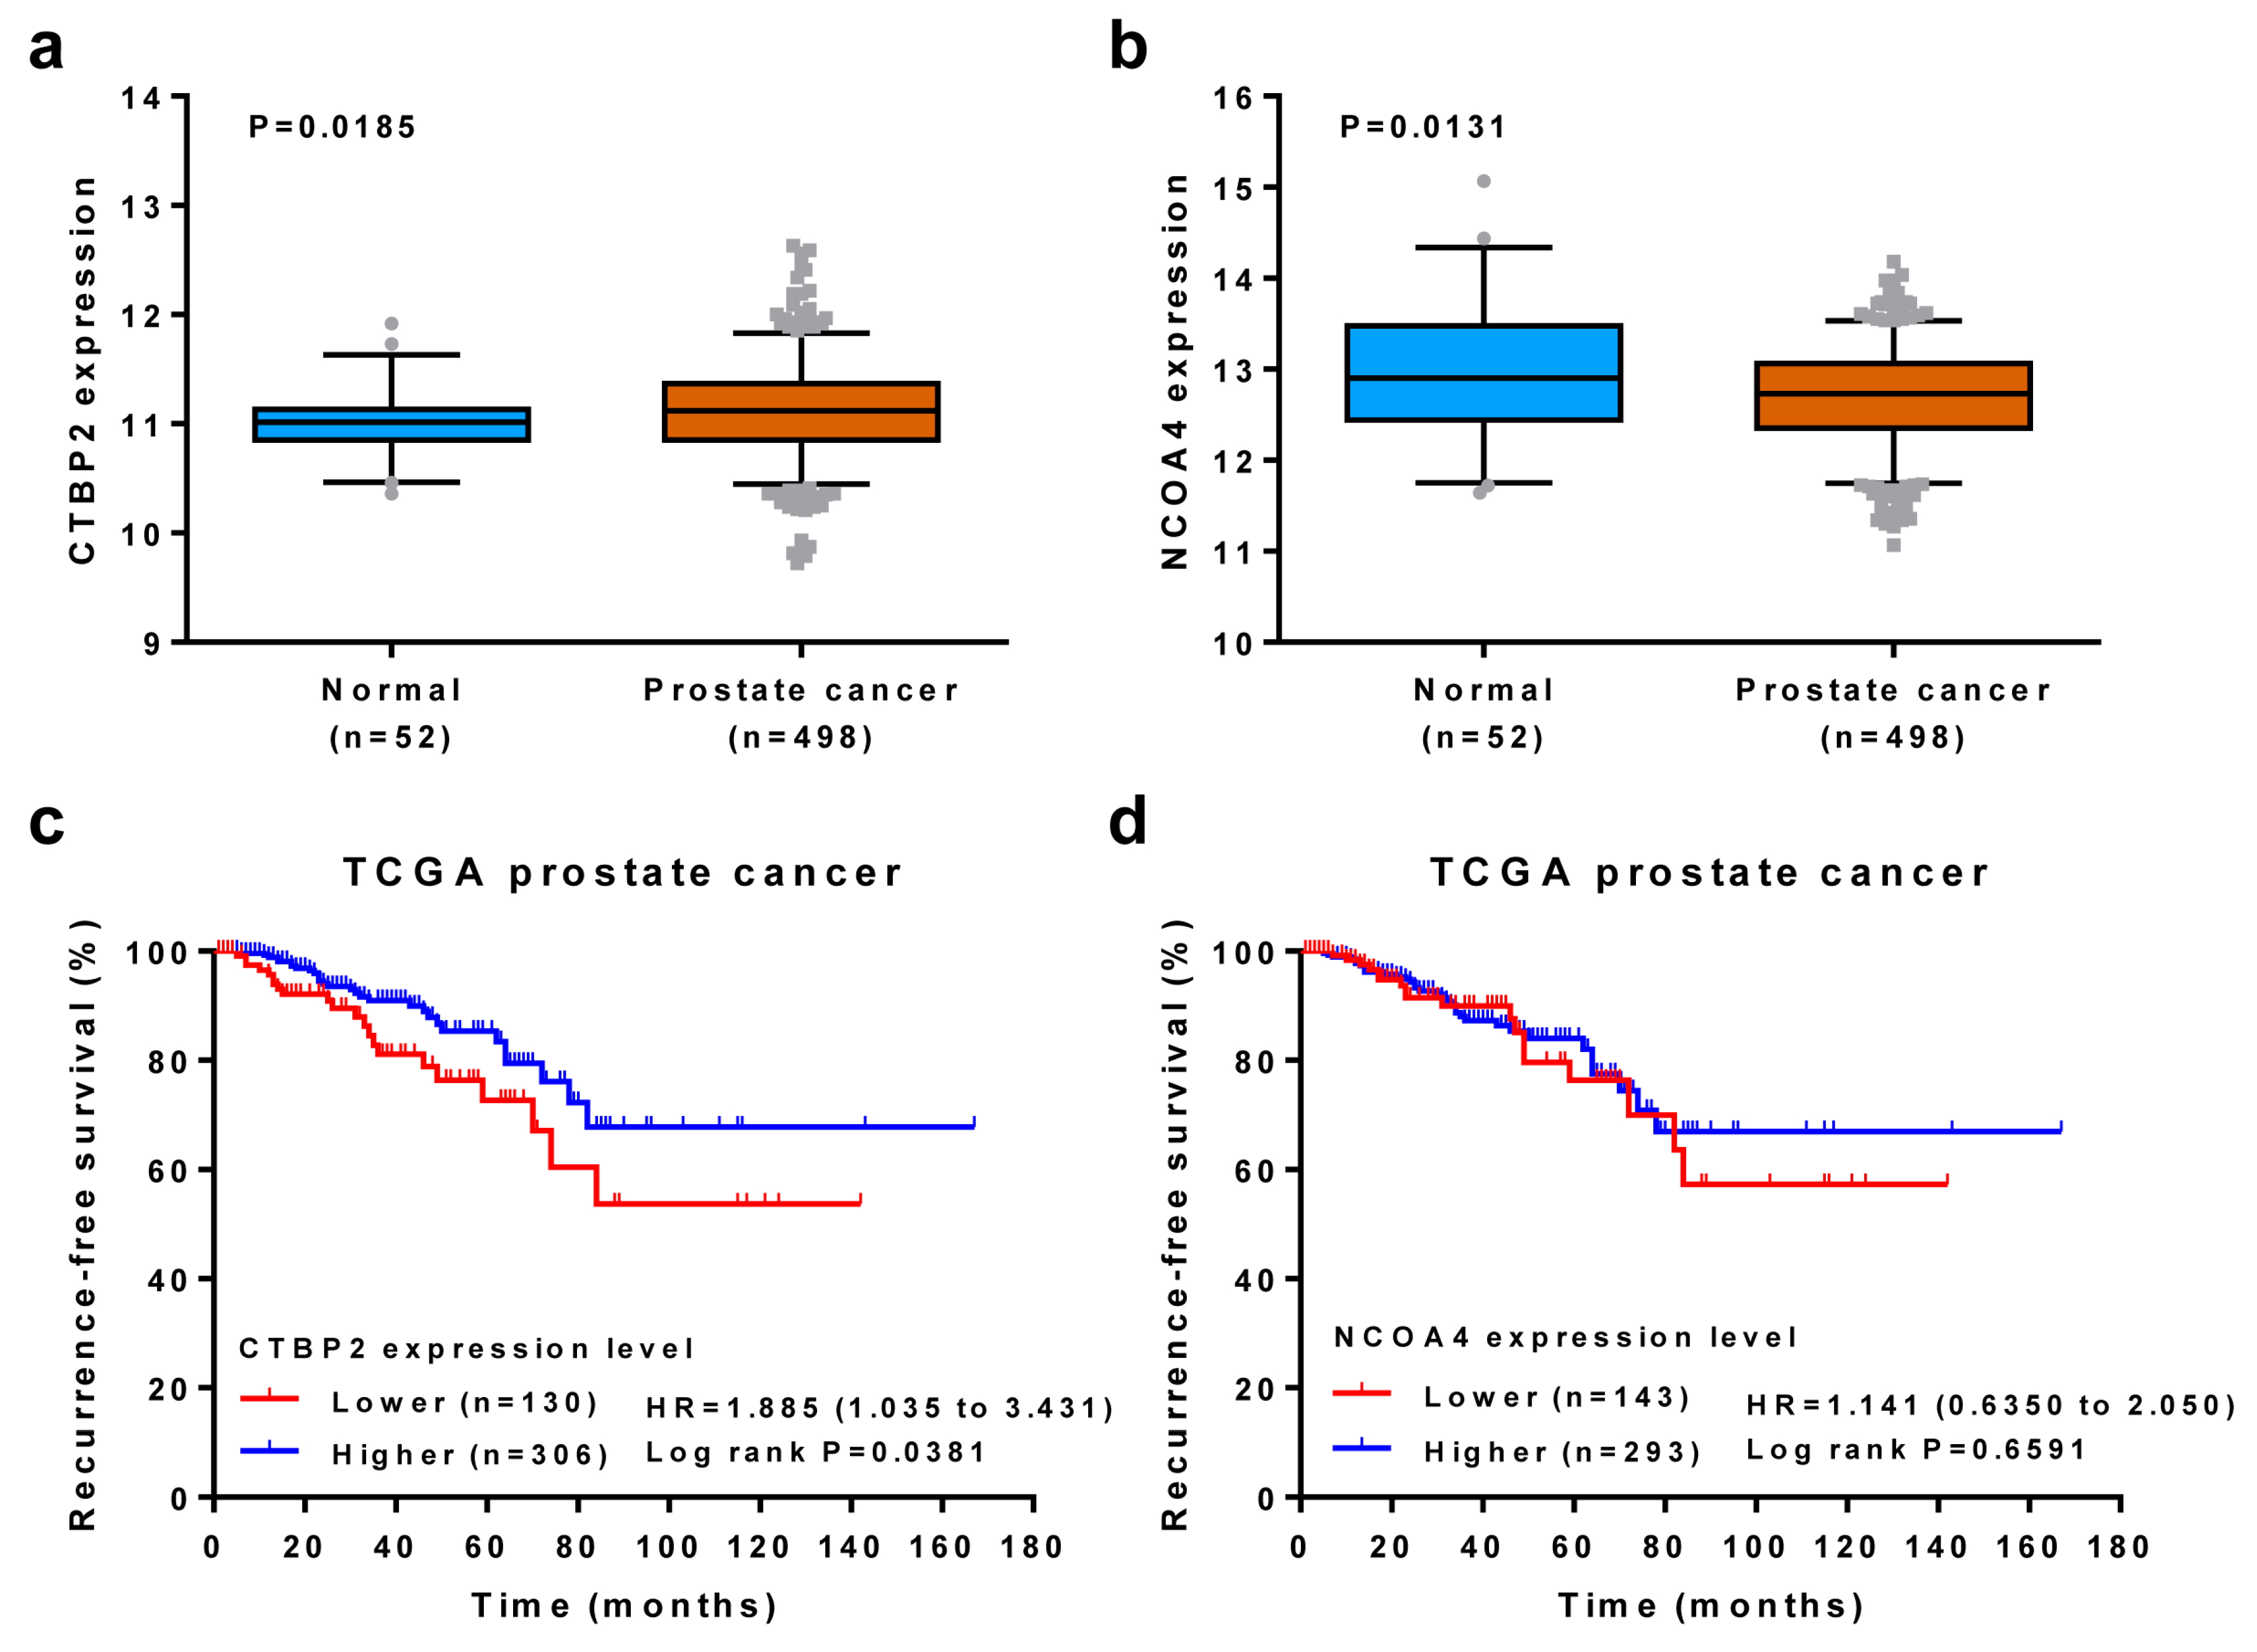
To associate candidate genes (CTBP2 and NCOA4) with clinical outcomes, we examined gene expression and its association with survival using TCGA dataset. When compared to normal prostate tissues (N = 52), the CTBP2 expression level was significantly higher in prostate cancer tissues (N = 498) (p = 0.0185) (Figure 6a), while the NCOA4 expression was significantly lower in prostate cancer tissues (p = 0.0131) (Figure 6b). The log-rank test showed that lower CTBP2 expression level was associated with poor RFS (p = 0.0381) (Figure 6c). However, we did not observe any survival association with NCOA4 expression (p = 0.6591) (Figure 6d). To see if the two genes had any synergistic effect on survival, we combined expression values of CTBP2 and NCOA4, weighted by their estimated regression coefficients, and performed the log-rank test. This analysis also showed the lower expression level associated with poor RFS (p = 0.0247) (Figure S6).
4. Discussion
GWASs have identified thousands of SNP associations with complex diseases and traits. In the post-GWAS era, however, there is still a significant challenge to functionally characterize these risk SNPs and their underlying biology [24]. In this study, we applied the SNPs-seq technology [11] to test 903 SNPs from prostate cancer risk SNPs-related eQTL data [10]. We reported a significant fraction of SNPs showing allelic difference for protein binding. Because prostate cancer is driven by a gain of function in AR (androgen receptor) that is usually accompanied by DHT to drive expression of AR-induced genes [25,26], we classified significant SNPs into three groups (DHT-specific, ETH-specific, and shared between the two) based on the BAB score and treatment conditions. We also performed a database search and further narrowed down the promising functional SNPs. In addition, we applied EMSA and validated a selected group of candidate SNPs. Finally, we associated the candidate genes with tissue type and recurrence-free survival. This study provides a list of candidate functional SNPs and will significantly enrich resources for functional annotation of prostate cancer risk SNPs.
To determine whether a SNP is functional, a common approach is to map the SNP to a regulatory element defined by ENCODE [17] and the Roadmap Epigenomics Program [27]. Although useful for mapping regulatory genomic regions, none of the datasets provide direct access to allelic binding preferences. To test whether candidate SNP are functional, EMSA [28] may be used to identify allele-specific protein binding. However, this low-throughput assay is not suitable when screening because hundreds to thousands of candidate SNPs are needed. ChIP-seq [29] is another method to identify allele binding difference at TF binding sites. However, this method requires heterozygous status at every tested SNP site, which is not possible for a specific cell line. To address this issue, we developed the SNPs-seq [11]. Our study shows that SNPs-seq is a powerful tool to identify allelic protein-binding difference with high-throughput capacity. Because GC content significantly affects read counts in the SNPs-seq assay [11], in this study, we excluded 371 SNPs with low GC content before the final oligo pooling. Additionally, it is worth mentioning that SNPs-seq is a screening tool, which does not recognize proteins that bind to the SNP-containing oligos. Further laboratory tests are needed to validate the findings. Moreover, the main goal of this study is not to identify a specific SNP that regulates prostate cancer-related gene. Instead, the study provides a key set of SNPs that can be prioritized for further functional studies. From the preselected promising SNP, several functional experiments, such as RNAi, CRISPR, and reporter assay, may be used for functional validation. In addition, the approaches used in this study are not limited to prostate cancer. They may be applied to characterize functional SNPs at any GWAS loci of any disease phenotype.
In this study, we also provided candidate SNPs and their target genes. Among these are CTBP2 and NCOA4. CTBP2 is a binding partner for the E1A-transforming proteins. CTBP2 exert transcriptional repression primarily via recruitment of a corepressor complex to DNA that consists of histone deacetylases and histone methyltransferases [30]. A joint GWAS showed that CTBP2 for SNP rs4962416 was significantly associated with prostate cancer [31]. CTBP2 is overexpressed in prostate cancer, and its increased expression is significantly correlated with malignant behaviors [32]. Silencing of CTBP2 markedly increases apoptosis of prostate cancer cells; decreases the expression of IL-8, AT2R, CCND1, MMP9, MYC, and HSPC111; and reduces tumor growth in mouse xenograft model of human prostate cancer [32,33,34,35,36]. However, our analysis of TCGA data showed that high expression of CTBP2 was associated with longer RFS in prostate cancer patients. Takayama et al. found that high CTBP2 expression levels were correlated with poor cancer-specific survival in patients [35]. The reasons for the conflicting observation may involve different methods to determine the expression level, different patient population, and/or different clinical end points for survival analysis. NCOA4, also known as androgen receptor-associated protein 70 (ARA70), is a coactivator for a variety of nuclear receptors [37]. SNP rs10993994 (near NCOA4) is associated with prostate cancer, and the risk allele is associated with increased expression of five NCOA4 isoforms in histologically normal prostate tissue [31,38]. The expression of NCOA4 in human prostate tissues is not consistent. Some studies have reported decreased NCOA4 expression in both prostate intraepithelial neoplasia and malignant prostate when compared to benign prostate [38,39], which is consistent with our result of analysis on TCGA dataset (Figure 6b). However, another study showed similar expression levels of NCOA4 in both normal and prostate cancer [40]. In contrast, another study demonstrated higher NCOA4 expression in prostate cancer tissues than benign tissue [41]. NCOA4 affects ligand-binding specificity of the AR and interacts with PSA (prostate-specific antigen) and AR, possibly forming a tripartite complex [37]. NCOA4 increases the sensitivity and maximum stimulation of DHT-inducing PSA promoter activity [42]. Clearly, the role of NCOA4 in prostate cancer needs further exploration.
In summary, we applied SNPs-seq to test 903 SNPs selected from our previous prostate tissue eQTL data for their allelic protein-binding difference. This analysis identified 348 SNPs that showed significantly different protein binding between two alleles (absolute BAB score ≥0.58) with and without androgen treatment conditions. Database-based informatic analysis showed 74 SNPs have potential regulation function with epigenomic marks. We used EMSA to validate the premising SNPs selected from SNPs-seq and identified three SNPs (rs12246440, rs7077275, and rs113082846) that are respectively associated with two genes (CTBP2 and NCOA4). Because the EMSA validation was just performed using one cell line (LNCaP), further functional study is needed to characterize the mechanisms of the SNPs–gene associations in prostate cancer.
Supplementary Materials
The following are available online at https://www.mdpi.com/2073-4425/10/7/547/s1, Figure S1: The correlation of log2 read count in overlapped SNPs between this study (903 SNPs) and previous SNPs-seq (374 SNPs). Figure S2: Distance of selected 348 SNPs to transcription start site (TSS) of the nearby genes. Figure S3: Functional annotations on the 348 SNPs visualized using circos plot. Figure S4: Validation of SNP rs7077275 by EMSA. Figure S5: Validation of SNP rs113082846 by EMSA. Figure S6: Association of RFS with combined expression value of CTBP2 and NCOA4 by log-rank test. Table S1: List of 903 SNPs, sequence read count, and BAB score. Table S2: Priority of SNPs selection based on BAB score. Table S3: Functional analysis of 348 significant SNPs using Regulome DB, HaploReg, SNPnexus, VEP, and MATCH datasets. Table S4: Functional annotations of three validated SNPs.
Author Contributions
Supervision, L.W. and S.N.T.; methodology, P.Z. and L.S.T.; data analysis, P.Z. and L.S.T.; writing—original draft preparation, L.W. and P.Z.; writing—review and editing, L.W., S.N.T., P.Z., and L.S.T.
Funding
This research was funded by the National Institutes of Health (R01CA157881 to L.W.). P.Z. was partially supported by the First Affiliated Hospital of Zhengzhou University.
Acknowledgments
We thank the members of Wang laboratory and Thibodeau laboratory for helpful comments on improving the methods and evaluating the approaches.
Conflicts of Interest
The authors declare no conflict of interest.
References
- Bray, F.; Ferlay, J.; Soerjomataram, I.; Siegel, R.L.; Torre, L.A.; Jemal, A. Global cancer statistics 2018: GLOBOCAN estimates of incidence and mortality worldwide for 36 cancers in 185 countries. CA Cancer J. Clin. 2018, 68, 394–424. [Google Scholar] [CrossRef] [PubMed] [Green Version]
- Attard, G.; Parker, C.; Eeles, R.A.; Schroder, F.; Tomlins, S.A.; Tannock, I.; Drake, C.G.; de Bono, J.S. Prostate cancer. Lancet 2016, 387, 70–82. [Google Scholar] [CrossRef]
- Wang, G.; Zhao, D.; Spring, D.J.; DePinho, R.A. Genetics and biology of prostate cancer. Genes Dev. 2018, 32, 1105–1140. [Google Scholar] [CrossRef] [PubMed] [Green Version]
- Neslund-Dudas, C.; Levin, A.M.; Rundle, A.; Beebe-Dimmer, J.; Bock, C.H.; Nock, N.L.; Jankowski, M.; Datta, I.; Krajenta, R.; Dou, Q.P.; et al. Case-only gene-environment interaction between ALAD tagSNPs and occupational lead exposure in prostate cancer. Prostate 2014, 74, 637–646. [Google Scholar] [CrossRef] [PubMed]
- Buniello, A.; MacArthur, J.A.L.; Cerezo, M.; Harris, L.W.; Hayhurst, J.; Malangone, C.; McMahon, A.; Morales, J.; Mountjoy, E.; Sollis, E.; et al. The NHGRI-EBI GWAS Catalog of published genome-wide association studies, targeted arrays and summary statistics 2019. Nucleic Acids Res. 2019, 47, D1005–D1012. [Google Scholar] [CrossRef]
- Benafif, S.; Kote-Jarai, Z.; Eeles, R.A.; Consortium, P. A Review of Prostate Cancer Genome-Wide Association Studies (GWAS). Cancer Epidemiol. Biomark. Prev. 2018, 27, 845–857. [Google Scholar] [CrossRef] [PubMed] [Green Version]
- Farashi, S.; Kryza, T.; Clements, J.; Batra, J. Post-GWAS in prostate cancer: From genetic association to biological contribution. Nat. Rev. Cancer 2019, 19, 46–59. [Google Scholar] [CrossRef]
- Chen, H.; Yu, H.; Wang, J.; Zhang, Z.; Gao, Z.; Chen, Z.; Lu, Y.; Liu, W.; Jiang, D.; Zheng, S.L.; et al. Systematic enrichment analysis of potentially functional regions for 103 prostate cancer risk-associated loci. Prostate 2015, 75, 1264–1276. [Google Scholar] [CrossRef]
- Westra, H.J.; Franke, L. From genome to function by studying eQTLs. Biochim. Biophys. Acta 2014, 1842, 1896–1902. [Google Scholar] [CrossRef] [Green Version]
- Thibodeau, S.N.; French, A.J.; McDonnell, S.K.; Cheville, J.; Middha, S.; Tillmans, L.; Riska, S.; Baheti, S.; Larson, M.C.; Fogarty, Z.; et al. Identification of candidate genes for prostate cancer-risk SNPs utilizing a normal prostate tissue eQTL data set. Nat. Commun. 2015, 6, 8653. [Google Scholar] [CrossRef]
- Zhang, P.; Xia, J.H.; Zhu, J.; Gao, P.; Tian, Y.J.; Du, M.; Guo, Y.C.; Suleman, S.; Zhang, Q.; Kohli, M.; et al. High-throughput screening of prostate cancer risk loci by single nucleotide polymorphisms sequencing. Nat. Commun. 2018, 9, 2022. [Google Scholar] [CrossRef]
- Boyle, A.P.; Hong, E.L.; Hariharan, M.; Cheng, Y.; Schaub, M.A.; Kasowski, M.; Karczewski, K.J.; Park, J.; Hitz, B.C.; Weng, S.; et al. Annotation of functional variation in personal genomes using RegulomeDB. Genome Res. 2012, 22, 1790–1797. [Google Scholar] [CrossRef] [Green Version]
- Ward, L.D.; Kellis, M. HaploReg: A resource for exploring chromatin states, conservation, and regulatory motif alterations within sets of genetically linked variants. Nucleic Acids Res. 2012, 40, D930–D934. [Google Scholar] [CrossRef]
- Hazelett, D.J.; Rhie, S.K.; Gaddis, M.; Yan, C.; Lakeland, D.L.; Coetzee, S.G.; Ellipse, G.-O.N.C.; Practical, C.; Henderson, B.E.; Noushmehr, H.; et al. Comprehensive functional annotation of 77 prostate cancer risk loci. PLoS Genet. 2014, 10, e1004102. [Google Scholar] [CrossRef]
- Taberlay, P.C.; Statham, A.L.; Kelly, T.K.; Clark, S.J.; Jones, P.A. Reconfiguration of nucleosome-depleted regions at distal regulatory elements accompanies DNA methylation of enhancers and insulators in cancer. Genome Res. 2014, 24, 1421–1432. [Google Scholar] [CrossRef] [Green Version]
- Chelala, C.; Khan, A.; Lemoine, N.R. SNPnexus: A web database for functional annotation of newly discovered and public domain single nucleotide polymorphisms. Bioinformatics 2009, 25, 655–661. [Google Scholar] [CrossRef]
- Consortium, E.P. An integrated encyclopedia of DNA elements in the human genome. Nature 2012, 489, 57–74. [Google Scholar] [CrossRef]
- McLaren, W.; Gil, L.; Hunt, S.E.; Riat, H.S.; Ritchie, G.R.; Thormann, A.; Flicek, P.; Cunningham, F. The Ensembl Variant Effect Predictor. Genome Biol. 2016, 17, 122. [Google Scholar] [CrossRef]
- Kel, A.E.; Gossling, E.; Reuter, I.; Cheremushkin, E.; Kel-Margoulis, O.V.; Wingender, E. MATCH: A tool for searching transcription factor binding sites in DNA sequences. Nucleic Acids Res. 2003, 31, 3576–3579. [Google Scholar] [CrossRef]
- Cerami, E.; Gao, J.; Dogrusoz, U.; Gross, B.E.; Sumer, S.O.; Aksoy, B.A.; Jacobsen, A.; Byrne, C.J.; Heuer, M.L.; Larsson, E.; et al. The cBio cancer genomics portal: An open platform for exploring multidimensional cancer genomics data. Cancer Discov. 2012, 2, 401–404. [Google Scholar] [CrossRef]
- Chang, B.L.; Cramer, S.D.; Wiklund, F.; Isaacs, S.D.; Stevens, V.L.; Sun, J.; Smith, S.; Pruett, K.; Romero, L.M.; Wiley, K.E.; et al. Fine mapping association study and functional analysis implicate a SNP in MSMB at 10q11 as a causal variant for prostate cancer risk. Hum. Mol. Genet. 2009, 18, 1368–1375. [Google Scholar] [CrossRef]
- McLean, C.Y.; Bristor, D.; Hiller, M.; Clarke, S.L.; Schaar, B.T.; Lowe, C.B.; Wenger, A.M.; Bejerano, G. GREAT improves functional interpretation of cis-regulatory regions. Nat. Biotechnol. 2010, 28, 495–501. [Google Scholar] [CrossRef] [Green Version]
- Gao, T.; He, B.; Liu, S.; Zhu, H.; Tan, K.; Qian, J. EnhancerAtlas: A resource for enhancer annotation and analysis in 105 human cell/tissue types. Bioinformatics 2016, 32, 3543–3551. [Google Scholar] [CrossRef]
- Gallagher, M.D.; Chen-Plotkin, A.S. The Post-GWAS Era: From Association to Function. Am. J. Hum. Genet. 2018, 102, 717–730. [Google Scholar] [CrossRef]
- Chang, K.H.; Li, R.; Kuri, B.; Lotan, Y.; Roehrborn, C.G.; Liu, J.; Vessella, R.; Nelson, P.S.; Kapur, P.; Guo, X.; et al. A gain-of-function mutation in DHT synthesis in castration-resistant prostate cancer. Cell 2013, 154, 1074–1084. [Google Scholar] [CrossRef]
- Shafi, A.A.; Yen, A.E.; Weigel, N.L. Androgen receptors in hormone-dependent and castration-resistant prostate cancer. Pharmacol. Ther. 2013, 140, 223–238. [Google Scholar] [CrossRef]
- Bernstein, B.E.; Stamatoyannopoulos, J.A.; Costello, J.F.; Ren, B.; Milosavljevic, A.; Meissner, A.; Kellis, M.; Marra, M.A.; Beaudet, A.L.; Ecker, J.R.; et al. The NIH Roadmap Epigenomics Mapping Consortium. Nat. Biotechnol. 2010, 28, 1045–1048. [Google Scholar] [CrossRef] [Green Version]
- Hellman, L.M.; Fried, M.G. Electrophoretic mobility shift assay (EMSA) for detecting protein-nucleic acid interactions. Nat. Protoc. 2007, 2, 1849–1861. [Google Scholar] [CrossRef]
- Park, P.J. ChIP-seq: Advantages and challenges of a maturing technology. Nat. Rev. Genet. 2009, 10, 669–680. [Google Scholar] [CrossRef]
- Stankiewicz, T.R.; Gray, J.J.; Winter, A.N.; Linseman, D.A. C-terminal binding proteins: Central players in development and disease. Biomol. Concepts 2014, 5, 489–511. [Google Scholar] [CrossRef]
- Thomas, G.; Jacobs, K.B.; Yeager, M.; Kraft, P.; Wacholder, S.; Orr, N.; Yu, K.; Chatterjee, N.; Welch, R.; Hutchinson, A.; et al. Multiple loci identified in a genome-wide association study of prostate cancer. Nat. Genet. 2008, 40, 310–315. [Google Scholar] [CrossRef]
- Zhang, C.; Li, S.; Qiao, B.; Yang, K.; Liu, R.; Ma, B.; Liu, Y.; Zhang, Z.; Xu, Y. CtBP2 overexpression is associated with tumorigenesis and poor clinical outcome of prostate cancer. Arch. Med. Sci. 2015, 11, 1318–1323. [Google Scholar] [CrossRef]
- Zhang, C.; Gao, C.; Xu, Y.; Zhang, Z. CtBP2 could promote prostate cancer cell proliferation through c-Myc signaling. Gene 2014, 546, 73–79. [Google Scholar] [CrossRef]
- Debiais-Delpech, C.; Godet, J.; Pedretti, N.; Bernard, F.X.; Irani, J.; Cathelineau, X.; Cussenot, O.; Fromont, G. Expression patterns of candidate susceptibility genes HNF1beta and CtBP2 in prostate cancer: Association with tumor progression. Urol. Oncol. 2014, 32, 426–432. [Google Scholar] [CrossRef]
- Takayama, K.; Suzuki, T.; Fujimura, T.; Urano, T.; Takahashi, S.; Homma, Y.; Inoue, S. CtBP2 modulates the androgen receptor to promote prostate cancer progression. Cancer Res. 2014, 74, 6542–6553. [Google Scholar] [CrossRef]
- Xuan, Q.; Zhong, X.; Li, W.; Mo, Z.; Huang, Y.; Hu, Y. CtBP2 is associated with angiogenesis and regulates the apoptosis of prostate cancer cells. Oncol. Rep. 2017, 38, 1259–1267. [Google Scholar] [CrossRef]
- Kollara, A.; Brown, T.J. Expression and function of nuclear receptor co-activator 4: Evidence of a potential role independent of co-activator activity. Cell. Mol. Life Sci. 2012, 69, 3895–3909. [Google Scholar] [CrossRef]
- Pomerantz, M.M.; Shrestha, Y.; Flavin, R.J.; Regan, M.M.; Penney, K.L.; Mucci, L.A.; Stampfer, M.J.; Hunter, D.J.; Chanock, S.J.; Schafer, E.J.; et al. Analysis of the 10q11 cancer risk locus implicates MSMB and NCOA4 in human prostate tumorigenesis. PLoS Genet. 2010, 6, e1001204. [Google Scholar] [CrossRef]
- Li, P.; Yu, X.; Ge, K.; Melamed, J.; Roeder, R.G.; Wang, Z. Heterogeneous expression and functions of androgen receptor co-factors in primary prostate cancer. Am. J. Pathol. 2002, 161, 1467–1474. [Google Scholar] [CrossRef]
- Mestayer, C.; Blanchere, M.; Jaubert, F.; Dufour, B.; Mowszowicz, I. Expression of androgen receptor coactivators in normal and cancer prostate tissues and cultured cell lines. Prostate 2003, 56, 192–200. [Google Scholar] [CrossRef]
- Hu, Y.C.; Yeh, S.; Yeh, S.D.; Sampson, E.R.; Huang, J.; Li, P.; Hsu, C.L.; Ting, H.J.; Lin, H.K.; Wang, L.; et al. Functional domain and motif analyses of androgen receptor coregulator ARA70 and its differential expression in prostate cancer. J. Biol. Chem. 2004, 279, 33438–33446. [Google Scholar] [CrossRef]
- Tsui, K.H.; Feng, T.H.; Chung, L.C.; Chao, C.H.; Chang, P.L.; Juang, H.H. Prostate specific antigen gene expression in androgen insensitive prostate carcinoma subculture cell line. Anticancer Res. 2008, 28, 1969–1976. [Google Scholar]
Figure 1.
Workflow of candidate single-nucleotide polymorphism (SNP) selection. eQTL: expression quantitative trait loci.
Figure 1.
Workflow of candidate single-nucleotide polymorphism (SNP) selection. eQTL: expression quantitative trait loci.
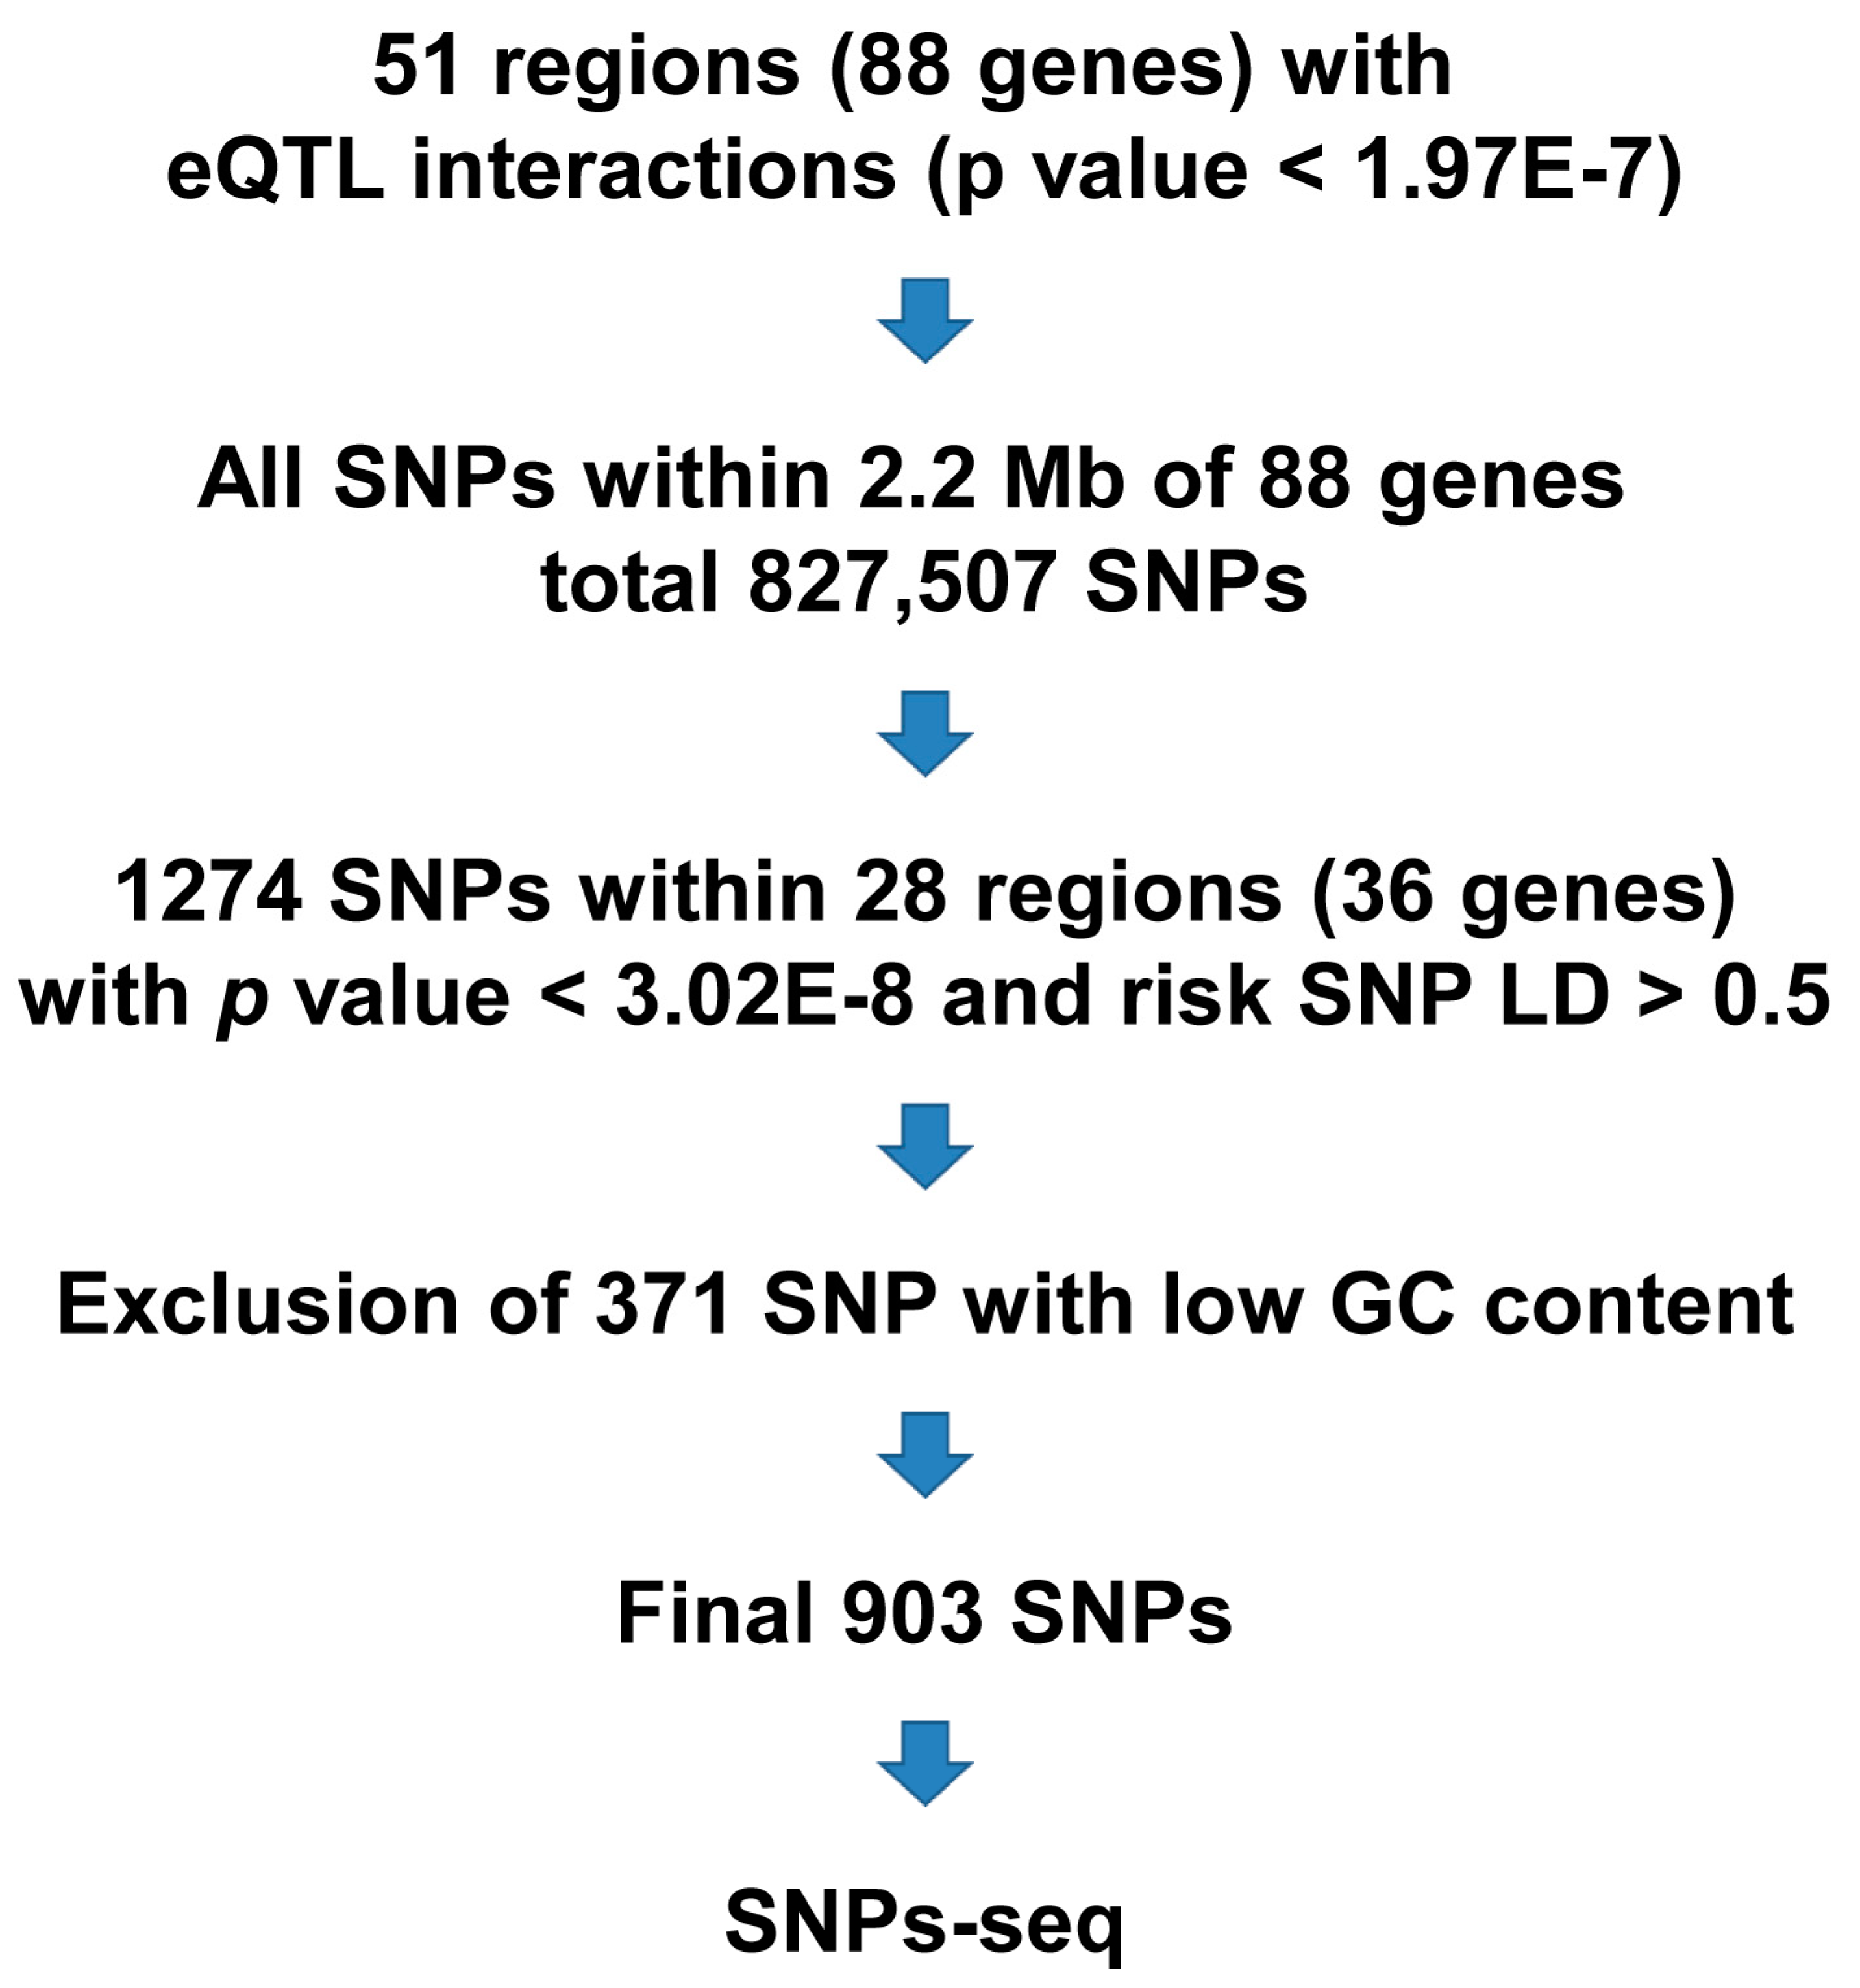
Figure 2.
Quality control of SNPs-seq. (a) Eluted oligos after protein–DNA binding assay accounted for 3–13% of original input oligos. (b) Sizes of SNPs-seq libraries were ~160 bp in the input group and 150–500 bp in the test group. (c) Raw read counts and perfect match read counts in test and input samples. (d) Correlation of raw read count at log2 values between technical replicates in dihydrotestosterone (DHT), ethanol (ETH), and input samples.
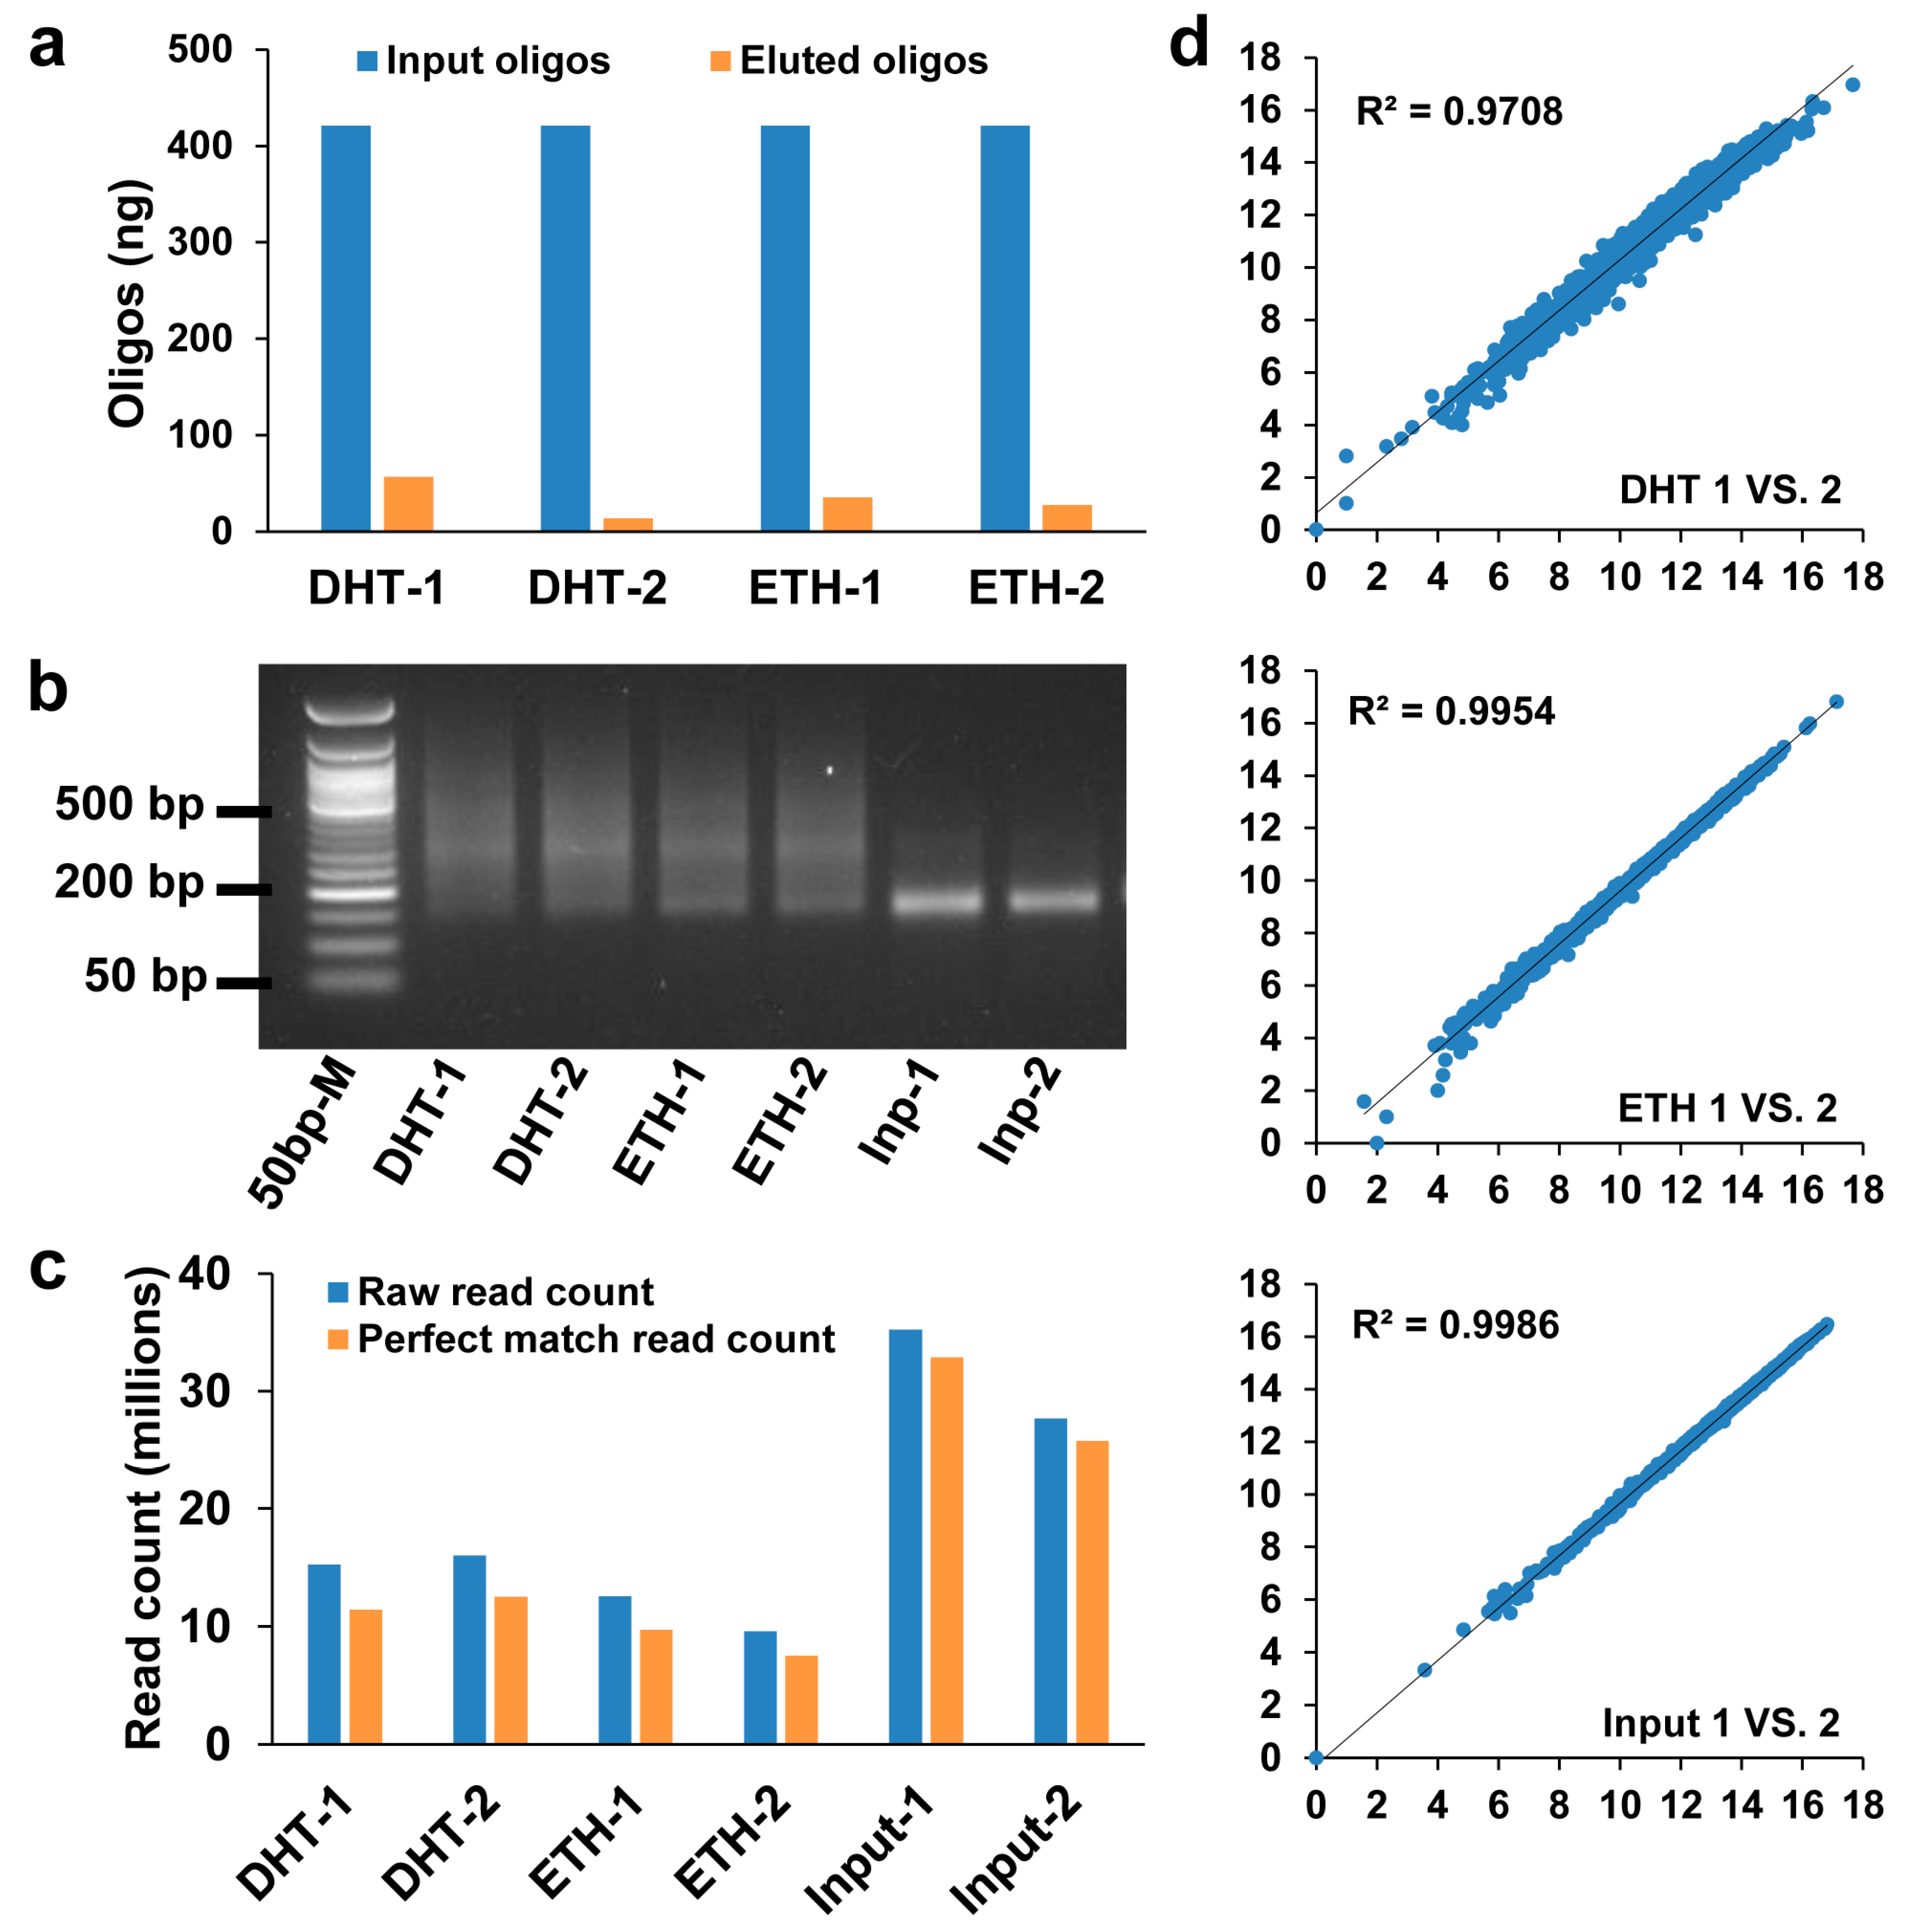
Figure 3.
Correlation and distribution of biased allelic binding (BAB) score. (a) Correlation of BAB scores between DHT and ETH groups. (b) BAB score distribution in DHT and ETH groups (sorted by BAB score from low to high in ETH group). (c) Overlap of significant SNPs (absolute BAB score ≥ 0.58) between DHT and ETH groups.
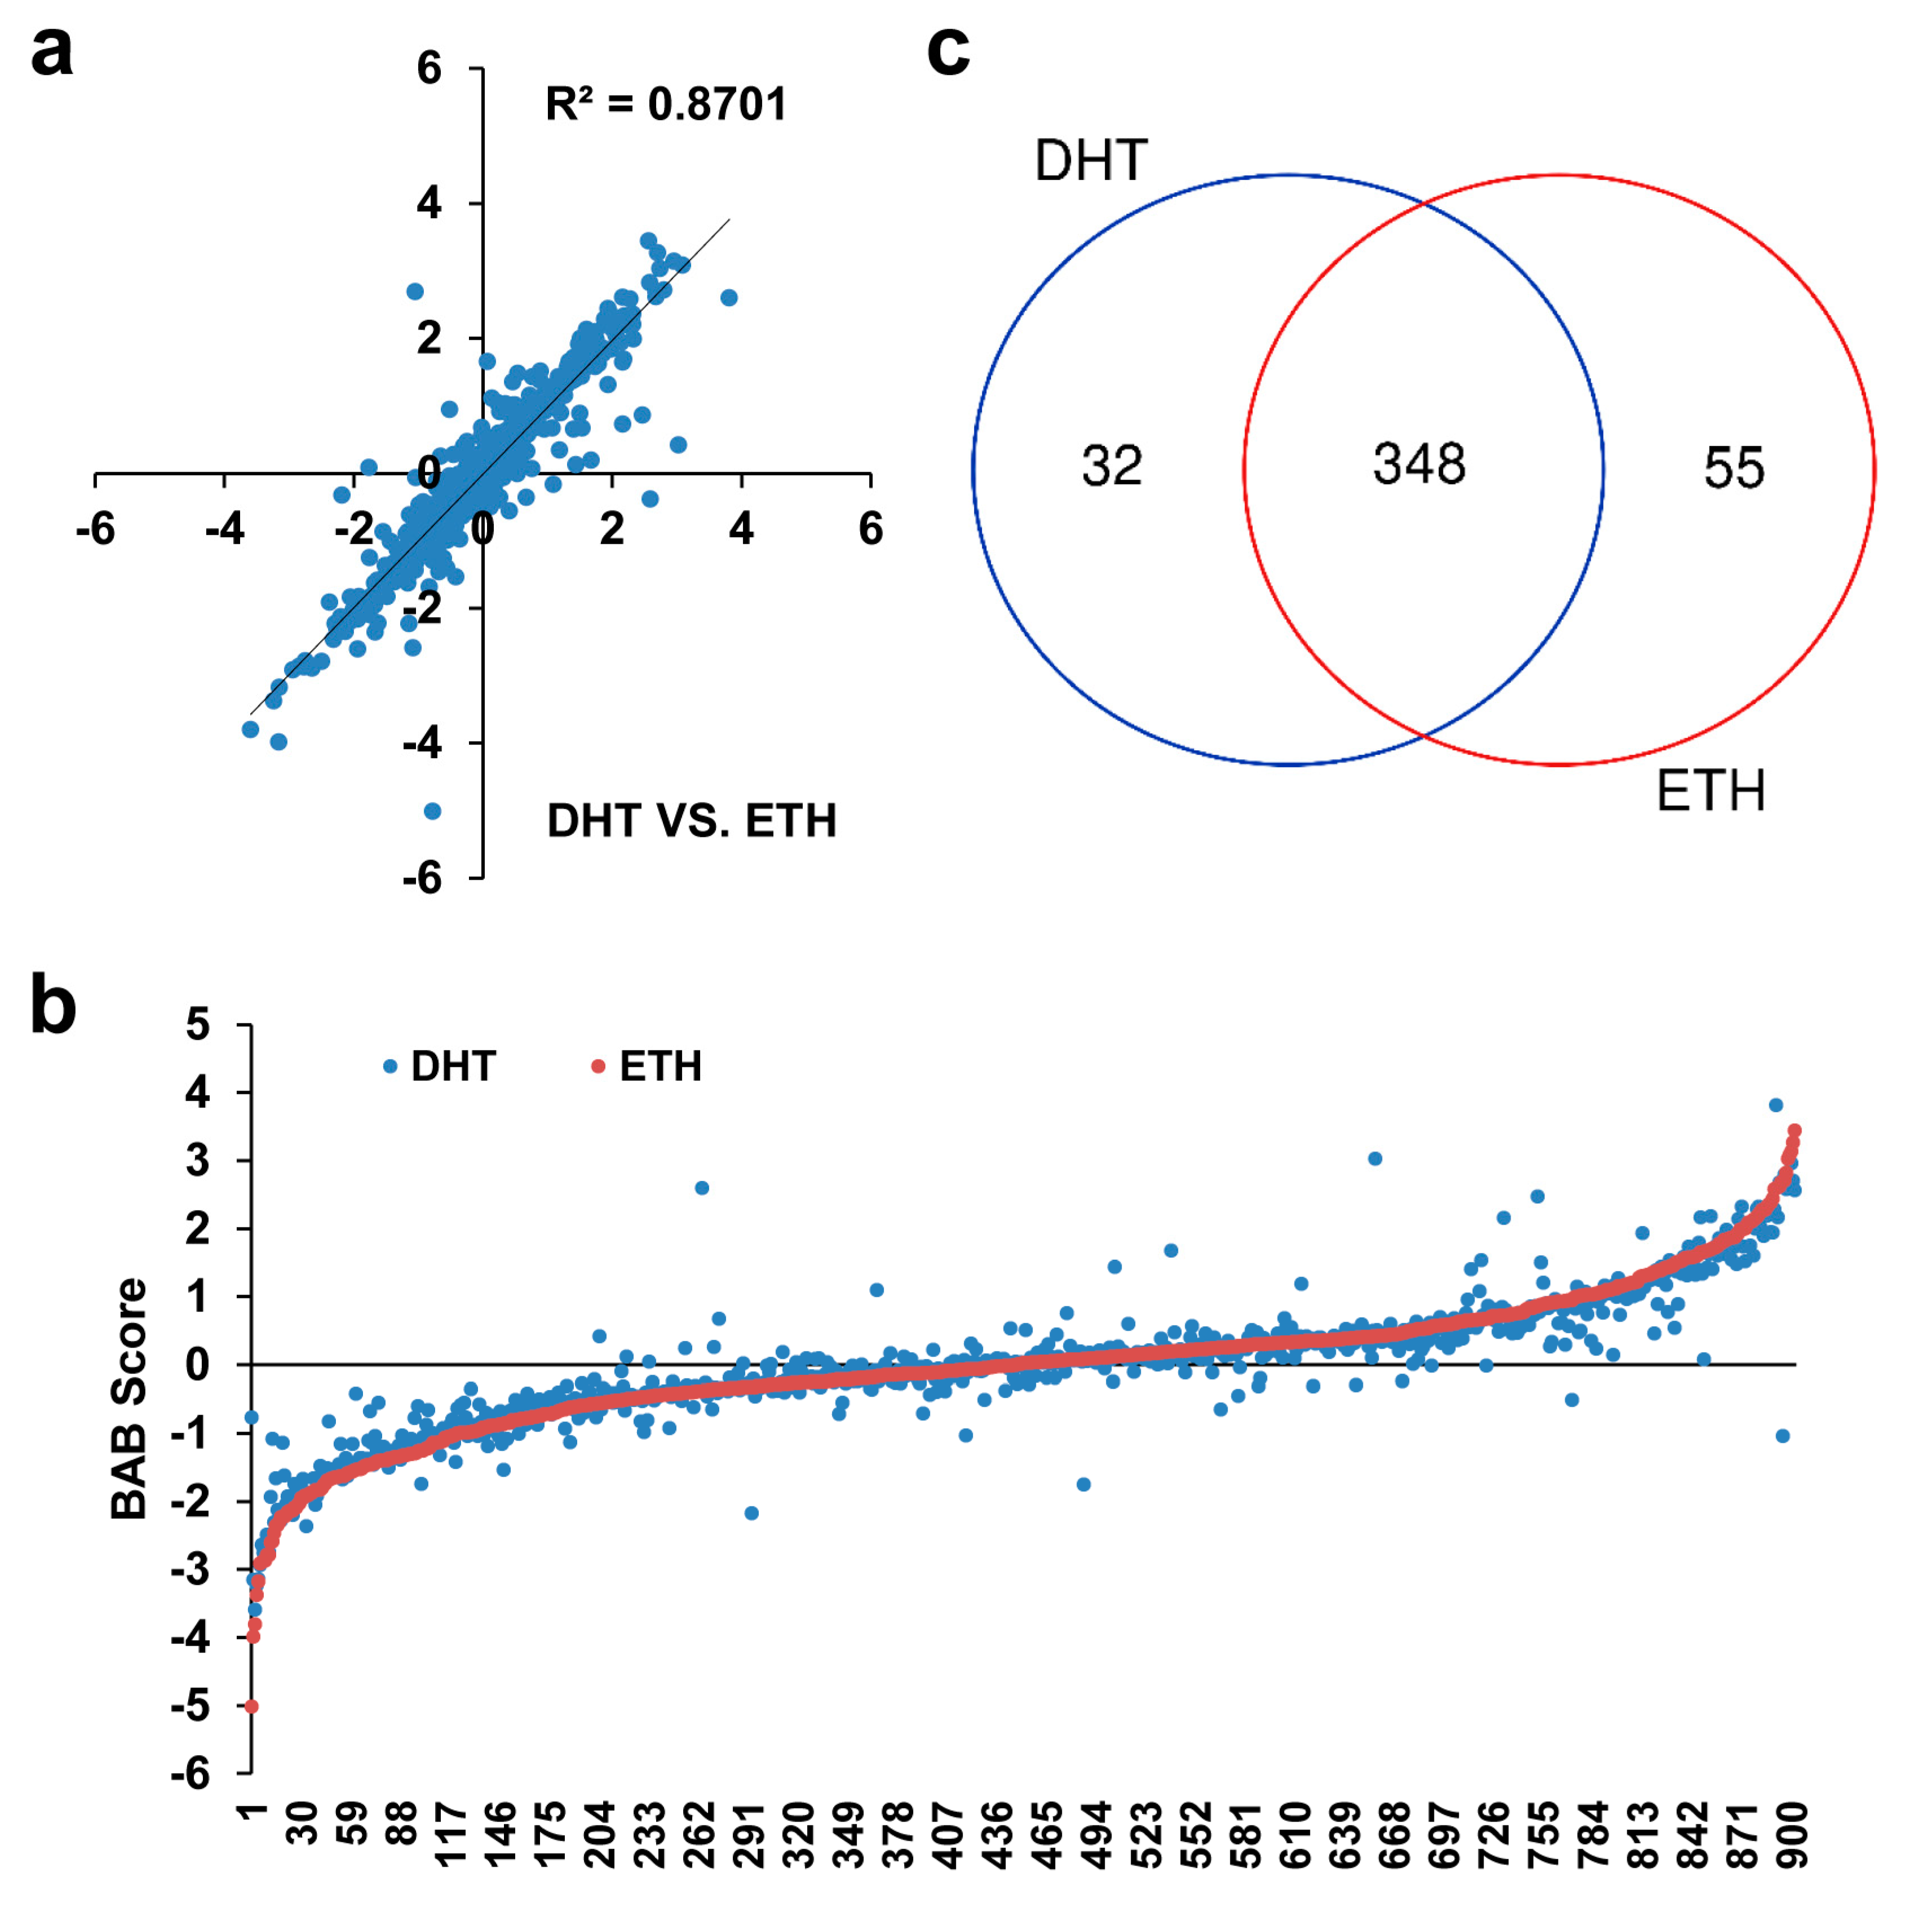
Figure 4.
Circos plot showing functional annotations on the 74 promising SNPs. Left semicircle: from outer to inner ring are chromosomes and related SNPs, genes, and MATCH results (putative transcription factor binding sites); right semicircle: histone and transcription factor marks from Regulome DB, HaploReg, SNPnexus, and Variant Effect Predictor (VEP). Arrows (→) indicate three selected SNPs for electrophoretic mobility shift assay (EMSA) validation.
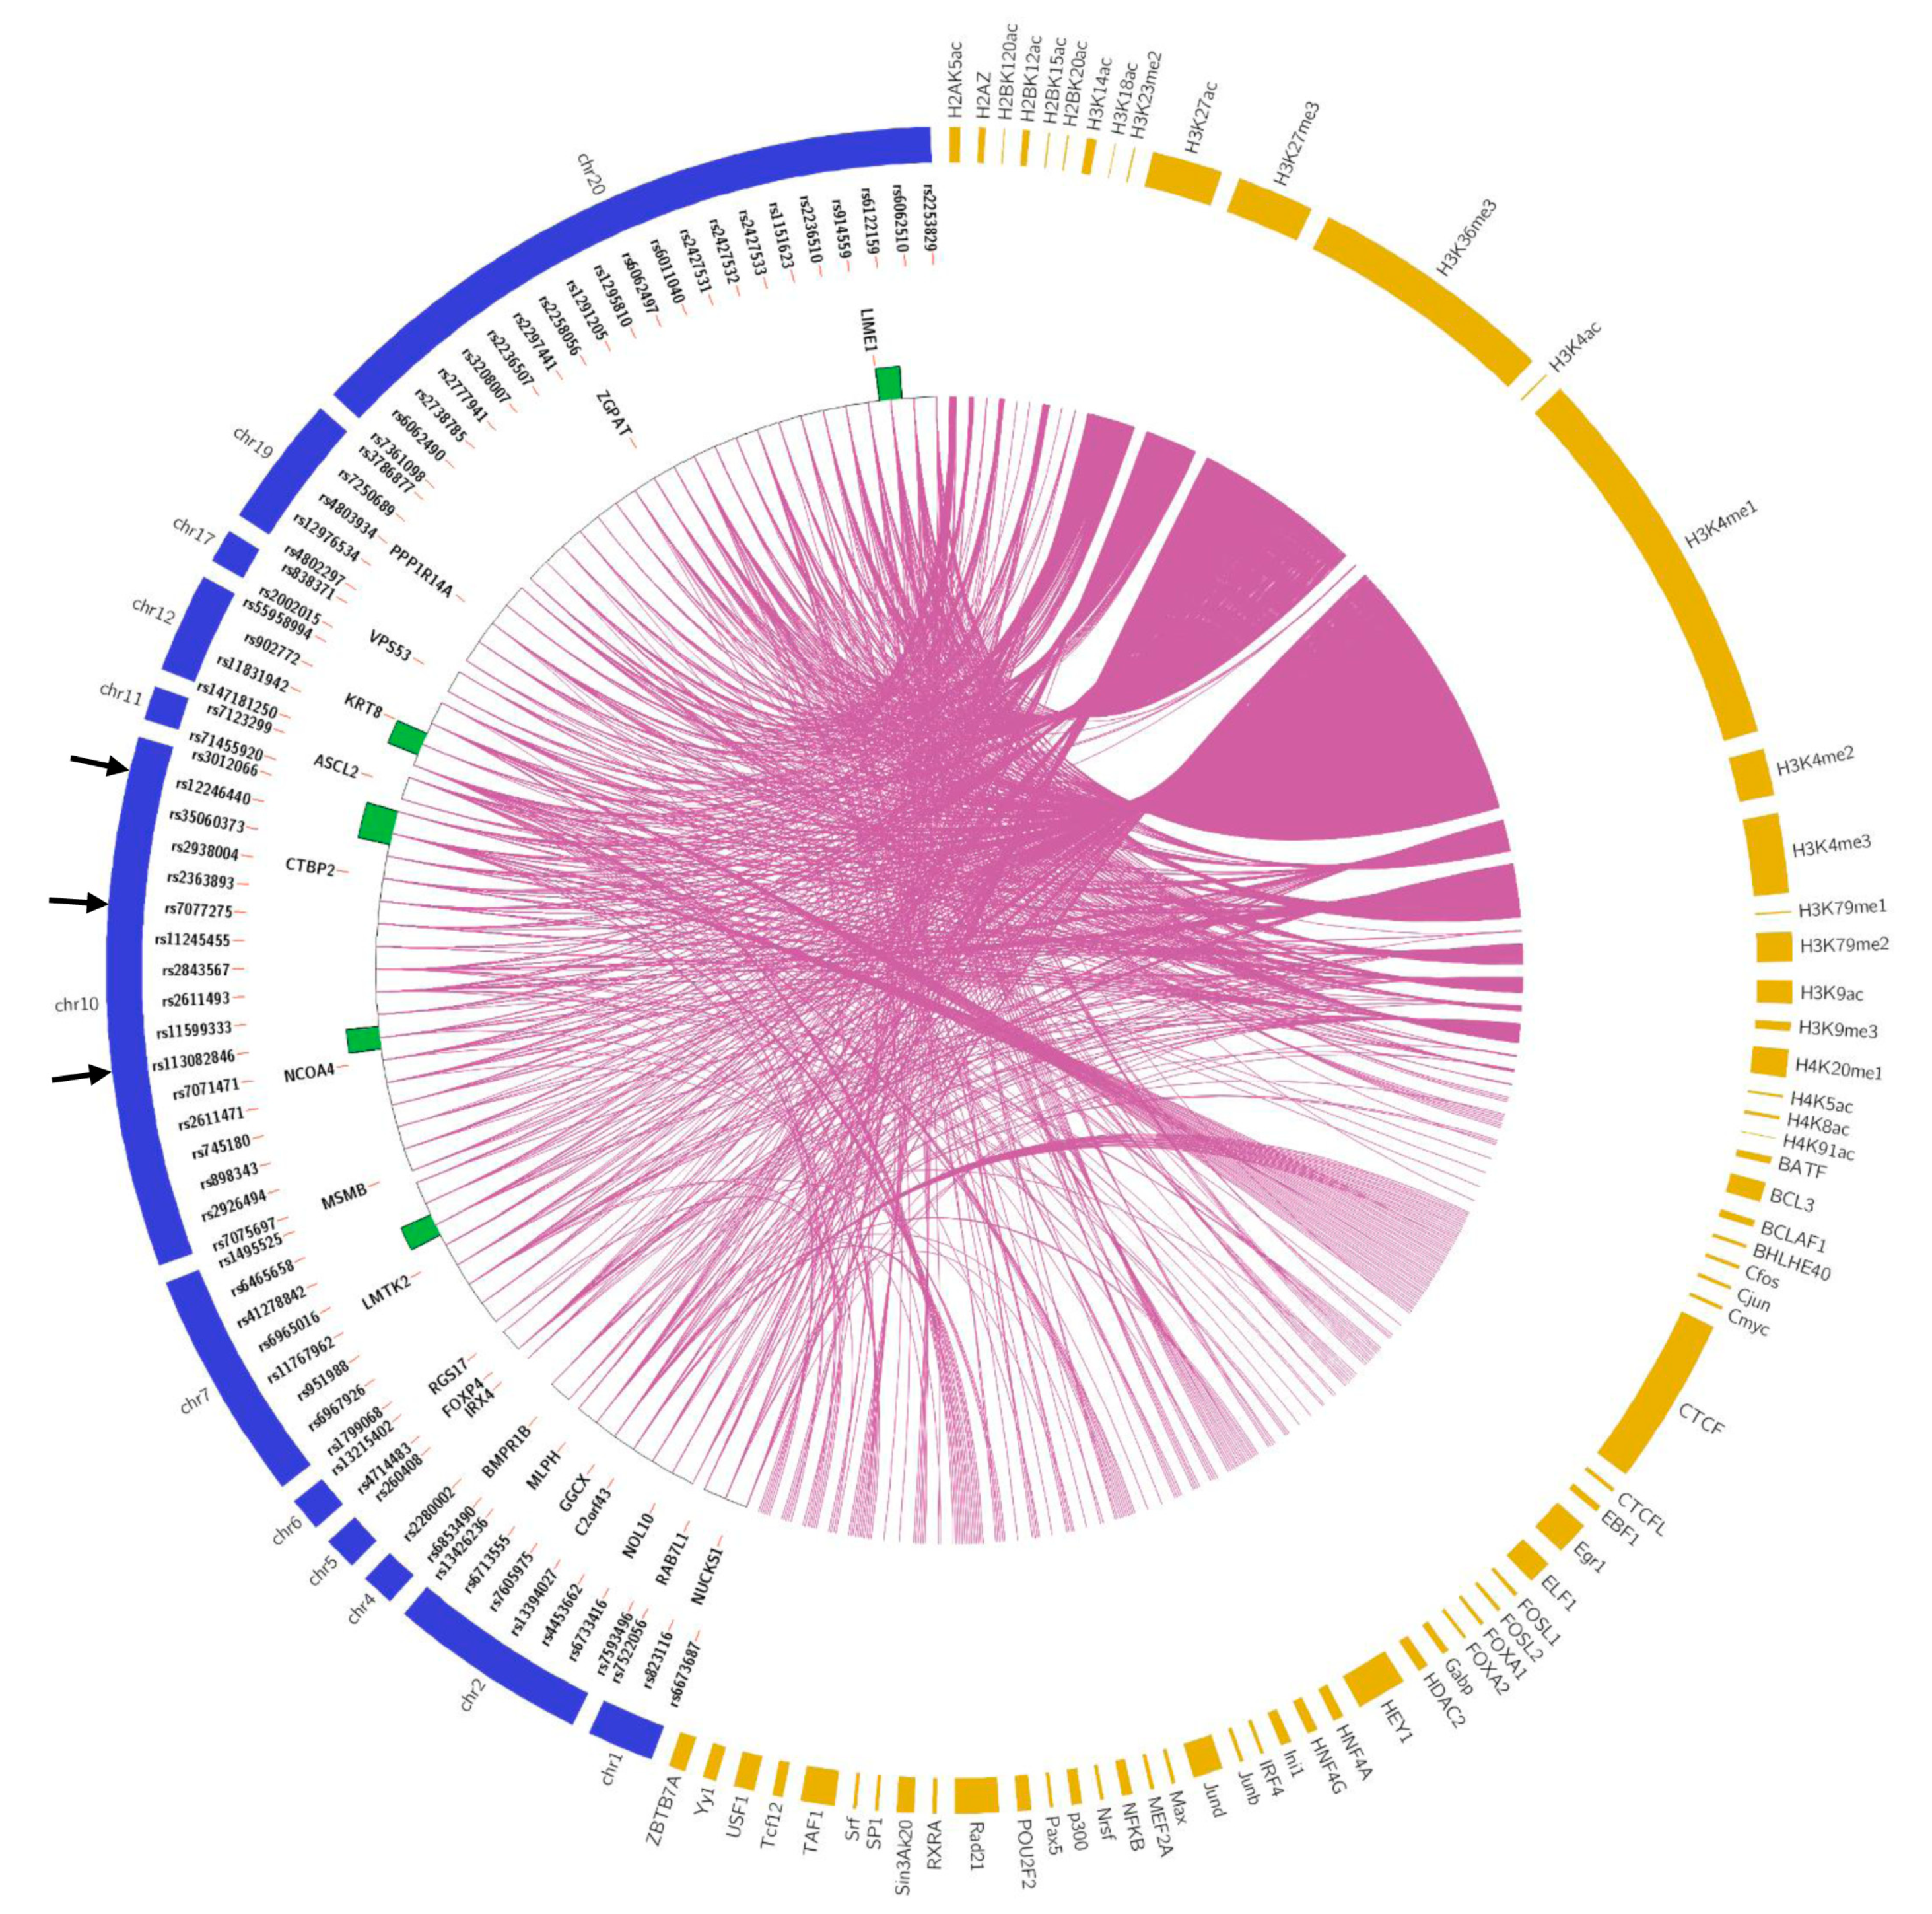
Figure 5.
Validation of SNP rs12246440 by EMSA. Compared to T allele, C allele shows weaker protein binding in both 0.1 pmol and 0.5 pmol oligo. The binding signal is reduced by the addition of unlabeled oligos. The ratio of C to T allele from EMSA is consistent with ratio from SNPs-seq.
Figure 5.
Validation of SNP rs12246440 by EMSA. Compared to T allele, C allele shows weaker protein binding in both 0.1 pmol and 0.5 pmol oligo. The binding signal is reduced by the addition of unlabeled oligos. The ratio of C to T allele from EMSA is consistent with ratio from SNPs-seq.
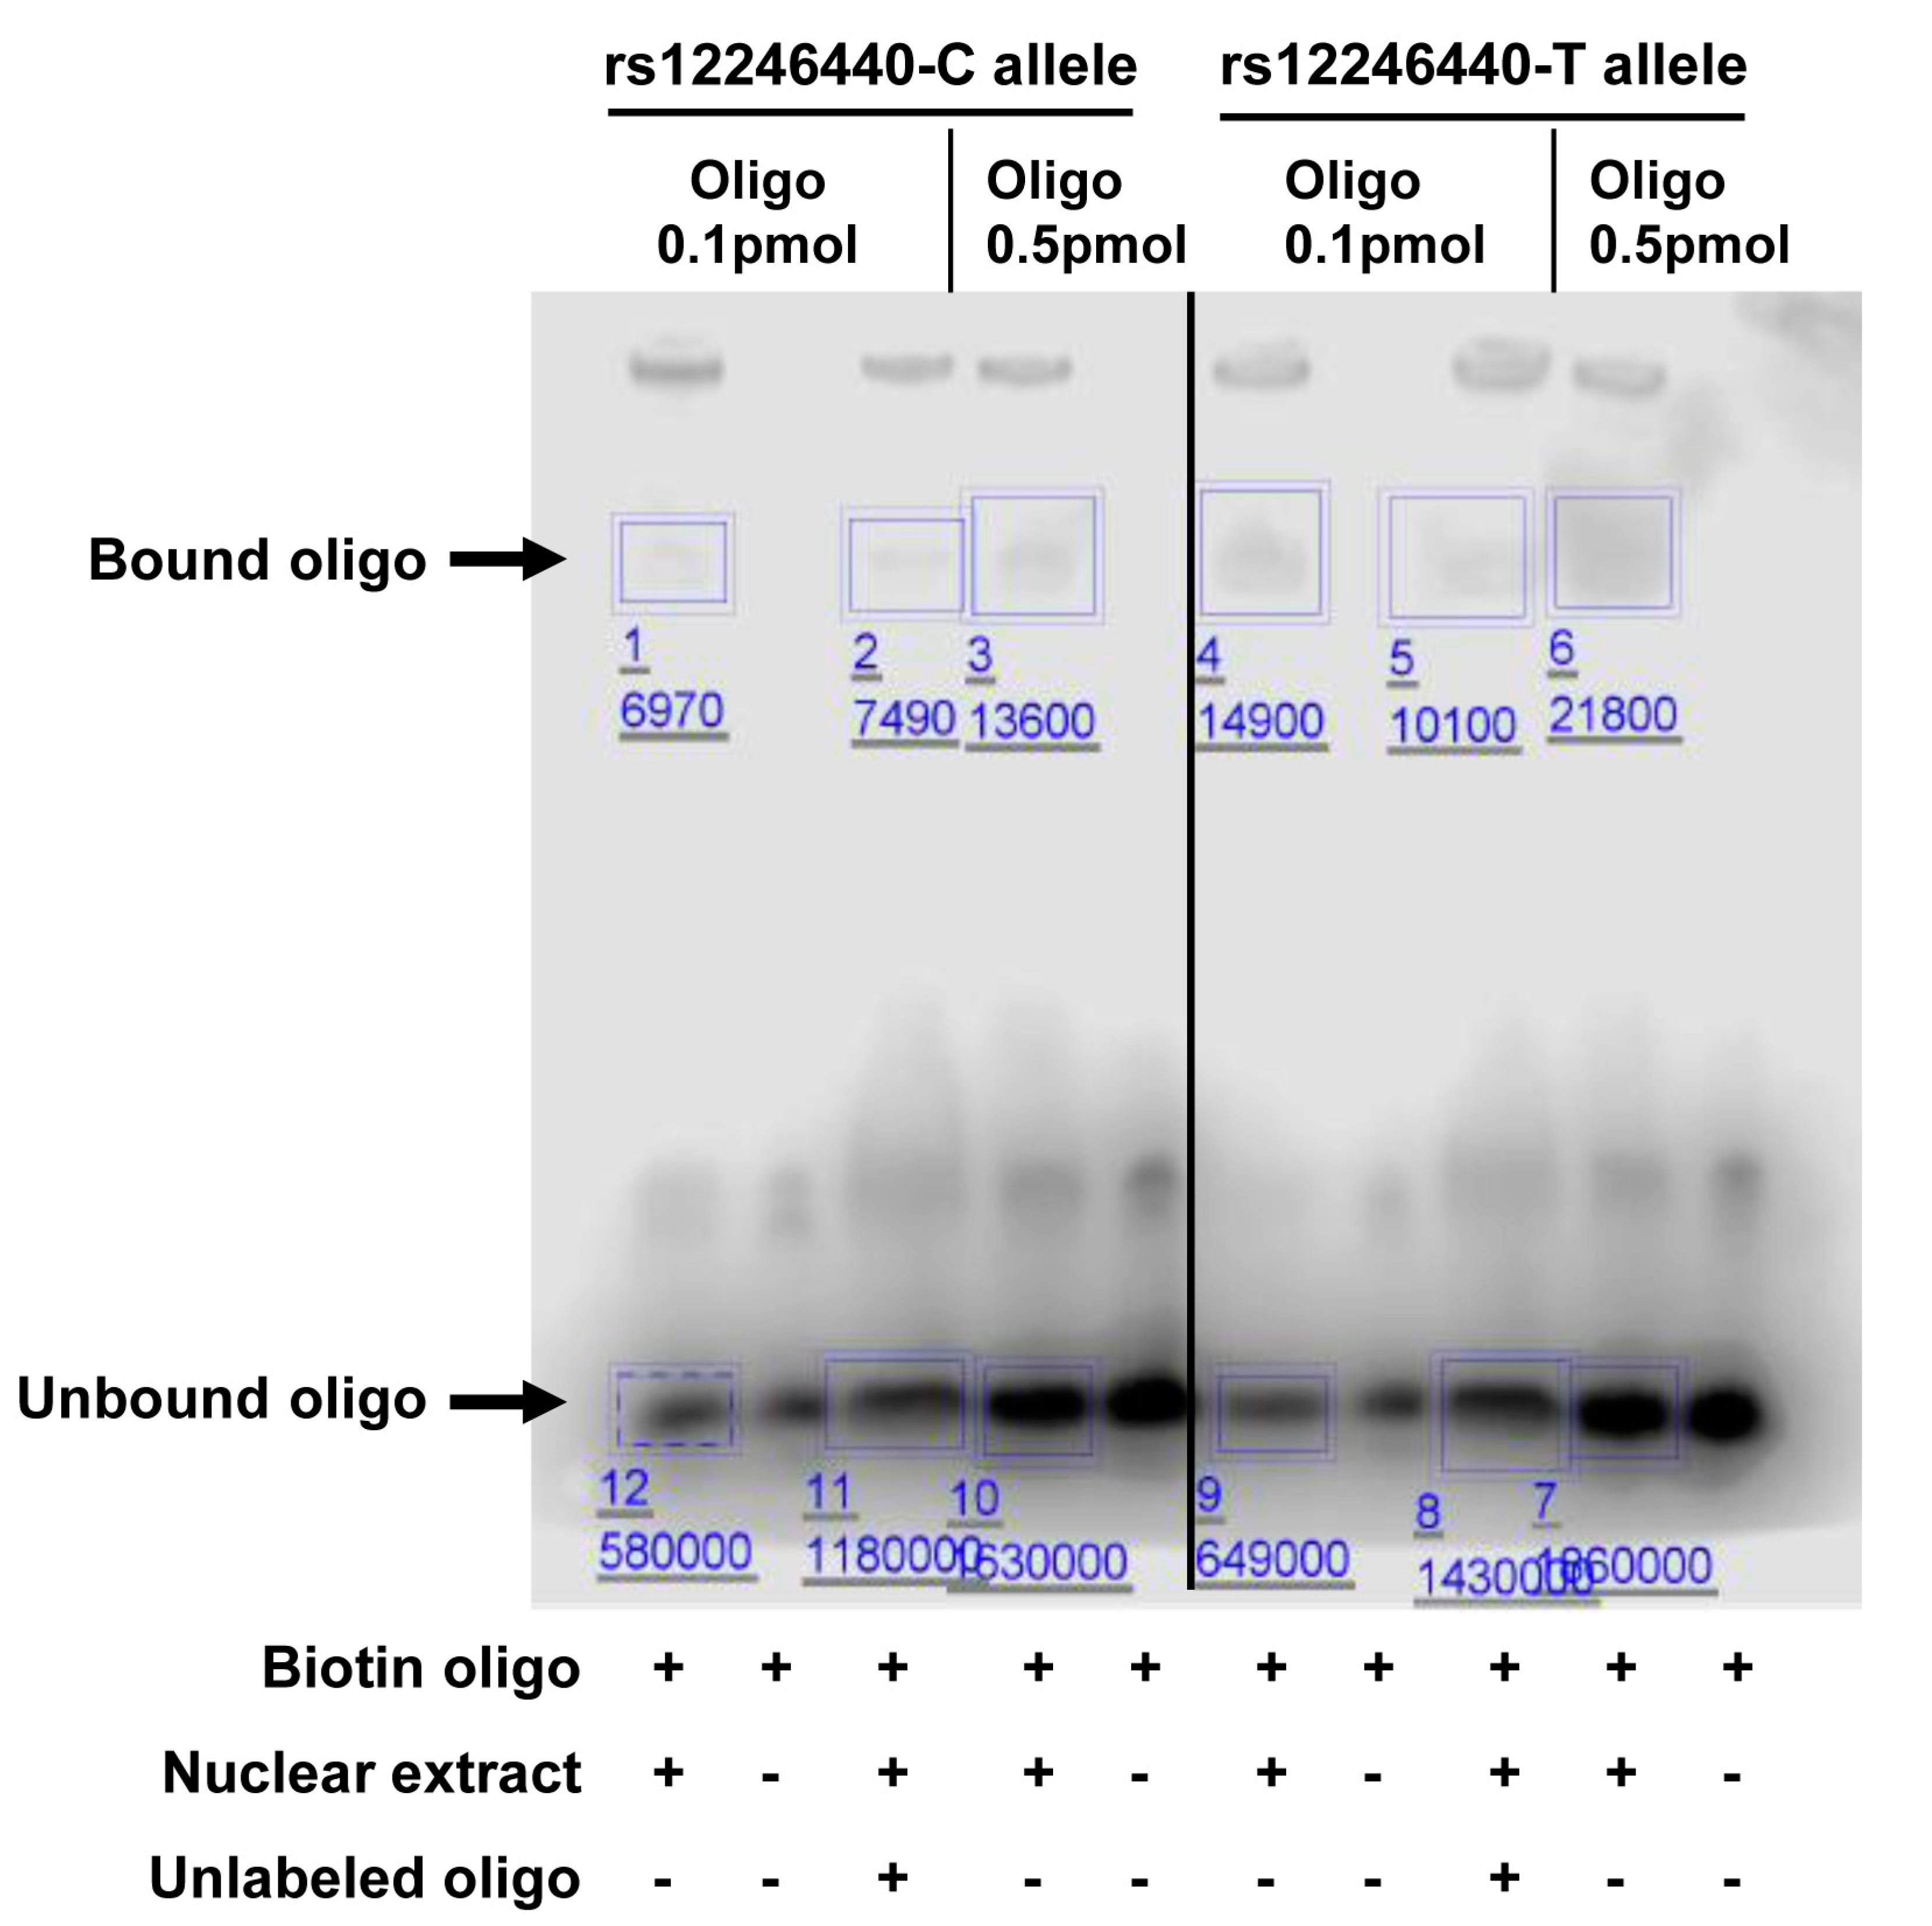
Figure 6.
Clinical association of CTBP2 and NCOA4 in TCGA dataset. (a,b) Gene expression difference between normal and prostate cancer were determined using Mann–Whitney test. The upper, middle, and lower bounds of boxes represent the 75th, 50th, and 25th percentile of the values, respectively. The whiskers represent 95th to 5th percentile. (c,d) Association of recurrence-free survival (RFS) with gene expression was evaluated using log-rank test.

Table 1.
Distribution of selected SNPs on 28 regions (36 genes).
| Risk Regions | Genes | SNPs with eQTL Signal | SNPs LD >0.5 | SNPs Selected |
|---|---|---|---|---|
| chr1:205,657,824-205,857,824 | RAB7L1, NUCKS1 | 155 | 40 | 40 |
| chr2:10,610,730-10,810,730 ** | NOL10 | 368 | 286 | 19 |
| chr2:20,788,265-20,988,265 | C2orf43 | 74 | 13 | 13 |
| chr2:85,677,270-85,894,297 | GGCX | 19 | 19 | 19 |
| chr2:238,287,228-238,543,226 ** | MLPH | 383 | 255 | 9 |
| chr3:87,010,674-87,341,497 | CHMP2B | 73 | 17 | 17 |
| chr4:95,414,609-95,662,877 | BMPR1B | 225 | 166 | 166 |
| chr5:1,795,829-1,995,829 * | IRX4 | 71 | 12 | 71 |
| chr6:41,436,427-41,636,427 | FOXP4 | 54 | 43 | 43 |
| chr6:76,395,882-76,595,882 | MYO6 | 171 | 63 | 63 |
| chr6:153,341,079-153,541,079 | RGS17 | 330 | 76 | 76 |
| chr7:97,716,327-97,916,327 | BHLHA15, LMTK2 | 304 | 75 | 75 |
| chr10:51,424,971-51,649,496 | NCOA4, MSMB | 156 | 135 | 135 |
| chr10:126,596,872-126,796,872 * | CTBP2 | 99 | 25 | 99 |
| chr11:2,133,574-2,333,574 * | ASCL2 | 53 | 53 | 53 |
| chr11:102,301,661-102,501,661 | MMP7 | 69 | 3 | 3 |
| chr12:48,138,757-48,519,618 | COL2A1 | 15 | 15 | 15 |
| chr12:53,173,904-53,373,904 | KRT8, KRT18 | 62 | 49 | 49 |
| chr12:114,585,571-114,785,571 | TBX5 | 3 | 3 | 3 |
| chr14:61,022,526-61,222,526 ** | C14orf39 | 445 | 243 | 2 |
| chr17:518,965-718,965 | VPS53, FAM57A, GEMIN4 | 513 | 60 | 60 |
| chr17:35,974,979-36,201,156 * | HNF1B | 21 | 18 | 21 |
| chr19:38,635,613-38,835,613 | PPP1R14A | 278 | 17 | 17 |
| chr19:41,885,587-42,085,624 | PCAT19 | 50 | 20 | 20 |
| chr20:62,262,563-62,462,563 | LIME1, ZGPAT | 105 | 104 | 104 |
| chrX:9,714,135-9,914,135 | SHROOM2, GPR143 | 62 | 40 | 40 |
| chrX:51,110,057-51,341,672 ** | NUDT11 | 1226 | 362 | 2 |
| chrX:70,307,983-70,507,983 | GJB1 | 59 | 40 | 40 |
| Total SNPs | 5443 | 2252 | 1274 |
Notes: * all significant eQTL SNPs were selected in these regions. ** only SNPs with ChIP-seq (chromatin immunoprecipitation sequencing) signal were selected in these regions. LD: linkage disequilibrium.
Table 2.
Comparison of EMSA with SNPs-seq for rs12246440.
| Oligo Amount | Bound/Unbound oligo | C/T Ratio | ||
|---|---|---|---|---|
| C Allele | T Allele | |||
| EMSA | 0.1 pmol | 0.012 | 0.023 | 0.522 |
| 0.5 pmol | 0.008 | 0.012 | 0.667 | |
| SNPs-seq (DHT) | 0.400 | |||
| SNPs-seq (ETH) | 0.378 | |||
© 2019 by the authors. Licensee MDPI, Basel, Switzerland. This article is an open access article distributed under the terms and conditions of the Creative Commons Attribution (CC BY) license (http://creativecommons.org/licenses/by/4.0/).
Share and Cite
MDPI and ACS Style
Zhang, P.; Tillmans, L.S.; Thibodeau, S.N.; Wang, L. Single-Nucleotide Polymorphisms Sequencing Identifies Candidate Functional Variants at Prostate Cancer Risk Loci. Genes 2019, 10, 547. https://doi.org/10.3390/genes10070547
AMA Style
Zhang P, Tillmans LS, Thibodeau SN, Wang L. Single-Nucleotide Polymorphisms Sequencing Identifies Candidate Functional Variants at Prostate Cancer Risk Loci. Genes. 2019; 10(7):547. https://doi.org/10.3390/genes10070547
Chicago/Turabian StyleZhang, Peng, Lori S. Tillmans, Stephen N. Thibodeau, and Liang Wang. 2019. "Single-Nucleotide Polymorphisms Sequencing Identifies Candidate Functional Variants at Prostate Cancer Risk Loci" Genes 10, no. 7: 547. https://doi.org/10.3390/genes10070547
Note that from the first issue of 2016, this journal uses article numbers instead of page numbers. See further details here.