Article

Landscape of Overlapping Gene Expression in The Equine Placenta

1
Faculty of Veterinary Medicine, Ghent University, B-9820 Merelbeke, Belgium
2
Gluck Equine Research Center, Department of Veterinary Science, University of Kentucky, Lexington, KY 40546, USA
3
Theriogenology Department, Faculty of Veterinary Medicine, University of Mansoura, Mansoura City 35516, Egypt
4
Louisiana Animal Disease Diagnostic Laboratory and Department of Pathobiological Sciences, School of Veterinary Medicine, Louisiana State University, Baton Rouge, LA 70803, USA
5
Department of Biomedical and Diagnostic Sciences, College of Veterinary Medicine, University of Tennessee, Knoxville, TN 37996, USA
6
Department of Biochemistry and Molecular Genetics, University of Louisville, Louisville, KY 40202, USA
*
Author to whom correspondence should be addressed.
Genes 2019, 10(7), 503; https://doi.org/10.3390/genes10070503
Submission received: 21 May 2019 / Revised: 26 June 2019 / Accepted: 28 June 2019 / Published: 2 July 2019
(This article belongs to the Special Issue Equine Genetics)

Abstract

:
Increasing evidence suggests that overlapping genes are much more common in eukaryotic genomes than previously thought. These different-strand overlapping genes are potential sense–antisense (SAS) pairs, which might have regulatory effects on each other. In the present study, we identified the SAS loci in the equine genome using previously generated stranded, paired-end RNA sequencing data from the equine chorioallantois. We identified a total of 1261 overlapping loci. The ratio of the number of overlapping regions to chromosomal length was numerically higher on chromosome 11 followed by chromosomes 13 and 12. These results show that overlapping transcription is distributed throughout the equine genome, but that distributions differ for each chromosome. Next, we evaluated the expression patterns of SAS pairs during the course of gestation. The sense and antisense genes showed an overall positive correlation between the sense and antisense pairs. We further provide a list of SAS pairs with both positive and negative correlation in their expression patterns throughout gestation. This study characterizes the landscape of sense and antisense gene expression in the placenta for the first time and provides a resource that will enable researchers to elucidate the mechanisms of sense/antisense regulation during pregnancy.

1. Introduction

Overlapping genes were initially thought to be only common in viruses (both DNA and RNA viruses), bacteria, mitochondria, and plasmids [1,2,3,4]. However, over the last few years, this view has changed with studies demonstrating the existence of many overlapping loci in human and murine genomes [5,6,7,8]. Since both strands of DNA are used for transcription, two main types of overlap are possible: (1) The same-strand overlap in which the two genes involved are transcribed from the same strand and (2) the opposite-strand overlap (bi-directional transcription) in which the two genes are transcribed from different strands of the same locus [6,8]. These different-strand overlapping types constitute the potential sense-antisense (SAS) gene pairs.
The SAS gene pair is defined as two genes located on opposite genomic strands within the same locus [7,9,10]. Each antisense RNA may potentially base-pair with its complementary ‘sense’ RNA, regulating the gene expression of one another at the level of transcription, mRNA processing, splicing, or translation, among others [11,12,13,14]. Recent high-throughput transcriptome studies have revealed widespread and extensive numbers of SAS pairs in the human and murine genome [12,15,16,17,18,19]. To date, it is known that SAS pairs consist of both coding and non-coding genes, and are fundamental for the normal physiological function of cells [7,12]. Moreover, with the advances of high-throughput sequencing, it has been shown that dysregulated antisense transcript expression plays a critical role in the pathology of multiple cancers [20,21,22,23]. Currently, despite the successful assembly of the equine genome [24,25], no information is available about SAS gene expression in the equine genome. Thus, the bidirectional transcription in the equine genome needs further characterization.
Several mechanisms have been proposed for SAS interactions, including competition between antisense and sense genes over transcription factors, post-transcriptional regulation by directly blocking the binding of factors to the target transcript, or by recruiting factors that alter downstream expression [16]. These reciprocal interactions between SAS are expressed in the genome as widespread synergistic co-expression (non-random) of sense and antisense transcripts [26,27,28]. However, there are examples of SAS loci where the antisense gene downregulates expression of the sense gene [29]. In this scenario, an inverse correlation in the expression patterns of SAS is also relevant.
Currently, there is no information available on the genome wide expression patterns of SAS pairs in the mammalian placenta. In order to investigate SAS pairs expression in placenta, the fetal component of the placenta (without maternal endometrial contamination) is required. Obtaining such samples is an obstacle in species such as human and mouse with hemochorial placentation, which have a complex association between maternal and fetal cellular components [30]. In contrast to the human and mouse, the horse has an epitheliochorial placentation in which both the endometrial epithelium and the epithelium of the chorionic villi are juxtaposed with minimal extension into the uterine mucosa. Therefore, the fetal component of the placenta (chorioallantoic membrane) can be separated from the endometrium with negligible contamination by maternal cellular components. Thus, it provides an optimal model for the investigation of SAS gene expression in placentas.
Here, we hypothesized that, similar to the human and murine genome, the equine genome also harbors several SAS loci. We further hypothesized that there would be non-random positive or negative correlation in the expression patterns of SAS pairs. Stranded and paired-end RNA sequencing (RNA-seq) studies allow an unbiased genome-wide analysis of the transcriptome to elucidate the presence of SAS loci in the equine genome. Our aim was to identify the opposite-strand, overlapping genes, which are expressed in equine chorioallantois, and also to identify SAS pairs which showed negative or positive correlation in their expression patterns throughout gestation. Therefore, we utilized RNA sequencing data from equine chorioallantoic membrane (CA) [31], to identify the opposite-strand, overlapping genes. Additionally, we analyzed the expression patterns of identified SAS pairs in the chorioallantois during the course of equine gestation.

2. Methods

The raw read files (fastq) of a previously generated, strand-specific RNA sequencing dataset from equine chorioallantois during different stages of gestation (45 days, four, six, and ten months; four samples per time point, GSE108279) were obtained from the National Center for Biotechnology Information (NCBI) database [31]. The reads were initially trimmed for adapters and quality using TrimGalore Version 0.4.4 (Babraham Bioinformatics, Cambridge, UK). Next, the reads were mapped to the equine genome (EquCab 3.0) using STAR (Release 2.5.2b) allowing a maximum of five mismatches [32]. The mapped reads were then phased based upon the strand of transcription (termed Sense and Antisense strands) using SAMtools Version 1.3.1 [33]. Each strand was annotated (-g) using the equine reference transcriptome available in NCBI database (EquCab3.0; GCF_002863925.1, gff-spec-version 1.21, downloaded on March 2018) using Cufflinks (Release 2.2.1; http://cole-trapnell-lab.github.io/cufflinks/) [34], generating 32 samples (16 sense and 16 antisense). The start and end positions for each gene were identified and the overlap between the location of the gene in sense and antisense strands was identified using an in-house program written in java. The correlation was analyzed using Spearman correlation in JMP13 Pro statistical analysis software (SAS Institute, Cary, NC, USA), and the heatmaps were built using Package ‘d3heatmap’ in R [35]. Significant level was set at corrected p-value < 0.05 (using the Benjamini-Hochberg correction by ’p.adjust’ function in R). Gene ontology analysis performed using the protein analysis through evolutionary relationships classification system (PANTHER; Release 13.1) [36]. PANTHER classification system was used to functionally annotate genes based on gene ontology (biological process).

3. Results and Discussion

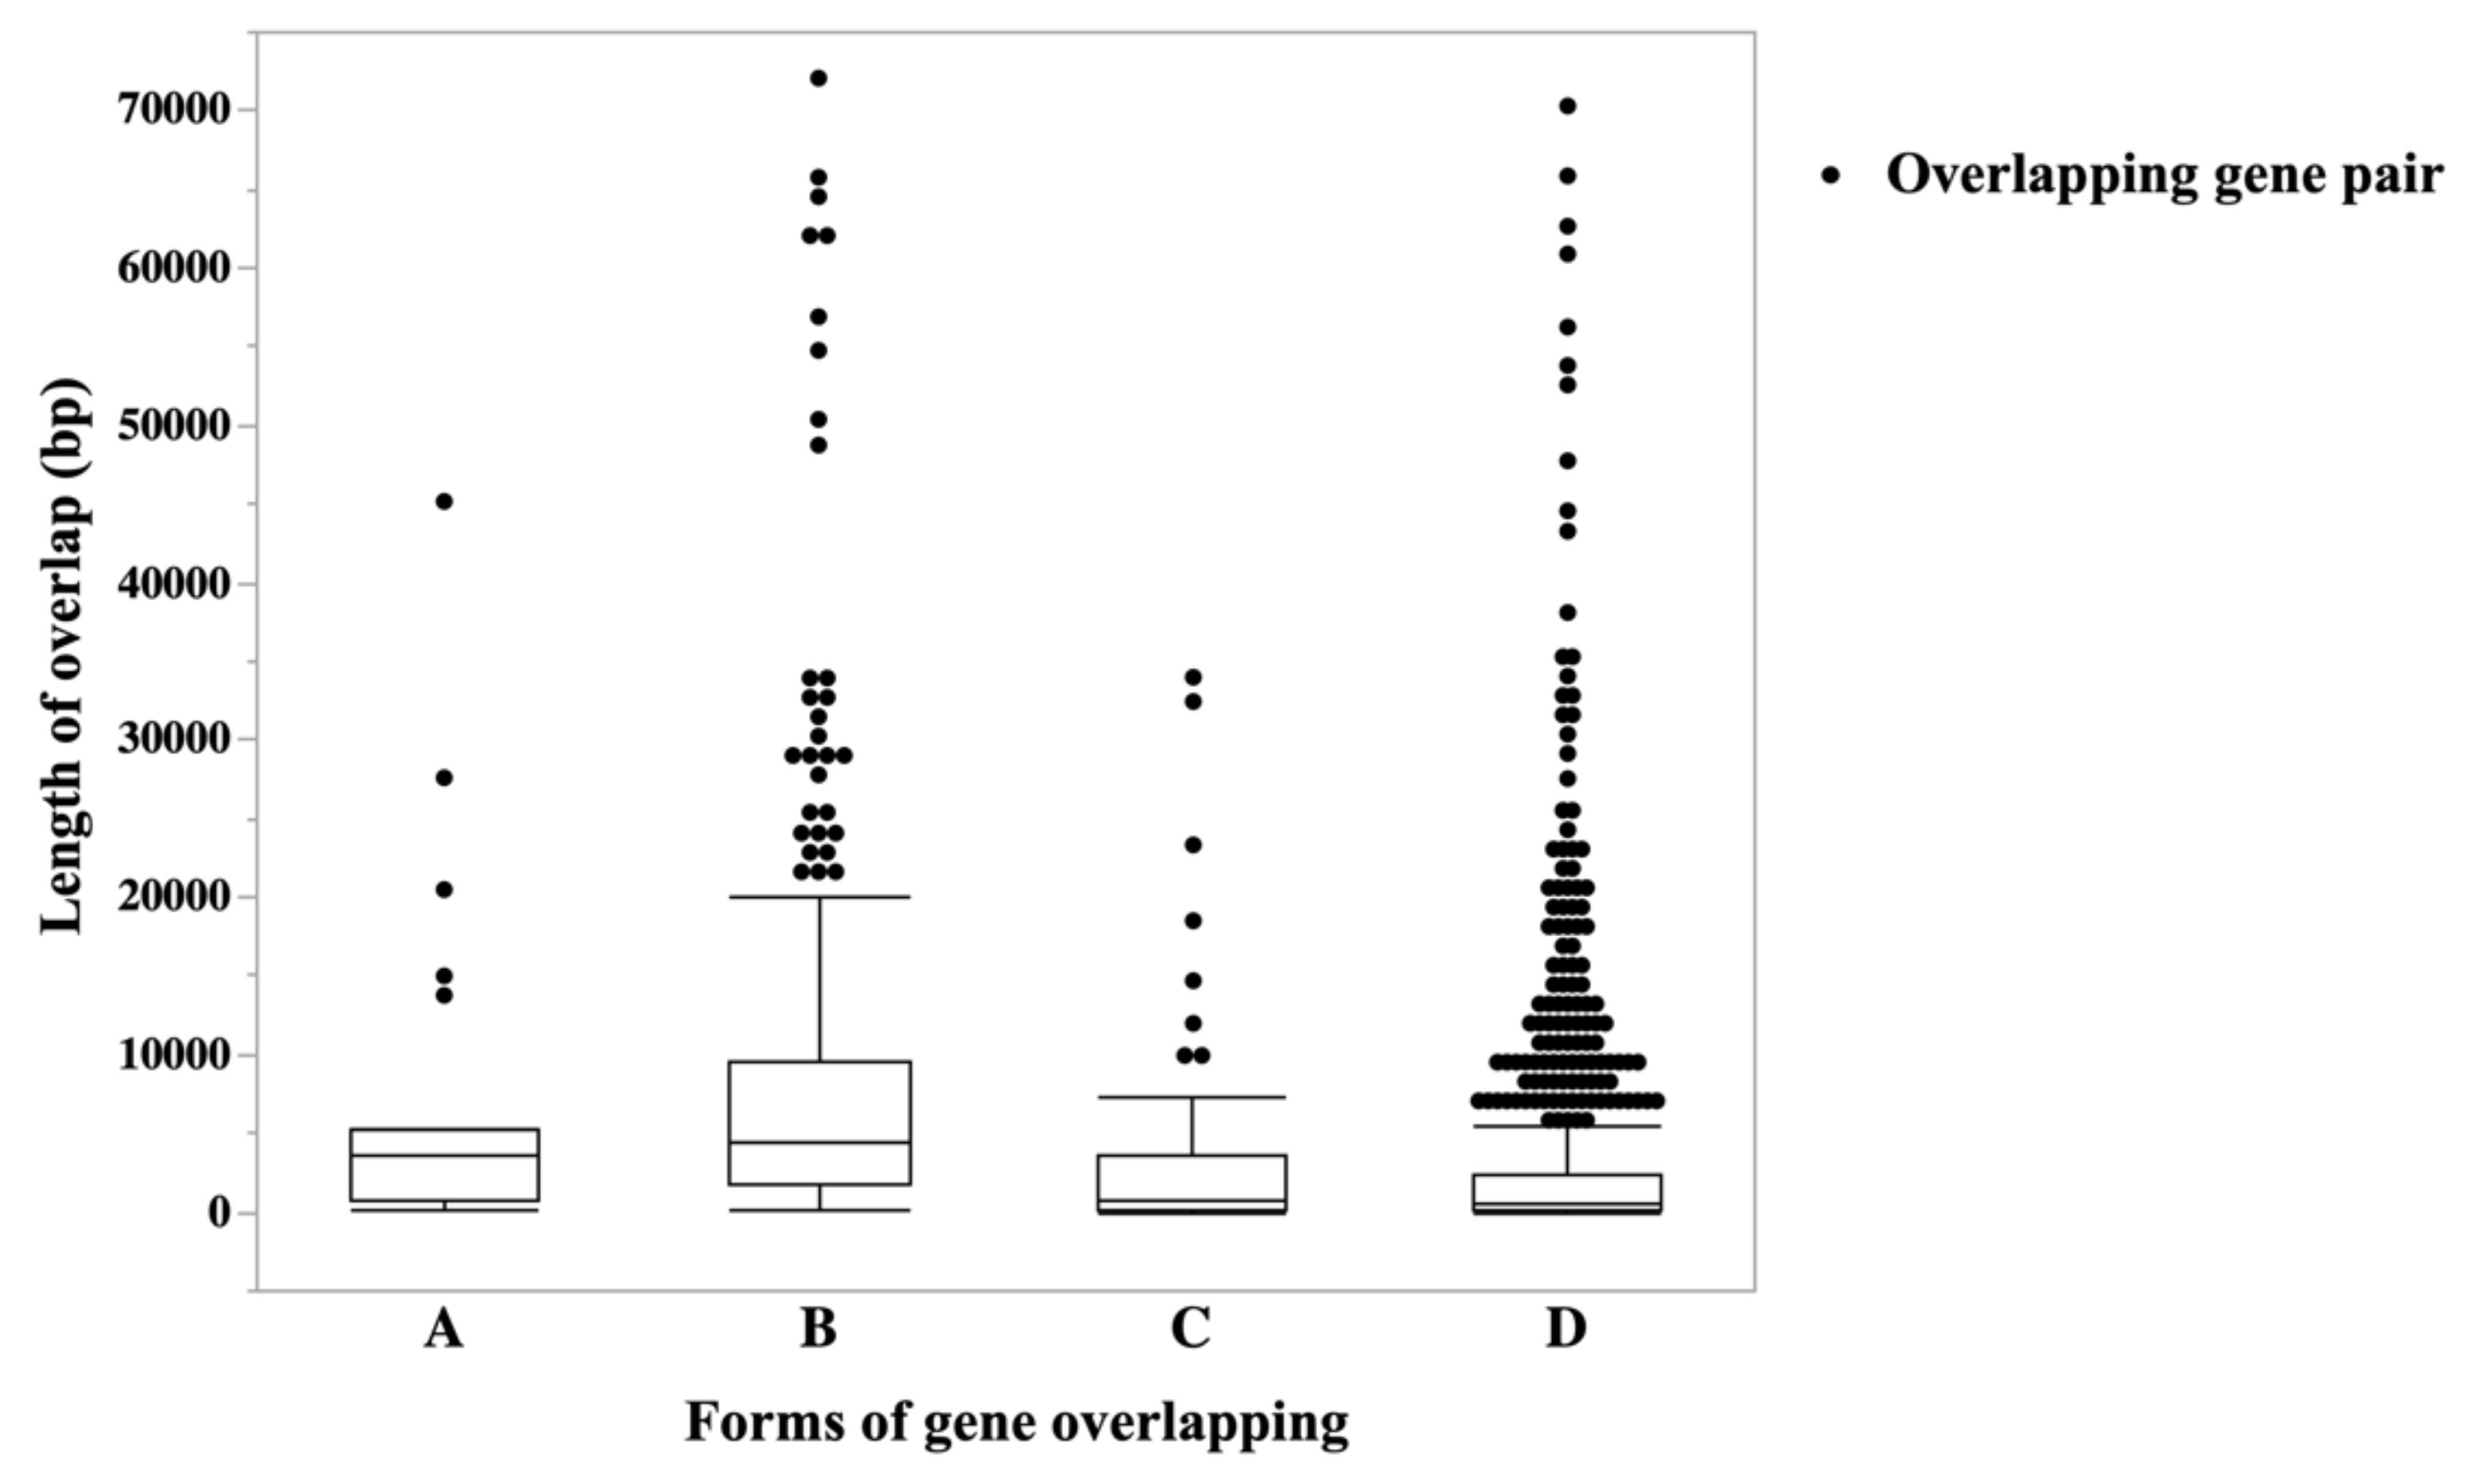
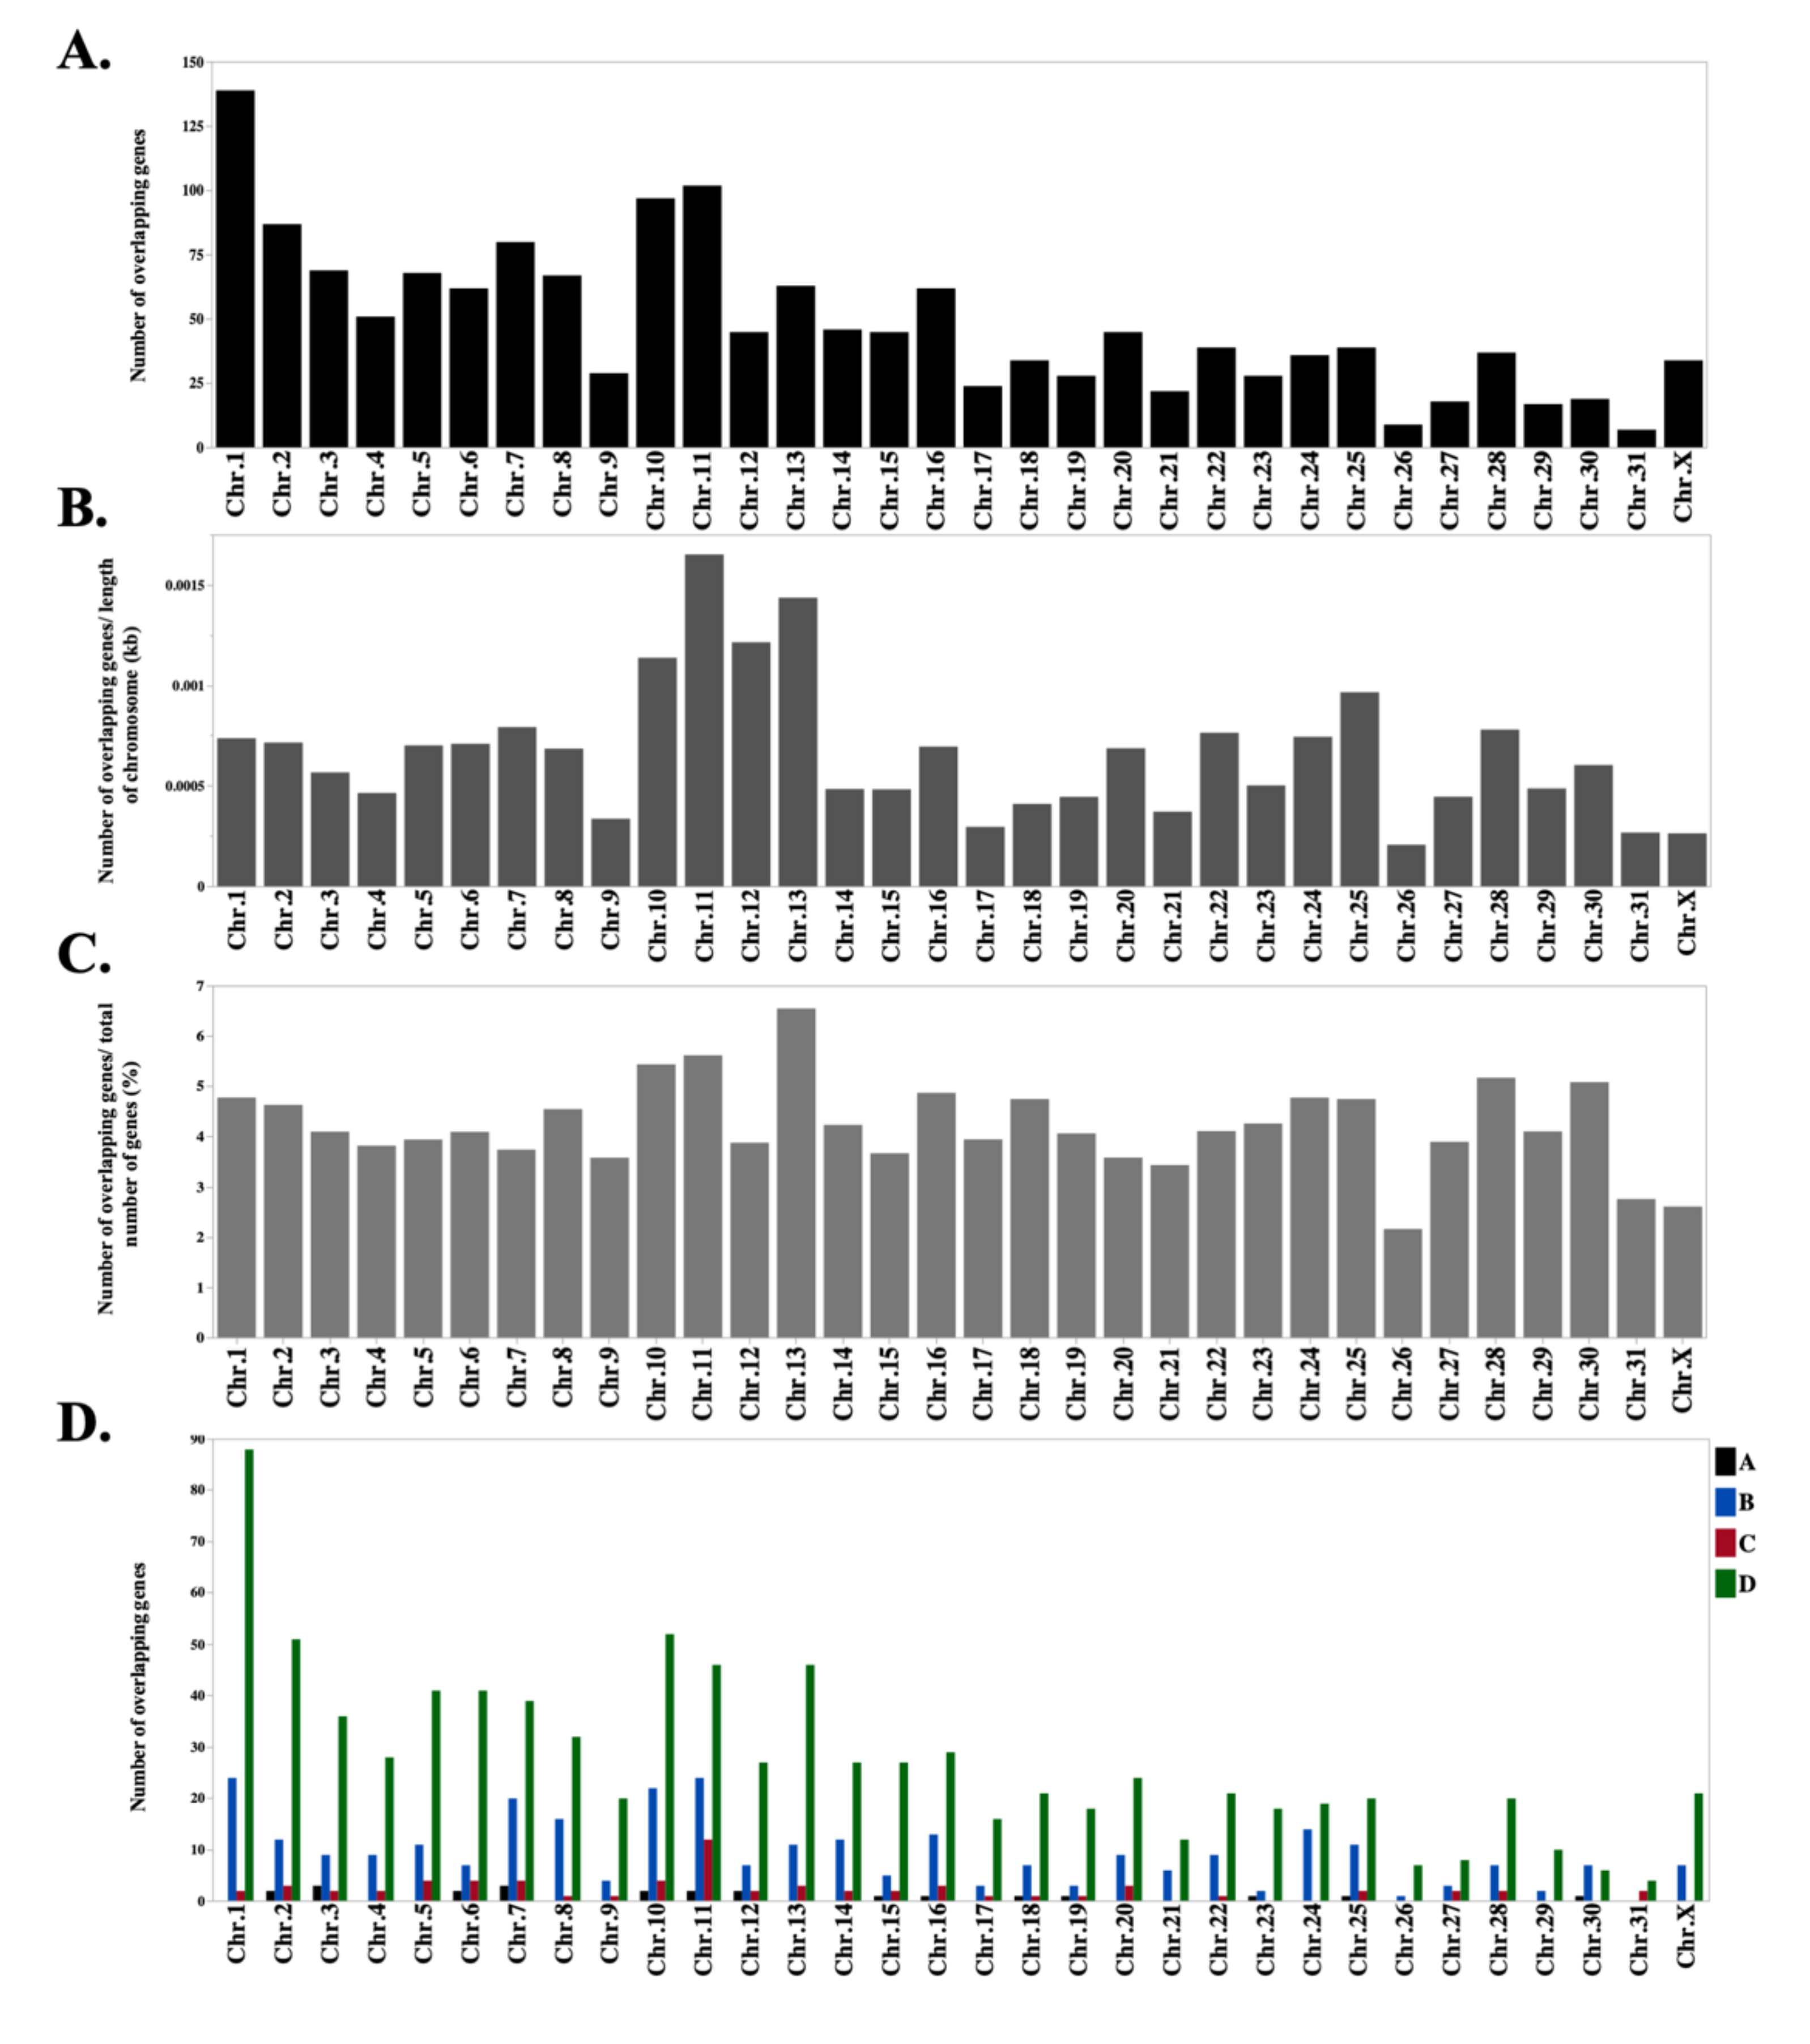
3.1. Identification and Grouping of Overlapping Genes in Placental Transcripts

In this study, we used previously generated strand-specific RNA sequencing on 16 CA samples [31] to determine the global landscape of opposite-strand overlapping gene expression during the course of equine gestation. On average, 22.59 ± 1.3 × 10⁶ read pairs were obtained per sample (Supplementary Materials Table S1), and 91 ± 1% of the reads were uniquely mapped to the horse genome (EquCab3.0). Mapped RNA reads were phased based upon the strand of transcription and were annotated using the existing Equus caballus reference transcriptome (EquCab 3.0, National Center for Biotechnology Information (NCBI)) as the guide. The annotated data consist of ~30,300 genes, including protein coding genes (n = 21,113), lncRNA (n = 6787), and miRNA (n = 680), among others (Supplementary Materials Table S2). The overlapping of genes from the opposite strand were identified using an in-house program written in java. We further grouped the overlapping genes to four different categories: (A) Embedded (Antisense gene is fully embedded within the Sense gene); (B) embedded (Sense gene is fully embedded within the Antisense gene); (C) tail-to-tail (3′-region overlap); (D) head-to-head (5′-region overlap) (Figure 1). Using this information, we developed a bioinformatics workflow to characterize the overlapping gene expression.

3.2. Overlapping Gene Expression Across The Equine Transcriptome

A total of 1261 overlapping genes (~4% of annotated genes) were identified among all the analyzed samples (Supplementary Materials Table S3). This number is similar to the 1210 genes that represent the total number of SAS pairs expressed in the human genome [37]. In another study, a total of 615 and 497 different-strand overlapping pairs were identified in both human and mouse genomes, respectively [6]. It is noteworthy that the numbers of overlapping pairs represent approximately 10% of annotated genes. The overall median length of overlap was 985 bp (1 and 72,094 bp; minimum and maximum, respectively (Figure 2 and Supplementary Materials Table S3)). In total, 15 detected overlapping pairs had an overlap of only 1 bp. Further, we demonstrated that the head-to-head (D; ~70%) form of overlap was the most common SAS pairing, followed by embedded (A and B; ~25%) and tail-to-tail (C; ~5%) forms. This was similar to the finding of Sanna et al., in which majority of the overlap in human and murine genomes were head-to-head (D: ~50%), followed by embedded (A and B; ~29%), and tail-to-tail forms (C; ~21%) [6]. We, however, found a lower number of tail-to-tail overlap in our dataset. These analyses depend on accurate annotation of the length of the 3’ end of the gene. Annotation engines will mask regions of low complexity resulting in artificially short 3’ ends.
The ratio of the length of overlap (bp) to the length of sense/antisense gene (bp) was calculated (Table 1). The median percentage of overlap length in relation to the length of the gene in the sense strand was 7.0% and to the gene in the antisense strand was 7.5%. To check the distribution of SAS on equine chromosomes, we further identified the number of overlapping genes on each chromosome (Figure 3A). We also normalized the number of overlapping genes on each chromosome to the length of the respective chromosome (Figure 3B). As shown in Figure 3B, the number of overlapping genes was numerically higher on chromosome 11 (ECA11), followed by ECA13 and ECA12; ECA11 harbors 7.8% of all overlapping pairs and 6.8% and 5.7% of overlapping pairs were located on ECA13 and ECA12. We further calculated the ratio (%) for the number of overlapping genes to the number of annotated genes on each chromosome (Figure 3C). The ratio of overlapping gene was numerically higher on ECA13 followed by ECA11 and ECA10 than the other chromosomes. Moreover, a similar distribution of the different forms of overlap was observed within equine chromosomes (Figure 3D).

3.3. Widespread Correlation Between Sense and Antisense Gene Expression

In the next step, we identified the biotypes of the overlapping genes in our dataset. The majority of overlapping gene interactions (SAS) were mRNA:mRNA (protein coding; 47%), followed by mRNA:lnc-RNA(~44%), and lnc-RNA:lnc-RNA (~4.7%) (Table 2). To investigate the interaction between the expression patterns of these SAS pairs, their expression patterns were analyzed throughout the course of gestation. In general, there was a numerical slight skew in the expression pattern toward antisense strand, and the sense strand showed an overall lower expression than the antisense strand (median of antisense expression/sense expression n = 1.19; Figure 4). A pronounced skew was observed in the gene expression pattern in human cancers, in which one strand had two to three orders of magnitude lower expression than the opposite strand [38]. The physiology behind this phenomenon need to be elucidated in future studies.
To demonstrate the dynamics of SAS pairs throughout pregnancy, the expression of these genes was evaluated at 45 days, four, six, and ten months of the equine gestation. The overall expression pattern of all the overlapping pairs suggested an interaction between the sense and antisense strands (Figure 5). Next, to reduce the bias in the correlation study between the sense and antisense strands, in subsequent analyses, we only proceeded with the SAS pairs, which were expressed in at least 26 samples (32 samples in total; 16 CA samples, each divided as sense strand and antisense strand). In total, 303 mRNA:mRNA, 144 mRNA:lnc-RNA, 6 lnc-RNA:lnc-RNA, and 1 mRNA:misc-RNA were used in the correlation study (454 genes in total). A systematic characterization of all sense and antisense loci expression revealed an overall positive correlation between sense/antisense genes, with an average Spearman correlation coefficient of 0.29 ± 0.21 and median of 0.24. This correlation is greater than what would be expected by chance, and was also greater than the correlation obtained between random genes on different strands [38]. This positive correlation in the expression patterns of SAS pairs is consistent with the usage of bidirectional promoters that are shared by ∼10% of protein-coding genes, which results in the co-expression of sense and antisense genes [12,31,37]. Among SAS gene pairs, expression of 34 SAS showed significant positive correlation during gestation, while eight SAS showed significant negative correlation in their expression patterns (Table 3). We further performed gene ontology analysis of genes from sense and antisense strand using the protein analysis through evolutionary relationships classification system (PANTHER; Release 13.1) [36]. In general, our predicted biological process analysis demonstrated that genes from both sense and antisense strands were involved in similar processes, with cellular and metabolic processes being the most represented (Figure 6). This is indicative of the importance of these overlap regions in the normal function of cells and tissues. The purpose of this study was to identify the SAS pairs in the equine genome as expressed in equine chorioallantois. This study constitutes a comprehensive assessment of transcription originating from the sense and antisense expression in the fetal placenta. The physiological function of these SAS pairs remains to be elucidated in future studies.

4. Conclusions

Overall, our study contributes to a growing body of literature related to the presence of opposite-strand gene transcription by providing a list of overlapping loci in the equine genome. Furthermore, this study characterizes the landscape of SAS expression in equine pregnancy and provides additional information regarding the interaction between sense and antisense genes throughout gestation. This study will provide a resource that will enable researchers to elucidate the mechanisms of sense/antisense regulation during pregnancy.

Supplementary Materials

The following are available online at https://www.mdpi.com/2073-4425/10/7/503/s1, Table S1: Read counts and mapping quality of Illumina RNA-sequencing dataset from placenta at different stages of equine pregnancy (GSE108279; mapped to Ecab3.0), Table S2: The list of annotated genes and their expression values (FPKM) for forward and reverse genes in CA at different stages of pregnancy, Table S3: The list of all overlapping genes along with the forms of overlapping and their biotypes.

Author Contributions

P.D. (Pouya Dini) designed the study, performed the bioinformatic and statistical analyses, wrote the manuscript, and prepared figures and tables. J.N. assisted with bioinformatic analyses and revised the manuscript. H.E.-S.A. contributed to the study design and the revision of the manuscript. S.C.L. provided help with the study design and contributed to the revision of the manuscript. M.C. provided help with the study design and revised the manuscript. A.E.-V. provided help with the study design and edited the manuscript. E.B. oversaw the project and revised the manuscript. T.K. wrote the in-house java programs, provided help in the study design, and revised the manuscript. P.D. (Peter Daels) oversaw the entire project, including acquisition of funding (BOF), experimental design, statistical analysis and revised the manuscript. BAB oversaw the entire project, including the acquisition of funding (the Albert G. Clay Endowment), statistical analysis, manuscript writing, and submission. All authors read and approved the final manuscript.

Funding

This work was funded by the Special Research Fund (BOF) at Ghent University, the Albert G. Clay Endowment, the Clay Visiting Scholar fellowship and the Paul Mellon Postdoctoral fellowship at the University of Kentucky.

Conflicts of Interest

The authors declare that they have no competing interests.

References

  1. Zackary, I.Z.; Chisholm, S.W. Properties of overlapping genes are conserved across microbial genomes. Genome Res. 2004, 11, 2268–2272. [Google Scholar]
  2. Barrell, B.G.; Air, G.M.; Hutchison, C.A., III. Overlapping genes in bacteriophage Φx174. Nature 1976, 264, 34. [Google Scholar] [CrossRef] [PubMed]
  3. Normark, S.; Bergström, S.; Edlund, T.; Grundström, T.; Jaurin, B.; Lindberg, F.P.; Olsson, O. Overlapping genes. Ann. Rev. Gene. 1983, 17, 499–525. [Google Scholar] [CrossRef]
  4. Lamb, R.A.; Horvath, C.M. Diversity of coding strategies in influenza viruses. Trends Genet. 1991, 7, 261–266. [Google Scholar] [CrossRef]
  5. Vamsi, V.; Makalowski, W.; Galdzicki, M.; Sood, R.; Makalowska, I. Mammalian overlapping genes: The comparative perspective. Genome Res. 2004, 14, 280–286. [Google Scholar]
  6. Sanna, C.R.; Li, W.-H.; Zhang, L. Overlapping genes in the human and mouse genomes. BMC Genom. 2008, 9, 169. [Google Scholar] [CrossRef]
  7. Wood, E.J.; Kwanrutai, C.-I.; Jia, H.; Lipovich, L. Sense-antisense gene pairs: Sequence, transcription, and structure are not conserved between human and mouse. Front. Genet. 2013, 4, 183. [Google Scholar] [CrossRef]
  8. Nakayama, T.; Asai, S.; Takahashi, Y.; Maekawa, O.; Kasama, Y. Overlapping of genes in the human genome. Int. J. Biomed. Sci. IJBS 2007, 3, 14. [Google Scholar]
  9. Pelechano, V.; Steinmetz, L.M. Gene regulation by antisense transcription. Nat. Rev. Genet. 2013, 14, 88. [Google Scholar] [CrossRef]
  10. Guil, S.; Esteller, M. Cis-acting noncoding rnas: Friends and foes. Nat. Struct. Mol. Biol. 2012, 19, 1068. [Google Scholar] [CrossRef]
  11. Boi, S.; Solda, G.; Tenchini, M.L. Shedding light on the dark side of the genome: Overlapping genes in higher eukaryotes. Curr. Genom. 2004, 5, 509–524. [Google Scholar] [CrossRef]
  12. Zinad, H.S.; Natasya, I.; Werner, A. Natural antisense transcripts at the interface between host genome and mobile genetic elements. Front. Microbiol. 2017, 8, 2292. [Google Scholar] [CrossRef]
  13. Murray, S.C.; Haenni, S.; Howe, F.C.; Fischl, H.; Chocian, K.; Nair, A.; Mellor, J. Sense and antisense transcription are associated with distinct chromatin architectures across genes. Nucl. Acids Res. 2015, 43, 7823–7837. [Google Scholar] [CrossRef] [Green Version]
  14. Morrissy, A.S.; Griffith, M.; Marra, M.A. Extensive relationship between antisense transcription and alternative splicing in the human genome. Genome Res. 2011, 21, 1203–1212. [Google Scholar] [CrossRef] [Green Version]
  15. Shendure, J.; Church, G.M. Computational discovery of sense-antisense transcription in the human and mouse genomes. Genome Biol. 2002, 3, research0044.1–research0044.14. [Google Scholar] [CrossRef]
  16. Munroe, S.H.; Zhu, J. Overlapping transcripts, double-stranded RNA and antisense regulation: A genomic perspective. Cell. Mol. Life Sci. CMLS 2006, 63, 2102–2118. [Google Scholar] [CrossRef]
  17. Lehner, B.; Williams, G.; Campbell, R.D.; Sanderson, C.M. Antisense transcripts in the human genome. Trends Genet. 2002, 18, 63–65. [Google Scholar] [CrossRef]
  18. Fahey, M.E.; Moore, T.F.; Higgins, D.G. Overlapping antisense transcription in the human genome. Int. J. Genom. 2002, 3, 244–253. [Google Scholar] [CrossRef]
  19. Katayama, S.; Tomaru, Y.; Kasukawa, T.; Waki, K.; Nakanishi, M.; Nakamura, M.; Nishida, H.; Yap, C.C.; Suzuki, M.; Kawa, J. Antisense transcription in the mammalian transcriptome. Science 2005, 309, 1564–1566. [Google Scholar]
  20. Kim, K.; Jutooru, I.; Chadalapaka, G.; Johnson, G.; Frank, J.; Burghardt, R.; Kim, S.; Safe, S. Hotair is a negative prognostic factor and exhibits pro-oncogenic activity in pancreatic cancer. Oncogene 2013, 32, 1616. [Google Scholar] [CrossRef]
  21. Han, Y.; Liu, Y.; Gui, Y.; Cai, Z. Long intergenic non-coding RNA Tug1 Is overexpressed in urothelial carcinoma of the bladder. J. Surg. Oncol. 2013, 107, 555–559. [Google Scholar] [CrossRef] [PubMed]
  22. Silva, J.M.; Boczek, N.J.; Berres, M.V.; Ma, X.; Smith, D.I. lsinct5 is over expressed in breast and ovarian cancer and affects cellular proliferation. RNA Biol. 2011, 8, 496–505. [Google Scholar] [CrossRef] [PubMed]
  23. Schmidt, L.H.; Spieker, T.; Koschmieder, S.; Humberg, J.; Jungen, D.; Bulk, E.; Hascher, A.; Wittmer, D.; Marra, A.; Hillejan, L. The long noncoding malat-1 RNA indicates a poor prognosis in non-small cell lung cancer and induces migration and tumor growth. J. Thorac. Oncol. 2011, 6, 1984–1992. [Google Scholar] [CrossRef] [PubMed]
  24. Kalbfleisch, T.S.; Rice, E.S.; DePriest, M.S.; Walenz, B.P.; Hestand, M.S.; Vermeesch, J.R.; Brendan, L.O.; Fiddes, I.T.; Vershinina, A.O.; Saremi, N.F. Improved reference genome for the domestic horse increases assembly contiguity and composition. Commun. Biol. 2018, 1, 197. [Google Scholar] [CrossRef] [PubMed]
  25. Kalbfleisch, T.S.; Rice, E.S.; De Priest, M.S.; Walenz, B.P.; Hestand, M.S.; Vermeesch, J.R.; Brendan, L.O.; Fiddes, I.T.; Vershinina, A.; Petersen, J.L. Equcab3, an updated reference genome for the domestic horse. bioRxiv, 2018; 306928. [Google Scholar] [CrossRef]
  26. Sun, M.; Hurst, L.D.; Carmichael, G.G.; Chen, J. Evidence for a preferential targeting of 3′-Utrs by Cis-encoded natural antisense transcripts. Nucl. Acids Res. 2005, 33, 5533–5543. [Google Scholar] [CrossRef] [PubMed]
  27. Chen, J.; Miao, S.; Hurst, L.D.; Carmichael, G.G.; Rowley, J.D. Genome-wide analysis of coordinate expression and evolution of human cis-encoded sense-antisense transcripts. Trends Genet. 2005, 21, 326–329. [Google Scholar] [CrossRef]
  28. Engström, P.G.; Suzuki, H.; Ninomiya, N.; Akalin, A.; Sessa, L.; Lavorgna, G.; Brozzi, A.; Luzi, L.; Tan, S.L.; Yang, L. Complex loci in human and mouse genomes. PLoS GENET. 2006, 2, e47. [Google Scholar] [CrossRef]
  29. Ito, M.; Sferruzzi-Perri, A.N.; Edwards, C.A.; Adalsteinsson, S.T.; Allen, S.E.; Loo, T.-H.; Kitazawa, M.; Kaneko-Ishino, T.; Ishino, F.; Stewart, C.L. A trans-homologue interaction between reciprocally imprinted mir-127 and RTL1 regulates placenta development. Development 2015, 142, 2425–2430. [Google Scholar] [CrossRef]
  30. Proudhon, C.; Bourc’his, D. Identification and resolution of artifacts in the interpretation of imprinted gene expression. Brief. Funct. Genom. 2010, 9, 374–384. [Google Scholar] [CrossRef] [Green Version]
  31. Dini, P.; Daels, P.; Loux, S.C.; Esteller-Vico, A.; Carossino, M.; Scoggin, K.E.; Ball, B.A. Kinetics of the chromosome 14 microrna cluster ortholog and its potential role during placental development in the pregnant mare. BMC Genom. 2018, 19, 954. [Google Scholar] [CrossRef]
  32. Dobin, A.; Davis, C.A.; Schlesinger, F.; Drenkow, J.; Zaleski, C.; Jha, S.; Batut, P.; Chaisson, M.; Gingeras, T.R. Star: Ultrafast universal RNA-seq aligner. Bioinformatics 2013, 29, 15–21. [Google Scholar] [CrossRef] [PubMed]
  33. Li, H.; Handsaker, B.; Wysoker, A.; Fennell, T.; Ruan, J.; Homer, N.; Marth, V.; Abecasis, G.; Durbin, R. The sequence alignment/map format and samtools. Bioinformatics 2009, 25, 2078–2079. [Google Scholar] [CrossRef] [PubMed]
  34. Trapnell, C.; Williams, B.A.; Pertea, G.; Mortazavi, A.; Kwan, G.; Van Baren, M.J.; Salzberg, S.L.; Wold, B.J.; Pachter, L. Transcript assembly and quantification by RNA-seq reveals unannotated transcripts and isoform switching during cell differentiation. Nat. Biotechnol. 2010, 28, 511–515. [Google Scholar] [CrossRef]
  35. Cheng, J.; Galili, T.; Bostock, M.; Palmer, J. d3heatmap: Interactive Heat Maps Using ‘htmlwidgets’ and ‘D3.js’. 2018. Available online: https://github.com/rstudio/d3heatmap (accessed on 26 June 2019).
  36. Thomas, P.D.; Campbell, M.J.; Kejariwal, A.; Mi, H.; Karlak, B.; Daverman, R.; Diemer, K.; Muruganujan, A.; Narechania, A. Panther: A library of protein families and subfamilies indexed by function. Genome Res. 2003, 13, 2129–2141. [Google Scholar] [CrossRef] [PubMed]
  37. Liu, B.; Chen, J.; Shen, B. Genome-wide analysis of the transcription factor binding preference of human bi-directional promoters and functional annotation of related gene pairs. BMC Systems Biol. 2011, 5, S2. [Google Scholar] [CrossRef]
  38. Balbin, O.A.; Malik, R.; Dhanasekaran, S.M.; Prensner, J.R.; Cao, X.; Wu, Y.-M.; Robinson, D.; Wang, R.; Chen, G.; Beer, D.G. The landscape of antisense gene expression in human cancers. Genome Res. 2015, 25, 1068–1079. [Google Scholar] [CrossRef] [Green Version]
Figure 1. A. Schematic presentation of different forms of overlapping. (A) Embedded (Reverse gene is fully embedded within the Forward gene). (B) Embedded (Forward gene is fully embedded within the Reverse gene). (C) Tail-to-tail (3′-regions overlap). (D) Head-to-head (5′-regions overlap). B. Examples of different forms of overlapping, visualized in integrative genomics viewer (IGV). For each form, the top gene represents the sense gene and bottom gene represents the antisense gene. IDUA is overlapping with gene SLC26A1(Reverse/antisense) and fully embedded within the IDUA (Forward/sense gene), (Form A)). CNFN (forward/sense) is fully embedded within MEGF8 (reverse/antisense, (Form B)). ATP5MD and TAF5 has tail-to-tail overlap (Form C) and LOC100630879 and LOC111773909 has head-to-head overlap (Form D).
Genes 10 00503 g001
Figure 2. Length distribution of the overlap segments per form of gene overlapping. The overall median length of overlapping was 985 bp (1 and 72,094 bp; minimum and maximum, respectively). Each dot represents an overlapping gene pair (sense/antisense gene pairs).
Genes 10 00503 g002
Figure 3. (A) Frequency of overlapping genes in each chromosome across the equine genome. (B) Number of overlapping genes normalized to the length of each chromosome in the equine genome. The number of overlapping genes was numerically higher in chromosome 11 followed by chromosomes 13 and 12; chromosome 11 harbors 7.8% of all overlapping pairs while 6.8% and 5.7% of overlapping pairs are located on chromosomes 13 and 12. (C) Ratio of the overlapping genes to the number of annotated genes on each chromosome. The ratio of overlapping gene was numerically higher on ECA13 followed by ECA11 and ECA10 than the other chromosomes. (D) Frequency of overlapping genes in each chromosome across the equine genome based on the different forms of overlapping. (A) embedded (Antisense genet is fully embedded within the Sense gene); (B) embedded (Sense gene is fully embedded within the Antisense gene); (C) tail-to-tail (3′-regions overlap); (D) head-to-head (5′-regions overlap).
Genes 10 00503 g003
Figure 4. Density plot of sense and antisense strand expression. Expression in sense and antisense strands was calculated for each locus per sample. There was a numerical slight skew in the expression pattern toward antisense strand, and the sense strand showed an overall lower expression than the antisense strand (visible in the red and green dots; median of antisense expression/sense expression = 1.19). For the preparation of the density plot, the FPKMs values (Fragments Per Kilobase of transcript per Million mapped reads) were presented as Log10 (FPKM+1).
Genes 10 00503 g004
Figure 5. Heatmap depicting the expression of sense-antisense pairs throughout gestation in the horse. Each line represents a sense–antisense (SAS) pair; the expression values Log10 (FPKM+1) are indicated by color (dark red indicative of a higher expression).The heatmap was generated for the 454 genes that were expressed in at least 26 samples (32 samples in total; 16 CA samples, each divided as sense strand and antisense strand). The interactive heatmap with the possibility of focusing on the gene name along with the expression values Log10 (FPKM+1) can be accessed at: http://rpubs.com/pouyadini/496308.
Genes 10 00503 g005
Figure 6. Biological functions of genes from sense and antisense strands were predicted based on gene ontology (biological process). The number of genes involved in each function is presented in the x-axis.
Genes 10 00503 g006
Table 1. The length of overlap in relation to the length of the sense and antisense genes. The degree of overlap between sense and antisense genes is expressed as percentage of the overlap length.
SenseAntisense
GroupMedian (%)Min (%)Max (%)Median (%)Min (%)Max (%)
A * (n = 23)8.40.0181.8100100100
B (n = 297)1001001009.60.0687.8
C (n = 66)4.7<0.0198.35.9<0.0193.6
D (n = 875)3.1<0.0199.83.5<0.0199.9
* (A) embedded (Antisense gene is fully embedded within the Sense gene) and 100% of the length of the antisense genes are embedded in the sense gene; (B) embedded (Sense gene is fully embedded within the Antisense gene) and 100% of the length of the sense genes are embedded in the antisense gene; (C) tail-to-tail (3′-regions overlap); (D) head-to-head (5′-regions overlap).
Table 2. Biotypes of the overlapping genes in the dataset distributed across the overlapping forms.
BiotypesA *BCD
mRNA:mRNA (47%)74229520
mRNA:lnc-RNA (44%)1220531309
lnc-RNA:lnc-RNA (4.7%)117437
mRNA:miRNA (2.6%)223-1
lnc-RNA:tRNA (0.5%)--34
miRNA:miRNA (0.3%)-4--
lnc-RNA:miRNA (0.3%)-4--
mRNA:miscRNA (0.2%)-1-2
mRNA:snRNA (0.07%)---1
lnc-RNA:snRNA (0.07%)1---
lnc-RNA:miscRNA (0.07%)---1
* (A) embedded (Antisense gene is fully embedded within the Sense gene); (B) embedded (Sense gene is fully embedded within the Antisense gene); (C) tail-to-tail (3′-regions overlap); (D) head-to-head (5′-regions overlap).
Table 3. List of sense and antisense pairs that showed a significant correlation in their expression pattern between the sense and antisense genes (n = 16 pairs of sense and antisense transcriptome).
SenseAntisenseSpearman CorrelationCorrected p-Value
NPHP3UBA50.91120.000001
MSMPRGP10.90010.0057
PSPC1MPHOSPH80.87780.0042
LOC100059263PGRMC10.85350.000001
LYRM2ANKRD60.83920.0367
LOC102147537THAP10.78450.0009
NDRG2SLC39A20.77280.0004
GLS2SPRYD40.71550.0018
EML6RTN40.71050.002
KIAA0895ANLN0.70540.0071
TAF10ILK0.69460.0028
LOC111775727C11H17orf490.69330.0262
LOC111774163CNN20.68130.0037
TUBGCP6SELENOO0.67930.0038
P2RY11EIF3G0.66810.0047
LOC106782172MTO10.66730.0047
TMEM259GRIN3B0.65000.0064
LOC100063824CCDC510.64770.0429
PPP2R3BLOC1021483650.64290.0072
RABEP2ATP2A10.62860.0091
MYO19ZNHIT30.62360.0098
BCCIPDHX320.60350.0647
ENTPD8NOXA10.58650.0169
ASRGL1LOC1117759530.58620.0749
MYO15BLOC1117755880.56220.0719
CIDEBNOP90.54930.0275
LOC111772592ELOVL60.54750.0281
LOC106783384TNPO20.54690.043
NR2C2APRFXANK0.52710.0359
TMCO6LOC1117677850.51840.0396
GNECLTA0.51190.0427
TNFRSF17LOC1117675610.50010.0576
LOC100053030GAS80.49870.0493
STAT2IL23A0.49850.0494
BAK1LOC111769307−0.50340.0468
MYBBP1ASPNS2−0.51720.0402
AHSA2USP34−0.52270.0456
LOC111773182LRRC72−0.61170.0455
PCYT1BPDK3−0.63620.048
IGSF10MED12L−0.65520.008
CD72TESK1−0.77350.0012
LOC111774293KRI1−0.79180.0192

