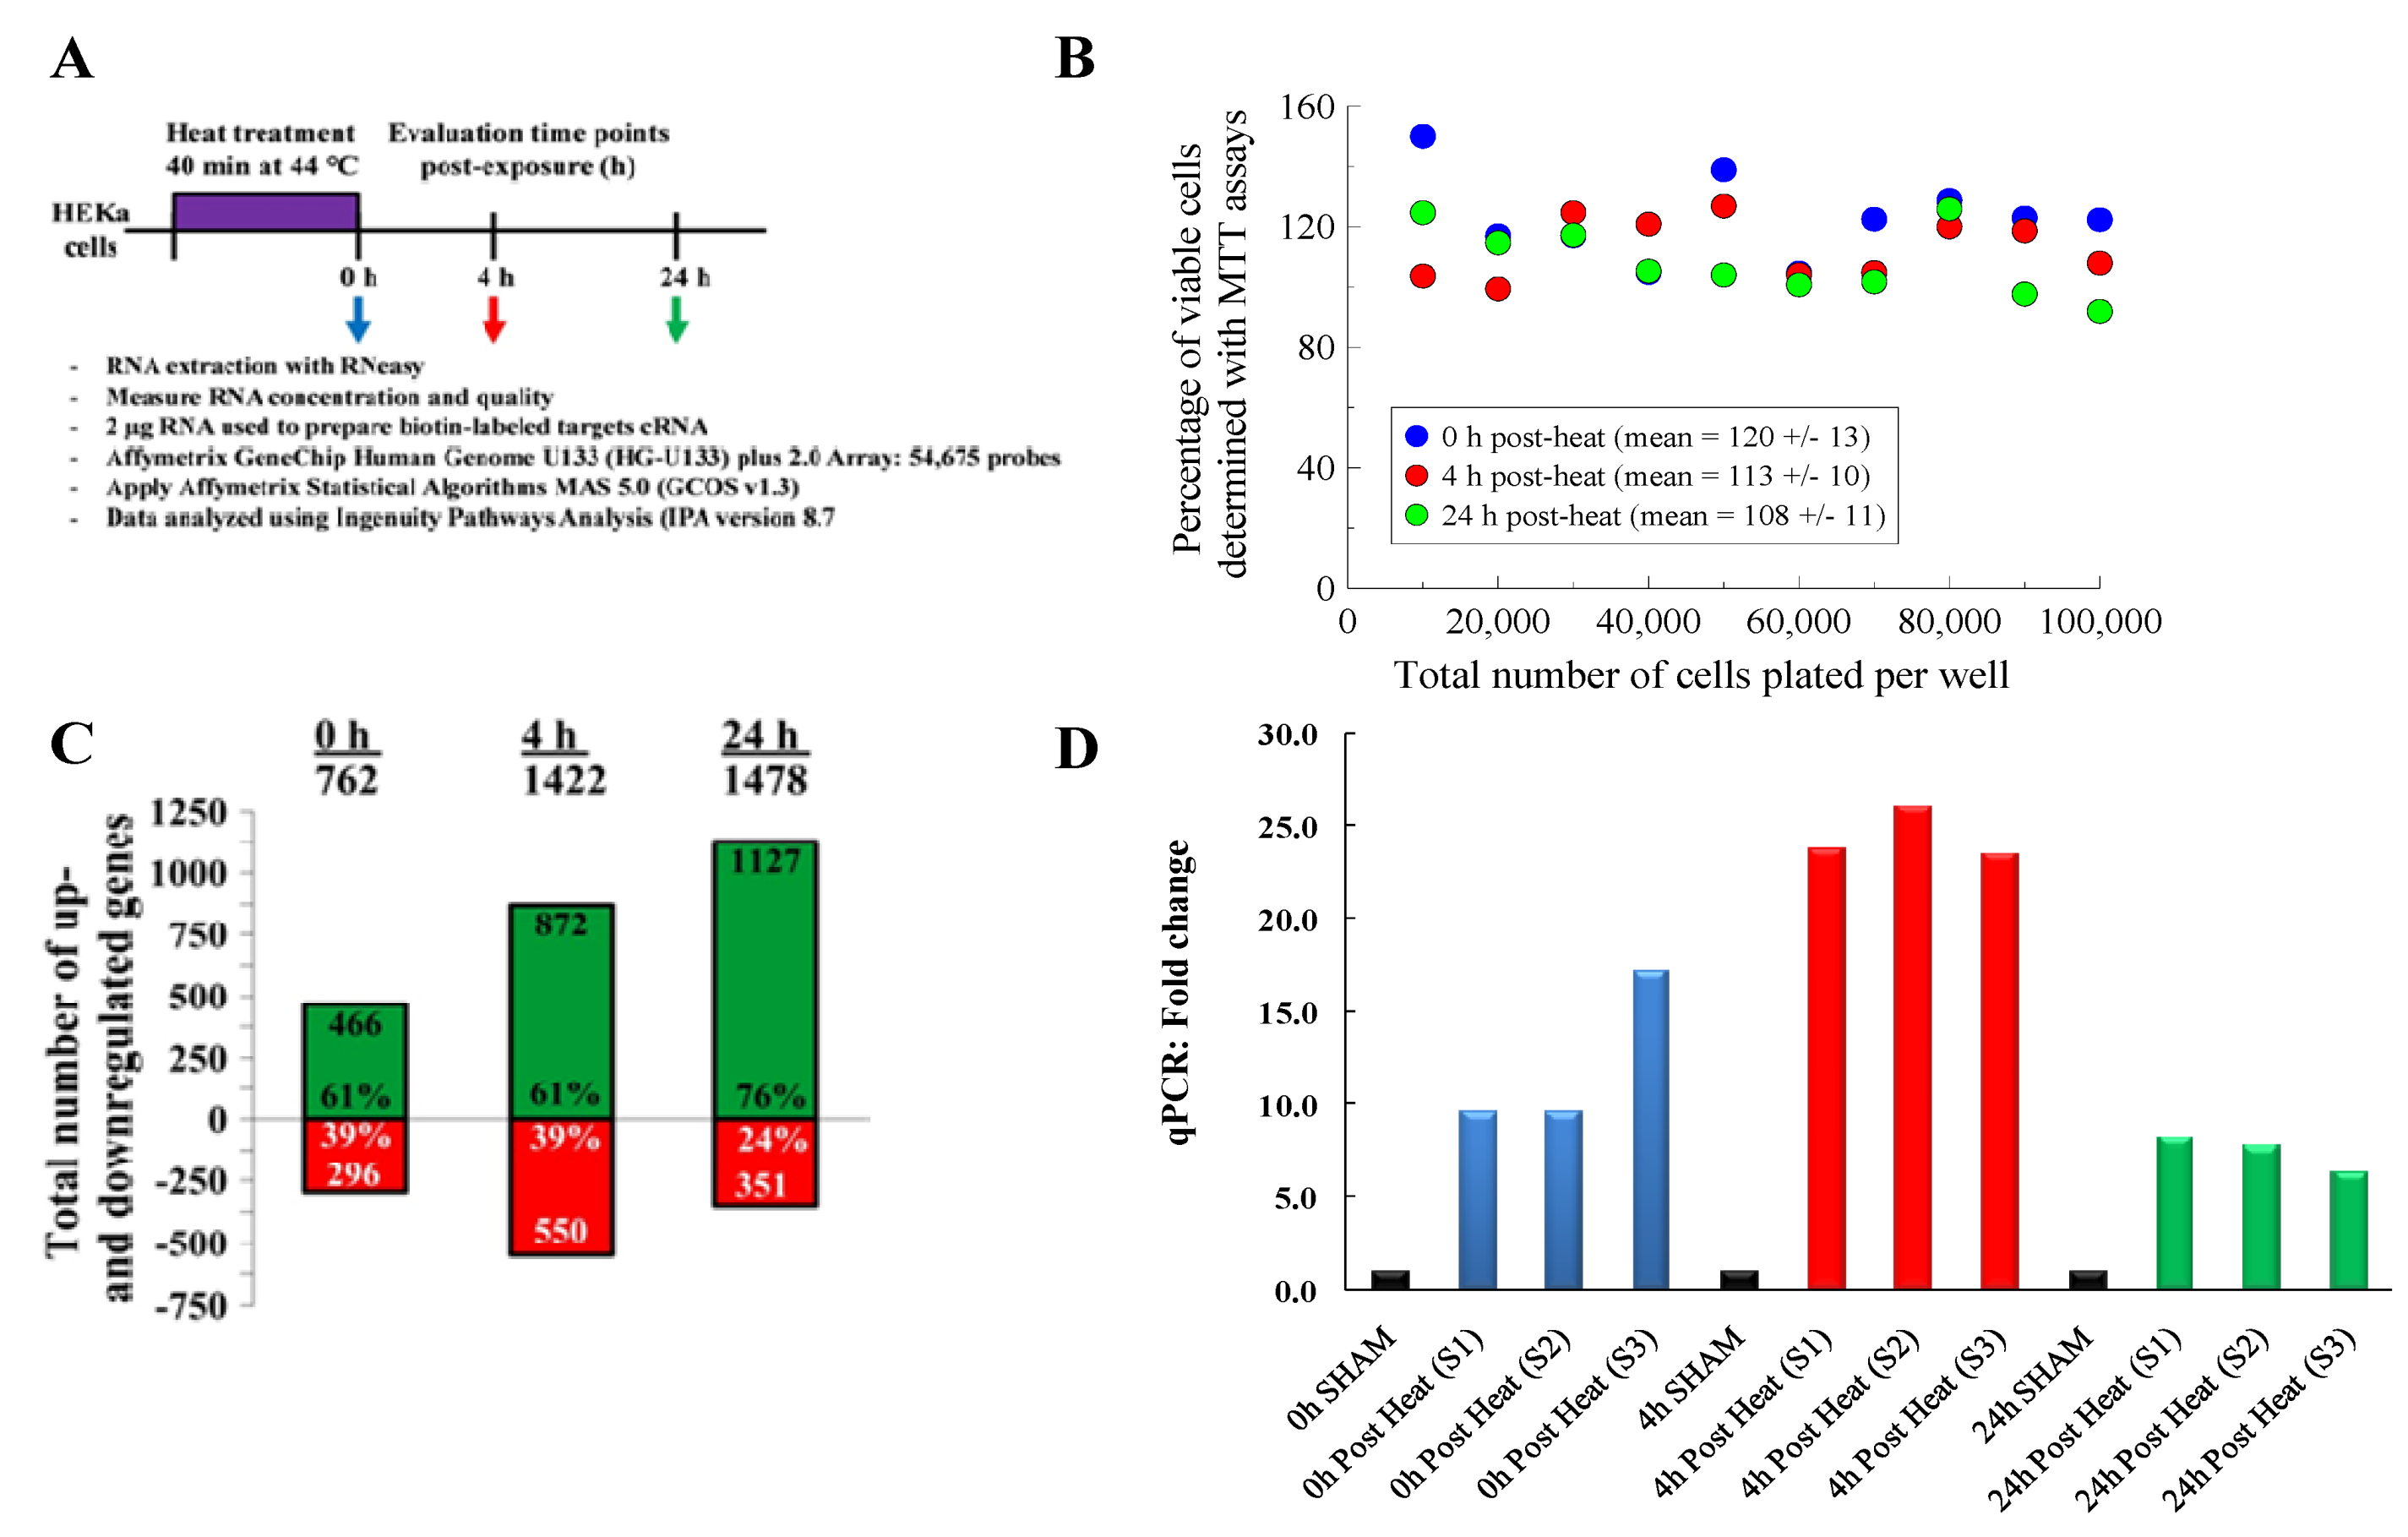
2.1. Keratinocytes Induce an Appreciable Stress Response When Exposed To Hyperthermic Stress
We conducted an initial set of experiments to investigate the impact that our selected hyperthermia stress protocol had on cellular viability. For these studies, HEKs were exposed to hyperthermic stress and cellular metabolic activity was measured at 0, 4 and 24 h post-exposure using MTT assays (
Figure 1B). For all cell densities tested, the data shows that greater than 90% of the cells survive after being exposed to our hyperthermic stress protocol. This data confirms that the HEKs cells were viable post-heat exposure.
After confirming that the HEK cells survived post-exposure, we then sought to test whether our selected hyperthermic stress protocol induced an appreciable transcriptional stress response To investigate the transcriptional stress response, we exposed HEK cells to hyperthermic stress and used microarray gene chips to quantify the expression level of genes at 0, 4 and 24 h post-exposure (
Figure 1A). Since a signature feature of an appreciable stress response is the rapid and marked upregulation of minimal stress genes [
12], we conducted microarray and PCR analyses to examine the genes that HEKs express when exposed to hyperthermia (
Figure 1C,D). Using Ingenuity Pathway Analysis (IPA) software, we filtered the microarray data using the following cut-offs: (i) an absolute value of expression magnitude (log
2 ratio relative to control) greater or equal to 1.5; and (ii) a
p-value less than or equal to 0.05. Of the 54,675 probe sets tested on each gene chip, we found that 762, 1,422 and 1,478 genes were differentially expressed at the 0, 4 and 24 h time points, respectively (
Figure 1C). The number of upregulated genes increased in a logarithmic fashion from 466 at 0 h, 872 at 4 h and up to 1,127 at 24 h. Interestingly, roughly 60% of the transcripts regulated at 0 and 4 h were upregulated, but by 24 h, ~75% of the differentially expressed genes were upregulated.
Specifically, we found that the heat-treated groups expressed transcripts for many heat shock proteins (Hsps). We also found that the transcripts encoding for heat shock protein 70 (HSPA6) exhibited the greatest increase in expression and the highest level of statistical significance. To validate these microarray results, we then conducted qRT-PCR analyses for HSPA6 (Hsp70) (
Figure 1D). For all of the samples tested, we found that the heat-treated treatment group exhibited statistically significant increases in HSPA6 expression, ranging between 10- and 25-fold compared to the sham group. These results were consistent with the microarray data, which showed that HSPA6 expression increased between 4- and 32-fold.
2.2. Temporal Gene Expression Profiles for Keratinocytes Exposed To Hyperthermic Stress
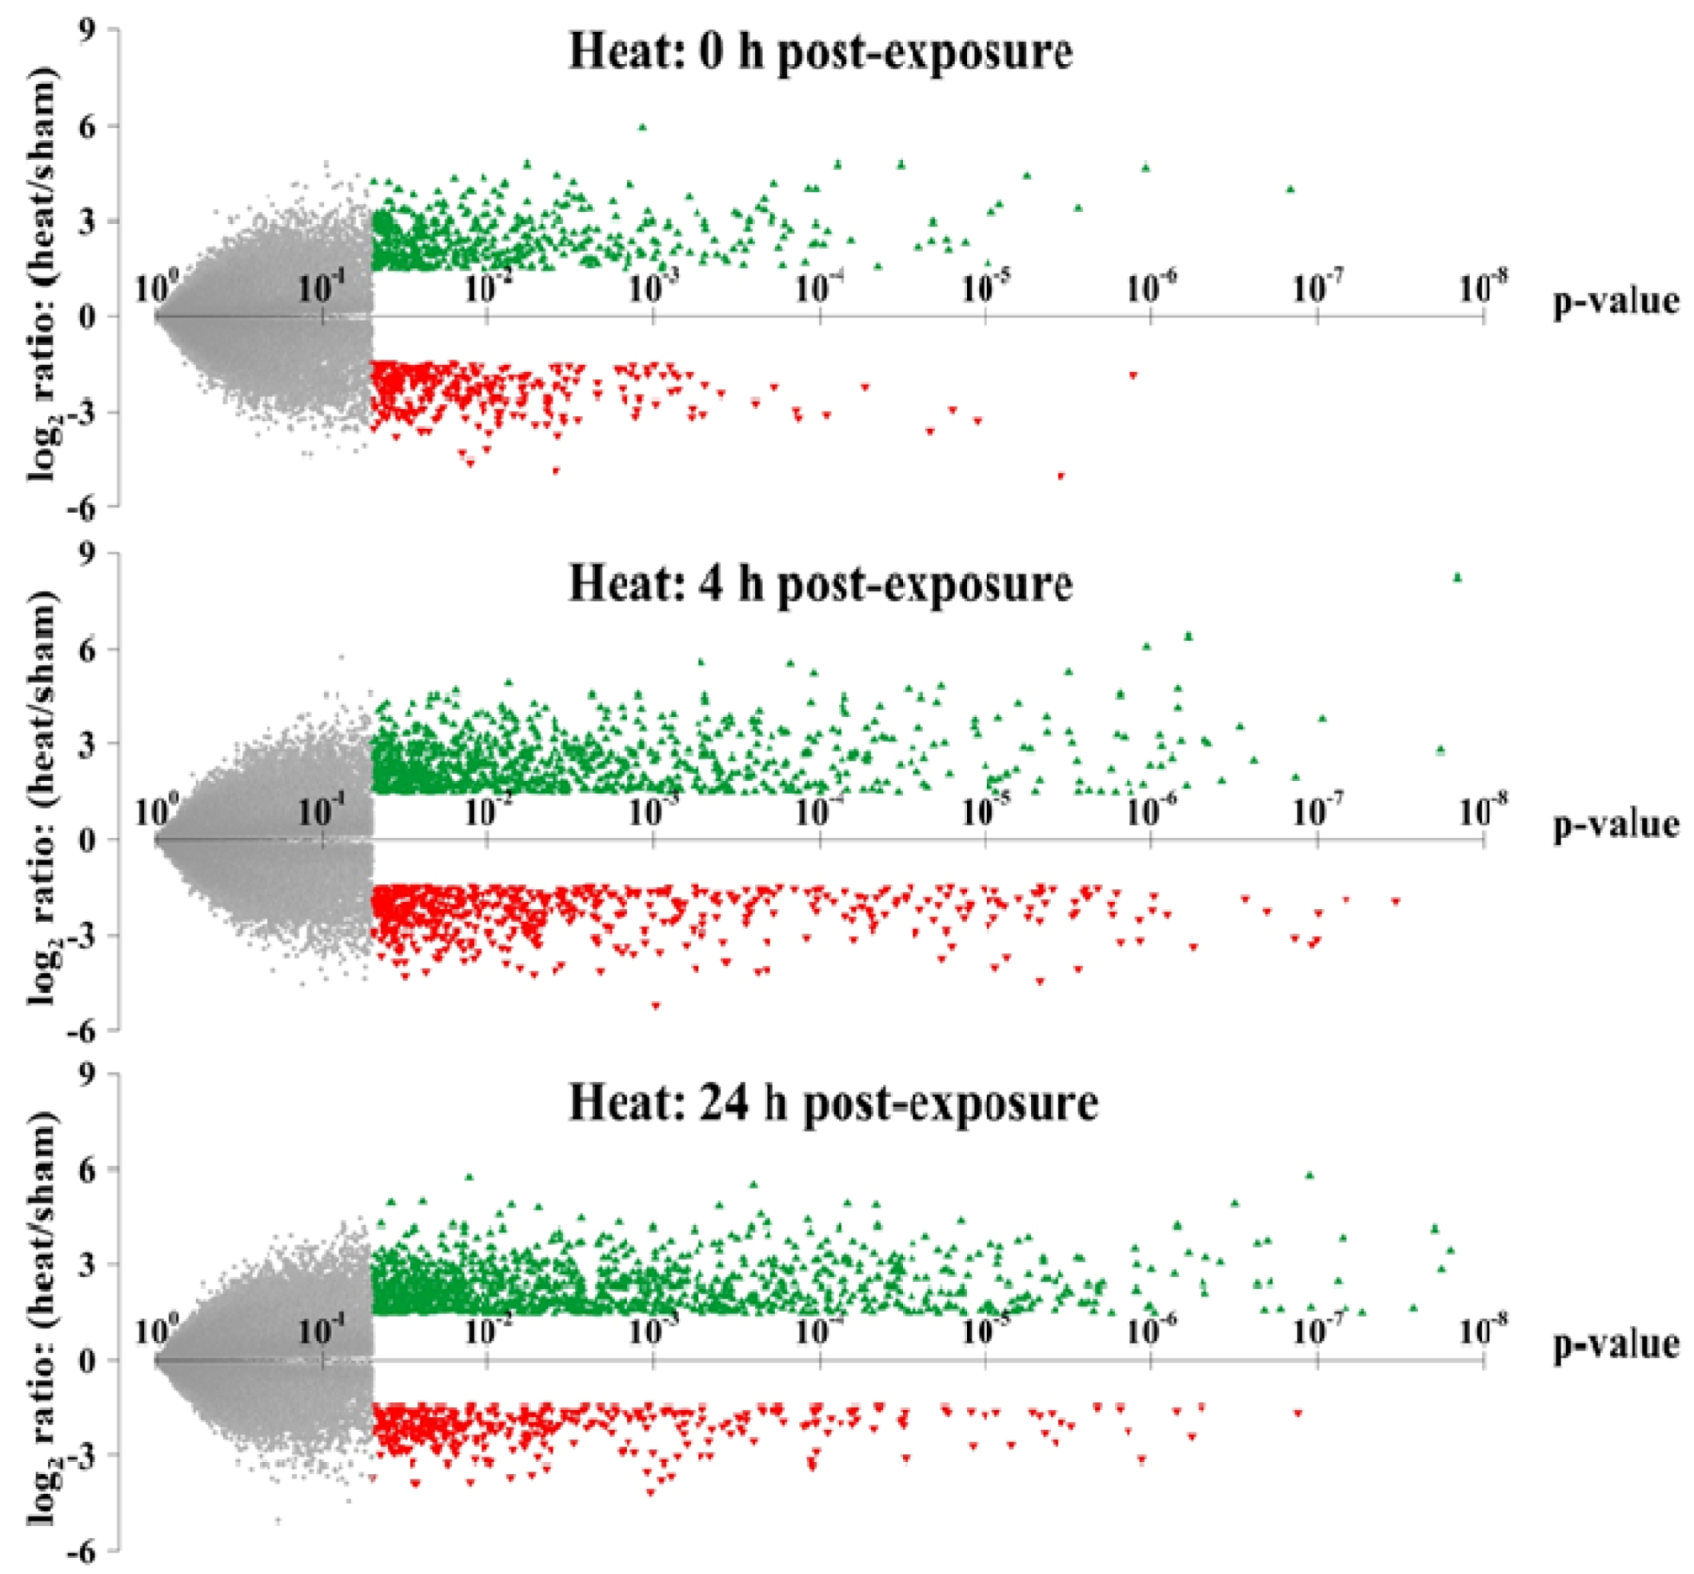
In order to visualize the global distribution of the gene expression profiles, we then created volcano plots for all genes at each time point. In these plots, the level of statistical significance (
p-value) for each gene is plotted
versus the fold-change in expression level relative to untreated sham (
Figure 2). Genes with the highest level of statistical significance appear on the right side of the plot. In addition, upregulated genes that display large-magnitude fold-changes appear towards the top of the plot (denoted with green triangles), whereas downregulated genes appear towards the bottom (denoted with red triangles). We found that considerably more genes were differentially expressed at 4 h and 24 h than at the 0 h time point. We also found that the transcripts expressed at the later time points also exhibited lower
p-values and larger-magnitude changes in expression level than the genes at 0 h. Collectively, our results show that hyperthermic stress triggers a rapid, robust and extensive transcriptional response in HEK cells. The temporal kinetics expression data also show that this stress response is immediately activated in response to stress and is sustained for many hours after exposure.
Figure 2.
Volcano plots of the gene expression profiles at each time point. The magnitude of differential expression (log2 fold-change) is plotted versus the level of statistical significance (p-value) of all genes in the microarray for 0, 4 and 24 h post-heat exposure. Upregulated and downregulated genes with absolute log2 ratios ≥1.5 and p-values ≤0.05 are depicted with green and red triangle symbols, respectively. Insignificant genes are denoted with light gray symbols.
2.3. Biological Functions of Heat-Shock-Induced Genes
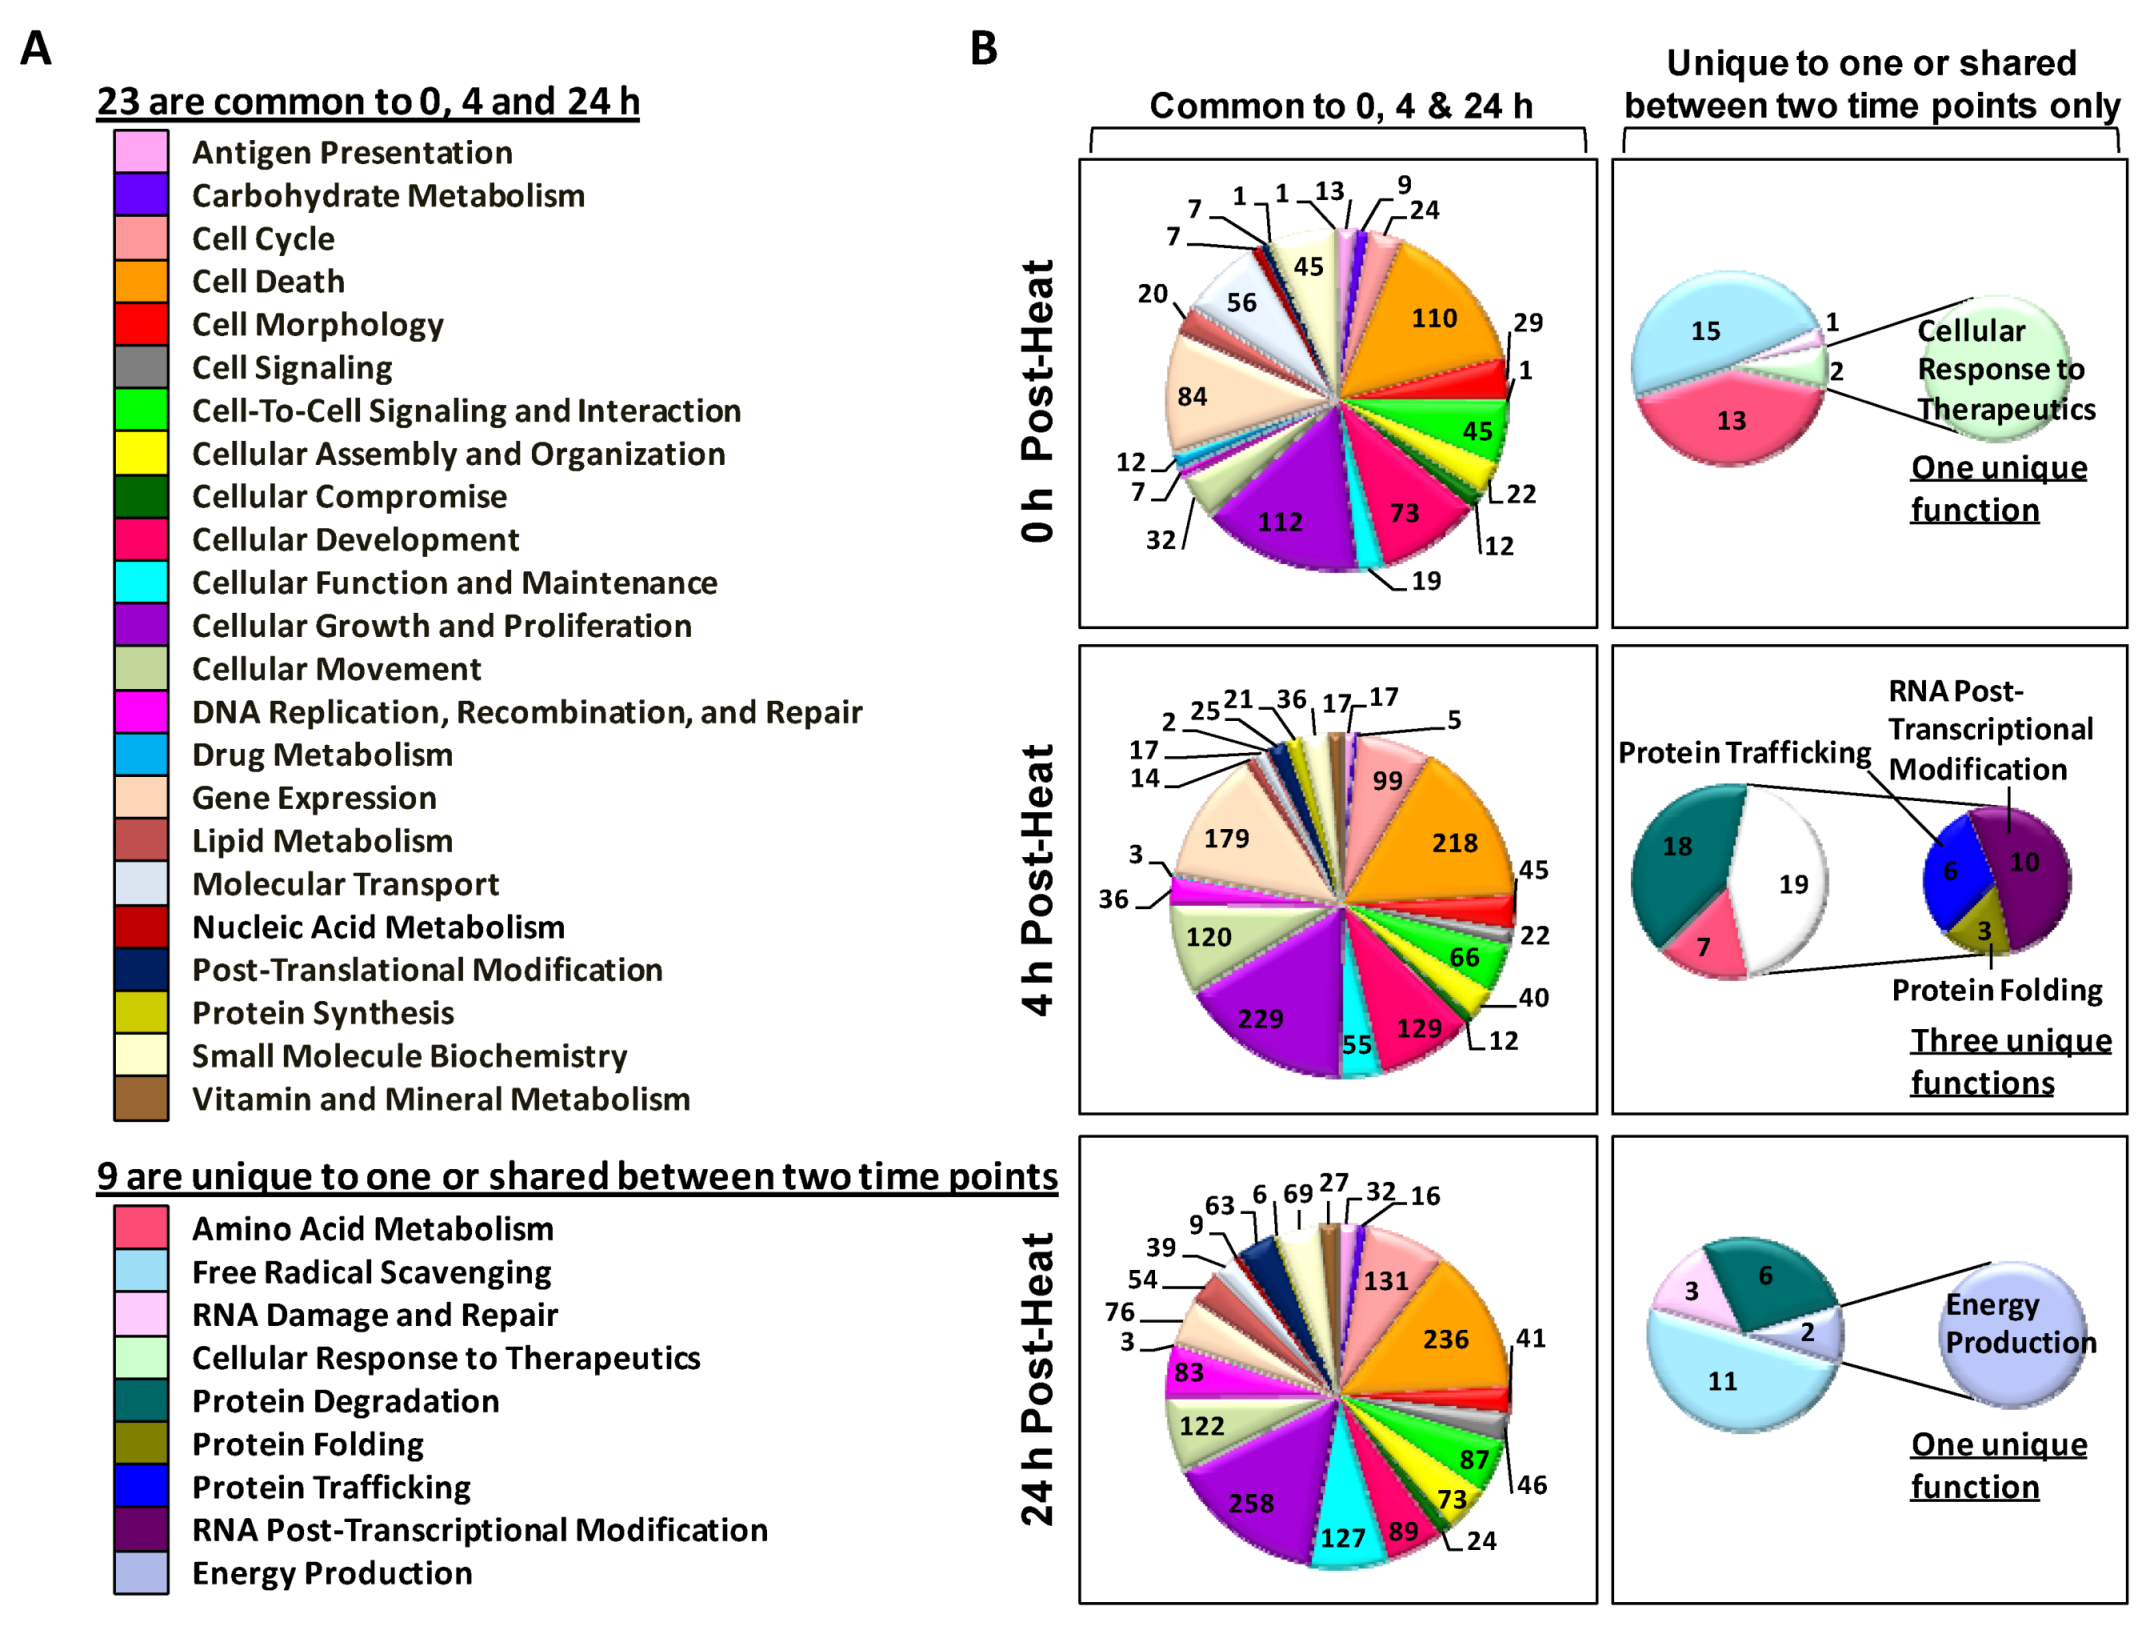
After identifying the genes expressed in response to hyperthermic stress, we then used IPA software to identify each gene’s primary biological functions.
Figure 3 contains pie charts of the total number of genes associated with each cellular and molecular function. We found that 23 biological functions were common to all three time points. Interestingly, only nine functions in this group were either unique to one or shared by two time points (
Figure 3). In general, the 0 h and 24 h time points share many genes with functions required for free radical scavenging, whereas only the 4 h time point contains genes with functions dedicated primarily to protein regulation (
i.e., protein trafficking and protein folding) (
Figure 3B).
Figure 3.
Diagrams of cellular and molecular functions associated with genes expressed in human epidermal keratinocyte (HEK) cells exposed to heat shock. Following an Ingenuity Pathway Analysis (IPA) core analysis, the molecular and cellular functions linked to each recovery period were sorted and illustrated. (A) A list of the 23 biological functions common to all three time points and nine functions unique to one time point or shared between two time points; (B) Pie charts of gene functions at 0, 4 and 24 h post-exposure. The pie chart sectors represent the number of genes associated with each function.
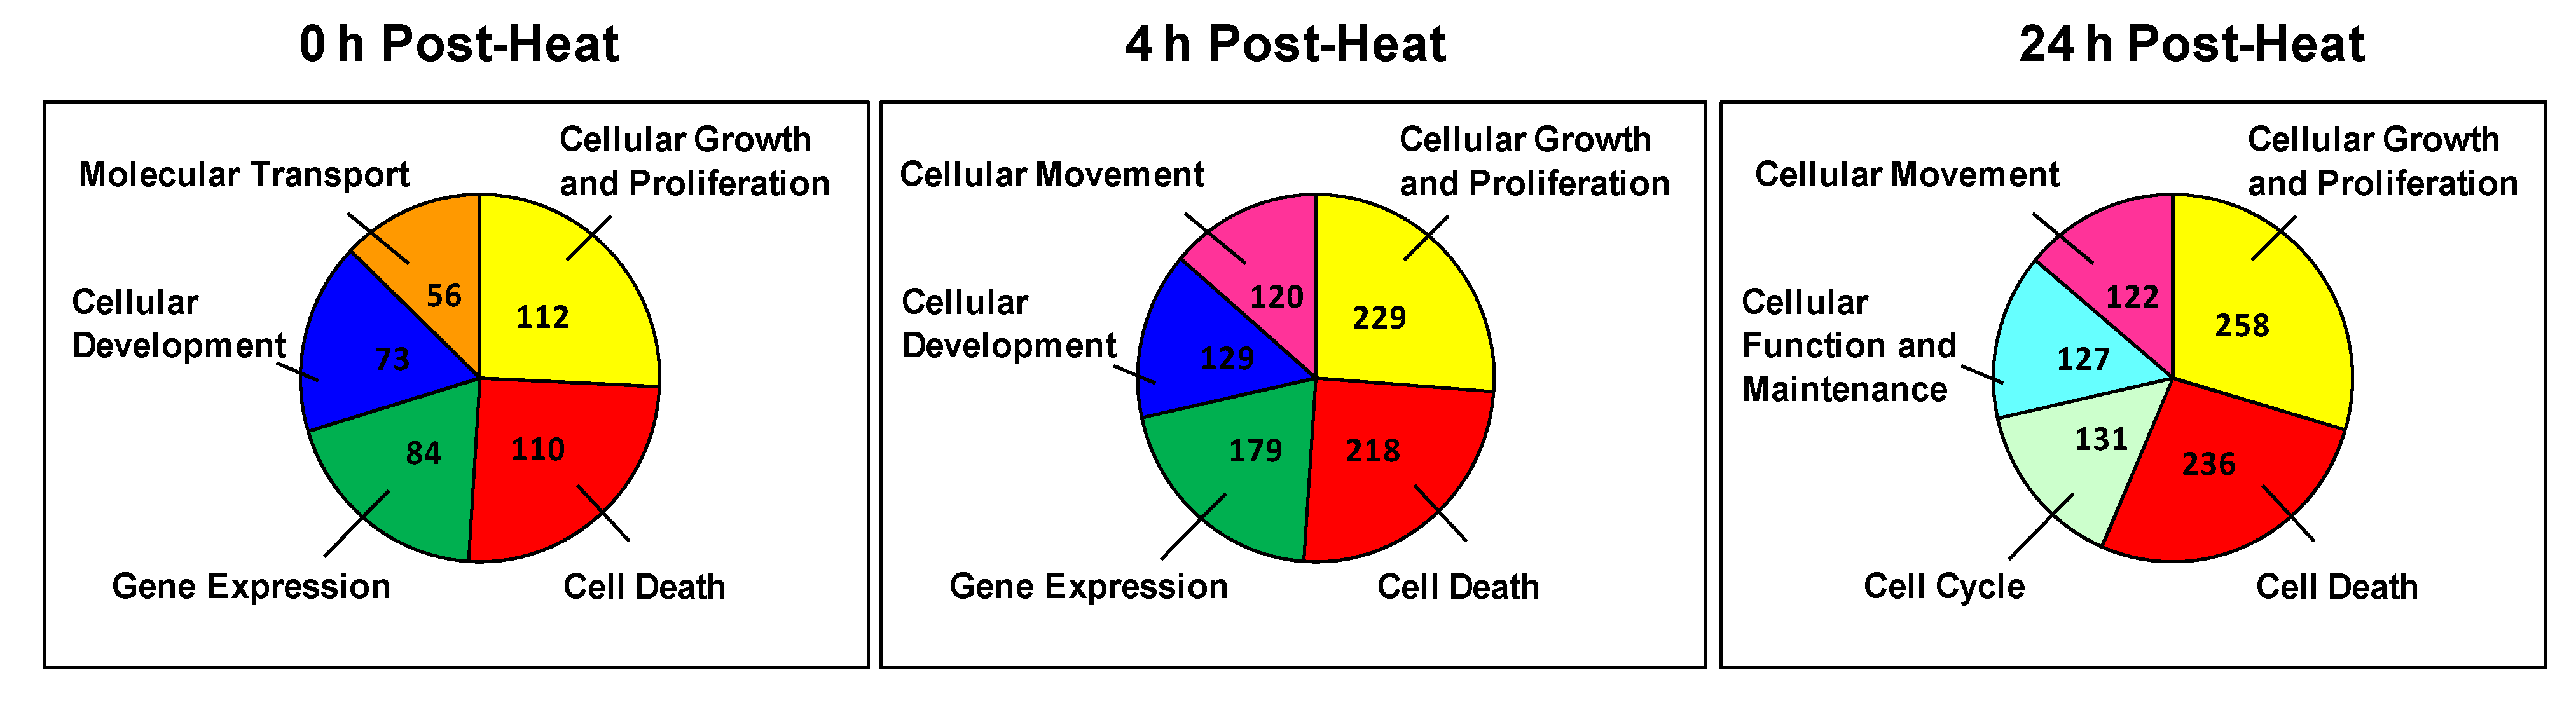
Next, we identified the biological function groups that had the greatest number of differentially expressed genes. For each time point, we generated color-coded pie charts containing the top five biological functions and the number of genes in each group (
Figure 4). We found that two biological functions (
i.e., cellular growth and proliferation and cell death) appeared in the top five at each time point. In addition to these functions, the 0 h and 4 h time points also shared two more top functions, which are associated with cellular development and gene expression. The only major difference between these time points was that the 0 h time point had more genes associated with molecular transport, whereas the 4 h group had more genes involved in cellular movement functions. In contrast, despite exhibiting a similar number of regulated genes, the 4 h and 24 h groups only shared three top functions: cellular movement, cell death and cell growth. The primary difference between these time points is that the 4 h group had more genes dedicated to cellular development and gene expression, whereas the 24 h group exhibited genes with cellular function and cell cycle processes.
Figure 4.
Pie chart of the top five cellular and molecular functions at each time point. Each sector of the pie chart represents the total number of genes expressed for each cellular function. Genes were filtered for an absolute value log2 ratio ≥1.5 and a significance value of p ≤ 0.05.
Figure 4.
Pie chart of the top five cellular and molecular functions at each time point. Each sector of the pie chart represents the total number of genes expressed for each cellular function. Genes were filtered for an absolute value log2 ratio ≥1.5 and a significance value of p ≤ 0.05.
2.4. Identification of Shared and Unique Genes
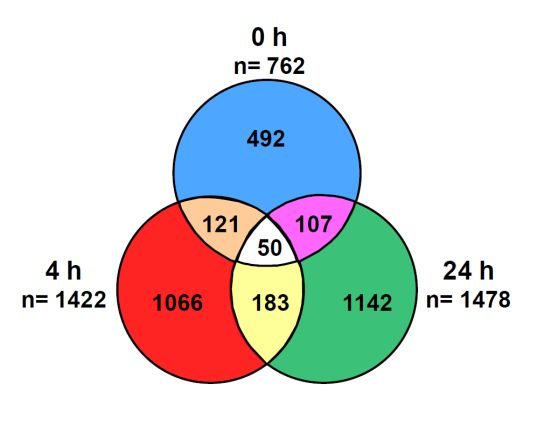
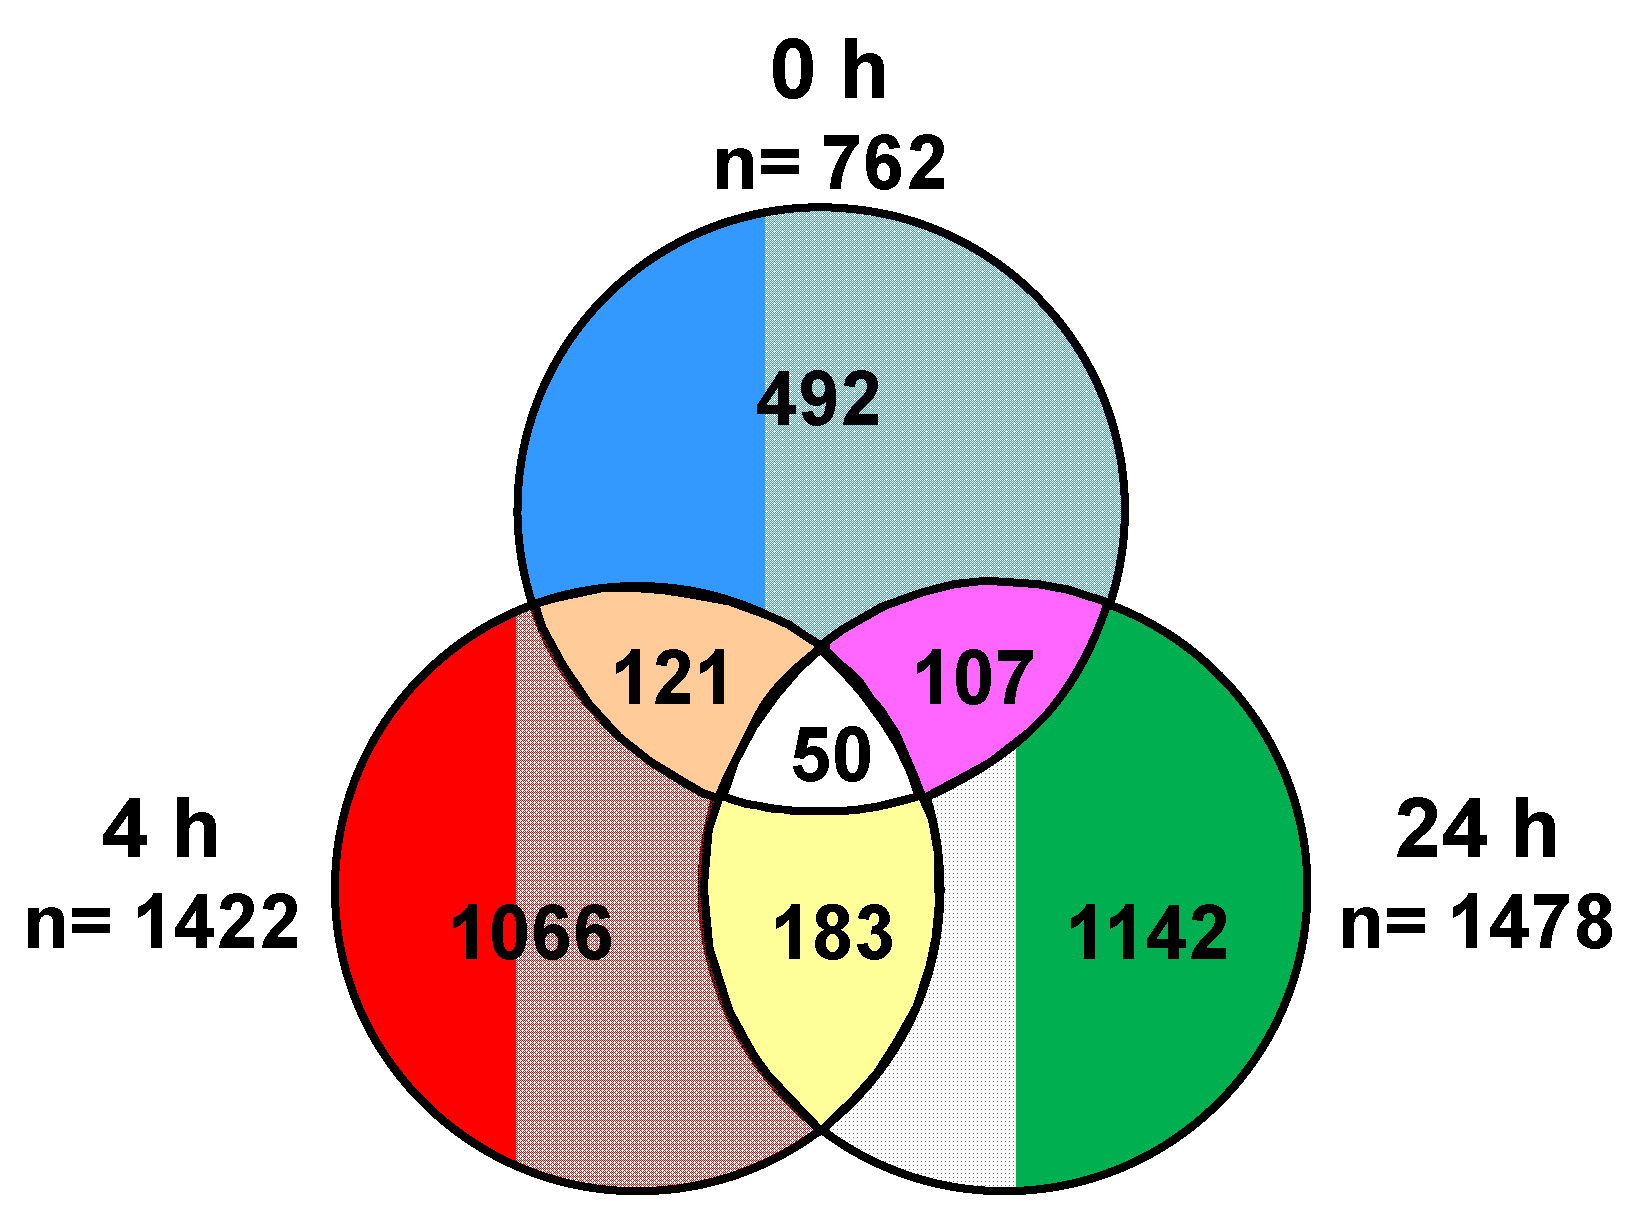
We next sought to determine whether any of the differentially expressed genes were observed at all time points. To answer this question, we performed a biomarker filter analysis. This tool allowed us to identify the genes that were unique and shared by each group. The Venn diagram in
Figure 5 shows the total number of genes that were shared and unique to each time point. A total of 492, 1,066 and 1,142 genes were unique to the 0 h, 4 h and 24 h evaluation groups, respectively. We found that 121 genes were common to both the 0 h and 4 h, 107 genes to the 0 h and 24 h and 183 genes to the 4 h and 24 h. Notably, only 50 genes were shared among all three recovery time points. A comprehensive list of these genes is provided as supplementary material (Supplementary Tables 1–6).
Figure 5.
Identification of unique and shared genes. The Venn diagram indicates the number of unique and common differentially expressed genes at each time point. Biomarker comparison analysis was performed in IPA.
Figure 5.
Identification of unique and shared genes. The Venn diagram indicates the number of unique and common differentially expressed genes at each time point. Biomarker comparison analysis was performed in IPA.
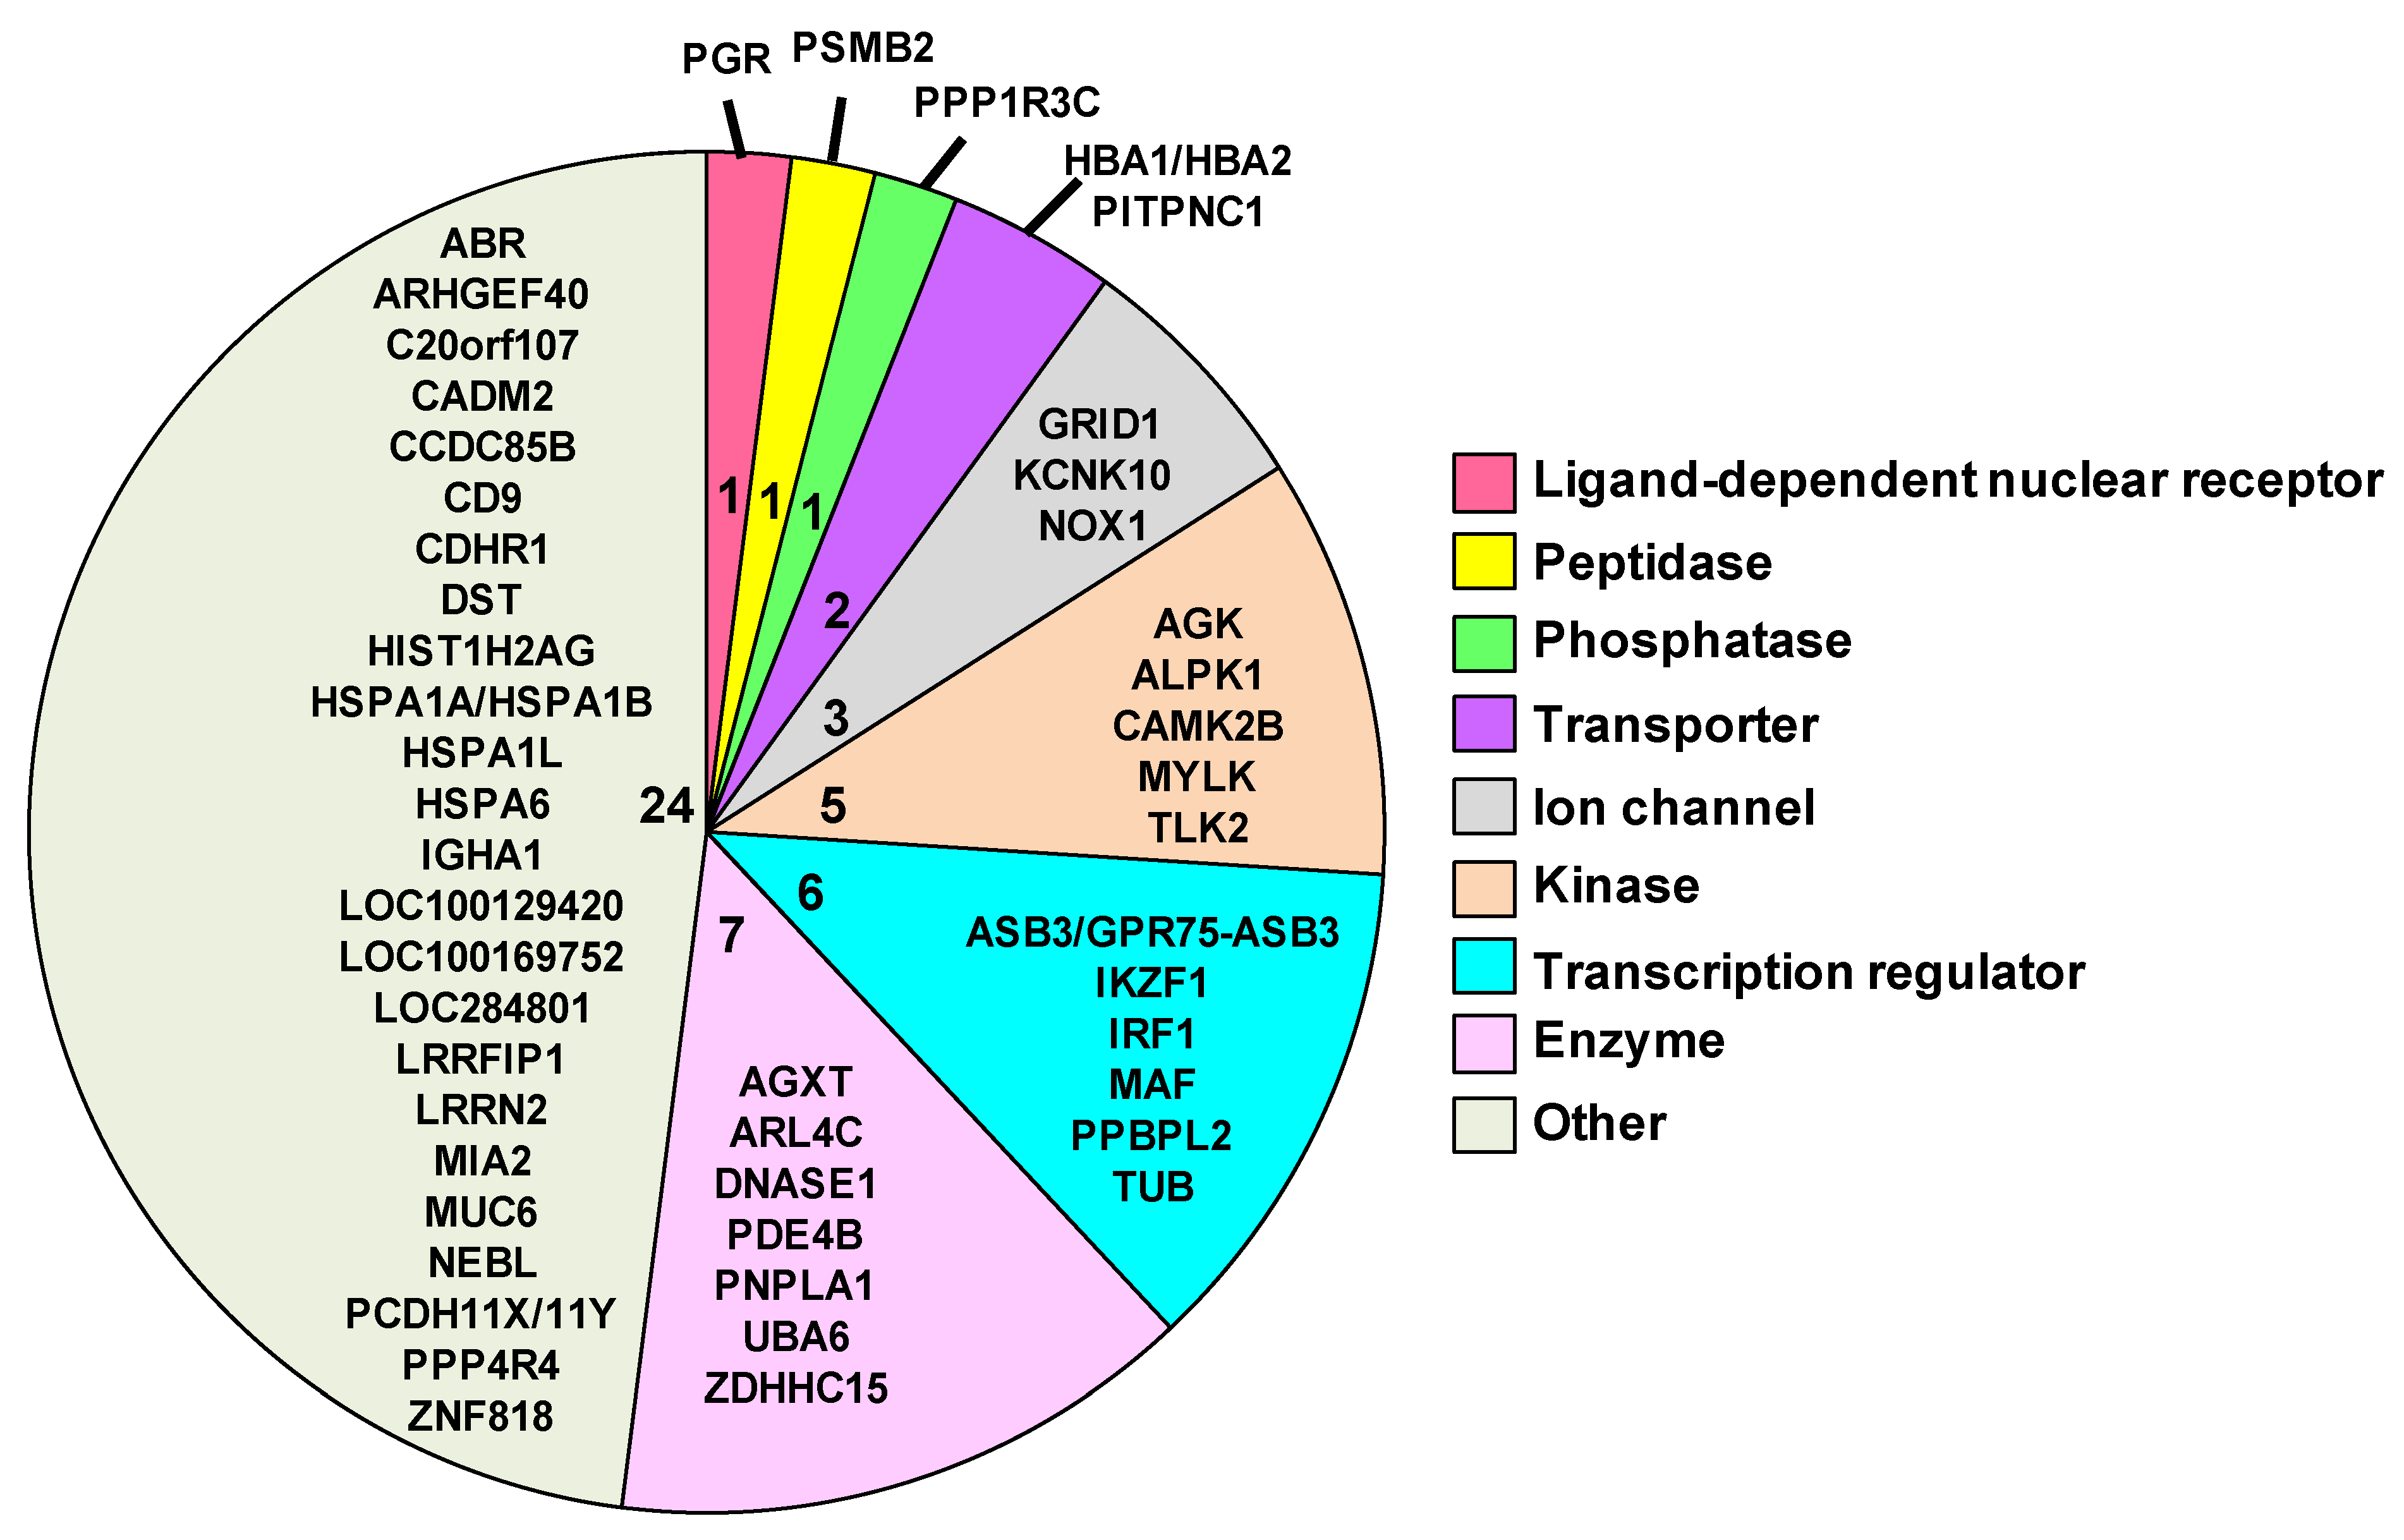
After identifying the 50 genes that were expressed at each time point, we then performed a series of analyses to better understand the function of each gene. For these analyses, we used the following web-based resources: IPA, GeneCards Human Gene Database, HGNC and Gene Ontology (GO). The pie chart in
Figure 6 contains the symbols for each of the 50 common genes. This pie chart is also further divided by the family of each gene and the number of genes per family, which is denoted by the number towards the center of each sector of the pie chart. The gene families are color coded and are specified in the legend. The following eight families are provided in the figure: ligand-dependent nuclear receptor, peptidase, phosphatase, transporter, ion channel, kinase, transcription regulator, enzymes and others. The twenty-four genes included in the “other” group consist of genes that were not classified by IPA.
Figure 6.
Pie chart of 50 shared biomarkers. Each sector of the pie represents the number of genes associated with each function. The symbols and number of genes are also provided for each function. Genes were filtered for an absolute value log2 ratio ≥1.5 and a significance value of p ≤ 0.05.
Figure 6.
Pie chart of 50 shared biomarkers. Each sector of the pie represents the number of genes associated with each function. The symbols and number of genes are also provided for each function. Genes were filtered for an absolute value log2 ratio ≥1.5 and a significance value of p ≤ 0.05.
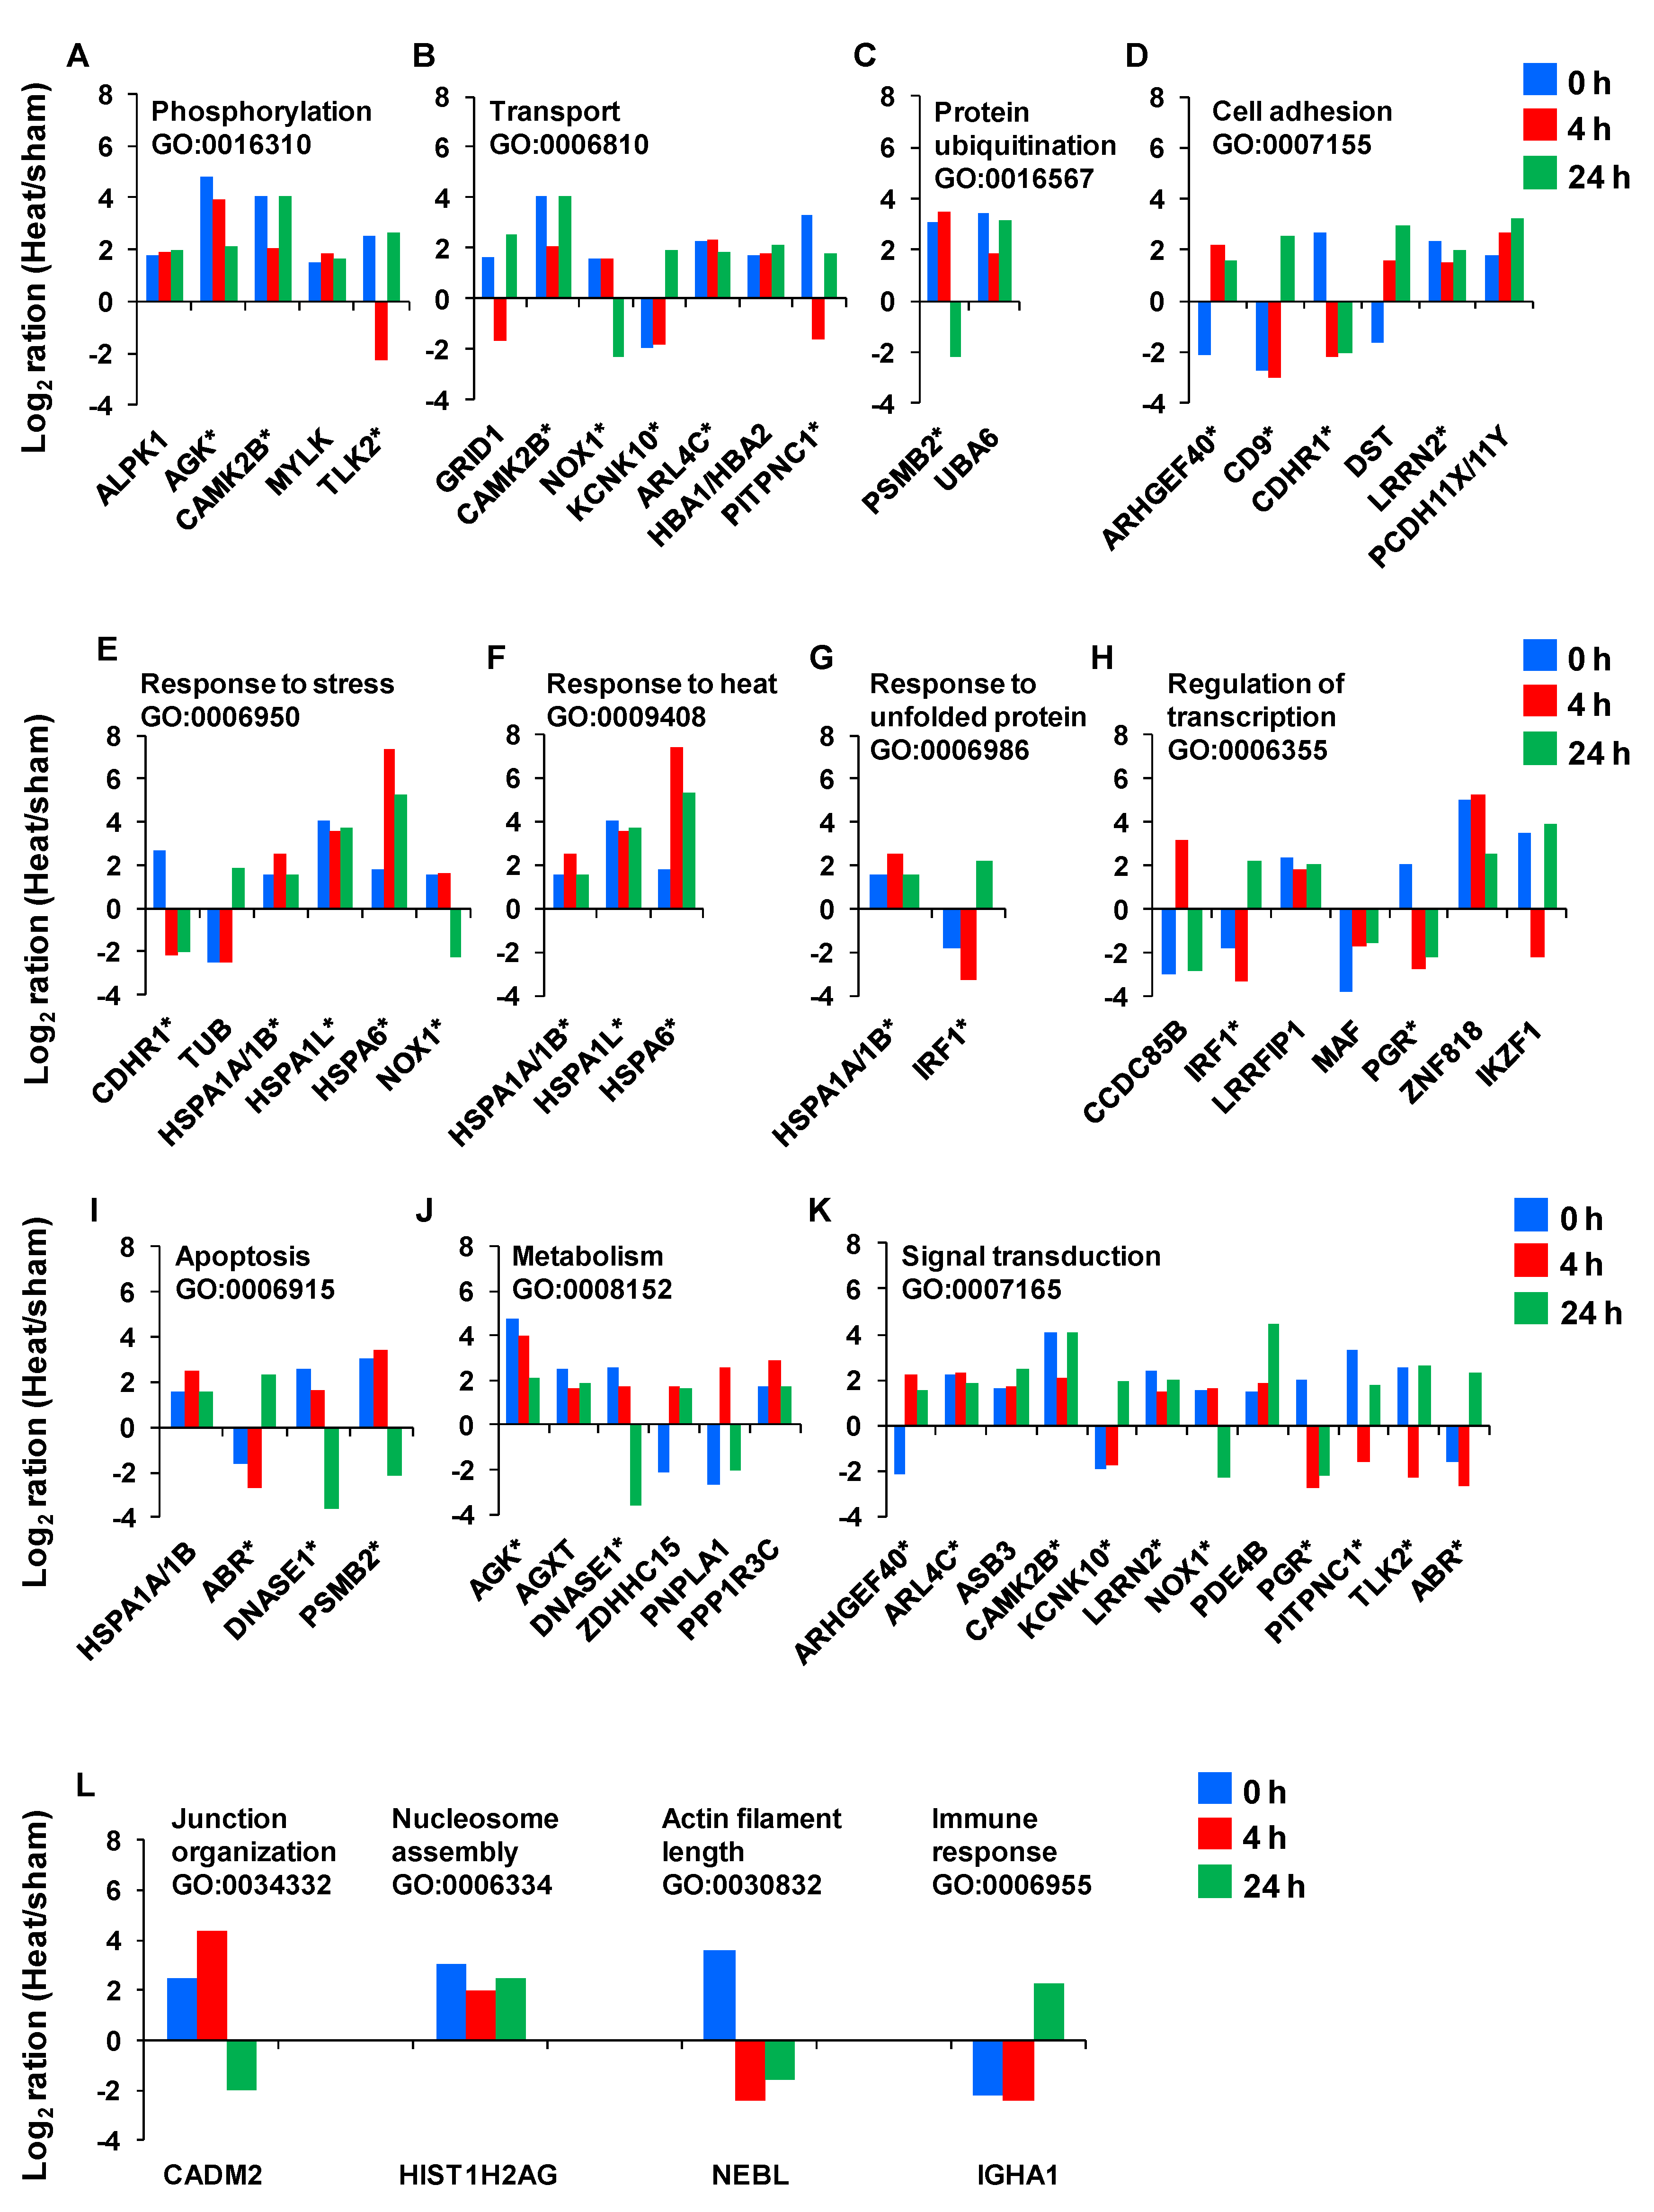
Next, we sought to examine the temporal expression kinetics for the genes with known biological functions. We found that only 44 of the 50 genes identified had well-characterized biological processes and GO annotations.
Figure 7 provides the magnitude of the fold-change in expression for each of these genes as a function of time. The asterisks denote genes that have multiple key biological functions. The genes include the chaperones that function in response to stress and protein unfolding. These genes encode for the following heat shock 70 kDa proteins: HSPA6, HSPA1L and HSPA1A/A1B.
Figure 7.
The temporal expression kinetics for the genes with known gene ontology (GO). Asterisks indicate the genes with more than one biological process.
Figure 7.
The temporal expression kinetics for the genes with known gene ontology (GO). Asterisks indicate the genes with more than one biological process.
Additional genes responsible for the response to stress or heat are CDHR1 (cadherin-related family member 1), TUB (tubby protein homolog), NOX1 (NADPH oxidase 1) and IRF1 (interferon regulatory factor 1). Two genes—PSMB2 (proteasome subunit beta type 2) and UBA6 (ubiquitin-like modifier activating enzyme 6)—play roles in protein ubiquitination. CDHR1, ARHGEF40 (Rho guanine nucleotide exchange factor (GEF) 40), CD9 (CD9 molecule), DST (dystonin), LRRN2 (leucine rich repeat neuronal 2) and PCDH11X/Y (protocadherin 11 Y-linked) support cell adhesion. ALPK1 (alpha-kinase 1), AGK (acylglycerol kinase), CAMK2B (calcium/calmodulin-dependent protein kinase II beta), MYLK (myosin light chain kinase) and TLK2 (tousled-like kinase 2) assist in phosphorylation, whereas, GRID1 (glutamate receptor delta-1 subunit), KCNK10 (potassium channel subfamily K member 10), ARL4C (ADP-ribosylation factor-like 4), HBA1/HBA2 (hemoglobin alpha 1), PITPNC1 (cytoplasmic phosphatidylinositol transfer protein 1), CAMK2B and NOX1 support the transport function. In addition, CADM2 (cell adhesion molecule 2), HIST1H2AG (histone cluster 1, H2ag), NEBL (nebulette) and IGHA1 play roles in junction organization, nucleosome assembly, actin filament length and immune response, respectively. Furthermore, as indicated in
Figure 7, some of the above mentioned genes and the remaining ones are involved in processes related to homeostasis response. These include regulation of transcription, apoptosis, metabolism and signal transduction related-genes.
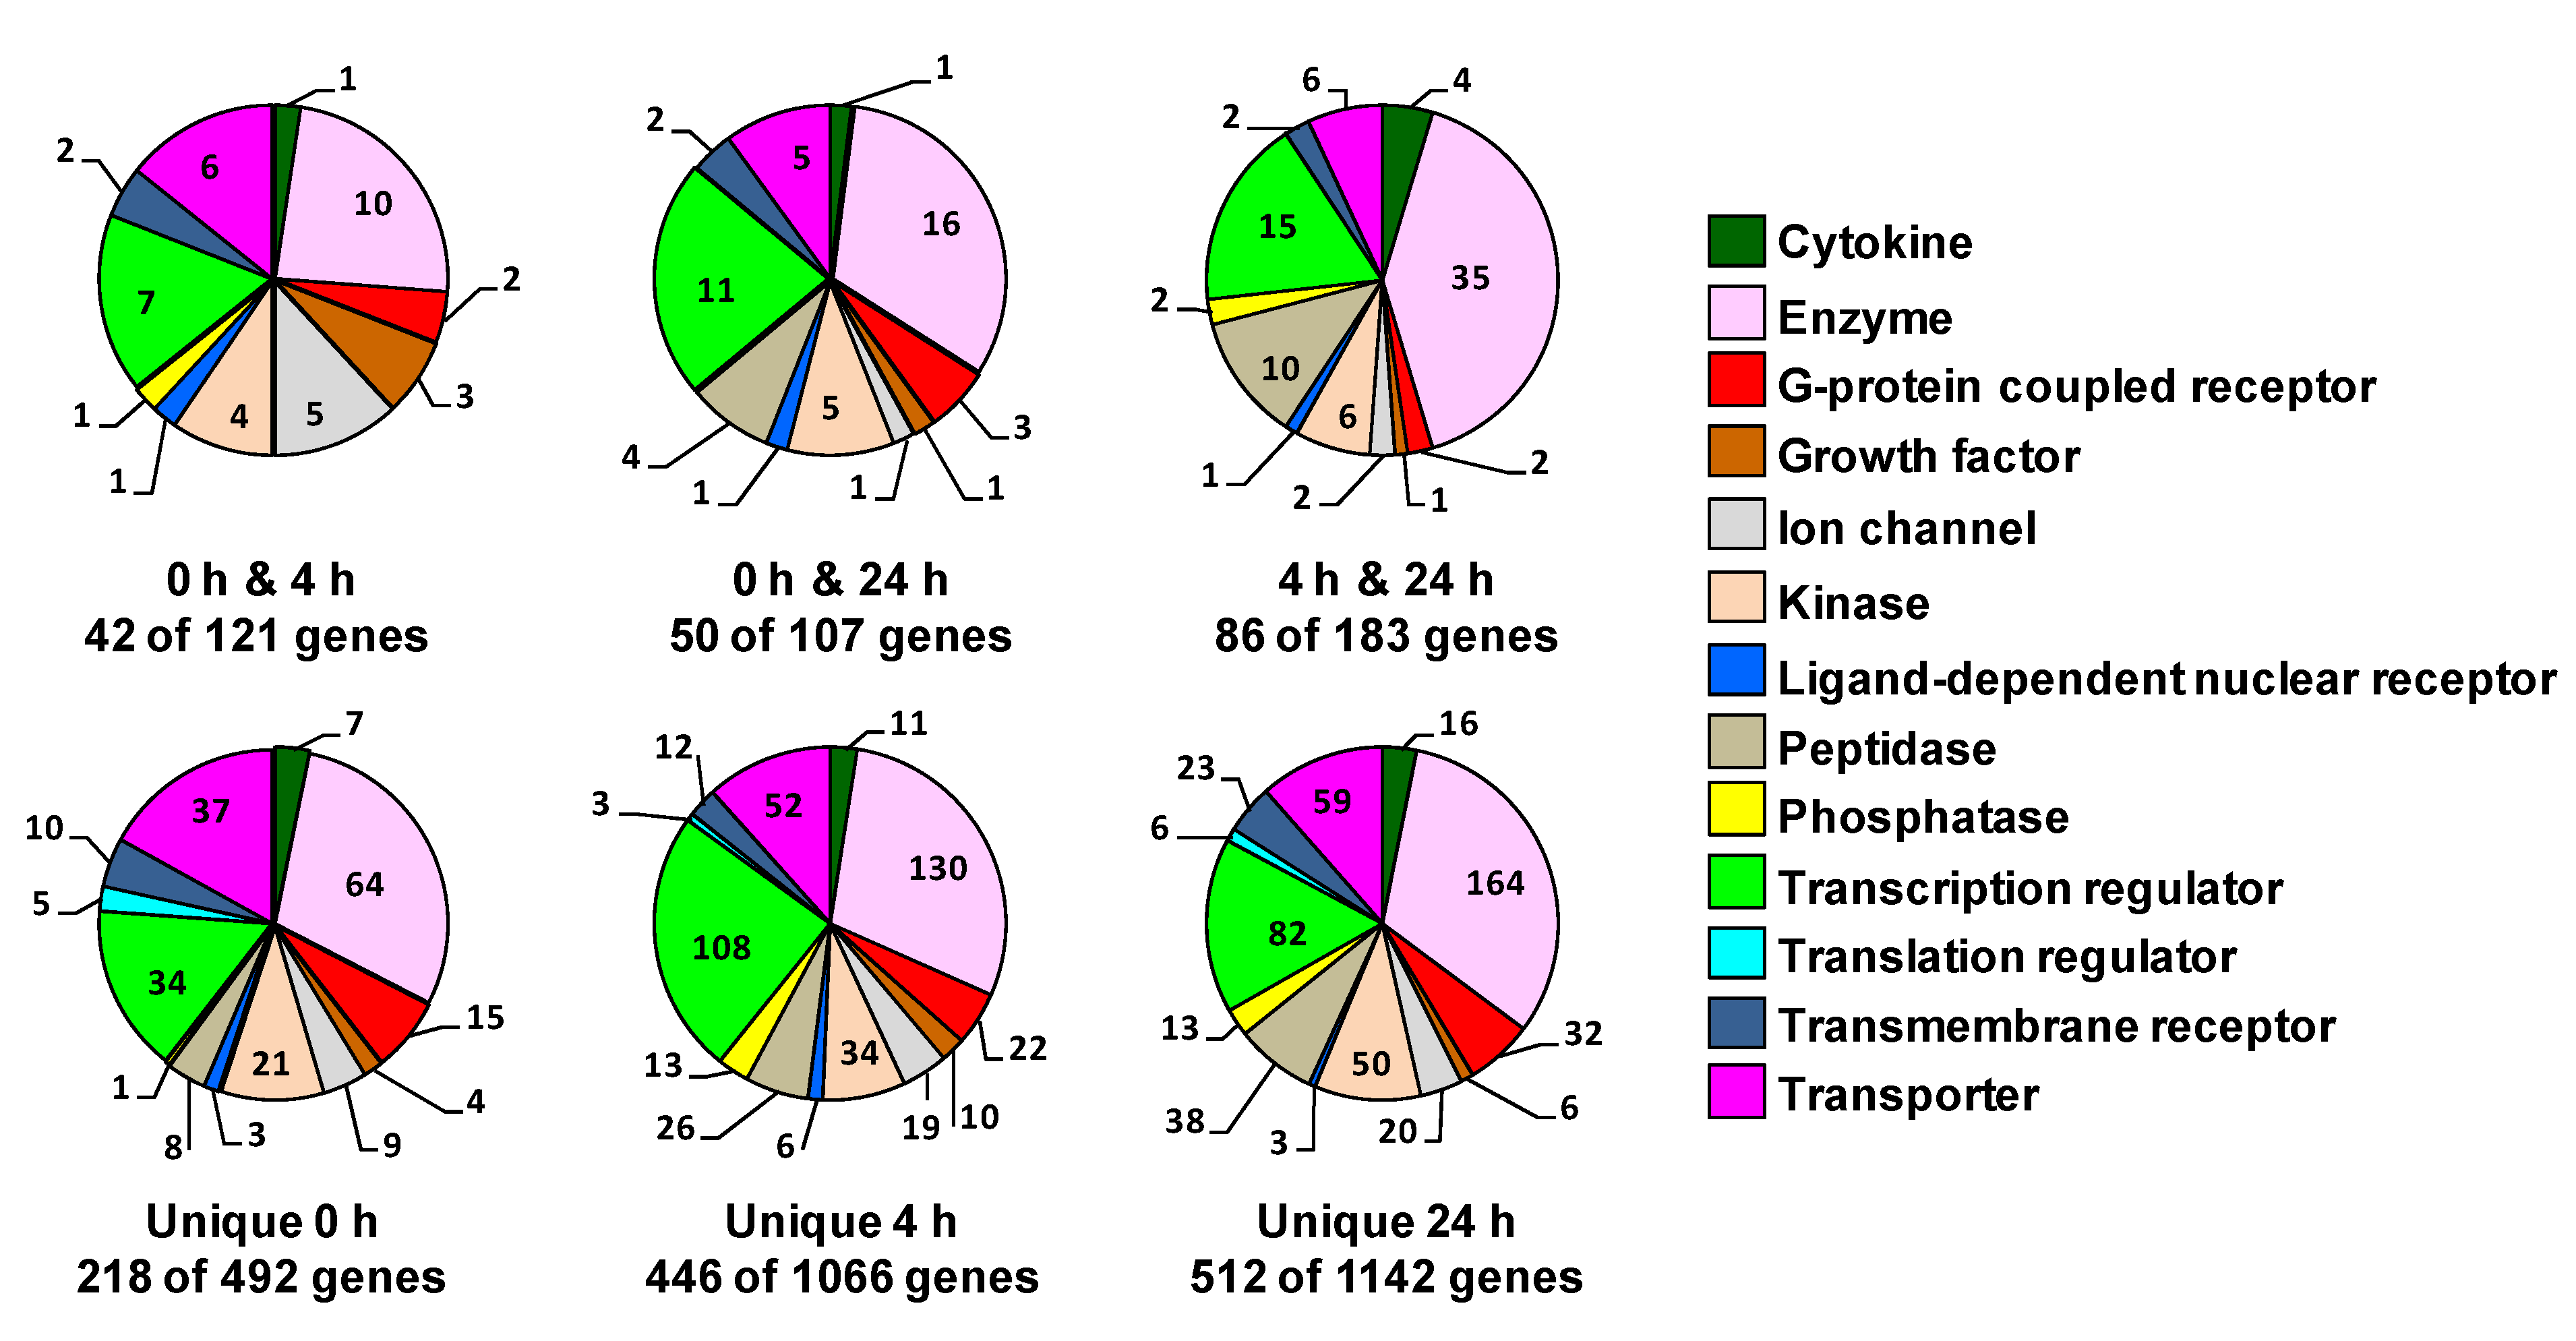
The gene families related to the unique genes or the genes shared between each two time points, as well as the number of genes per each family are illustrated in the pie charts in
Figure 8. The gene families included those mentioned for the 50 common genes in addition to other gene families, such as G-protein coupled receptor, growth factor, cytokine, translation regulator and transmembrane receptor family. The genes classified by IPA as “other” were omitted in this representation. A list of all these genes and fold-change following heat-shock in the different interval of recovery is added as tables in the supplemental materials.
Figure 8.
Gene family of the genes that are unique or are shared at two time points. The pie chart sectors represent the number of genes associated with each function indicated in the legend. The numbers of these genes are indicated for each function. The genes classified by IPA as “other” were not included in this representation. Genes were filtered for an absolute value log2 ratio ≥1.5 and a significance value of p ≤ 0.05.
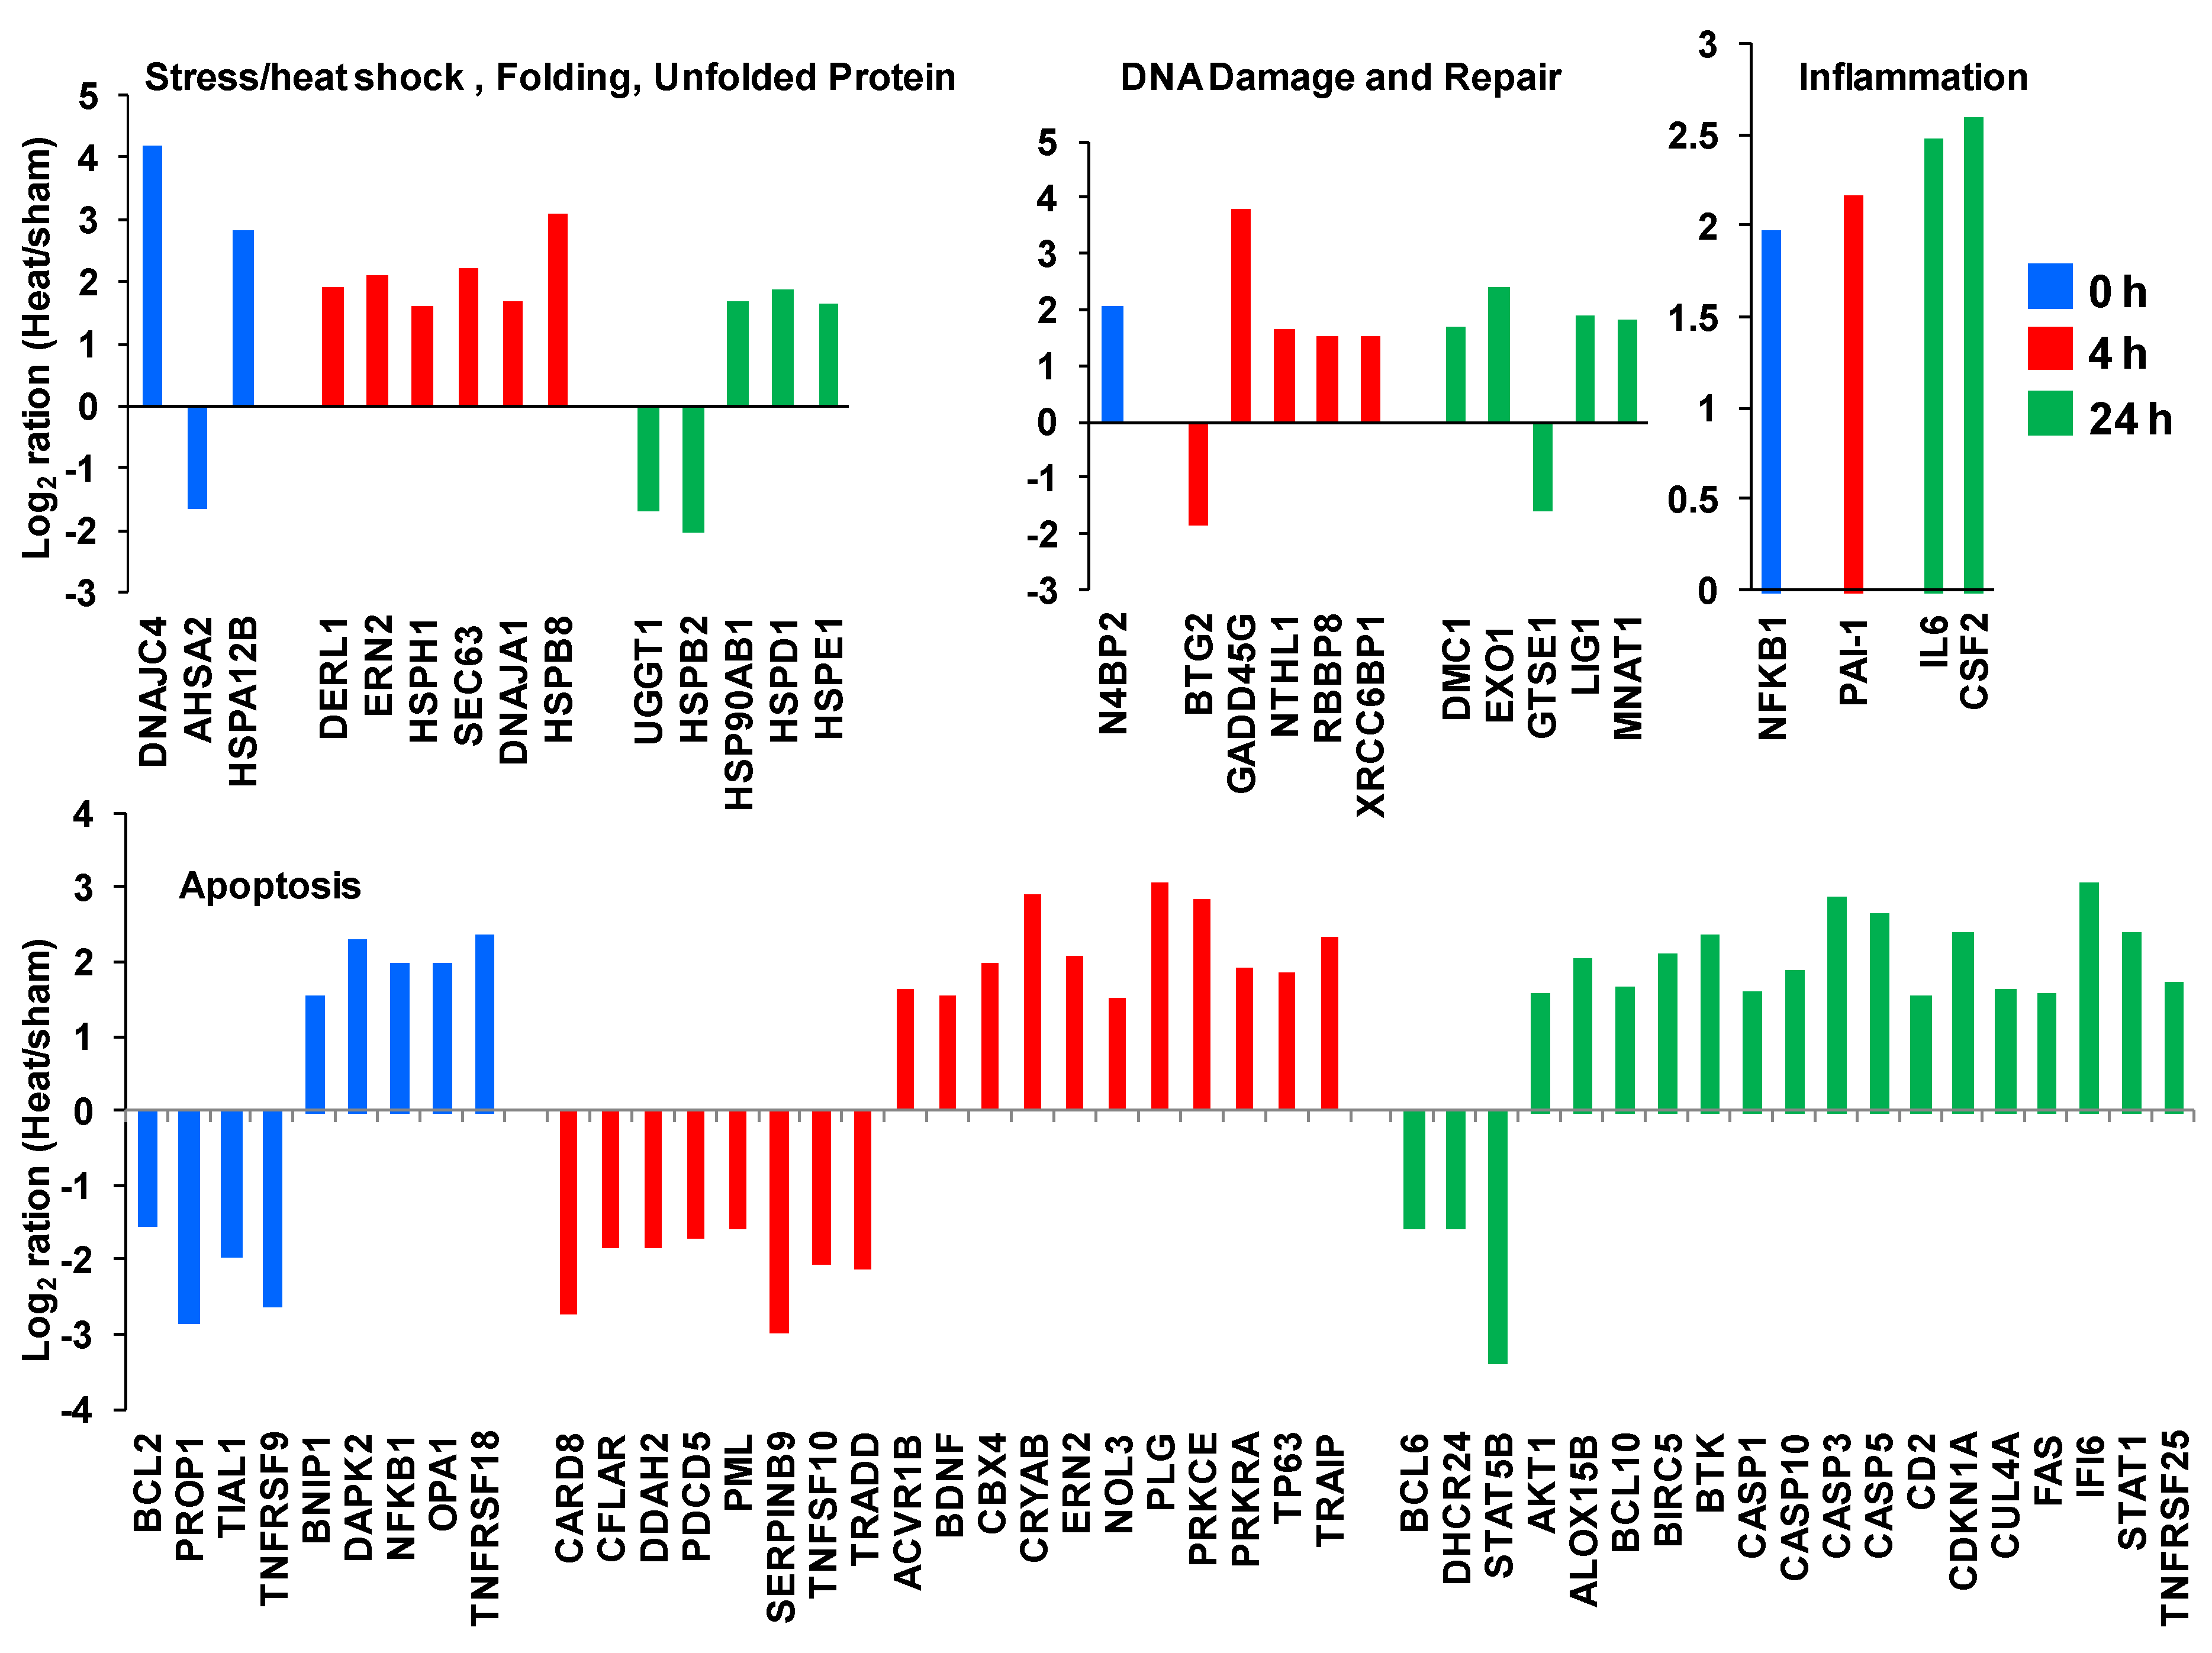
In
Figure 9, we highlight a set of genes from the unique genes list that are recognized to play roles in cellular stress response. These include genes involved as heat shock proteins and genes supporting DNA damage and repair, inflammation and apoptosis.
Figure 9.
Gene expression profiles for a set of unique genes involved in several well-characterized pathways of the cellular stress response.
Figure 9.
Gene expression profiles for a set of unique genes involved in several well-characterized pathways of the cellular stress response.
2.5. Pathway Analysis of Microarray Analyzed Data
We next used IPA to analyze the metabolic and signaling pathways that are affected in response to heat stress following the three post-heat time points. We found that at 0 h, 33 of 247 canonical pathways were expressed with statistical significance, defined as [(−log(
p-value) ≥ 1.3 or
p-value ≤ 0.05] (
Table 1). At 4 h post-heat, 19 out of 198 scored Ingenuity Canonical Pathways had significant likelihood (
Table 2). At 24 h post-heat, IPA scored 229 Ingenuity Canonical Pathways, of which 36 had significant
p-values (
Table 3).
Table 1.
Significant canonical pathways at 0 h post-heat exposure. Two-hundred seventy-four Ingenuity Canonical Pathways were scored at 0 h post-heat exposure; only the 33 listed pathways fit the cut-off of p-value ≤ 0.05.
Table 1.
Significant canonical pathways at 0 h post-heat exposure. Two-hundred seventy-four Ingenuity Canonical Pathways were scored at 0 h post-heat exposure; only the 33 listed pathways fit the cut-off of p-value ≤ 0.05.
| Ingenuity Canonical Pathways | −log(p-value) | Ratio | # of Molecules |
|---|
| IL-12 Signaling and Production in Macrophages | 4.66 | 0.118 | 16 |
| Glucocorticoid Receptor Signaling | 1.83 | 0.061 | 16 |
| Role of Macrophages, Fibroblasts and Endothelial Cells in Rheumatoid Arthritis | 1.41 | 0.054 | 16 |
| Production of Nitric Oxide and Reactive Oxygen Species in Macrophages | 1.85 | 0.070 | 13 |
| Clathrin-Mediated Endocytosis Signaling | 1.80 | 0.069 | 13 |
| Dopamine-DARPP32 Feedback in cAMP Signaling | 1.46 | 0.067 | 11 |
| NF-κB Signaling | 1.42 | 0.065 | 11 |
| RAR Activation | 1.35 | 0.063 | 11 |
| Neuropathic Pain Signaling in Dorsal Horn Neurons | 2.35 | 0.094 | 10 |
| Type II Diabetes Mellitus Signaling | 2.07 | 0.079 | 10 |
| Virus Entry via Endocytic Pathways | 2.28 | 0.098 | 9 |
| Synaptic Long-Term Potentiation | 1.88 | 0.087 | 9 |
| fMLP Signaling in Neutrophils | 1.78 | 0.077 | 9 |
| PKCθ Signaling in T-lymphocytes | 1.64 | 0.071 | 9 |
| Role of Pattern Recognition Receptors in Recognition of Bacteria and Viruses | 2.29 | 0.104 | 8 |
| T-cell Receptor Signaling | 1.61 | 0.078 | 8 |
| iCOS-iCOSL Signaling in T Helper Cells | 1.45 | 0.071 | 8 |
| Rac Signaling | 1.45 | 0.068 | 8 |
| Pancreatic Adenocarcinoma Signaling | 1.41 | 0.070 | 8 |
| Renin-Angiotensin Signaling | 1.33 | 0.070 | 8 |
| Erythropoietin Signaling | 1.95 | 0.095 | 7 |
| Macropinocytosis Signaling | 1.92 | 0.092 | 7 |
| NF-κB Activation by Viruses | 1.76 | 0.089 | 7 |
| Ceramide Signaling | 1.62 | 0.085 | 7 |
| RANK Signaling in Osteoclasts | 1.42 | 0.076 | 7 |
| Calcium-induced T-lymphocyte Apoptosis | 1.72 | 0.098 | 6 |
| Growth Hormone Signaling | 1.42 | 0.085 | 6 |
| Complement System | 2.24 | 0.152 | 5 |
| MSP-RON Signaling Pathway | 1.66 | 0.109 | 5 |
| Cell Cycle: G1/S Checkpoint Regulation | 1.33 | 0.085 | 5 |
| Role of CHK Proteins in Cell Cycle Checkpoint Control | 1.50 | 0.114 | 4 |
| IL-9 Signaling | 1.46 | 0.105 | 4 |
| April Mediated Signaling | 1.31 | 0.095 | 4 |
Table 2.
Significant canonical pathways in 4 h post-heat exposure. 198 Ingenuity Canonical Pathways were scored at 4 h post-heat exposure; only the 19 listed pathways fit the cut-off of p-value ≤ 0.05.
Table 2.
Significant canonical pathways in 4 h post-heat exposure. 198 Ingenuity Canonical Pathways were scored at 4 h post-heat exposure; only the 19 listed pathways fit the cut-off of p-value ≤ 0.05.
| Ingenuity Canonical Pathways | −log(p-value) | Ratio | # of Molecules |
|---|
| Leukocyte Extravasation Signaling | 2.58 | 0.127 | 24 |
| Huntington’s Disease Signaling | 2.39 | 0.114 | 26 |
| Tight Junction Signaling | 2.34 | 0.127 | 20 |
| Bladder Cancer Signaling | 2.15 | 0.144 | 13 |
| VDR/RXR Activation | 2.12 | 0.152 | 12 |
| ATM Signaling | 2.04 | 0.167 | 9 |
| Coagulation System | 2.02 | 0.200 | 7 |
| Colorectal Cancer Metastasis Signaling | 1.90 | 0.107 | 26 |
| Wnt/β-catenin Signaling | 1.90 | 0.118 | 20 |
| Cyclins and Cell Cycle Regulation | 1.76 | 0.126 | 11 |
| Role of Macrophages, Fibroblasts and Endothelial Cells in Rheumatoid Arthritis | 1.70 | 0.096 | 30 |
| Nur77 Signaling in T-lymphocytes | 1.62 | 0.140 | 8 |
| IL-17A Signaling in Gastric Cells | 1.57 | 0.200 | 5 |
| Cell Cycle: G1/S Checkpoint Regulation | 1.49 | 0.136 | 8 |
| IL-17A Signaling in Fibroblasts | 1.49 | 0.154 | 6 |
| Nitrogen Metabolism | 1.49 | 0.171 | 6 |
| Production of Nitric Oxide and Reactive Oxygen Species in Macrophages | 1.37 | 0.103 | 19 |
| Ceramide Signaling | 1.35 | 0.122 | 10 |
| Aldosterone Signaling in Epithelial Cells | 1.35 | 0.106 | 17 |
Table 3.
Significant canonical pathways at 24 h post-heat exposure. 229 Ingenuity Canonical Pathways were scored at 24 h post-heat exposure; only the 36 listed pathways fit the cut-off of p-value ≤ 0.05.
Table 3.
Significant canonical pathways at 24 h post-heat exposure. 229 Ingenuity Canonical Pathways were scored at 24 h post-heat exposure; only the 36 listed pathways fit the cut-off of p-value ≤ 0.05.
| Ingenuity Canonical Pathways | −log(p-value) | Ratio | # of Molecules |
|---|
| Aryl Hydrocarbon Receptor Signaling | 4.33 | 0.170 | 23 |
| Linoleic Acid Metabolism | 2.78 | 0.197 | 11 |
| Role of IL-17A in Psoriasis | 2.74 | 0.385 | 4 |
| Bladder Cancer Signaling | 2.72 | 0.167 | 14 |
| Oncostatin M Signaling | 2.52 | 0.235 | 7 |
| TREM1 Signaling | 2.39 | 0.189 | 9 |
| Cell Cycle: G1/S Checkpoint Regulation | 2.21 | 0.169 | 9 |
| Fcγ Receptor-mediated Phagocytosis in Macrophages and Monocytes | 2.08 | 0.149 | 13 |
| Role of CHK Proteins in Cell Cycle Checkpoint Control | 2.00 | 0.200 | 6 |
| Glucocorticoid Receptor Signaling | 1.94 | 0.108 | 29 |
| Atherosclerosis Signaling | 1.90 | 0.128 | 15 |
| Cell Cycle: G2/M DNA Damage Checkpoint Regulation | 1.88 | 0.167 | 7 |
| Amino sugars Metabolism | 1.88 | 0.159 | 10 |
| Metabolism of Xenobiotics by Cytochrome P450 | 1.86 | 0.148 | 12 |
| IL-8 Signaling | 1.77 | 0.118 | 20 |
| Airway Pathology in Chronic Obstructive Pulmonary Disease | 1.75 | 0.375 | 2 |
| LPS/IL-1 Mediated Inhibition of RXR Function | 1.74 | 0.112 | 22 |
| Chronic Myeloid Leukemia Signaling | 1.71 | 0.127 | 12 |
| Arachidonic Acid Metabolism | 1.71 | 0.137 | 13 |
| Sphingosine-1-phosphate Signaling | 1.70 | 0.126 | 14 |
| Hereditary Breast Cancer Signaling | 1.67 | 0.125 | 14 |
| Leukocyte Extravasation Signaling | 1.66 | 0.116 | 21 |
| Role of BRCA1 in DNA Damage Response | 1.65 | 0.153 | 8 |
| Pancreatic Adenocarcinoma Signaling | 1.61 | 0.123 | 13 |
| Role of IL-17F in Allergic Inflammatory Airway Diseases | 1.56 | 0.167 | 6 |
| IL-10 Signaling | 1.53 | 0.139 | 9 |
| IL-22 Signaling | 1.52 | 0.208 | 4 |
| Cellular Effects of Sildenafil (Viagra) | 1.47 | 0.121 | 15 |
| Inhibition of Angiogenesis by TSP1 | 1.47 | 0.182 | 5 |
| Role of JAK Family Kinases in IL-6-type Cytokine Signaling | 1.45 | 0.192 | 4 |
| Tryptophan Metabolism | 1.45 | 0.127 | 13 |
| Purine Metabolism | 1.41 | 0.106 | 27 |
| Parkinson’s Signaling | 1.39 | 0.222 | 3 |
| p53 Signaling | 1.35 | 0.126 | 11 |
| cAMP-Mediated Signaling | 1.33 | 0.107 | 22 |
| IL-15 Production | 1.32 | 0.172 | 4 |
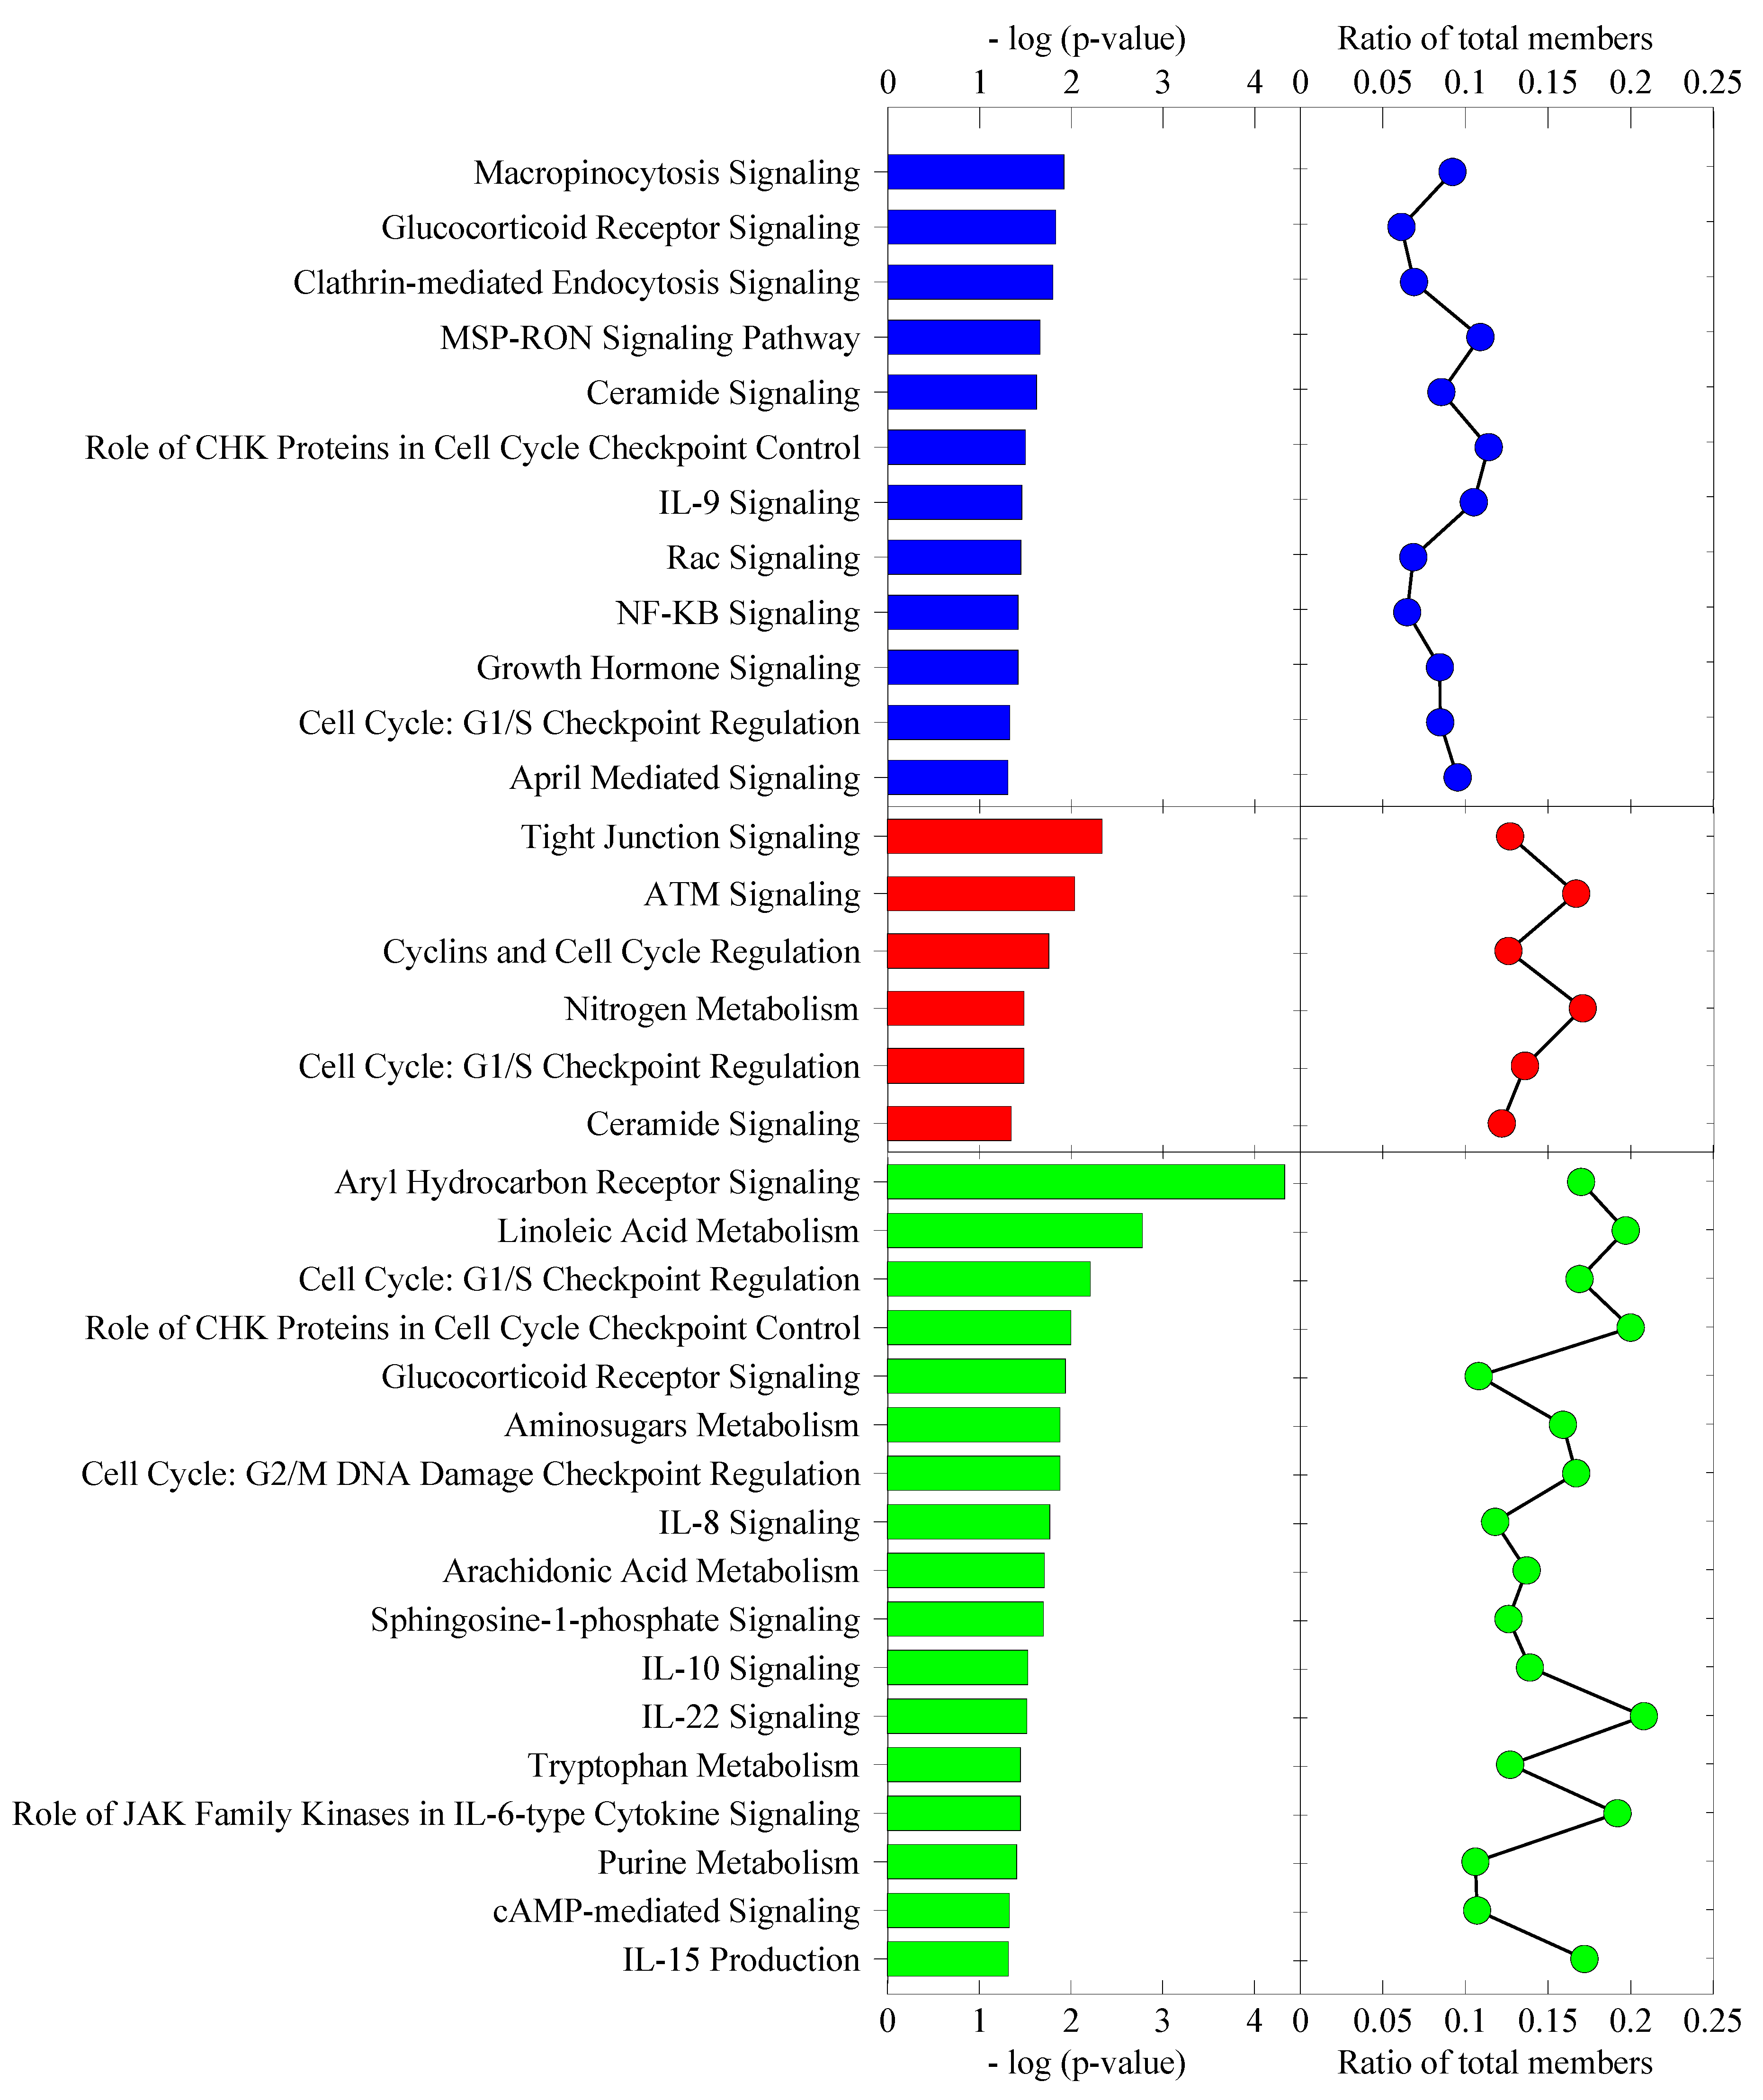
Subsequently, in order to highlight the pathways more relevant to cellular stress response, we further refined our analysis by excluding signaling pathway categories, such as cancer, cardiovascular and nervous system signaling, toxicity list and disease-specific pathways, in addition to non-skin cell-type-specific canonical pathways.
Figure 10 shows a refined presentation of the top canonical pathways for each post-heat recovery time point. For the cell cycle, the G1/S checkpoint regulation pathway was affected in all three time points
. The ceramide signaling pathway was affected in both 0 h and 4 h. The glucocorticoid receptor signaling pathway and role of CHK proteins in cell cycle checkpoint control were affected in both 0 h and 24 h. All the remaining canonical pathways involved were exclusive to a particular time point. Notably, although most of the canonical pathways in each post-heat time point were unique, they actually serve overlapping top cellular functions. The canonical pathways playing a role in cellular function and maintenance that were affected in 0 h post-heat consisted of MSP-RON signaling, Rac signaling pathways and two endocytosis pathways. Both endocytosis pathways, namely, macropinocytosis and clathrin-mediated endocytosis signaling pathways, play important roles in plasma membrane reorganization, internalization of extracellular molecules and in transduction of signals within the cell and between cells. Deregulation of seven and 13 genes in macropinocytosis signaling and clathrin-mediated endocytosis signaling, respectively, starting 0 h post-heat, implicate an immediate effect of heat shock on the plasma membrane and signal transduction. Macropinocytosis depends on signaling to the actin cytoskeleton, such as the Rac signaling pathway, which was also affected at 0 h post-heat, with eight deregulated genes, including the Rac activator, TIAM1 (T-lymphoma invasion and metastasis 1). Immediately, TIAM1 mRNA showed more than a 4-fold increase. Interestingly, TIAM1 has been reported to prevent cell death in heat-stressed wild-type murine keratinocytes, since the TIAM1 knock-out cells displayed increased apoptosis [
20].
Figure 10.
Classification of differentially expressed genes into various cellular stress response implicated canonical pathways. The [−log(p-value)] is the maximum p-value for all of the genes in each particular canonical pathway family. The ratio plot indicates the number of the genes expressed at each time point relative to the total number of genes in that particular canonical pathway group.
Of the canonical pathways affected at 4 h post-heat, tight junction signaling plays a role in cellular function and maintenance, whereas those affected at 24 h post-heat included amino sugar metabolism and cAMP-mediated signaling pathways. The latter is also important in controlling cellular assembly and organization in addition to post-translational modification. Notably, tight junction signaling also plays a role in cellular assembly and organization in addition to cell-to-cell signaling and interaction. The 0 h time-point post-heat affected pathways playing roles in the regulation of cellular development and/or in cellular growth and proliferation comprised cell cycle G1/S checkpoint regulation, the glucocorticoid receptor, IL-9, NF-κB, April-mediated and growth hormone signaling. The 24 h post-heat assessment showed that pathways regulating these functions are the cell cycle G1/S checkpoint regulation, the glucocorticoid receptor, IL-10 signaling, the role of JAK family kinases in IL-6-type cytokine signaling and purine metabolism, while affected pathways at 4 h post-heat included cell cycle G1/S checkpoint regulation only. The cell cycle control function is regulated by two pathways at 0 h post-heat, namely cell cycle G1/S checkpoint regulation and growth hormone signaling.
Whereas, four of the canonical pathways affected at 4 h post-heat (ATM signaling, cyclins, cell cycle regulation, nitrogen metabolism and cell cycle G1/S checkpoint regulation) function in the control of cell cycle progression. Six of the 17 canonical pathways affected at 24 h post-heat play a role in cell cycle control. These are aryl hydrocarbon receptor signaling, cell cycle G1/S checkpoint regulation, the role of CHK proteins in cell cycle checkpoint control, cell cycle G2/M DNA damage checkpoint regulation and the two metabolic pathways, linoleic acid metabolism and tryptophan metabolism. Cell death, on the other hand, is controlled by the ceramide signaling pathway that was affected at 0 and 4 h post-heat and by the related sphingosine-1-phosphate signaling pathway, as well as by the aryl hydrocarbon receptor signaling and cell cycle G2/M DNA damage checkpoint regulation, which were affected at 24 h post-heat. Interestingly, the canonical pathways involved in inflammatory response were only affected at 24 h post-heat. They consist of IL-10 and IL-22 signaling. The DNA replication, recombination and repair function involves the role of CHK proteins in cell cycle checkpoint control that was affected at 4 h and 24 h post-heat, the ATM signaling pathway that was affected at 4 h post-heat only and cell cycle G2/M DNA damage checkpoint regulation that was affected at 24 h post-heat only.


