
Genetic Control of Kinetochore-Driven Microtubule Growth in Drosophila Mitosis

 ,
,  ,
,  and
and 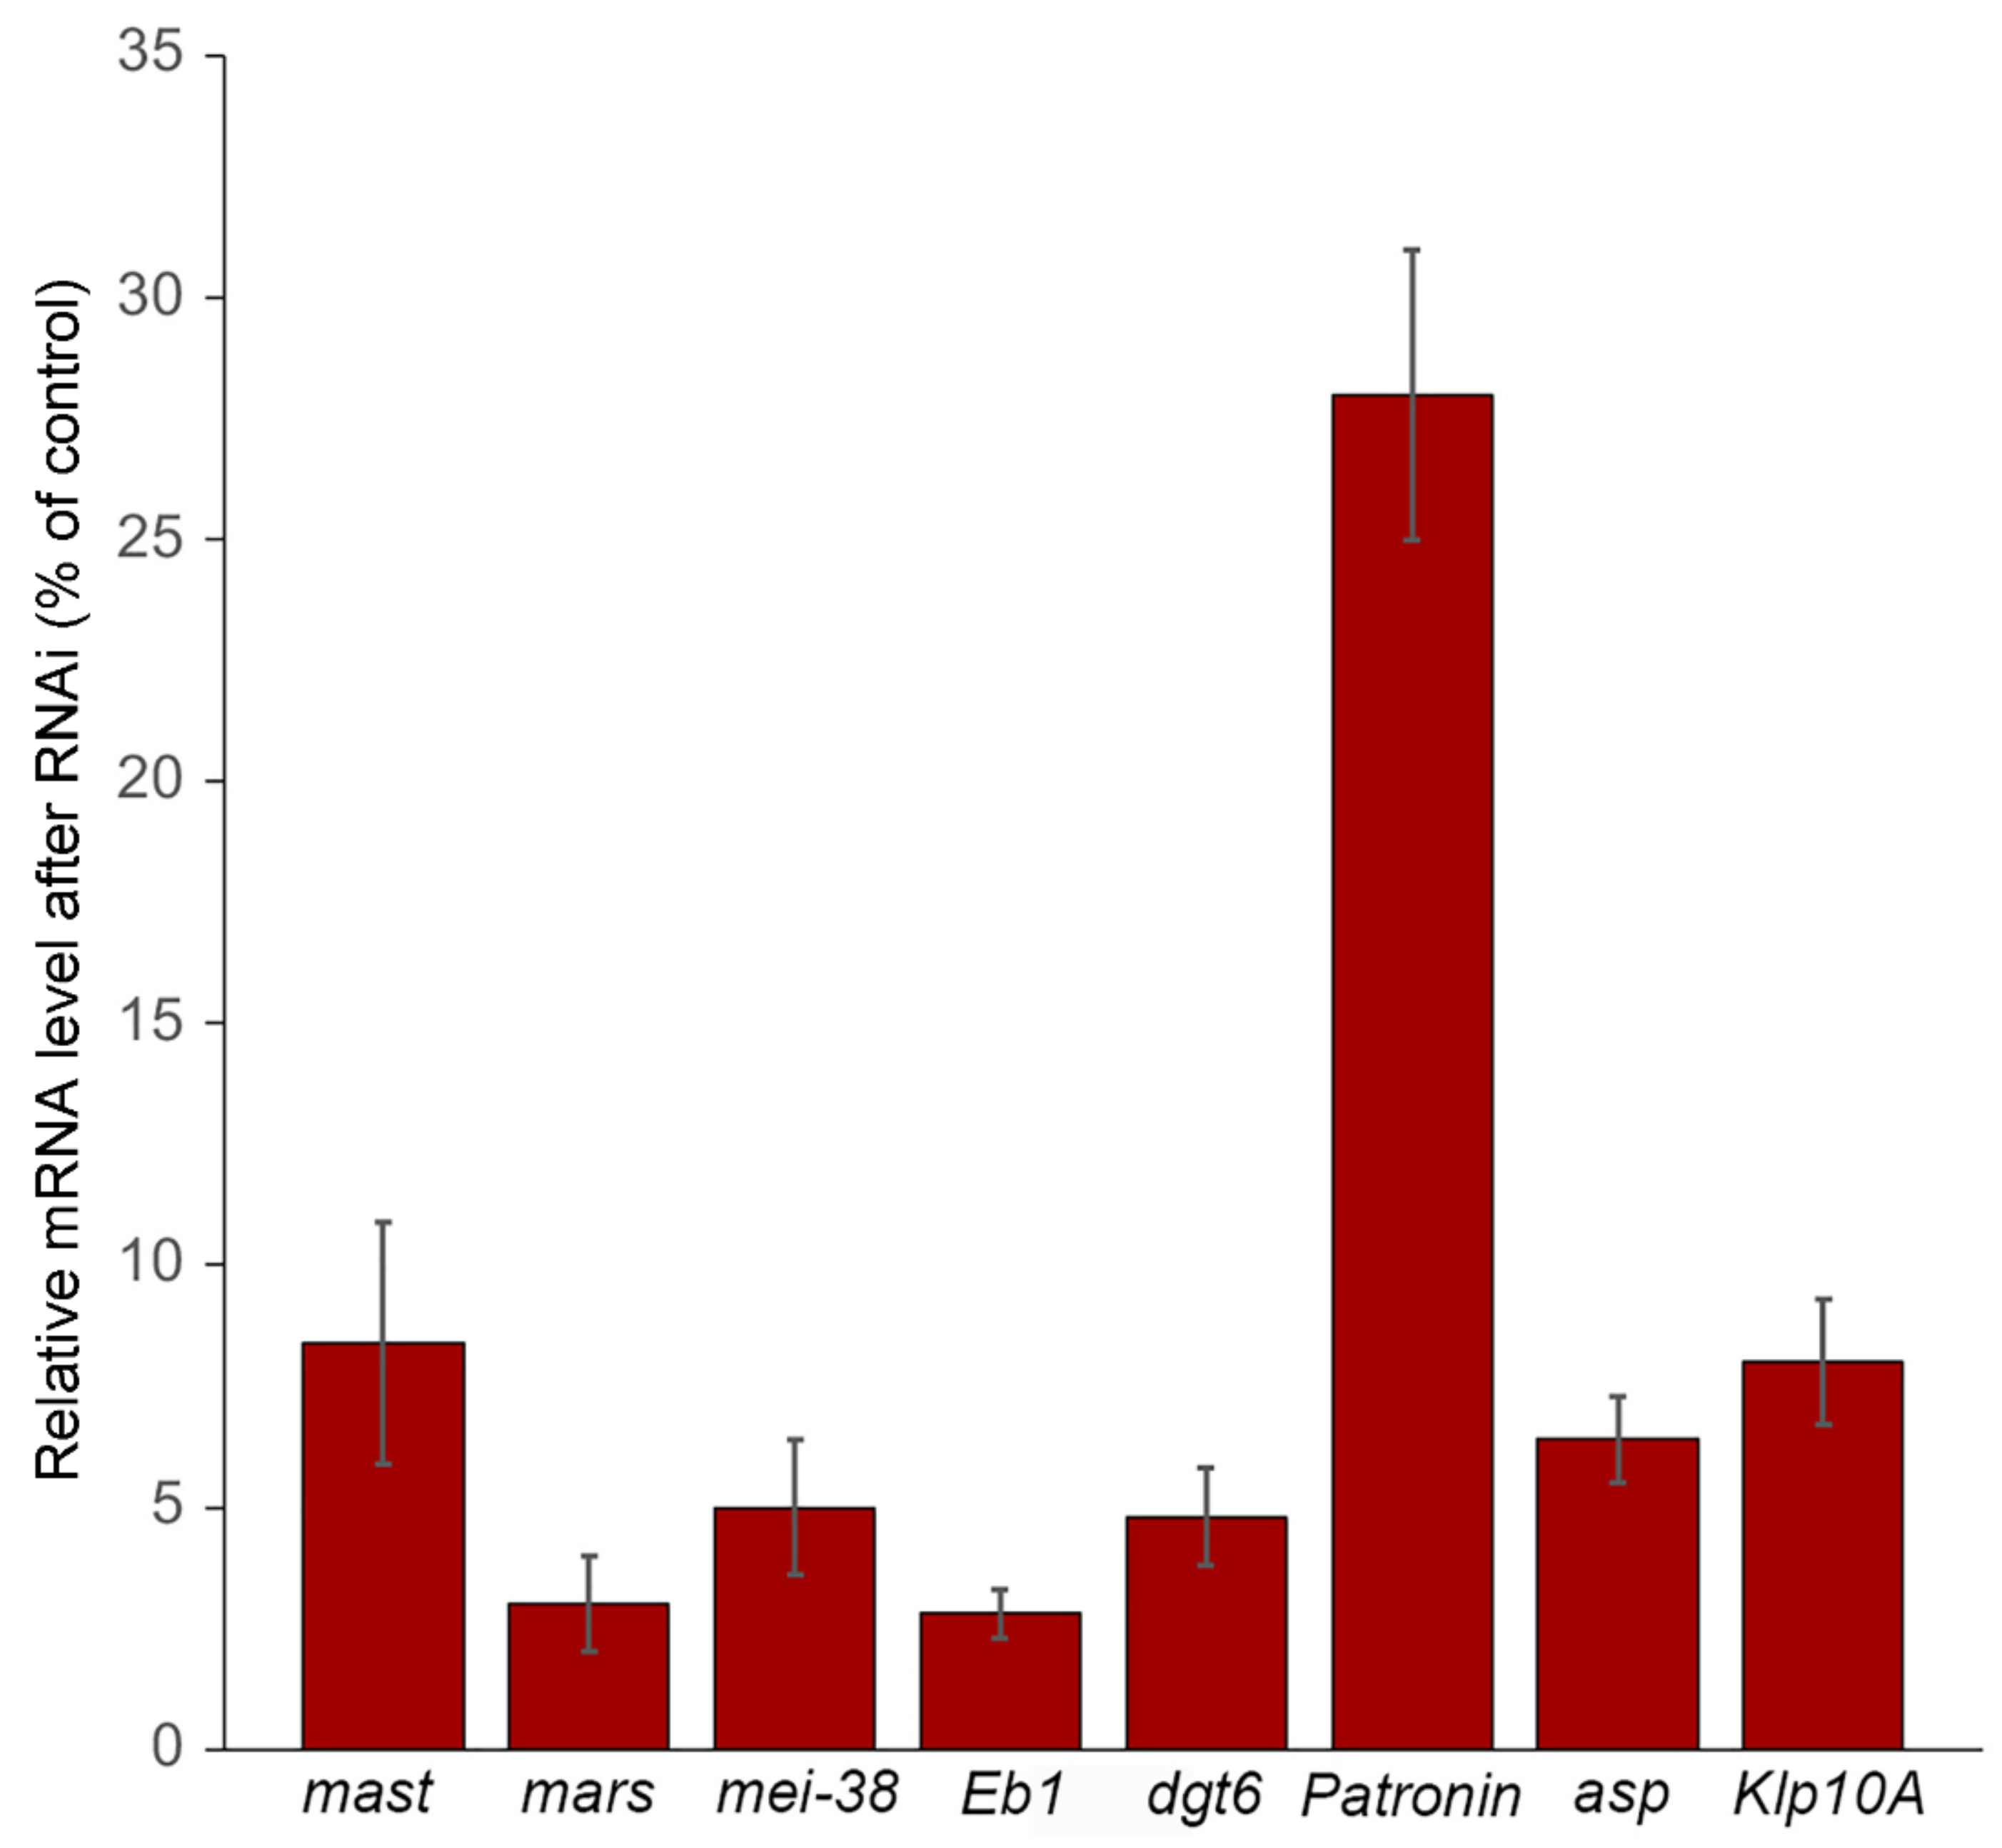
Abstract
:1. Introduction
2. Materials and Methods
2.1. Cell Cultures
2.2. dsRNA Production and RNAi Treatments
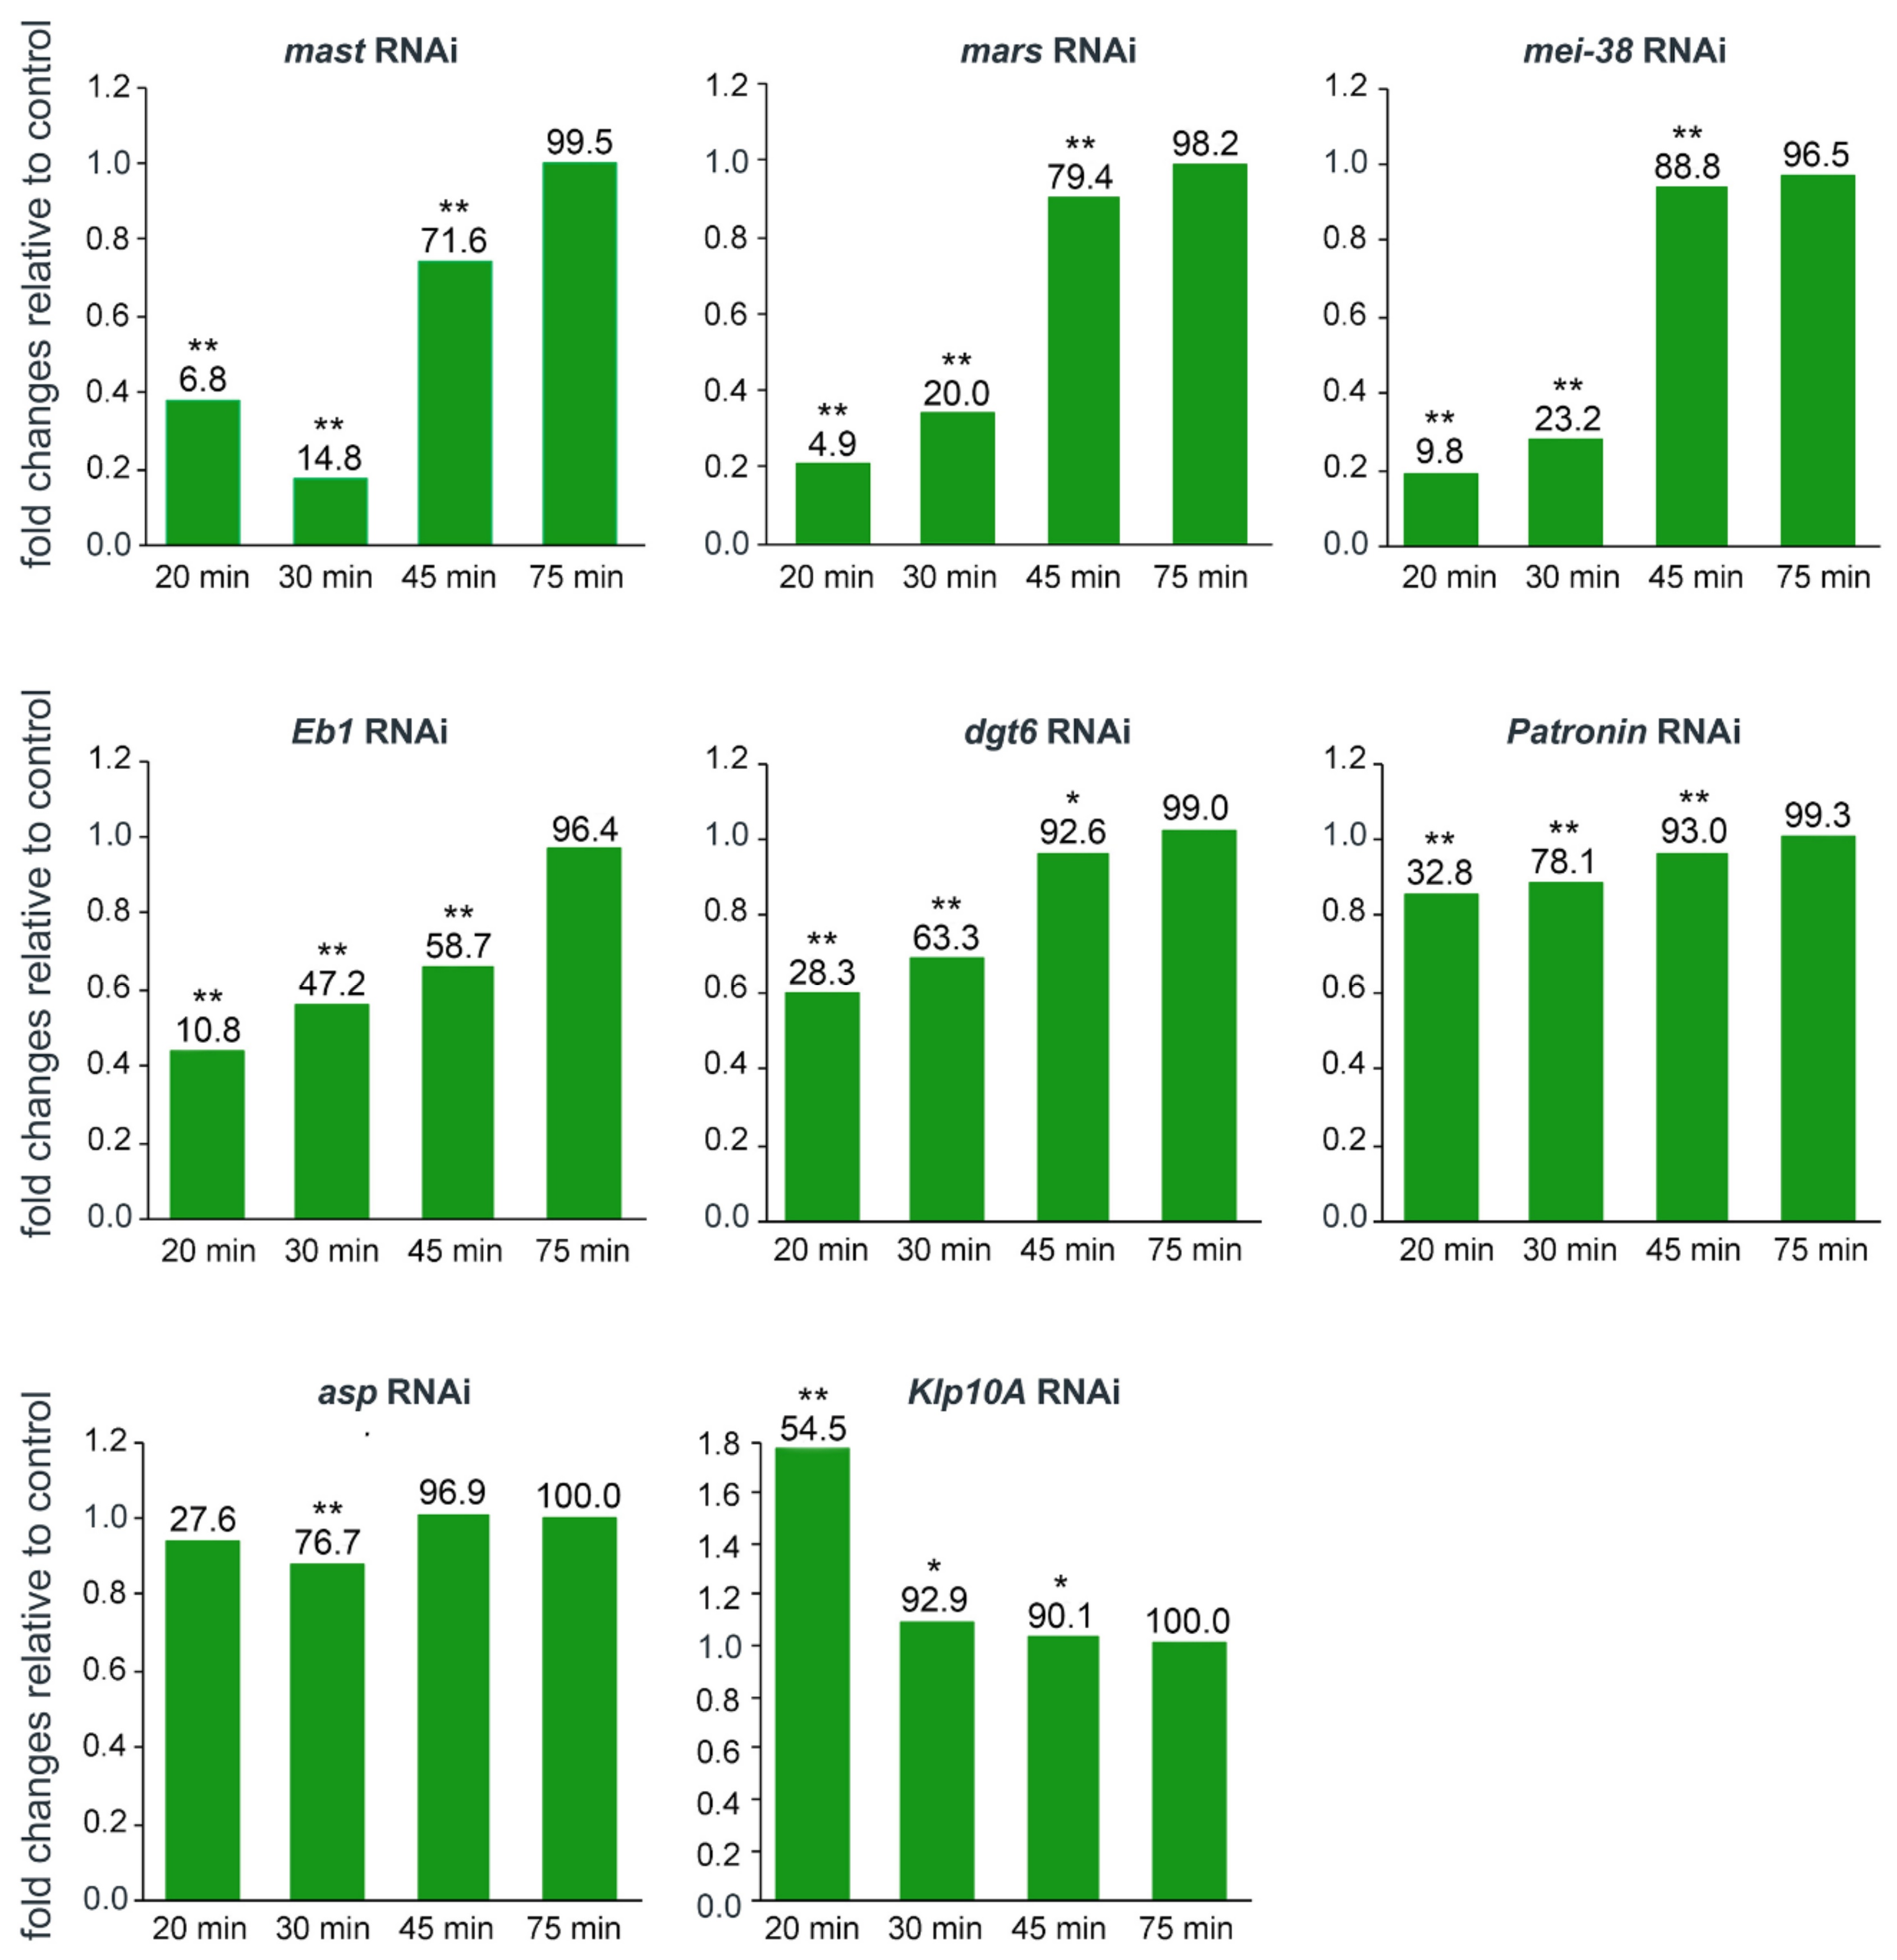
2.3. Evaluation of the RNAi Efficiency by RT-qPCR
2.4. Colcemid-Induced MT Depolymerization
2.5. Cold-Induced MT Depolymerization
2.6. Generation of S2 Cells Expressing GFP-Tagged Proteins
2.7. Fixation, Immunostaining, and Microscope Analysis
2.8. Spindle Length Measurements
2.9. Fluorescence Intensity Measures
3. Results
3.1. Efficiency of RNAi
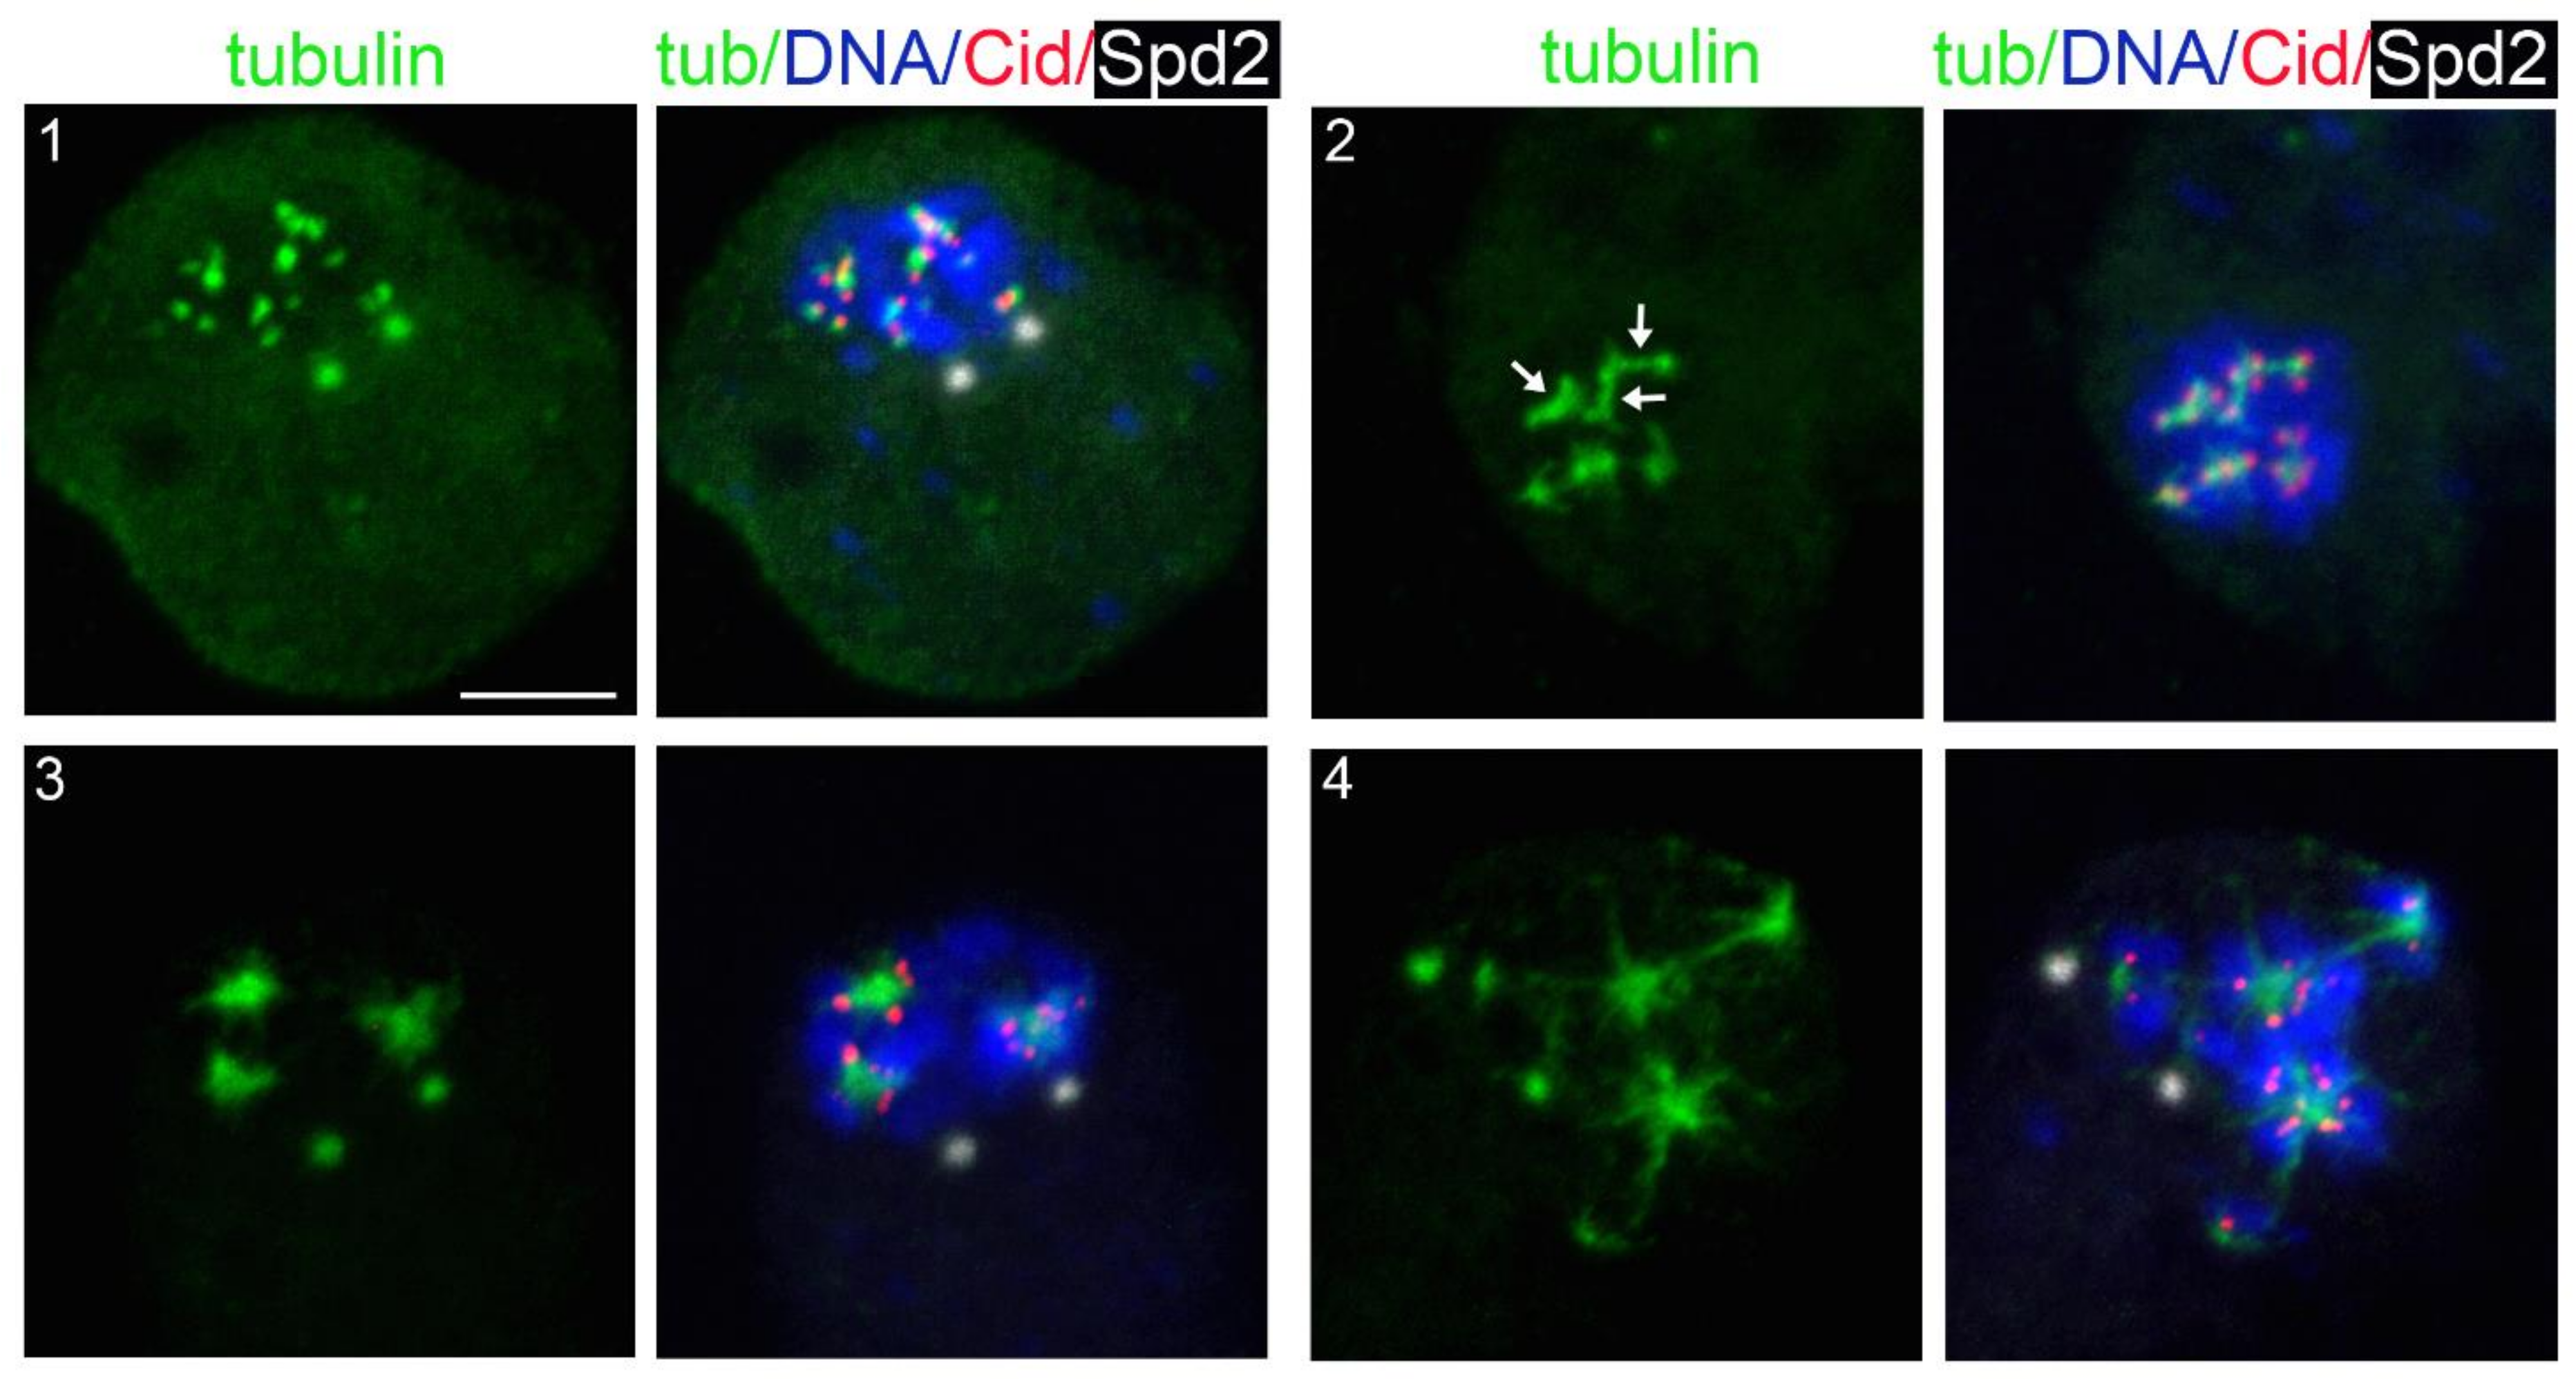
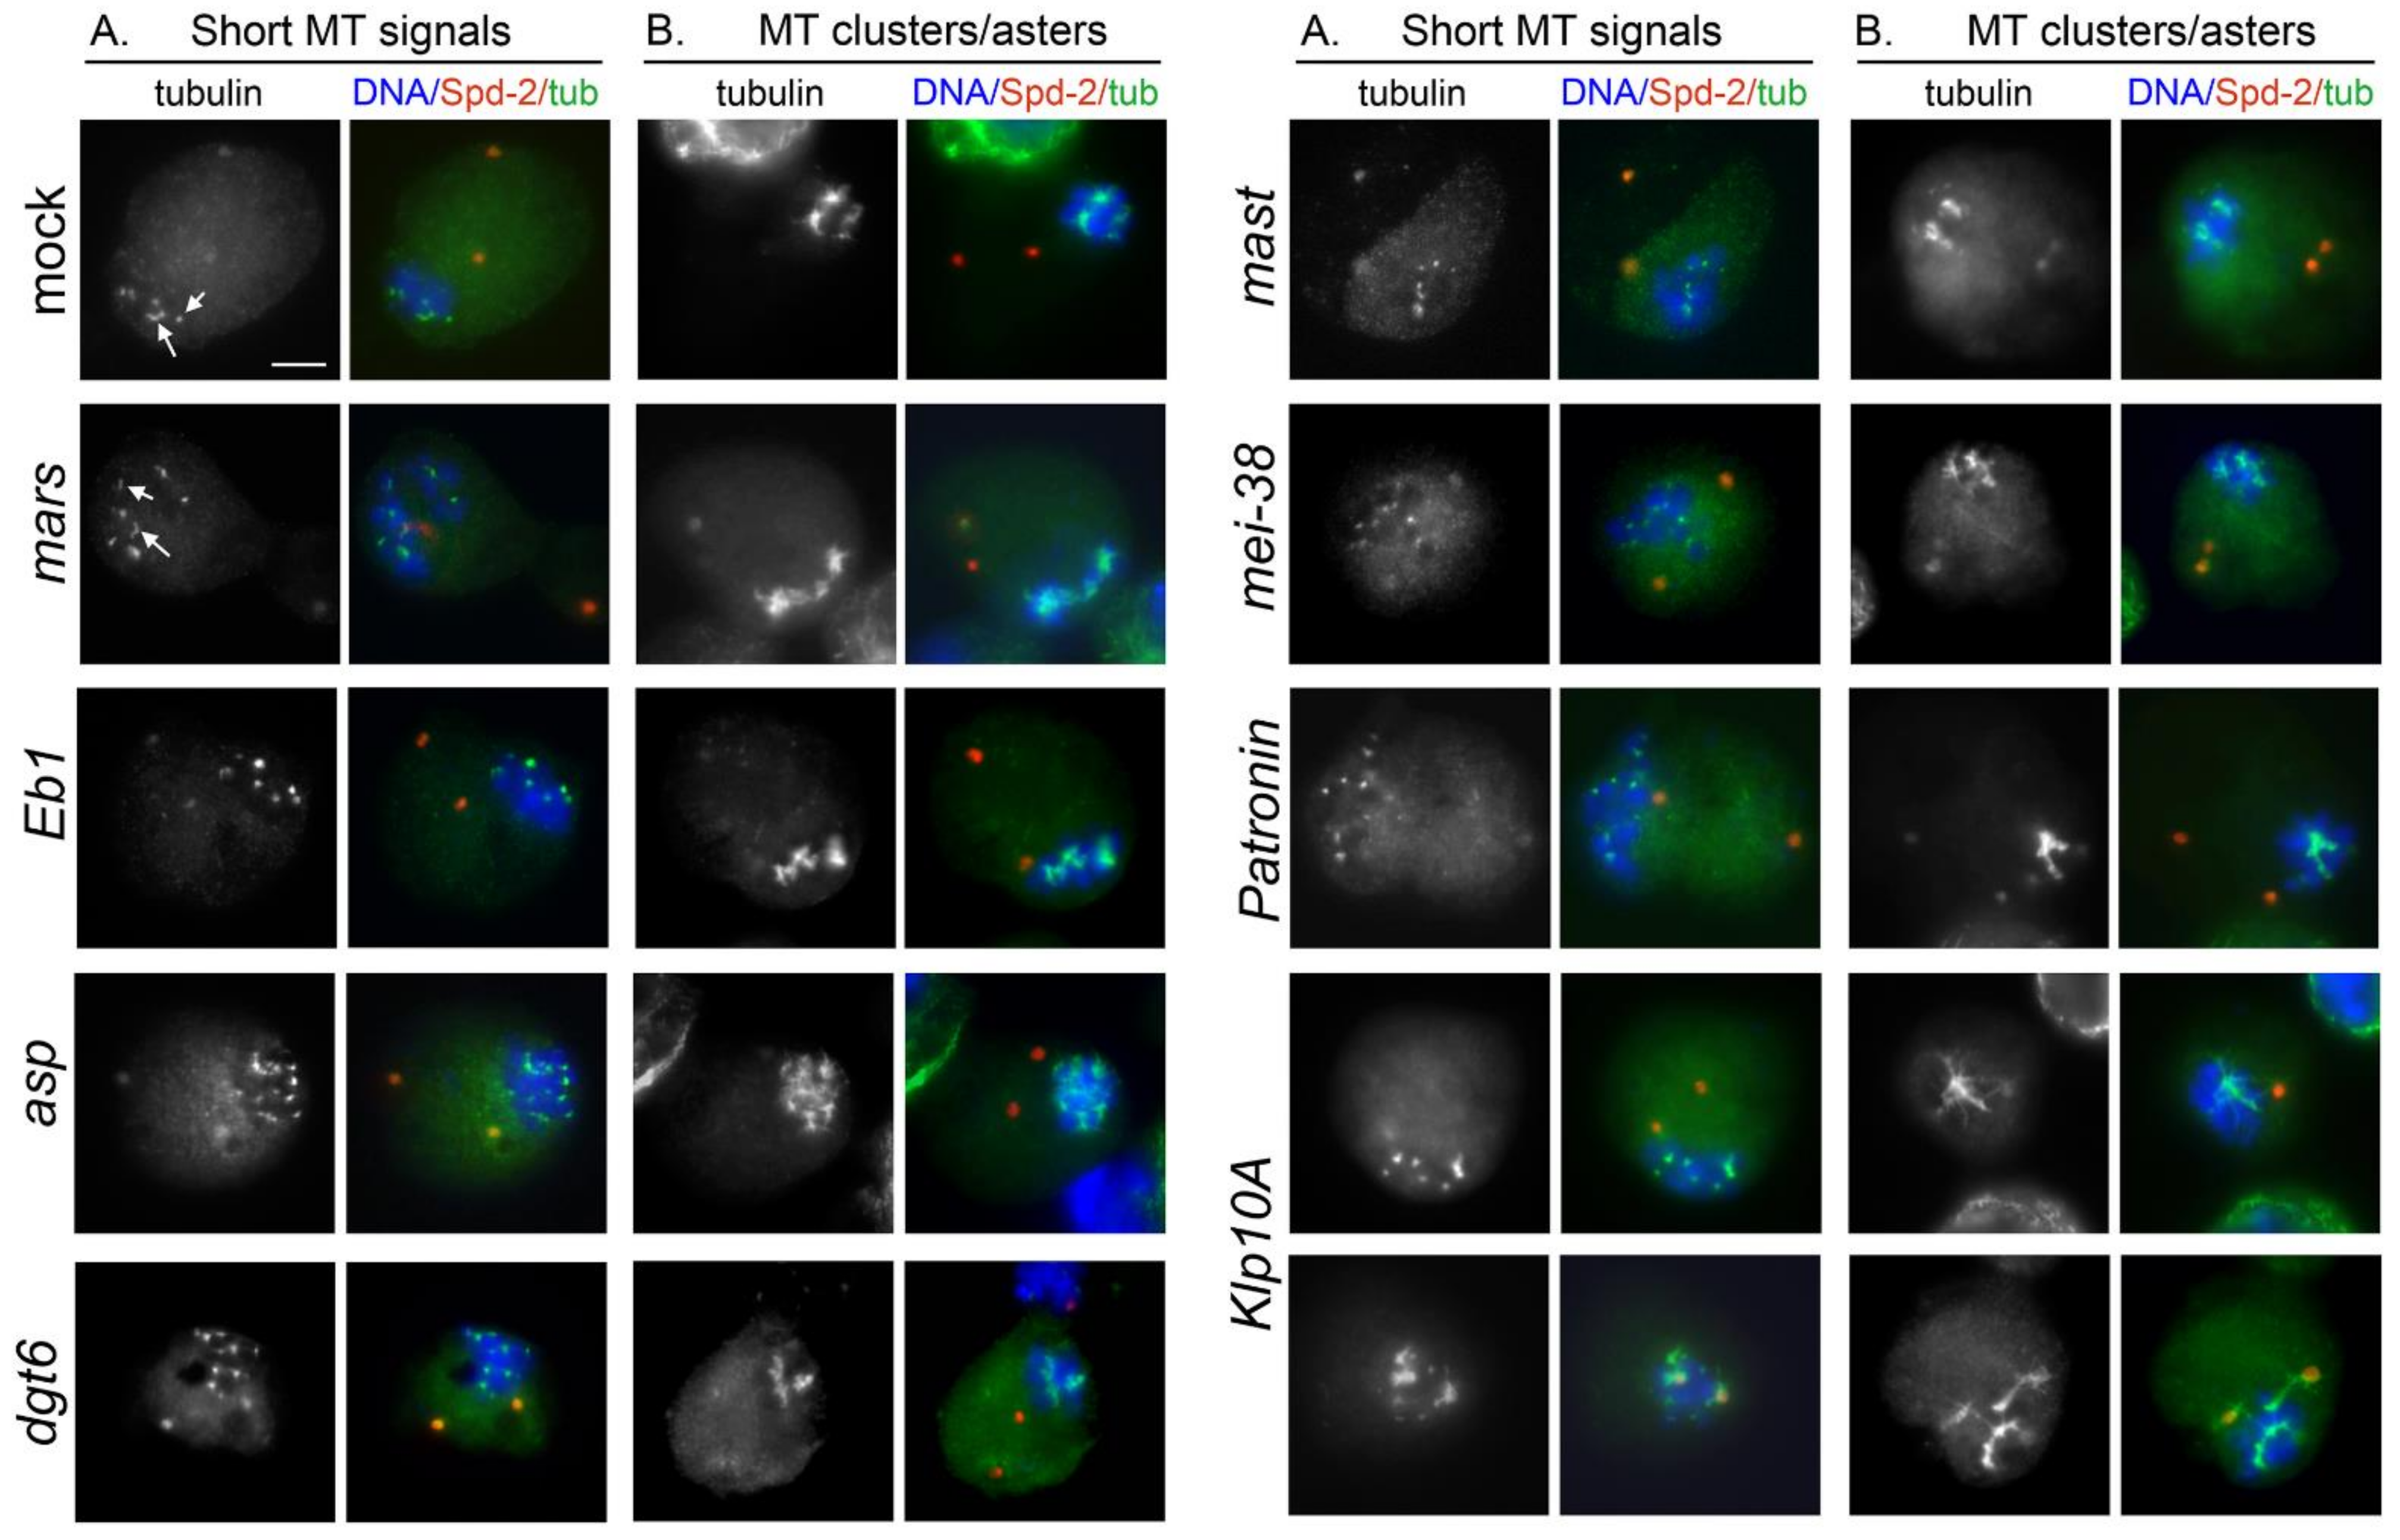
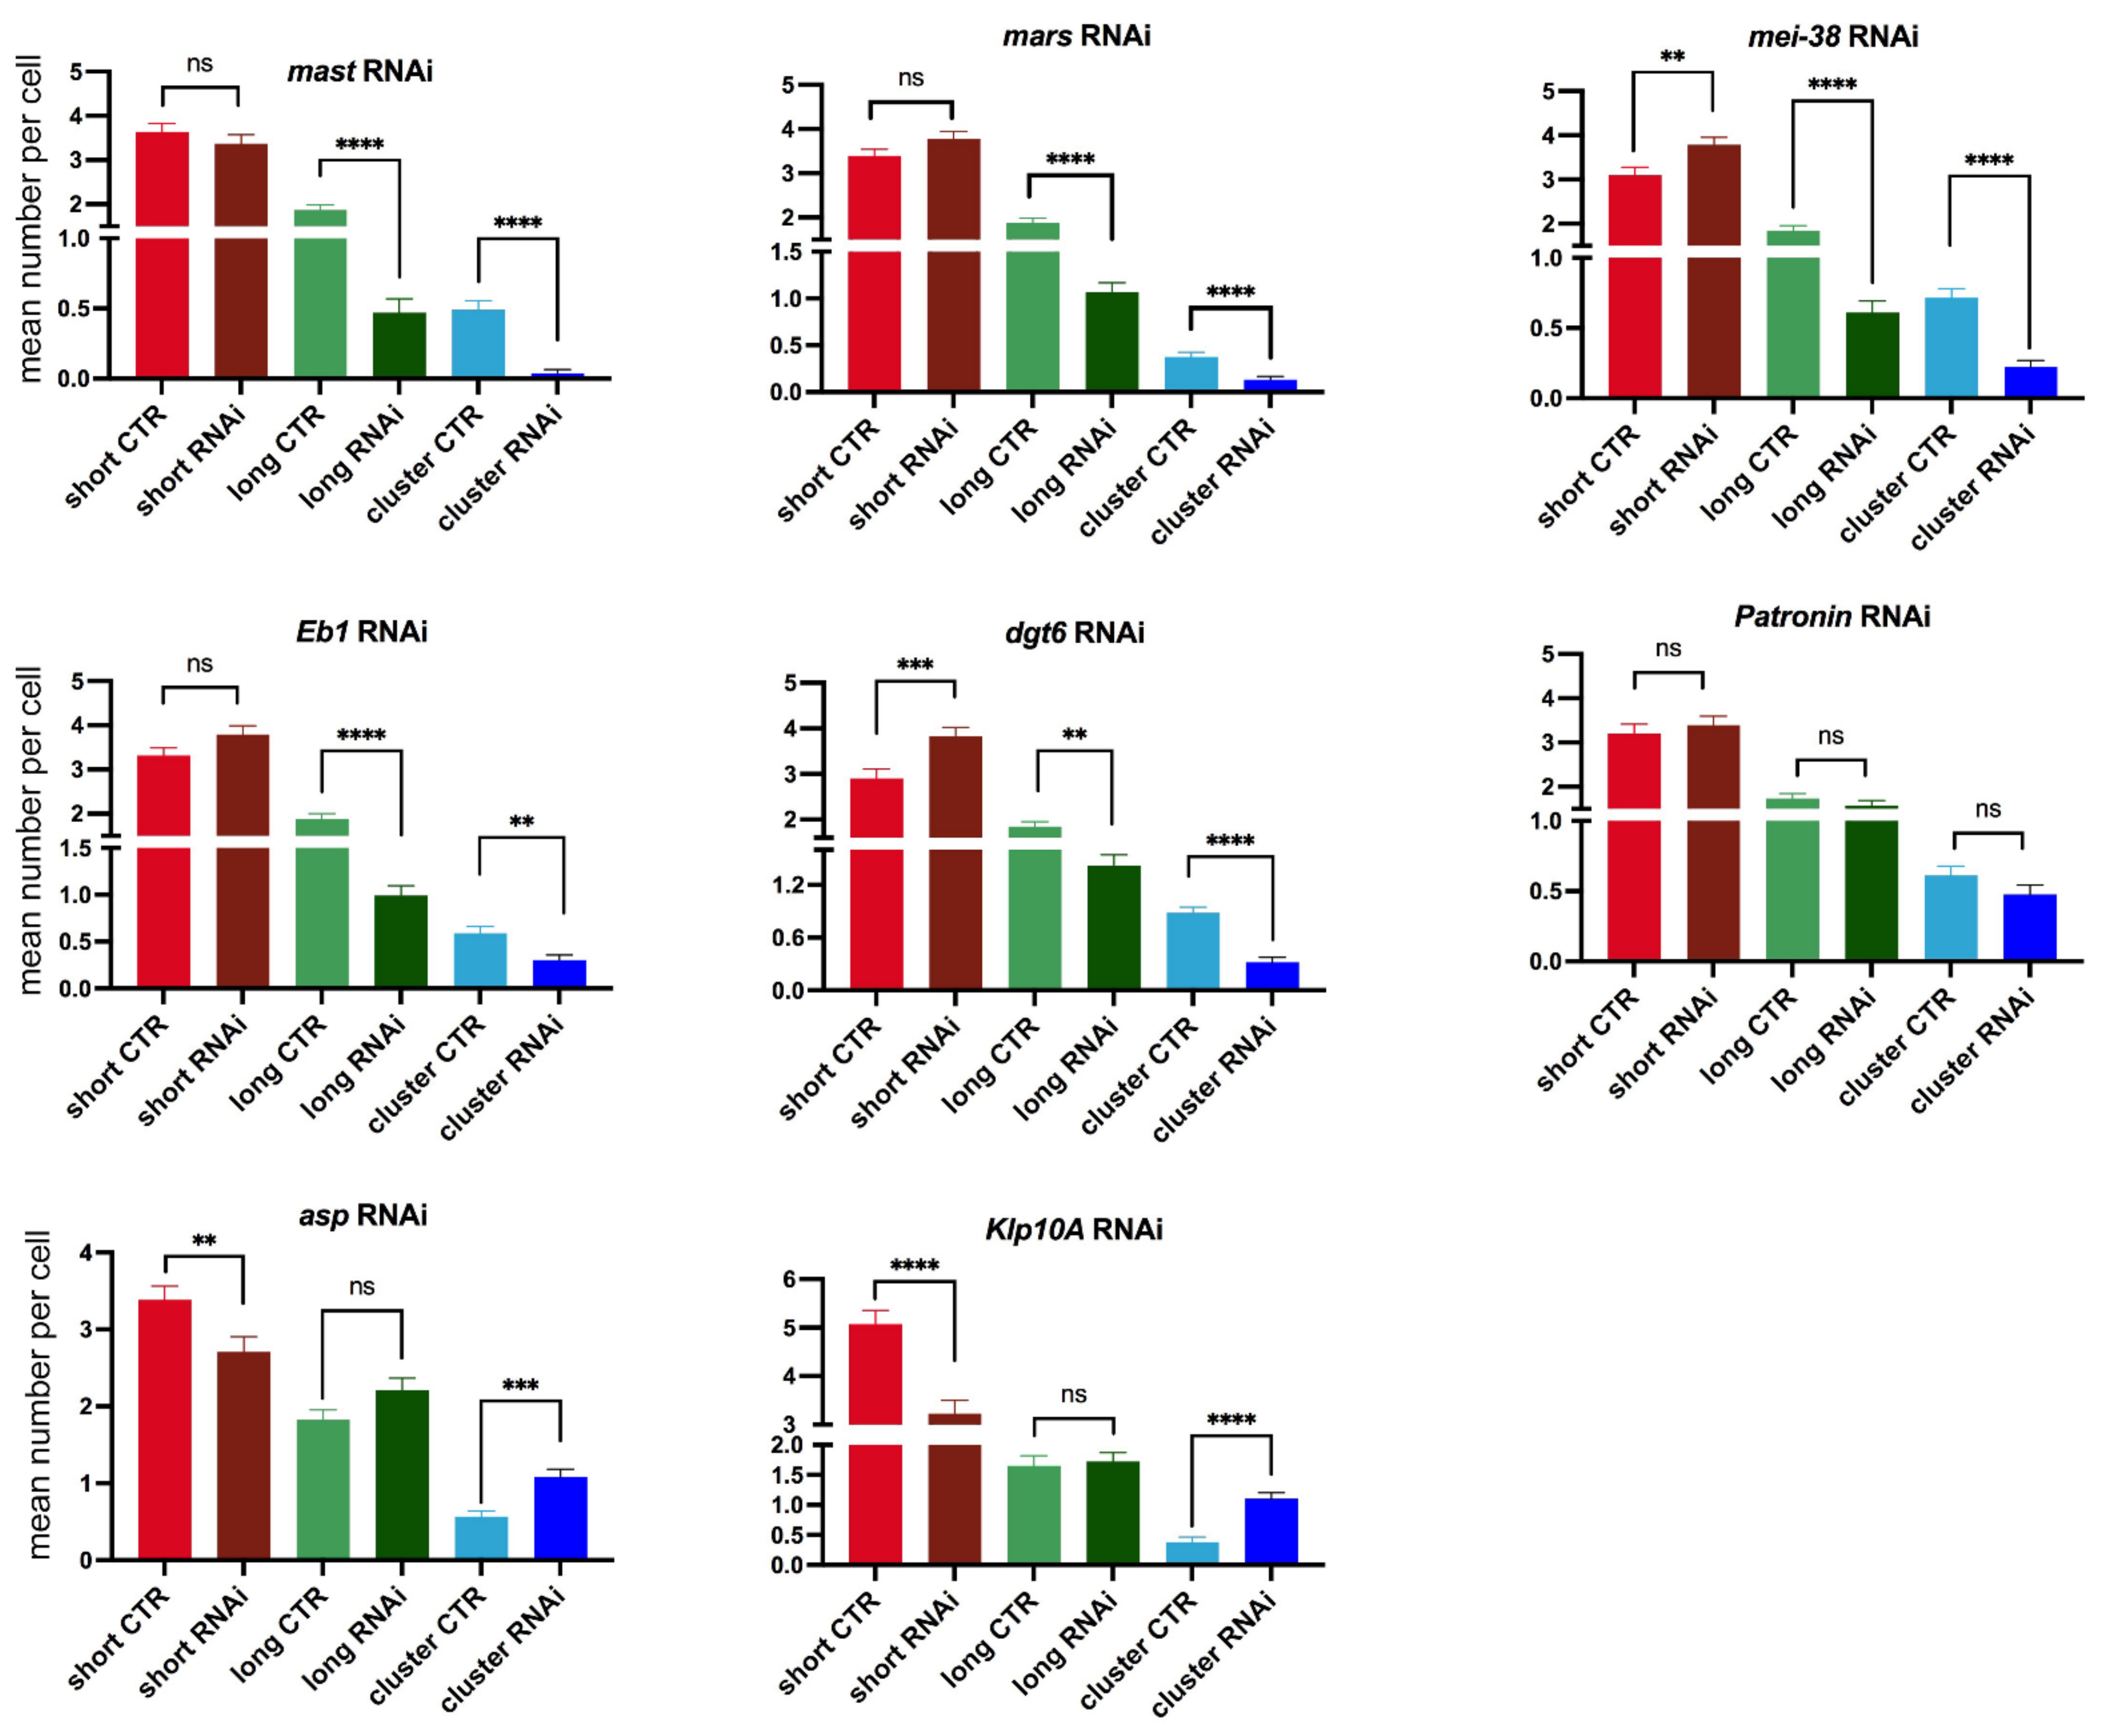
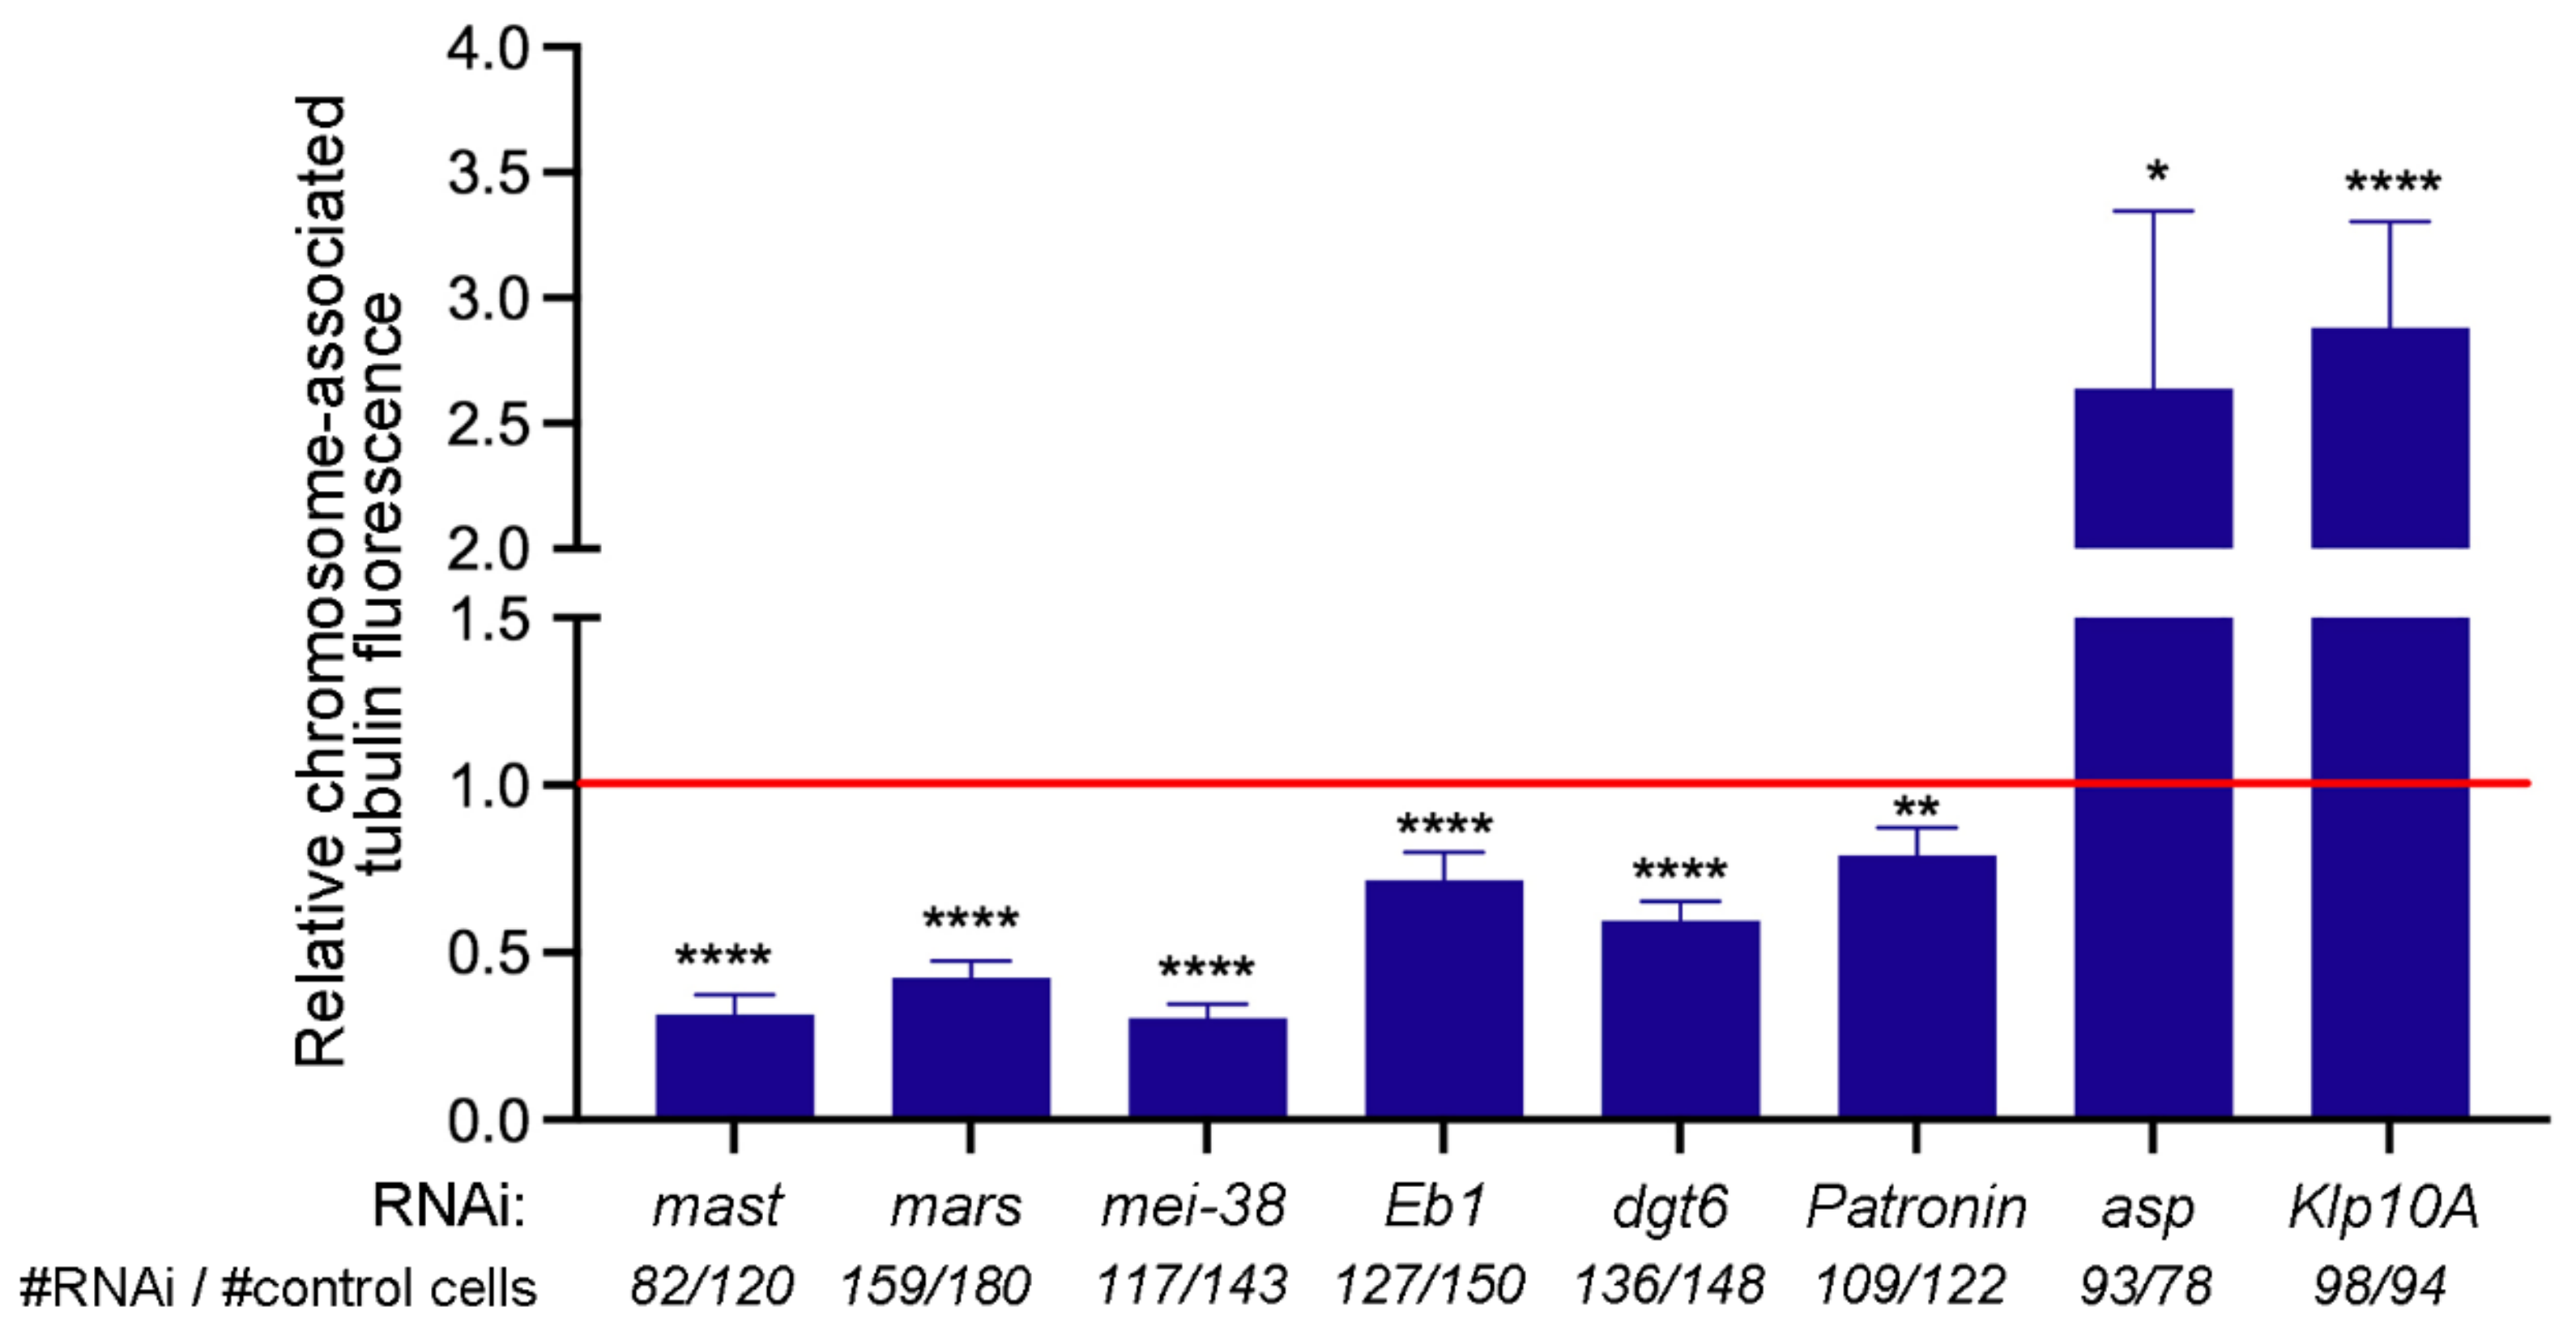
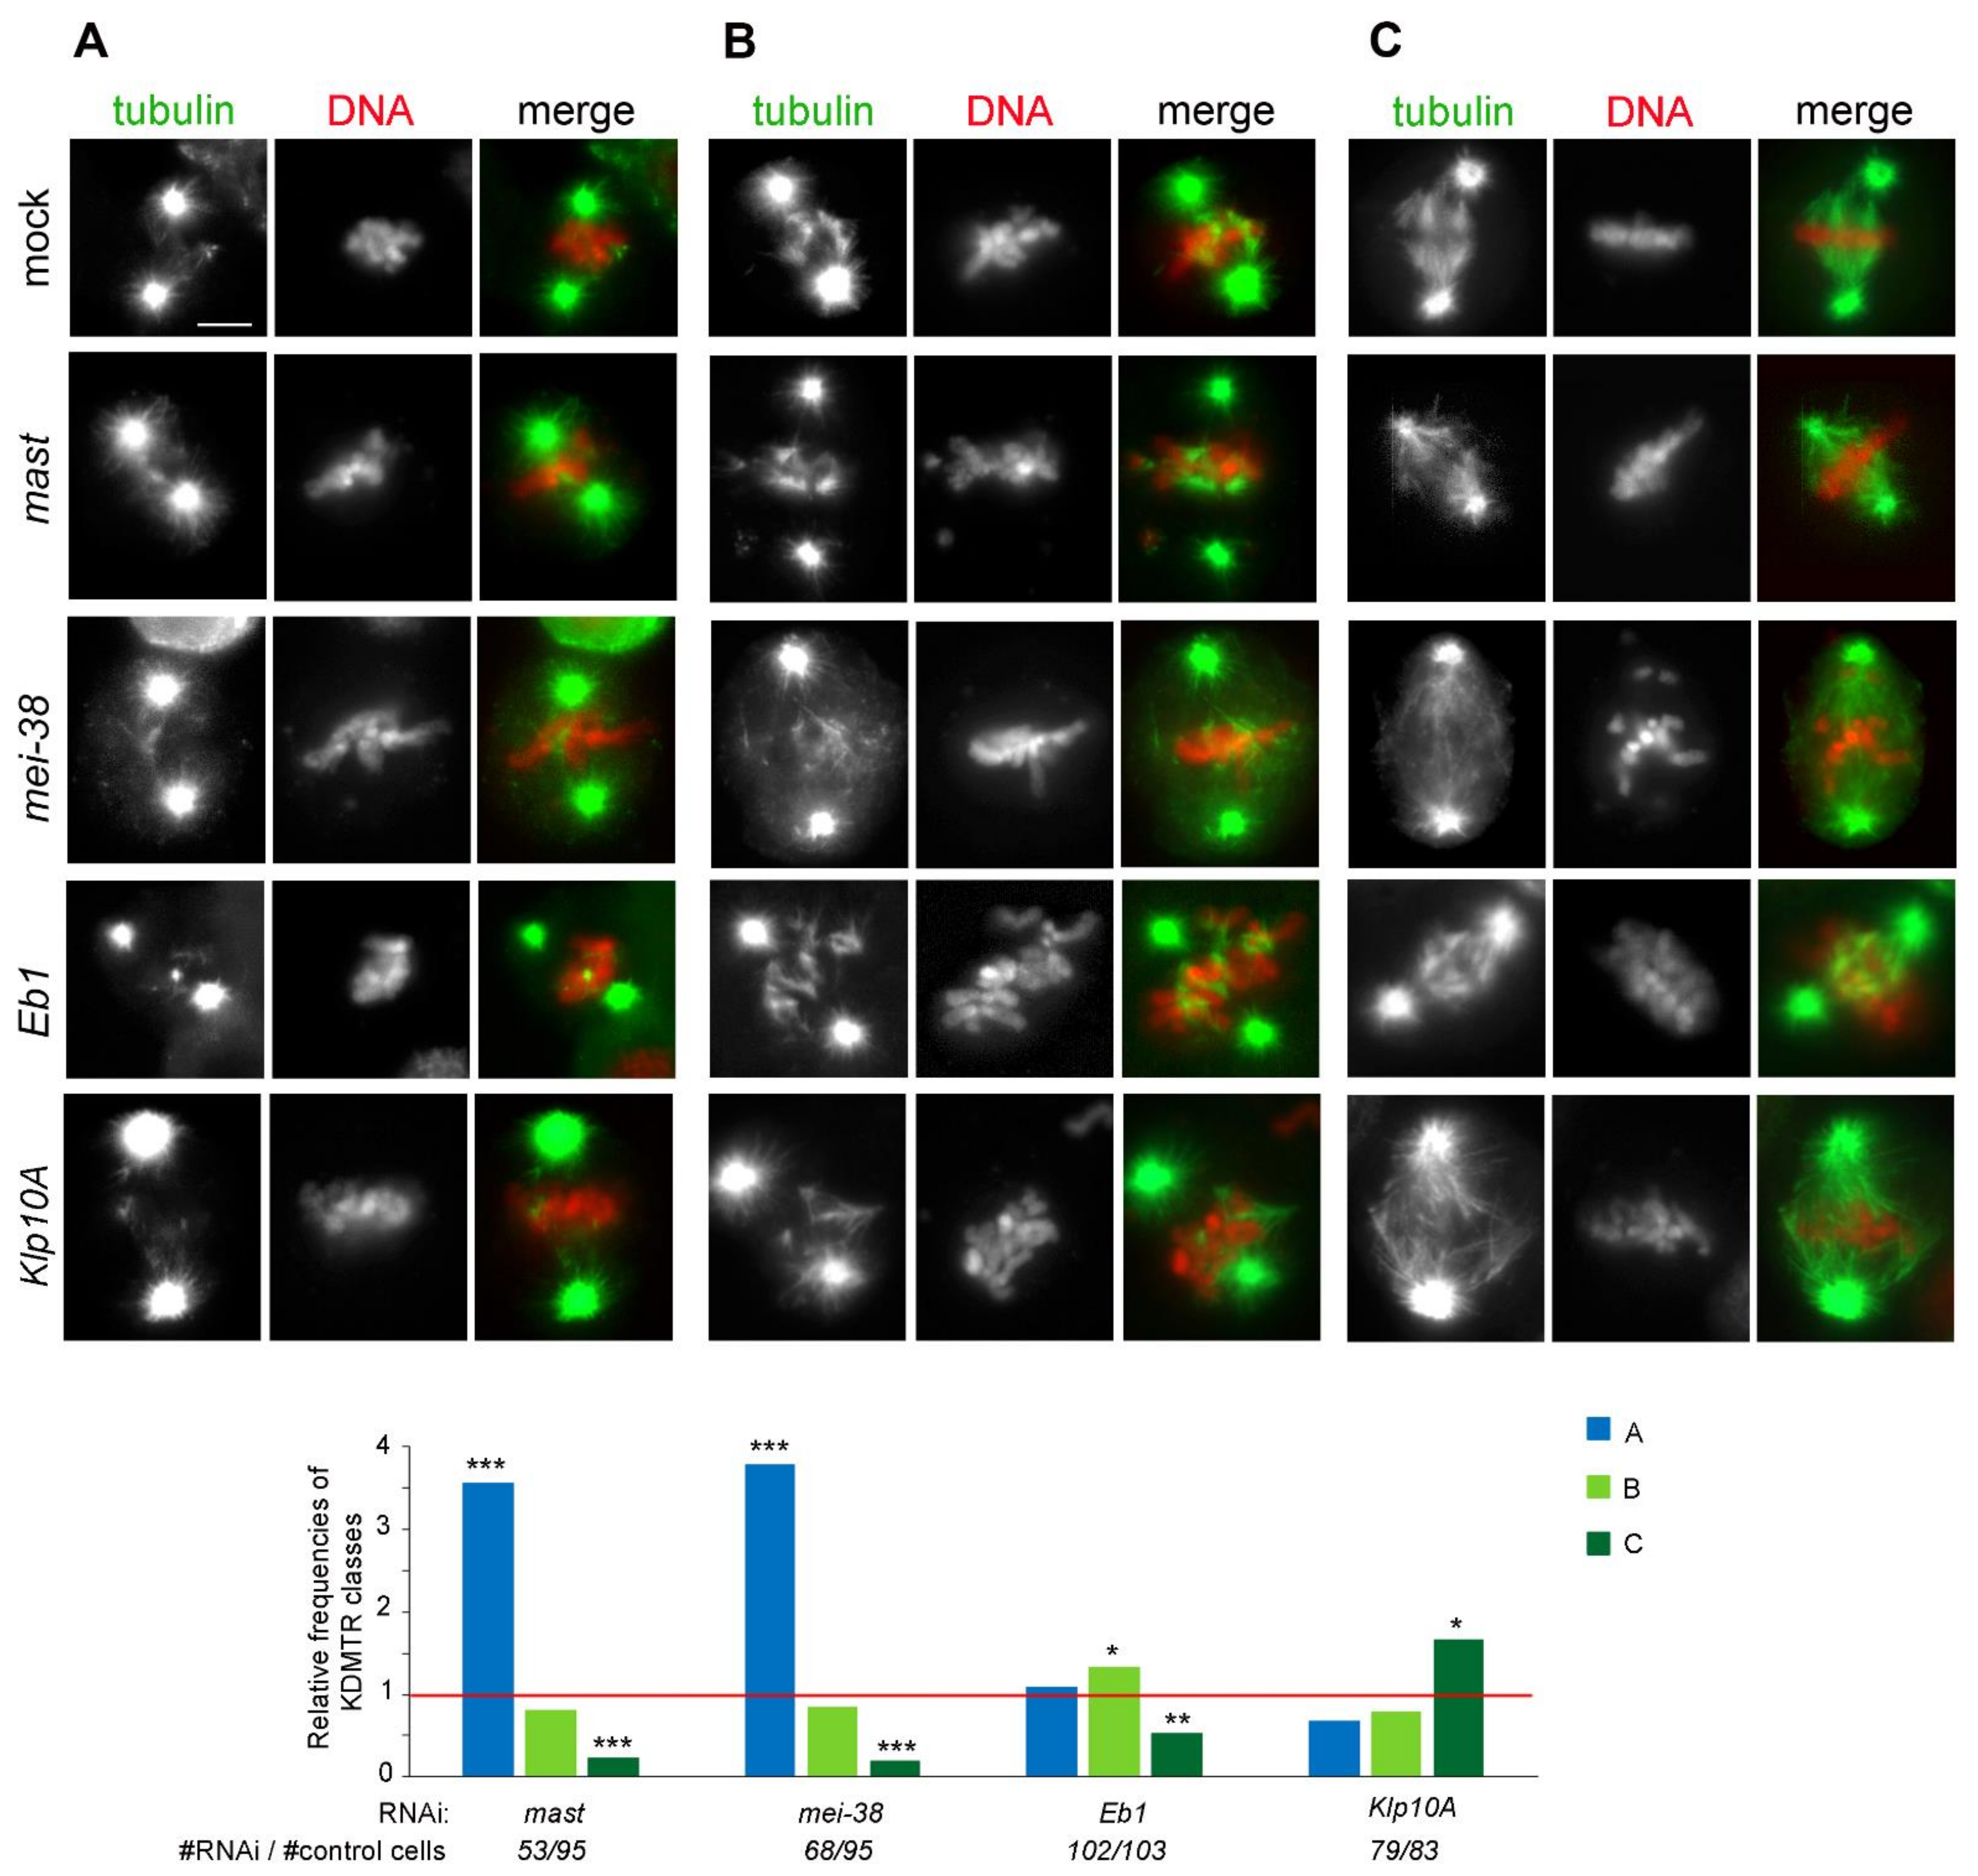
3.2. KDMTR after Colcemid-Induced MT Depolymerization
3.3. KDMTR after Cold-Induced MT Depolymerization
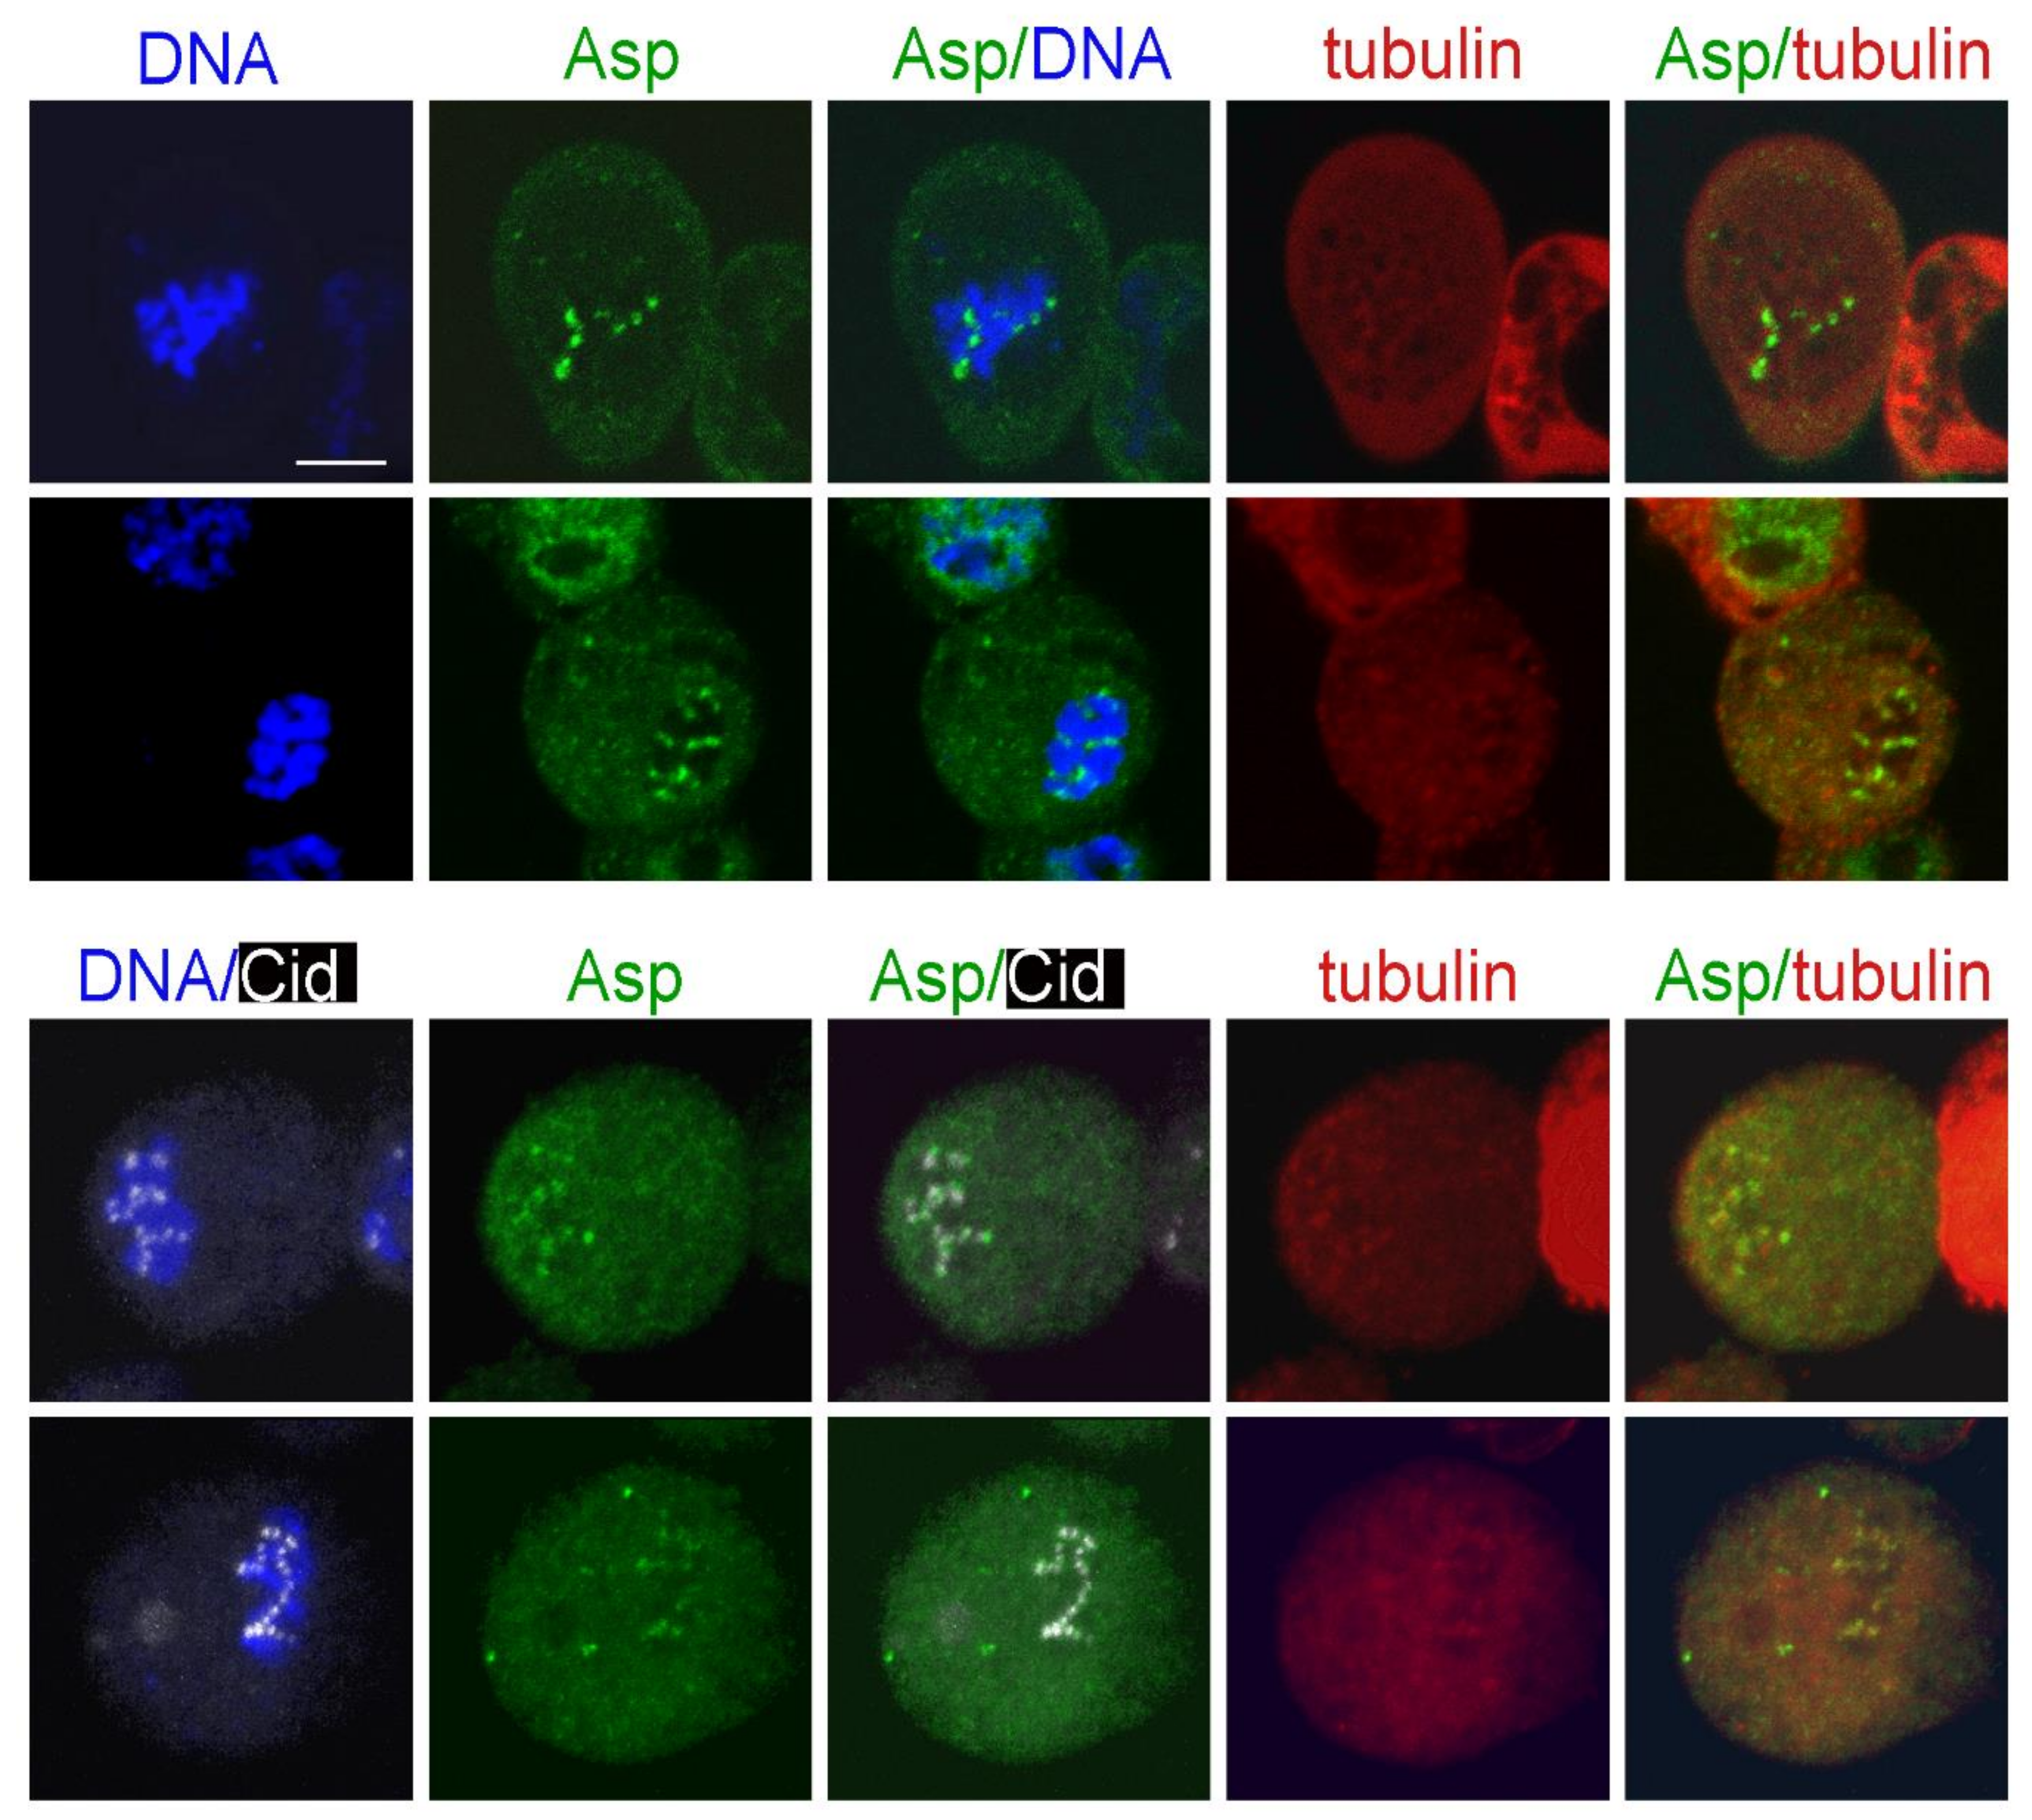
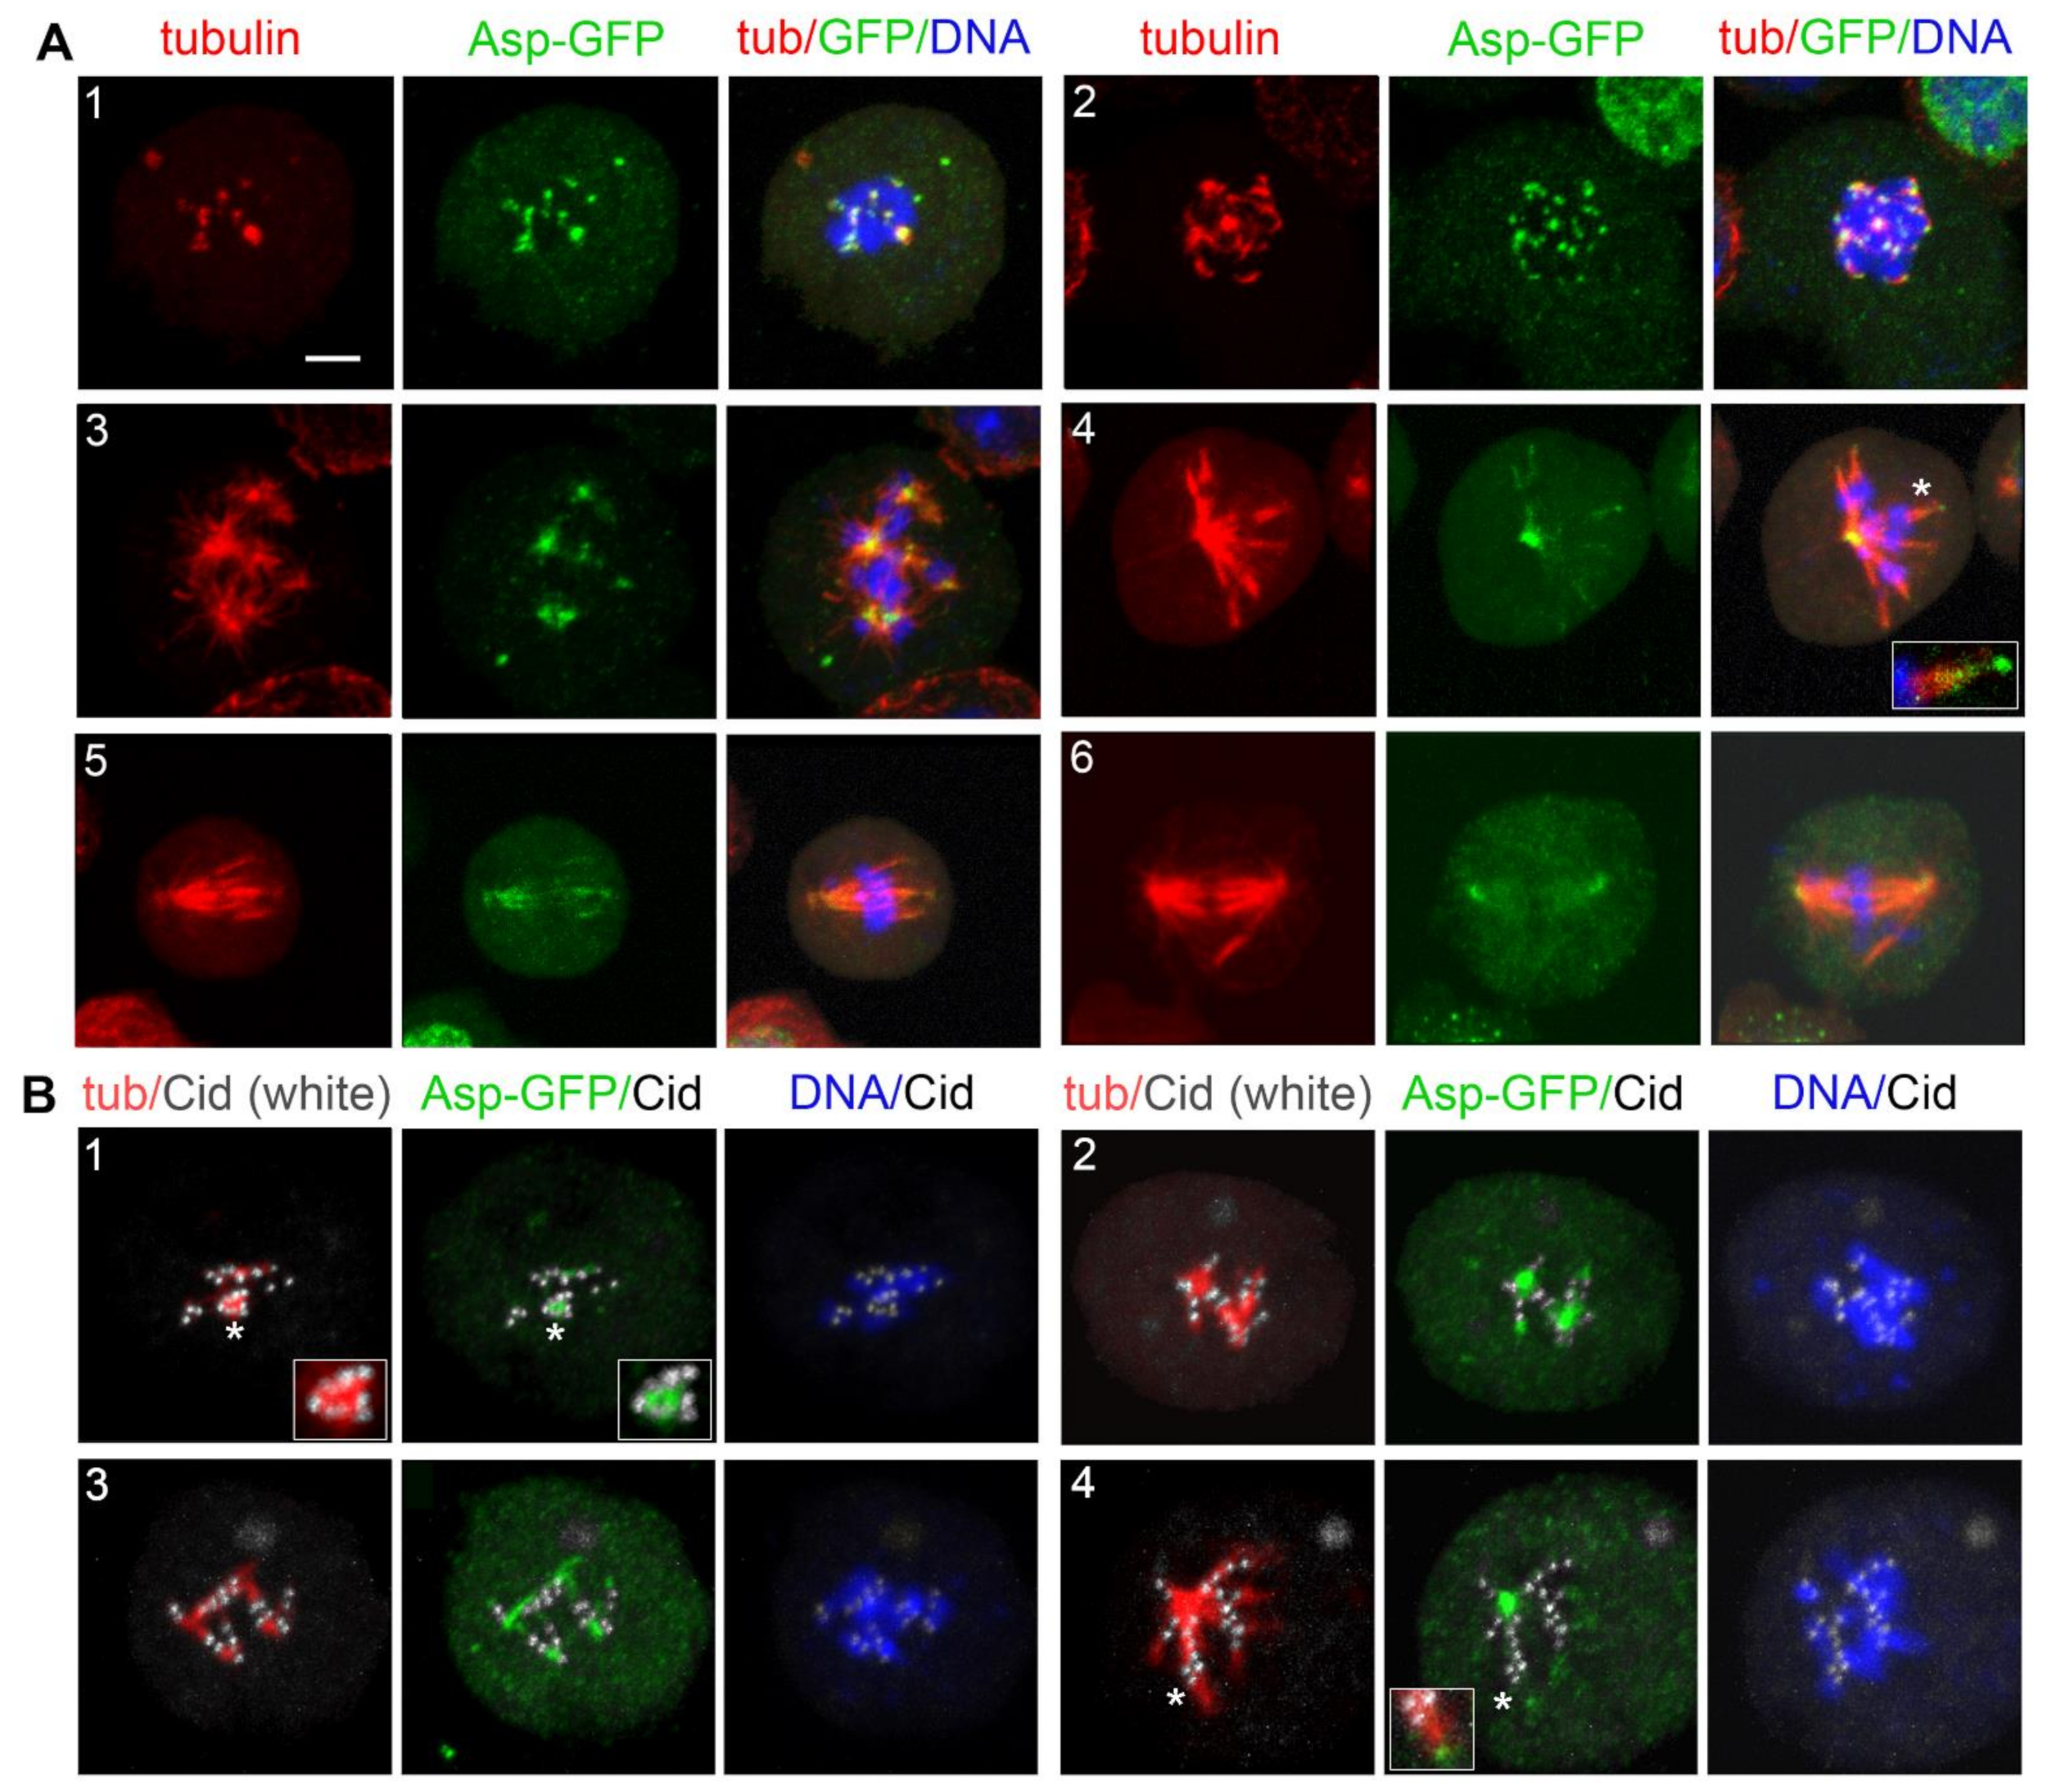
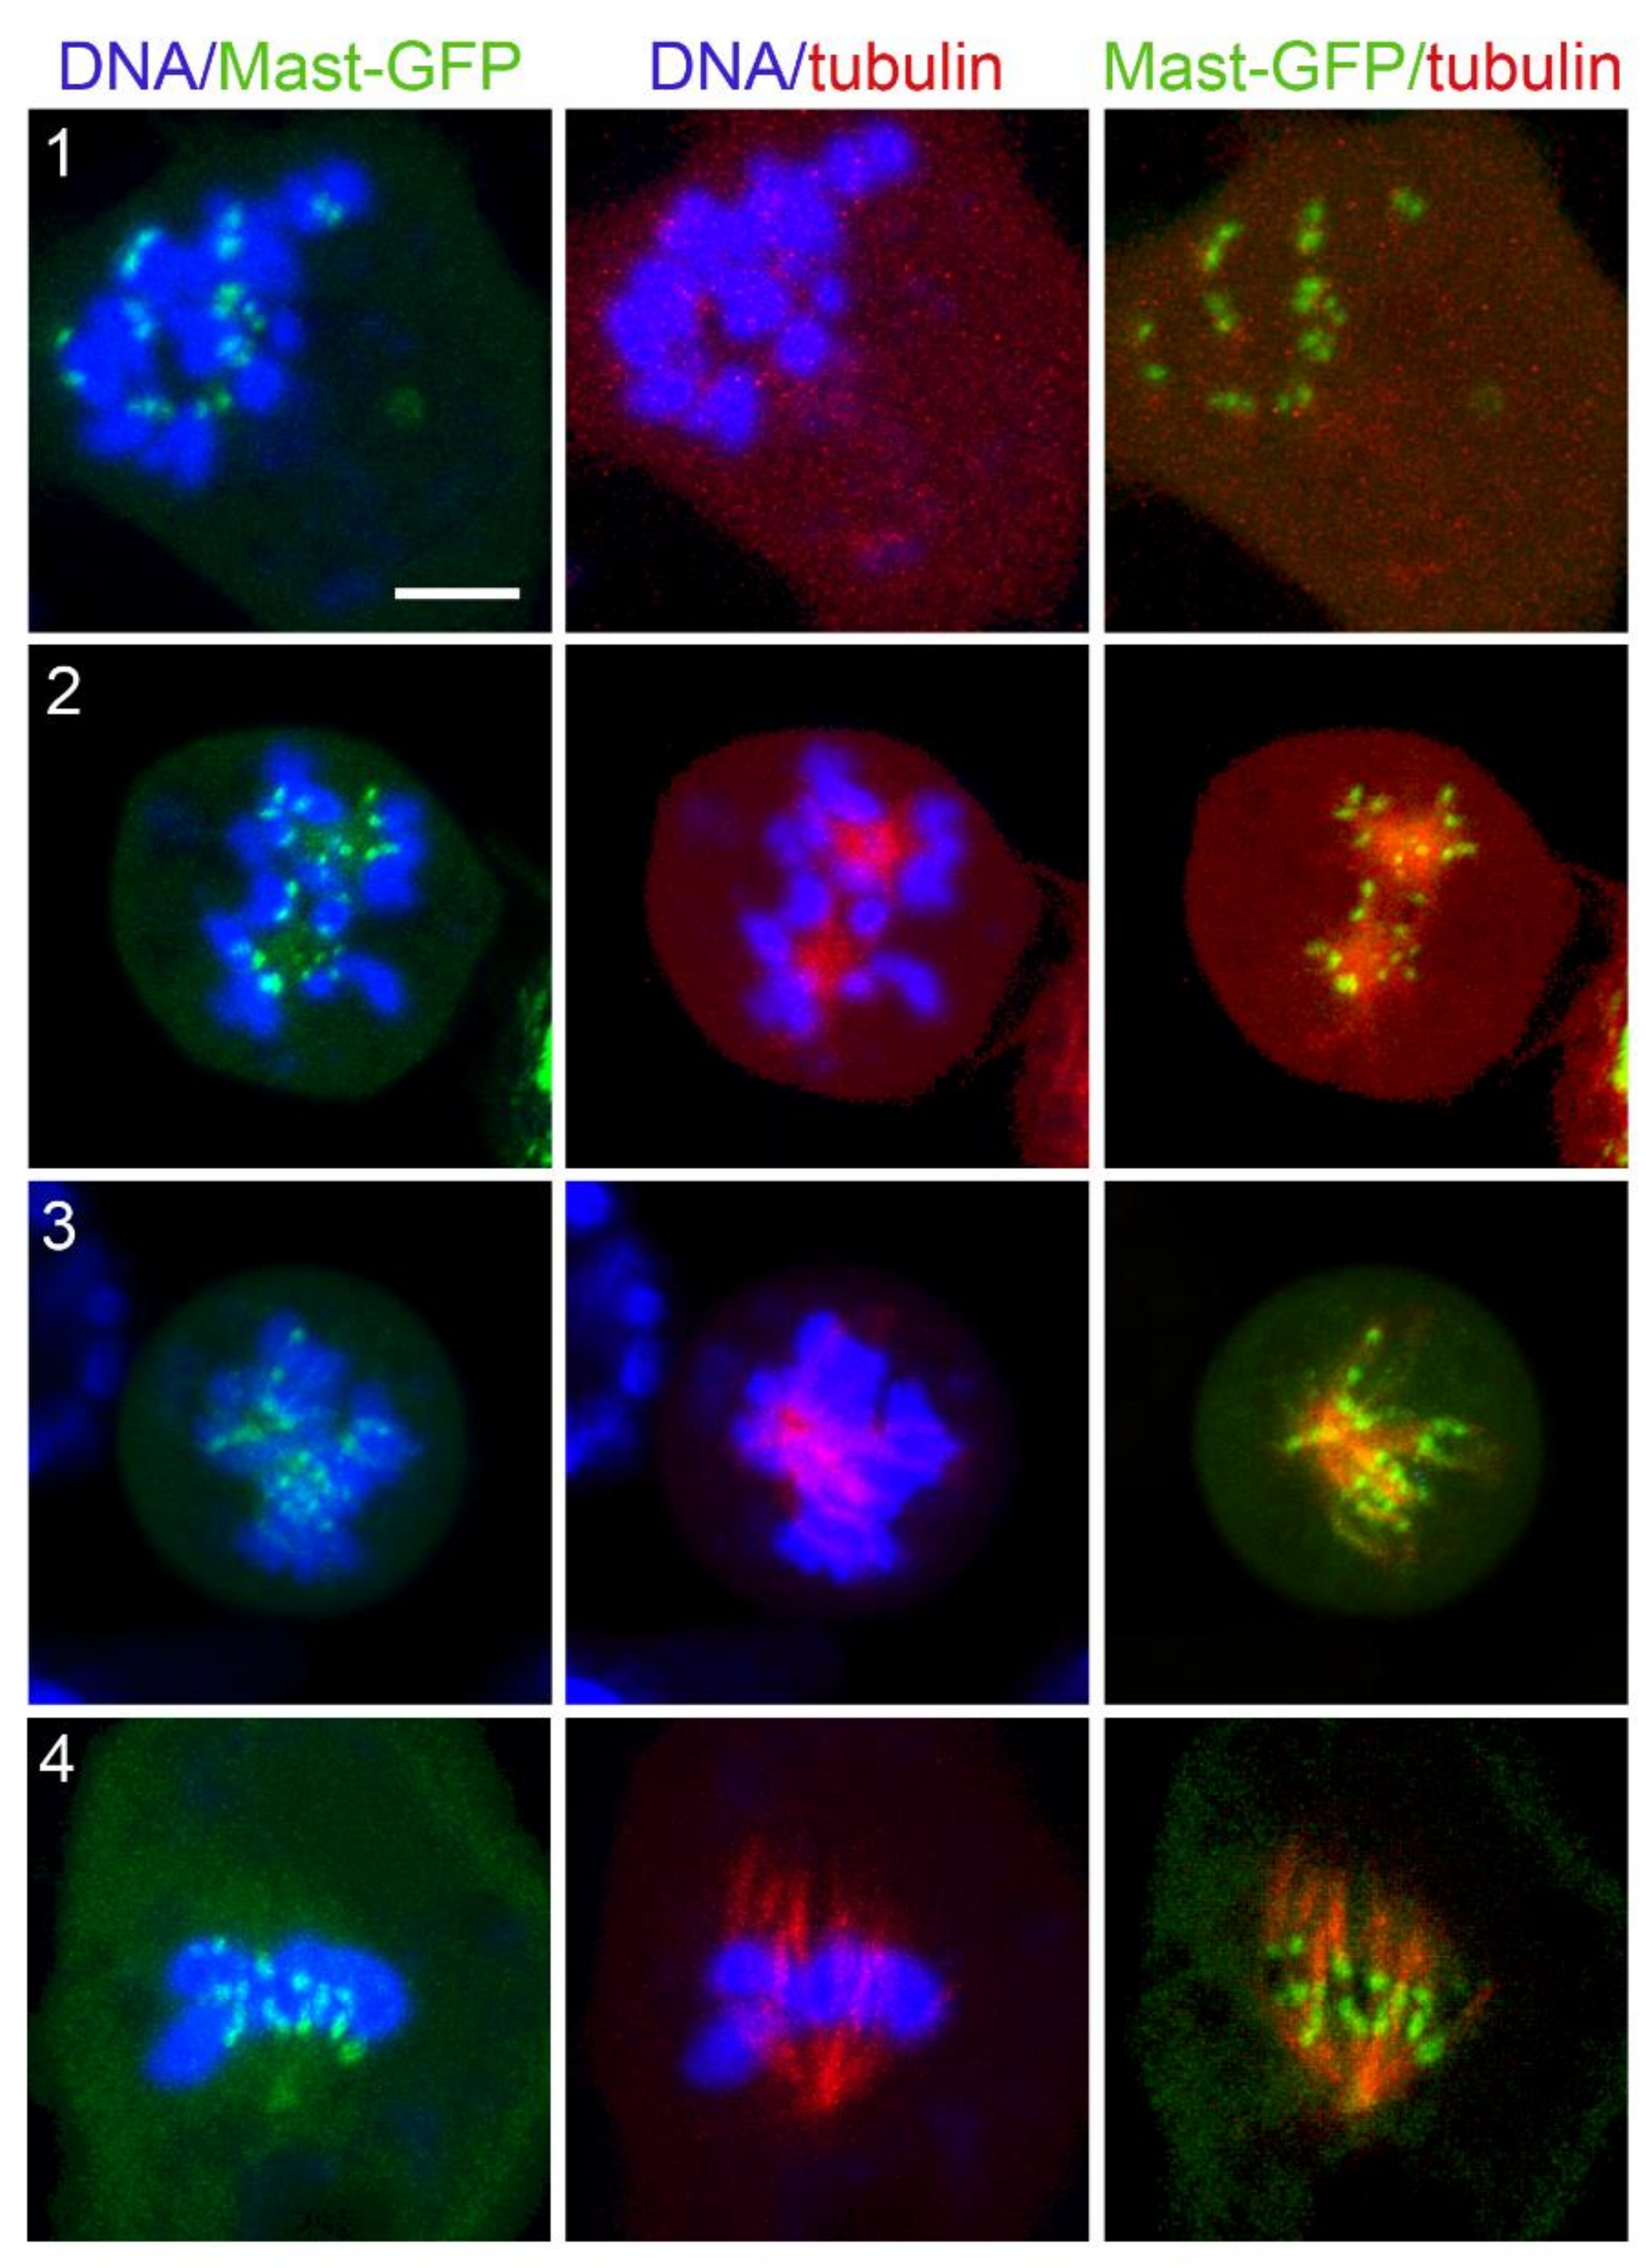
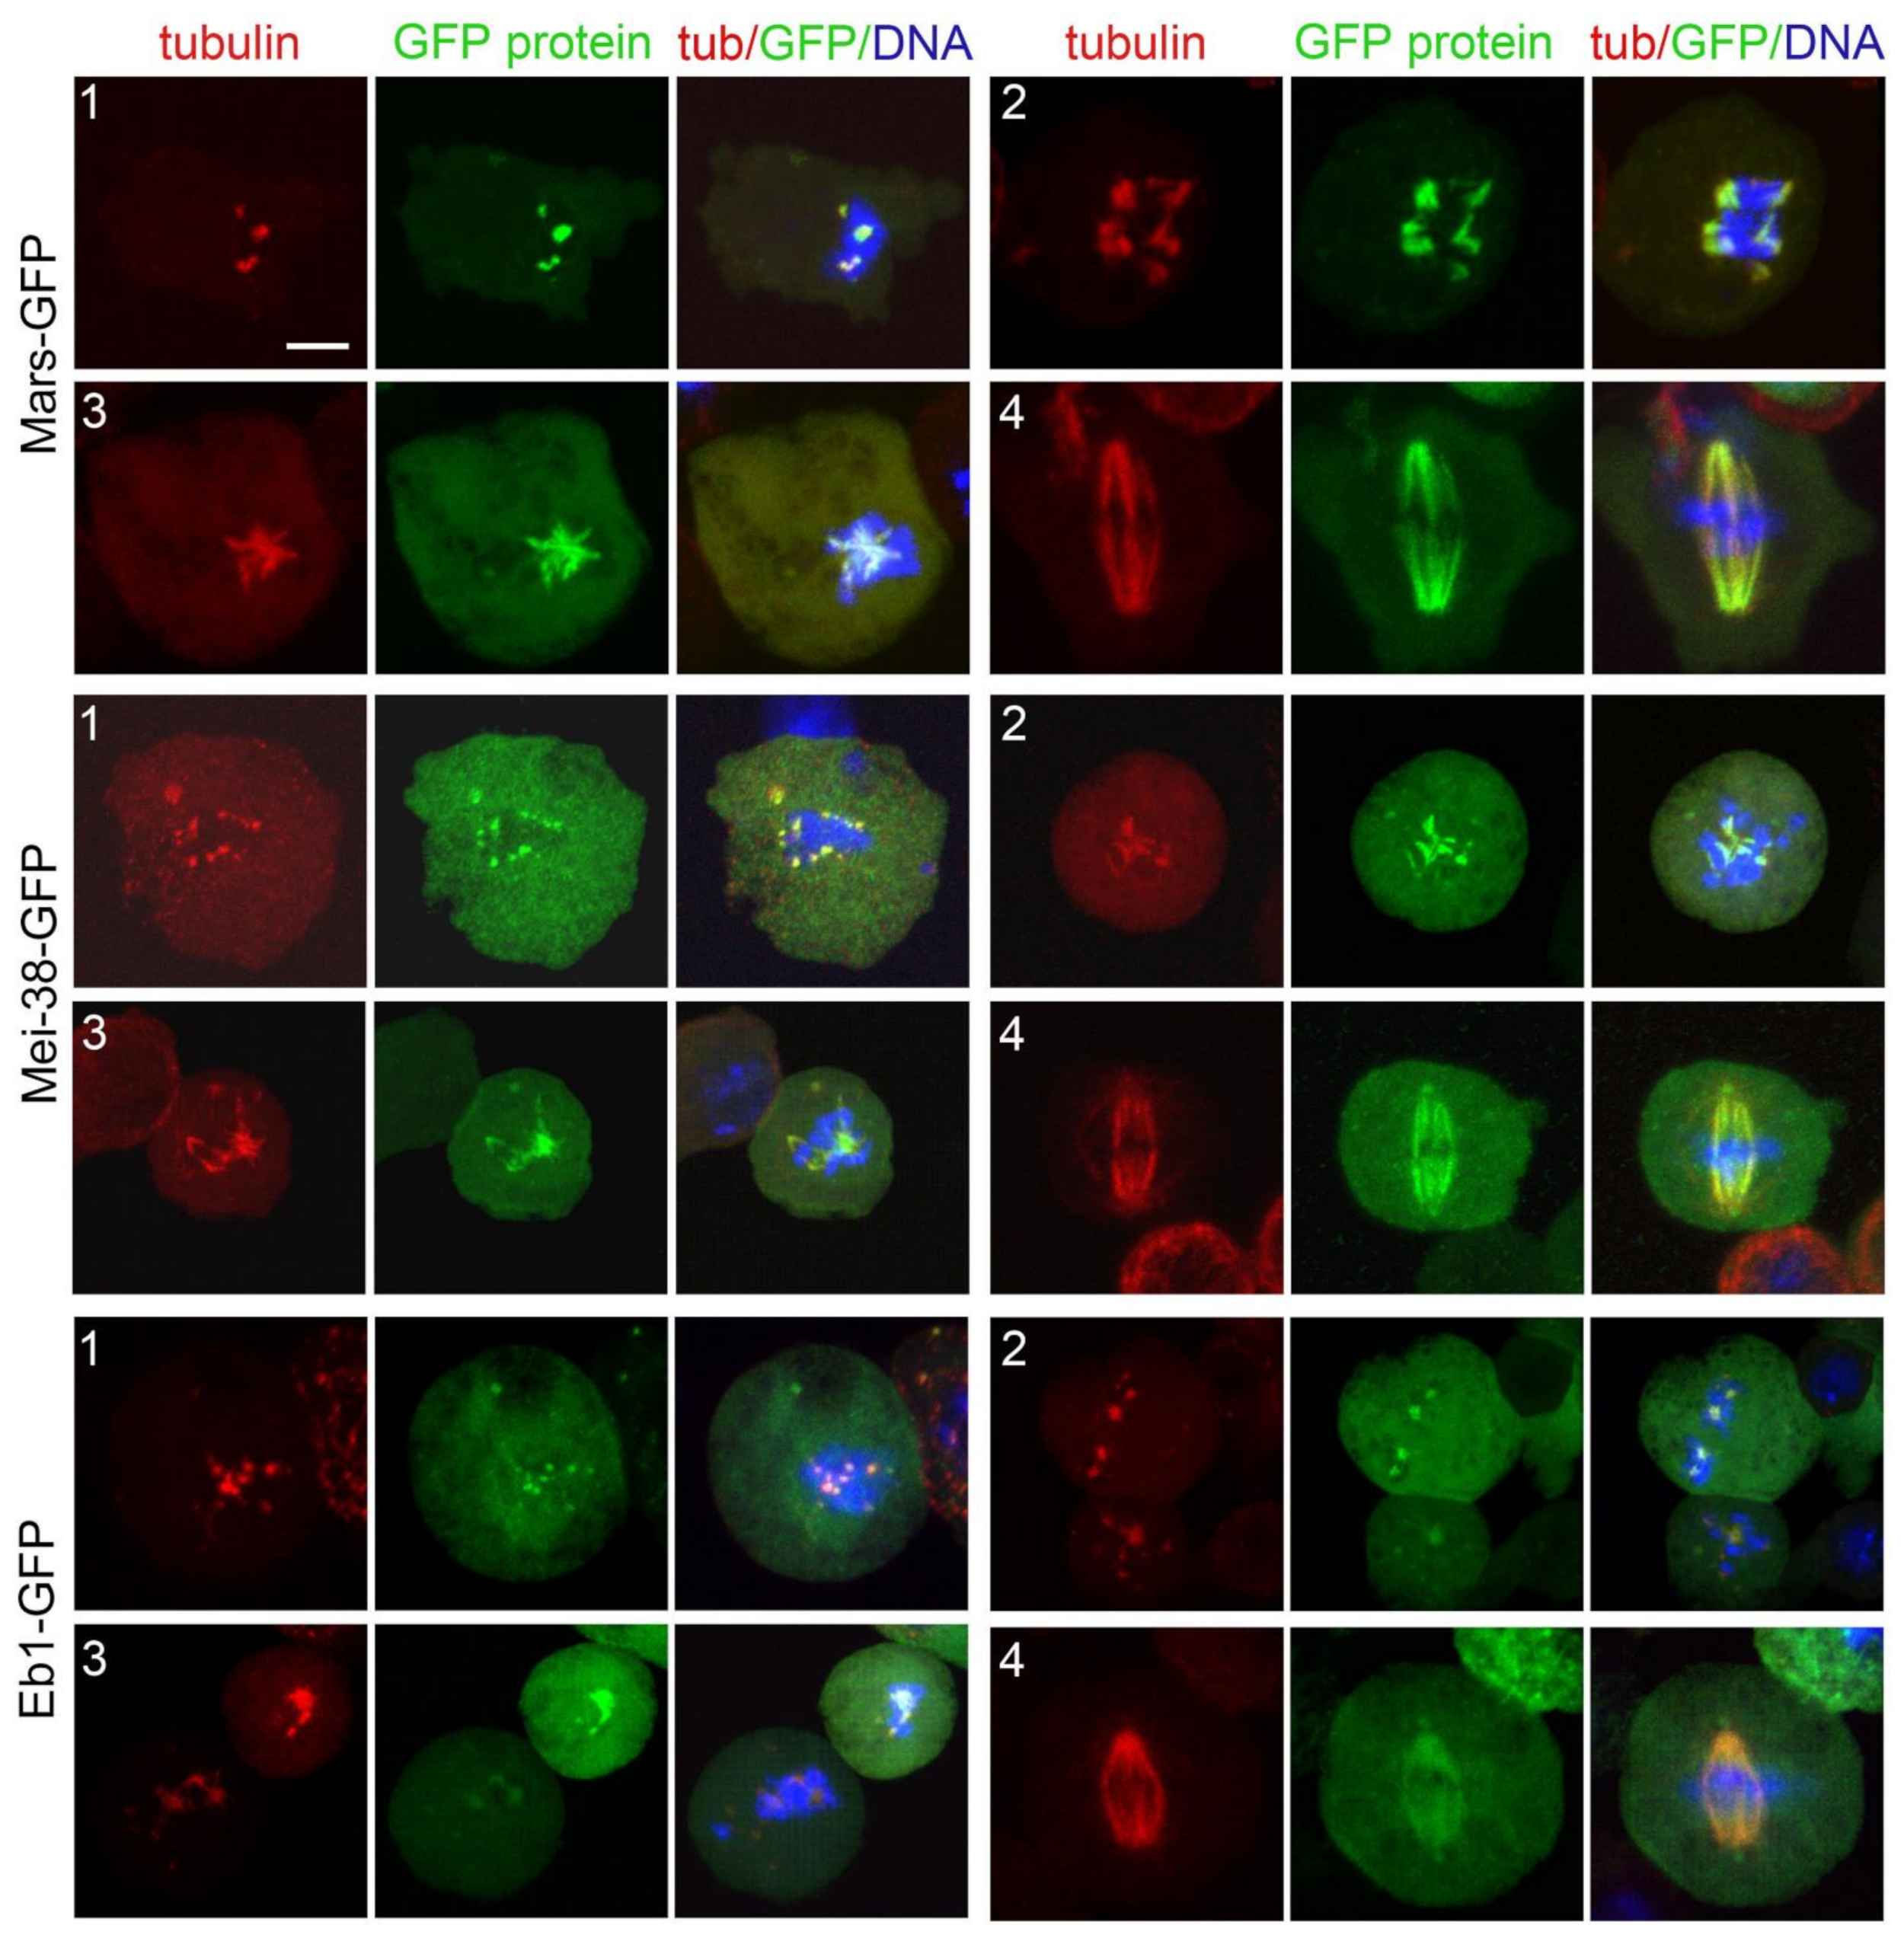
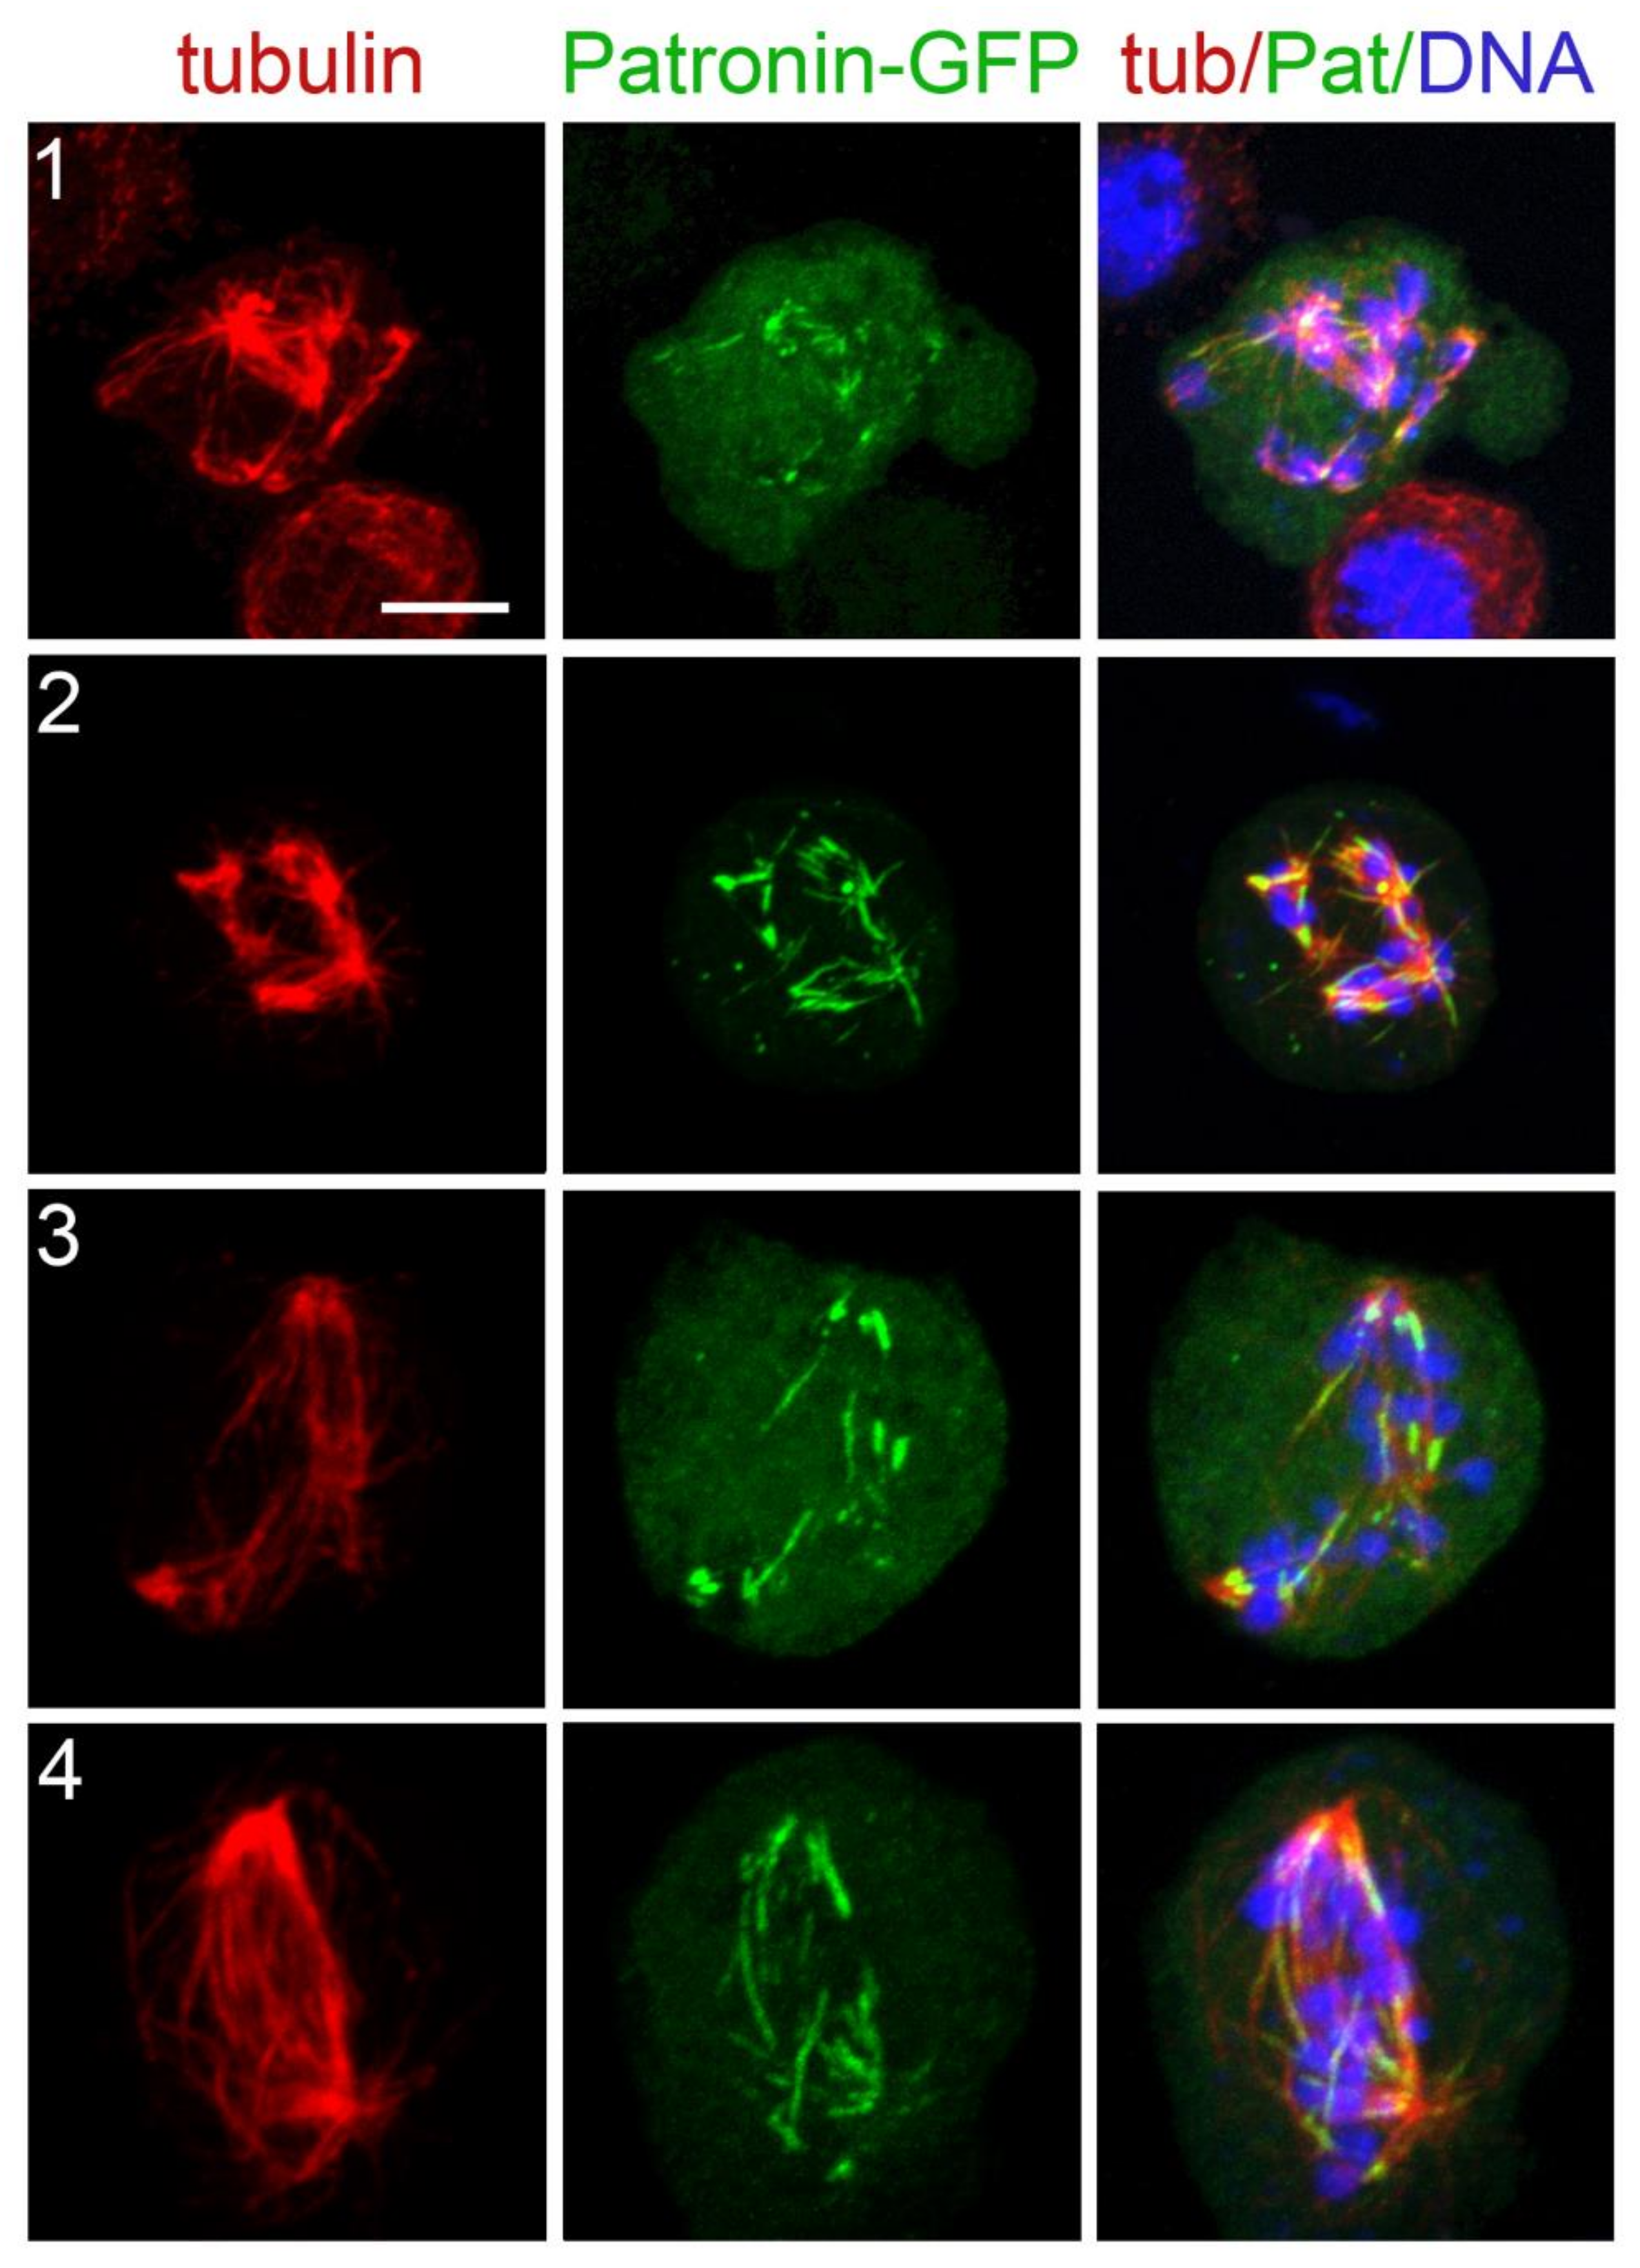
3.4. Localization of Selected Spindle-Associated Proteins during KDMTR
4. Discussion
4.1. Genetic Control of MT Regrowth after Tubulin Depolymerization
4.2. Kinetochore-Driven MT Growth and Spindle Length
4.3. Kinetochore-Driven MT Growth during Normal Mitosis and after MT Depolymerization
4.4. An Integrated Model for Kinetochore-Driven MT Growth
Supplementary Materials
Author Contributions
Funding
Institutional Review Board Statement
Informed Consent Statement
Data Availability Statement
Acknowledgments
Conflicts of Interest
References
- O’Connell, C.B.; Khodjakov, A.L. Cooperative mechanisms of mitotic spindle formation. J. Cell Sci. 2007, 120, 1717–1722. [Google Scholar] [CrossRef] [PubMed] [Green Version]
- Duncan, T.; Wakefield, J.G. 50 ways to build a spindle: The complexity of microtubule generation during mitosis. Chromosome Res. 2011, 19, 321–333. [Google Scholar] [CrossRef] [PubMed] [Green Version]
- Petry, S. Mechanisms of mitotic spindle assembly. Annu. Rev. Biochem. 2016, 85, 659–683. [Google Scholar] [CrossRef] [PubMed] [Green Version]
- Prosser, S.L.; Pelletier, L. Mitotic spindle assembly in animal cells: A fine balancing act. Nat. Rev. Mol. Cell Biol. 2017, 18, 187–201. [Google Scholar] [CrossRef]
- Verma, V.; Maresca, T.J. A celebration of the 25th anniversary of chromatin-mediated spindle assembly. Mol. Biol. Cell 2022, 33, rt1. [Google Scholar] [CrossRef]
- Lüders, J.; Stearns, T. Microtubule-organizing centres: A re-evaluation. Nat. Rev. Mol. Cell Biol. 2007, 8, 161–167. [Google Scholar] [CrossRef]
- Gatti, M.; Bucciarelli, E.; Lattao, R.; Pellacani, C.; Mottier-Pavie, V.; Giansanti, M.G.; Somma, M.P.; Bonaccorsi, S. The relative roles of centrosomal and kinetochore-driven microtubules in Drosophila spindle formation. Exp. Cell Res. 2012, 318, 1375–1380. [Google Scholar] [CrossRef]
- Meunier, S.; Vernos, I. Acentrosomal microtubule assembly in mitosis: The where, when, and how. Trends Cell Biol. 2016, 26, 80–87. [Google Scholar] [CrossRef] [Green Version]
- Walczak, C.E.; Heald, R. Mechanisms of mitotic spindle assembly and function. Int. Rev. Cytol. 2008, 265, 111–158. [Google Scholar] [CrossRef]
- Khodjakov, A.; Cole, R.W.; Oakley, B.R.; Rieder, C.L. Centrosome-independent mitotic spindle formation in vertebrates. Curr. Biol. 2000, 10, 59–67. [Google Scholar] [CrossRef] [Green Version]
- Bonaccorsi, S.; Giansanti, M.G.; Gatti, M. Spindle assembly in Drosophila neuroblasts and ganglion mother cells. Nat. Cell Biol. 2000, 2, 54–56. [Google Scholar] [CrossRef] [PubMed]
- Megraw, T.L.; Kao, L.-R.; Kaufman, T.C. Zygotic development without functional mitotic centrosomes. Curr. Biol. 2001, 11, 116–120. [Google Scholar] [CrossRef] [Green Version]
- Basto, R.; Lau, J.; Vinogradova, T.; Gardiol, A.; Woods, C.G.; Khodjakov, A.; Raff, J.W. Flies without centrioles. Cell 2006, 125, 1375–1386. [Google Scholar] [CrossRef] [Green Version]
- Blachon, S.; Gopalakrishnan, J.; Omori, Y.; Polyanovsky, A.; Church, A.; Nicastro, D.; Malicki, J.; Avidor-Reiss, T. Drosophila asterless and vertebrate Cep152 are orthologs essential for centriole duplication. Genetics 2008, 180, 2081–2094. [Google Scholar] [CrossRef] [PubMed] [Green Version]
- Giansanti, M.G.; Bucciarelli, E.; Bonaccorsi, S.; Gatti, M. Drosophila SPD-2 is an essential centriole component required for PCM recruitment and astral-microtubule nucleation. Curr. Biol. 2008, 18, 303–309. [Google Scholar] [CrossRef] [Green Version]
- Mahoney, N.M.; Goshima, G.; Douglass, A.D.; Vale, R.D. Making microtubules and mitotic spindles in cells without functional centrosomes. Curr. Biol. 2006, 16, 564–569. [Google Scholar] [CrossRef] [Green Version]
- Somma, M.P.; Ceprani, F.; Bucciarelli, E.; Naim, V.; De Arcangelis, V.; Piergentili, R.; Palena, A.; Ciapponi, L.; Giansanti, M.G.; Pellacani, C.; et al. Identification of Drosophila mitotic genes by combining co-expression analysis and RNA interference. PLoS Genet. 2008, 4, e1000126. [Google Scholar] [CrossRef] [Green Version]
- Moutinho-Pereira, S.; Debec, A.; Maiato, H. Microtubule cytoskeleton remodeling by acentriolar microtubule-organizing centers at the entry and exit from mitosis in Drosophila somatic cells. Mol. Biol. Cell 2009, 20, 2796–2808. [Google Scholar] [CrossRef] [Green Version]
- Hayward, D.; Metz, J.; Pellacani, C.; Wakefield, J.G. Synergy between multiple microtubule-generating pathways confers robustness to centrosome-driven mitotic spindle formation. Dev. Cell 2014, 28, 81–93. [Google Scholar] [CrossRef] [Green Version]
- Witt, P.L.; Ris, H.; Borisy, G.G. Origin of kinetochore microtubules in Chinese hamster ovary cells. Chromosoma 1980, 81, 483–505. [Google Scholar] [CrossRef]
- Maiato, H.; Rieder, C.L.; Khodjakov, A. Kinetochore-driven formation of kinetochore fibers contributes to spindle assembly during animal mitosis. J. Cell Biol. 2004, 167, 831–840. [Google Scholar] [CrossRef] [PubMed] [Green Version]
- Tulu, U.S.; Fagerstrom, C.; Ferenz, N.P.; Wadsworth, P. Molecular requirements for kinetochore-associated microtubule formation in mammalian cells. Curr. Biol. 2006, 16, 536–541. [Google Scholar] [CrossRef] [PubMed] [Green Version]
- Torosantucci, L.; De Luca, M.; Guarguaglini, G.; Lavia, P.; Degrassi, F. Localized RanGTP accumulation promotes microtubule nucleation at kinetochores in somatic mammalian cells. Mol. Biol. Cell 2008, 19, 1873–1882. [Google Scholar] [CrossRef] [PubMed] [Green Version]
- Bucciarelli, E.; Pellacani, C.; Naim, V.; Palena, A.; Gatti, M.; Somma, M.P. Drosophila Dgt6 interacts with Ndc80, Msps/XMAP215, and γ-tubulin to promote kinetochore-driven MT formation. Curr. Biol. 2009, 19, 1839–1845. [Google Scholar] [CrossRef] [PubMed] [Green Version]
- O’Connell, C.B.; Lončarek, J.; Kaláb, P.; Khodjakov, A. Relative contributions of chromatin and kinetochores to mitotic spindle assembly. J. Cell Biol. 2009, 187, 43–51. [Google Scholar] [CrossRef] [Green Version]
- Sikirzhytski, V.; Renda, F.; Tikhonenko, I.; Magidson, V.; McEwen, B.F.; Khodjakov, A. Microtubules assemble near most kinetochores during early prometaphase in human cells. J. Cell Biol. 2018, 217, 2647–2659. [Google Scholar] [CrossRef] [Green Version]
- Kalab, P.; Heald, R. The RanGTP gradient—A GPS for the mitotic spindle. J. Cell Sci. 2008, 121, 1577–1586. [Google Scholar] [CrossRef] [Green Version]
- Moutinho-Pereira, S.; Stuurman, N.; Afonso, O.; Hornsveld, M.; Aguiar, P.; Goshima, G.; Vale, R.D.; Maiato, H. Genes involved in centrosome-independent mitotic spindle assembly in Drosophila S2 cells. Proc. Natl. Acad. Sci. USA 2013, 110, 19808–19813. [Google Scholar] [CrossRef] [Green Version]
- Chen, J.W.C.; Barker, A.R.; Wakefield, J.G. The Ran pathway in Drosophila melanogaster mitosis. Front. Cell Dev. Biol. 2015, 3, 74. [Google Scholar] [CrossRef] [Green Version]
- Goshima, G.; Nédélec, F.; Vale, R.D. Mechanisms for focusing mitotic spindle poles by minus end-directed motor proteins. J. Cell Biol. 2005, 171, 229–240. [Google Scholar] [CrossRef] [Green Version]
- Kallio, M.J.; McCleland, M.L.; Stukenberg, P.T.; Gorbsky, G.J. Inhibition of Aurora B kinase blocks chromosome segregation, overrides the spindle checkpoint, and perturbs microtubule dynamics in mitosis. Curr. Biol. 2002, 12, 900–905. [Google Scholar] [CrossRef] [Green Version]
- Koffa, M.D.; Casanova, C.M.; Santarella, R.; Köcher, T.; Wilm, M.; Mattaj, I.W. HURP is part of a Ran-dependent complex involved in spindle formation. Curr. Biol. 2006, 16, 743–754. [Google Scholar] [CrossRef] [PubMed] [Green Version]
- Casanova, C.M.; Rybina, S.; Yokoyama, H.; Karsenti, E.; Mattaj, I.W. Hepatoma up-regulated protein is required for chromatin-induced microtubule assembly independently of TPX2. Mol. Biol. Cell 2008, 19, 4900–4908. [Google Scholar] [CrossRef] [PubMed] [Green Version]
- Mottier-Pavie, V.; Cenci, G.; Verni, F.; Gatti, M.; Bonaccorsi, S. Phenotypic analysis of misato function reveals roles of noncentrosomal microtubules in Drosophila spindle formation. J. Cell Sci. 2011, 124, 706–717. [Google Scholar] [CrossRef] [Green Version]
- Palumbo, V.; Pellacani, C.; Heesom, K.J.; Rogala, K.B.; Deane, C.M.; Mottier-Pavie, V.; Gatti, M.; Bonaccorsi, S.; Wakefield, J.G. Misato controls mitotic microtubule generation by stabilizing the Tubulin Chaperone Protein-1 Complex. Curr. Biol. 2015, 25, 1777–1783. [Google Scholar] [CrossRef] [PubMed] [Green Version]
- Gallaud, E.; Caous, R.; Pascal, A.; Bazile, F.; Gagné, J.-P.; Huet, S.; Poirier, G.G.; Chrétien, D.; Richard-Parpaillon, L.; Giet, R. Ensconsin/Map7 promotes microtubule growth and centrosome separation in Drosophila neural stem cells. J. Cell Biol. 2014, 204, 1111–1121. [Google Scholar] [CrossRef] [Green Version]
- Meunier, S.; Vernos, I. K-fibre minus ends are stabilized by a RanGTP-dependent mechanism essential for functional spindle assembly. Nat. Cell Biol. 2011, 13, 1406–1414. [Google Scholar] [CrossRef]
- Meunier, S.; Shvedunova, M.; Van Nguyen, N.; Avila, L.; Vernos, I.; Akhtar, A. An epigenetic regulator emerges as microtubule minus-end binding and stabilizing factor in mitosis. Nat. Commun. 2015, 6, 7889. [Google Scholar] [CrossRef] [Green Version]
- Mishra, R.K.; Chakraborty, P.; Arnaoutov, A.; Fontoura, B.M.A.; Dasso, M. The Nup107-160 complex and γ-TuRC regulate microtubule polymerization at kinetochores. Nat. Cell Biol. 2010, 12, 164–169. [Google Scholar] [CrossRef] [Green Version]
- Goshima, G.; Mayer, M.; Zhang, N.; Stuurman, N.; Vale, R.D. Augmin: A protein complex required for centrosome-independent microtubule generation within the spindle. J. Cell Biol. 2008, 181, 421–429. [Google Scholar] [CrossRef] [Green Version]
- Petry, S.; Groen, A.C.; Ishihara, K.; Mitchison, T.J.; Vale, R.D. Branching microtubule nucleation in Xenopus egg extracts mediated by Augmin and TPX2. Cell 2013, 152, 768–777. [Google Scholar] [CrossRef] [PubMed] [Green Version]
- Song, J.-G.; King, M.R.; Zhang, R.; Kadzik, R.S.; Thawani, A.; Petry, S. Mechanism of how augmin directly targets the γ-tubulin ring complex to microtubules. J. Cell Biol. 2018, 217, 2417–2428. [Google Scholar] [CrossRef] [PubMed] [Green Version]
- Lawo, S.; Bashkurov, M.; Mullin, M.; Ferreria, M.G.; Kittler, R.; Habermann, B.; Tagliaferro, A.; Poser, I.; Hutchins, J.R.A.; Hegemann, B.; et al. HAUS, the 8-subunit human Augmin complex, regulates centrosome and spindle integrity. Curr. Biol. 2009, 19, 816–826. [Google Scholar] [CrossRef] [PubMed] [Green Version]
- Zhu, H.; Coppinger, J.A.; Jang, C.-Y.; Yates, J.R., 3rd; Fang, G. FAM29A promotes microtubule amplification via recruitment of the NEDD1-γ-tubulin complex to the mitotic spindle. J. Cell Biol. 2008, 183, 835–848. [Google Scholar] [CrossRef] [PubMed] [Green Version]
- Uehara, R.; Nozawa, R.-s.; Tomioka, A.; Petry, S.; Vale, R.D.; Obuse, C.; Goshima, G. The augmin complex plays a critical role in spindle microtubule generation for mitotic progression and cytokinesis in human cells. Proc. Natl. Acad. Sci. USA 2009, 106, 6998–7003. [Google Scholar] [CrossRef] [Green Version]
- David, A.F.; Roudot, P.; Legant, W.R.; Betzig, E.; Danuser, G.; Gerlich, D.W. Augmin accumulation on long-lived microtubules drives amplification and kinetochore-directed growth. J. Cell Biol. 2019, 218, 2150–2168. [Google Scholar] [CrossRef] [Green Version]
- Wainman, A.; Buster, D.W.; Duncan, T.; Metz, J.; Ma, A.; Sharp, D.; Wakefield, J.G. A new Augmin subunit, Msd1, demonstrates the importance of mitotic spindle-templated microtubule nucleation in the absence of functioning centrosomes. Genes Dev. 2009, 23, 1876–1881. [Google Scholar] [CrossRef] [Green Version]
- Akhmanova, A.; Steinmetz, M.O. Control of microtubule organization and dynamics: Two ends in the limelight. Nat. Rev. Mol. Cell Biol. 2015, 16, 711–726. [Google Scholar] [CrossRef]
- Akhmanova, A.; Steinmetz, M.O. Microtubule minus-end regulation at a glance. J. Cell Sci. 2019, 132, jcs227850. [Google Scholar] [CrossRef] [Green Version]
- Ems-McClung, S.C.; Walczak, C.E. Kinesin-13s in mitosis: Key players in the spatial and temporal organization of spindle microtubules. Semin. Cell Dev. Biol. 2010, 21, 276–282. [Google Scholar] [CrossRef] [Green Version]
- Rogers, S.L.; Rogers, G.C.; Sharp, D.J.; Vale, R.D. Drosophila EB1 is important for proper assembly, dynamics, and positioning of the mitotic spindle. J. Cell Biol. 2002, 158, 873–884. [Google Scholar] [CrossRef] [PubMed]
- Pavlova, G.A.; Popova, J.V.; Andreyeva, E.N.; Yarinich, L.A.; Lebedev, M.O.; Razuvaeva, A.V.; Dubatolova, T.D.; Oshchepkova, A.L.; Pellacani, C.; Somma, M.P.; et al. RNAi-mediated depletion of the NSL complex subunits leads to abnormal chromosome segregation and defective centrosome duplication in Drosophila mitosis. PLoS Genet. 2019, 15, e1008371. [Google Scholar] [CrossRef] [PubMed] [Green Version]
- Bustin, S.A.; Benes, V.; Garson, J.A.; Hellemans, J.; Huggett, J.; Kubista, M.; Mueller, R.; Nolan, T.; Pfaffl, M.W.; Shipley, G.L.; et al. The MIQE guidelines: Minimum information for publication of quantitative real-time PCR experiments. Clin. Chem. 2009, 55, 611–622. [Google Scholar] [CrossRef] [PubMed] [Green Version]
- Yang, X.; Mao, F.; Lv, X.; Zhang, Z.; Fu, L.; Lu, Y.; Wu, W.; Zhou, Z.; Zhang, L.; Zhao, Y. Drosophila Vps36 regulates Smo trafficking in Hedgehog signaling. J. Cell Sci. 2013, 126, 4230–4238. [Google Scholar] [CrossRef] [Green Version]
- Pavlova, G.A.; Razuvaeva, A.V.; Popova, J.V.; Andreyeva, E.N.; Yarinich, L.A.; Lebedev, M.O.; Pellacani, C.; Bonaccorsi, S.; Somma, M.P.; Gatti, M.; et al. The role of Patronin in Drosophila mitosis. BMC Mol. Cell Biol. 2019, 20, 7. [Google Scholar] [CrossRef]
- Mackay, T.F.C.; Richards, S.; Stone, E.A.; Barbadilla, A.; Ayroles, J.F.; Zhu, D.; Casillas, S.; Han, Y.; Magwire, M.M.; Cridland, J.M.; et al. The Drosophila melanogaster Genetic Reference Panel. Nature 2012, 482, 173–178. [Google Scholar] [CrossRef] [Green Version]
- Huang, W.; Massouras, A.; Inoue, Y.; Peiffer, J.; Ràmia, M.; Tarone, A.M.; Turlapati, L.; Zichner, T.; Zhu, D.; Lyman, R.F.; et al. Natural variation in genome architecture among 205 Drosophila melanogaster Genetic Reference Panel lines. Genome Res. 2014, 24, 1193–1208. [Google Scholar] [CrossRef] [Green Version]
- Somma, M.P.; Fasulo, B.; Cenci, G.; Cundari, E.; Gatti, M. Molecular dissection of cytokinesis by RNA interference in Drosophila cultured cells. Mol. Biol. Cell 2002, 13, 2448–2460. [Google Scholar] [CrossRef] [Green Version]
- Spitzer, M.; Wildenhain, J.; Rappsilber, J.; Tyers, M. BoxPlotR: A web tool for generation of box plots. Nat. Methods 2014, 11, 121–122. [Google Scholar] [CrossRef]
- Schindelin, J.; Arganda-Carreras, I.; Frise, E.; Kaynig, V.; Longair, M.; Pietzsch, T.; Preibisch, S.; Rueden, C.; Saalfeld, S.; Schmid, B.; et al. Fiji: An open-source platform for biological-image analysis. Nat. Methods 2012, 9, 676–682. [Google Scholar] [CrossRef] [Green Version]
- Goshima, G.; Wollman, R.; Stuurman, N.; Scholey, J.M.; Vale, R.D. Length control of the metaphase spindle. Curr. Biol. 2005, 15, 1979–1988. [Google Scholar] [CrossRef] [PubMed] [Green Version]
- Morales-Mulia, S.; Scholey, J.M. Spindle pole organization in Drosophila S2 cells by dynein, Abnormal spindle protein (Asp), and KLP10A. Mol. Biol. Cell 2005, 16, 3176–3186. [Google Scholar] [CrossRef] [PubMed] [Green Version]
- Buster, D.W.; Zhang, D.; Sharp, D.J. Poleward tubulin flux in spindles: Regulation and function in mitotic cells. Mol. Biol. Cell 2007, 18, 3094–3104. [Google Scholar] [CrossRef] [PubMed] [Green Version]
- Goshima, G.; Vale, R.D. Cell cycle-dependent dynamics and regulation of mitotic kinesins in Drosophila S2 cells. Mol. Biol. Cell 2005, 16, 3896–3907. [Google Scholar] [CrossRef] [Green Version]
- Rogers, G.C.; Rogers, S.L.; Schwimmer, T.A.; Ems-McClung, S.C.; Walczak, C.E.; Vale, R.D.; Scholey, J.M.; Sharp, D.J. Two mitotic kinesins cooperate to drive sister chromatid separation during anaphase. Nature 2004, 427, 364–370. [Google Scholar] [CrossRef]
- Laycock, J.E.; Savoian, M.S.; Glover, D.M. Antagonistic activities of Klp10A and Orbit regulate spindle length, bipolarity and function in vivo. J. Cell Sci. 2006, 119, 2354–2361. [Google Scholar] [CrossRef] [Green Version]
- Renda, F.; Pellacani, C.; Strunov, A.; Bucciarelli, E.; Naim, V.; Bosso, G.; Kiseleva, E.; Bonaccorsi, S.; Sharp, D.J.; Khodjakov, A.; et al. The Drosophila orthologue of the INT6 onco-protein regulates mitotic microtubule growth and kinetochore structure. PLoS Genet. 2017, 13, e1006784. [Google Scholar] [CrossRef] [Green Version]
- Jiang, K.; Rezabkova, L.; Hua, S.; Liu, Q.; Capitani, G.; Altelaar, A.F.M.; Heck, A.J.R.; Kammerer, R.A.; Steinmetz, M.O.; Akhmanova, A. Microtubule minus-end regulation at spindle poles by an ASPM-katanin complex. Nat. Cell Biol. 2017, 19, 480–492. [Google Scholar] [CrossRef] [Green Version]
- Wakefield, J.G.; Bonaccorsi, S.; Gatti, M. The Drosophila protein Asp is involved in microtubule organization during spindle formation and cytokinesis. J. Cell Biol. 2001, 153, 637–648. [Google Scholar] [CrossRef] [Green Version]
- Ito, A.; Goshima, G. Microcephaly protein Asp focuses the minus ends of spindle microtubules at the pole and within the spindle. J. Cell Biol. 2015, 211, 999–1009. [Google Scholar] [CrossRef] [Green Version]
- Maiato, H.; Khodjakov, A.; Rieder, C.L. Drosophila CLASP is required for the incorporation of microtubule subunits into fluxing kinetochore fibres. Nat. Cell Biol. 2005, 7, 42–47. [Google Scholar] [CrossRef] [PubMed]
- Inoue, Y.H.; do Carmo Avides, M.; Shiraki, M.; Deak, P.; Yamaguchi, M.; Nishimoto, Y.; Matsukage, A.; Glover, D.M. Orbit, a novel microtubule-associated protein essential for mitosis in Drosophila melanogaster. J. Cell Biol. 2000, 149, 153–166. [Google Scholar] [CrossRef] [PubMed]
- Lemos, C.L.; Sampaio, P.; Maiato, H.; Costa, M.; Omel’yanchuk, L.V.; Liberal, V.; Sunkel, C.E. Mast, a conserved microtubule-associated protein required for bipolar mitotic spindle organization. EMBO J. 2000, 19, 3668–3682. [Google Scholar] [CrossRef] [PubMed] [Green Version]
- Goshima, G.; Wollman, R.; Goodwin, S.S.; Zhang, N.; Scholey, J.M.; Vale, R.D.; Stuurman, N. Genes required for mitotic spindle assembly in Drosophila S2 cells. Science 2007, 316, 417–421. [Google Scholar] [CrossRef] [PubMed] [Green Version]
- Zhang, G.; Breuer, M.; Förster, A.; Egger-Adam, D.; Wodarz, A. Mars, a Drosophila protein related to vertebrate HURP, is required for the attachment of centrosomes to the mitotic spindle during syncytial nuclear divisions. J. Cell Sci. 2009, 122, 535–545. [Google Scholar] [CrossRef] [PubMed] [Green Version]
- Goshima, G. Identification of a TPX2-like microtubule-associated protein in Drosophila. PLoS ONE 2011, 6, e28120. [Google Scholar] [CrossRef] [Green Version]
- Pavlova, G.A.; Galimova, Y.A.; Popova, Y.V.; Munzarova, A.F.; Razuvaeva, A.V.; Alekseeva, A.L.; Berkaeva, M.B.; Pindyurin, A.V.; Somma, M.P.; Gatti, M.; et al. Factors governing the pattern of spindle microtubule regrowth after tubulin depolymerization. Tsitologiia 2016, 58, 299–303. [Google Scholar]
- Goshima, G.; Vale, R.D. The roles of microtubule-based motor proteins in mitosis: Comprehensive RNAi analysis in the Drosophila S2 cell line. J. Cell Biol. 2003, 162, 1003–1016. [Google Scholar] [CrossRef]
- Reis, R.; Feijão, T.; Gouveia, S.; Pereira, A.J.; Matos, I.; Sampaio, P.; Maiato, H.; Sunkel, C.E. Dynein and Mast/Orbit/CLASP have antagonistic roles in regulating kinetochore-microtubule plus-end dynamics. J. Cell Sci. 2009, 122, 2543–2553. [Google Scholar] [CrossRef] [Green Version]
- Yang, C.-P.; Fan, S.-S. Drosophila mars is required for organizing kinetochore microtubules during mitosis. Exp. Cell Res. 2008, 314, 3209–3220. [Google Scholar] [CrossRef]
- Saunders, R.D.C.; Avides, M.C.; Howard, T.; Gonzalez, C.; Glover, D.M. The Drosophila gene abnormal spindle encodes a novel microtubule-associated protein that associates with the polar regions of the mitotic spindle. J. Cell Biol. 1997, 137, 881–890. [Google Scholar] [CrossRef] [PubMed] [Green Version]
- Schoborg, T.; Zajac, A.L.; Fagerstrom, C.J.; Guillen, R.X.; Rusan, N.M. An Asp-CaM complex is required for centrosome-pole cohesion and centrosome inheritance in neural stem cells. J. Cell Biol. 2015, 211, 987–998. [Google Scholar] [CrossRef] [PubMed] [Green Version]
- Cheeseman, I.M.; MacLeod, I.; Yates, J.R., 3rd; Oegema, K.; Desai, A. The CENP-F-like proteins HCP-1 and HCP-2 target CLASP to kinetochores to mediate chromosome segregation. Curr. Biol. 2005, 15, 771–777. [Google Scholar] [CrossRef] [PubMed] [Green Version]
- Maffini, S.; Maia, A.R.R.; Manning, A.L.; Maliga, Z.; Pereira, A.L.; Junqueira, M.; Shevchenko, A.; Hyman, A.; Yates, J.R., 3rd; Galjart, N.; et al. Motor-independent targeting of CLASPs to kinetochores by CENP-E promotes microtubule turnover and poleward flux. Curr. Biol. 2009, 19, 1566–1572. [Google Scholar] [CrossRef] [PubMed] [Green Version]
- Hannak, E.; Heald, R. Xorbit/CLASP links dynamic microtubules to chromosomes in the Xenopus meiotic spindle. J. Cell Biol. 2006, 172, 19–25. [Google Scholar] [CrossRef]
- Kitamura, E.; Tanaka, K.; Komoto, S.; Kitamura, Y.; Antony, C.; Tanaka, T.U. Kinetochores generate microtubules with distal plus ends: Their roles and limited lifetime in mitosis. Dev. Cell 2010, 18, 248–259. [Google Scholar] [CrossRef] [Green Version]
- Buffin, E.; Emre, D.; Karess, R.E. Flies without a spindle checkpoint. Nat. Cell Biol. 2007, 9, 565–572. [Google Scholar] [CrossRef]
- Maiato, H.; Fairley, E.A.L.; Rieder, C.L.; Swedlow, J.R.; Sunkel, C.E.; Earnshaw, W.C. Human CLASP1 is an outer kinetochore component that regulates spindle microtubule dynamics. Cell 2003, 113, 891–904. [Google Scholar] [CrossRef] [Green Version]
- Liu, P.; Würtz, M.; Zupa, E.; Pfeffer, S.; Schiebel, E. Microtubule nucleation: The waltz between γ-tubulin ring complex and associated proteins. Curr. Opin. Cell Biol. 2021, 68, 124–131. [Google Scholar] [CrossRef]
- Silljé, H.H.W.; Nagel, S.; Körner, R.; Nigg, E.A. HURP is a Ran-Importin β-regulated protein that stabilizes kinetochore microtubules in the vicinity of chromosomes. Curr. Biol. 2006, 16, 731–742. [Google Scholar] [CrossRef] [Green Version]
- Jiang, K.; Faltova, L.; Hua, S.; Capitani, G.; Prota, A.E.; Landgraf, C.; Volkmer, R.; Kammerer, R.A.; Steinmetz, M.O.; Akhmanova, A. Structural basis of formation of the microtubule minus-end-regulating CAMSAP-Katanin complex. Structure 2018, 26, 375–382. [Google Scholar] [CrossRef] [PubMed] [Green Version]


Publisher’s Note: MDPI stays neutral with regard to jurisdictional claims in published maps and institutional affiliations. |
© 2022 by the authors. Licensee MDPI, Basel, Switzerland. This article is an open access article distributed under the terms and conditions of the Creative Commons Attribution (CC BY) license (https://creativecommons.org/licenses/by/4.0/).
Share and Cite
Popova, J.V.; Pavlova, G.A.; Razuvaeva, A.V.; Yarinich, L.A.; Andreyeva, E.N.; Anders, A.F.; Galimova, Y.A.; Renda, F.; Somma, M.P.; Pindyurin, A.V.; et al. Genetic Control of Kinetochore-Driven Microtubule Growth in Drosophila Mitosis. Cells 2022, 11, 2127. https://doi.org/10.3390/cells11142127
Popova JV, Pavlova GA, Razuvaeva AV, Yarinich LA, Andreyeva EN, Anders AF, Galimova YA, Renda F, Somma MP, Pindyurin AV, et al. Genetic Control of Kinetochore-Driven Microtubule Growth in Drosophila Mitosis. Cells. 2022; 11(14):2127. https://doi.org/10.3390/cells11142127
Chicago/Turabian StylePopova, Julia V., Gera A. Pavlova, Alyona V. Razuvaeva, Lyubov A. Yarinich, Evgeniya N. Andreyeva, Alina F. Anders, Yuliya A. Galimova, Fioranna Renda, Maria Patrizia Somma, Alexey V. Pindyurin, and et al. 2022. "Genetic Control of Kinetochore-Driven Microtubule Growth in Drosophila Mitosis" Cells 11, no. 14: 2127. https://doi.org/10.3390/cells11142127
APA StylePopova, J. V., Pavlova, G. A., Razuvaeva, A. V., Yarinich, L. A., Andreyeva, E. N., Anders, A. F., Galimova, Y. A., Renda, F., Somma, M. P., Pindyurin, A. V., & Gatti, M. (2022). Genetic Control of Kinetochore-Driven Microtubule Growth in Drosophila Mitosis. Cells, 11(14), 2127. https://doi.org/10.3390/cells11142127