Article

Characterization of Genetic Resistance to Fusarium Head Blight and Bacterial Leaf Streak in Intermediate Wheatgrass (Thinopyrum intermedium)

1
Department of Agronomy & Plant Genetics, University of Minnesota, St. Paul, MN 55108, USA
2
Department of Horticultural Science, North Carolina State University, Raleigh, NC 27607, USA
3
The Land Institute, 2440 E. Water Well Rd, Salina, KS 67401, USA
4
Department of Plant Pathology, University of Minnesota, St. Paul, MN 55108, USA
*
Authors to whom correspondence should be addressed.
Agronomy 2019, 9(8), 429; https://doi.org/10.3390/agronomy9080429
Submission received: 27 June 2019 / Revised: 25 July 2019 / Accepted: 2 August 2019 / Published: 3 August 2019
(This article belongs to the Special Issue Crop Domestication and Evolution)

Abstract

:
Intermediate wheatgrass (IWG, Thinopyrum intermedium, (Host) Barkworth & D.R. Dewey subsp. intermedium, 2n = 6x = 42) is a novel perennial crop currently undergoing domestication efforts. It offers remarkable ecosystem services and yields higher relative to other perennial grain crops. While IWG is mostly resistant to Fusarium head blight (FHB), identifying genomic regions associated with resistance will help protect the crop from potential disease epidemics. An IWG biparental population of 108 individuals was developed by crossing parents differing in their response to FHB and bacterial leaf streak (BLS). The population was screened for disease reaction over three years using isolates collected from IWG plants in St. Paul, Minnesota, USA. Linkage maps representing the 21 IWG chromosomes were constructed from 4622 Single Nucleotide Polymorphism (SNP) markers, with one SNP at every 0.74 cM. Interval mapping identified 15 quantitative trait loci (QTL) associated with FHB resistance and 11 with BLS resistance. Models with two or three QTL combinations reduced FHB disease severity by up to 15%, and BLS by up to 17%. When markers associated with FHB resistance were used as cofactors in genomic selection models, trait predictive ability improved by 24–125%. These genomic regions and genetic markers associated with FHB and BLS resistance can also be used to safeguard annual cereal grains through gene introgression and selective breeding.

1. Introduction

Plant diseases are major threats to crop performance and food security as they reduce yield and affect global economy [1,2]. Chemical applications, as well as genetic deployment of resistance genes, are effective solutions against diseases and can significantly boost yields [2,3,4]. Management of crop diseases through the use of genetic resistance and agronomic practices to maintain healthy crop stands is very important in long-living perennial systems that are cultivated for multiple growing seasons [5].
Intermediate wheatgrass (IWG, Thinopyrum intermedium, (Host) Barkworth & D.R. Dewey subsp. intermedium, 2n = 6x = 42) is a cool-season perennial crop native to the Mediterranean and Eastern Europe [6]. The University of Minnesota (UMN) has been developing IWG as a domesticated grain crop since 2011. This crop provides continuous living cover, while producing grain and forage at a low input cost. Because of its close taxonomical relationship with wheat (both belong to tribe Triticeae) and near-immunity to several wheat diseases, IWG has been used to transfer resistance genes into wheat. Examples include the stem rust gene Sr44 [7], stripe rust gene YrYU25 [8], and other genes that provide resistance against viral and fungal diseases [9]. Uncovering additional resistance genes will be useful not only to IWG, but also to other annual small-grain crops. In this study, we dissect and discuss the genetic resistance observed in an F1 IWG population against two devastating diseases of cereal grains: Fusarium head blight, and bacterial leaf streak.
Fusarium head blight (FHB, also known as scab) is a devastating disease of wheat and can be found in all wheat-growing regions of the world [10]. Caused primarily by the fungus Fusarium graminearum, this disease localizes on the spikes, causing premature death of florets, reducing yield and severely affecting grain quality. Disease initiates when wind-blown or rain-splashed fungal ascospores and macroconidia land on the spikes during or shortly after anthesis [11]. Upon successful colonization, the fungus kills florets and prohibits kernel development. The fungus also contaminates infected seeds with a number of trichothecene mycotoxins, including deoxynivalenol, 3-acetyldeoxynivalenol (3-ADON), and 15-acetyldeoxynivalenol (15-ADON), rendering the grain harmful for both food and feed usage [12]. Despite the availability of cultivars with improved resistance and efficacious fungicides, serious losses in wheat occur annually across the United States [11]. FHB is known to occur in IWG populations at low disease levels (reported average disease severity of 15%) [13,14], and the crop is currently considered quite resistant to the pathogen. The underlying genetics of FHB resistance in IWG is yet to be studied, with this study being the first one to do so.
Bacterial leaf streak (BLS) of wheat has recently become a major disease in the Northern Great Plains, and is primarily caused by the bacterium Xanthomonas translucens pv. undulosa (Xtu)—although several pathovars exist and infect different cereal crops [15]. BLS is mostly observed in leaves with longitudinal stripes and is often accompanied by production of translucent to milky exudates under favorable conditions [16,17]. The pathogen causes elongated light brown lesions in leaves that gradually turn necrotic, and in the case of advanced infections, longitudinal black stripes appear on the glumes known as black chaff. In the Northern Great Plains of the United States, BLS is now considered the second most important disease in wheat and barley after FHB, and may be responsible for yield losses of up to 40% [15,18]. Fungicides are not effective against this disease, and the genetic control of available resistance sources has not been well-characterized [19,20,21]. Discovery of additional novel and effective sources of resistance is therefore imperative to protect cereal crops from this disease. The extent of host-pathogen interaction between IWG and X. translucens is largely unknown, with limited scientific reports indicating the virulence of X. translucens pv. cerealis to IWG cultivars ‘Rush’ and ‘Tegmar’, and accessions PI 547316 and PI 380636 [22]. BLS is typically absent from the IWG selection nurseries conducted in Minnesota.
The IWG breeding and domestication program at the University of Minnesota focuses on improving multiple agronomic traits, along with resistance to diseases and pests. As a perennial crop, IWG plant stands remain in the ground for multiple cropping seasons. Selecting genotypes resistant to diseases and pests is an important breeding objective, and is integral to crop adaptability, domestication, and evolution [23,24]. The IWG breeding population is regularly evaluated for resistance against FHB in inoculated and mist-irrigated nurseries, and susceptible genotypes are discarded. Reaction to viral, bacterial, and other fungal diseases are evaluated as they appear. The advantages of selecting genotypes with superior resistance are twofold: (1) Increase the frequency of resistant alleles in our IWG breeding population, and (2) provide opportunity to transfer genes from resistant IWG genotypes to annual cereal crops such as wheat and barley [25]. In order to achieve these goals, donor parents hosting the resistance genes must be identified from periodic disease evaluations, followed by gene mapping to identify the genes as well as markers linked with the genes.
Linkage mapping is a powerful approach used in discovery of genomic regions associated with traits of interest. It can provide robust information needed to characterize regions harboring candidate genes, especially when combined with high throughput sequencing [26]. Genetic markers identified from linkage mapping studies can be used in marker-assisted selection to select superior genotypes in a recurrent breeding program. To realize this, a high density consensus linkage map for IWG was developed using 10,029 polymorphic markers in seven families, totaling 1327 individuals [27]. For quantitative traits, markers can be used in genomic selection models for trait improvement at a population level. In fact, the University of Minnesota IWG breeding program leverages the recently completed IWG genome sequence [28] to identify high-quality DNA markers and use them in genetic mapping studies, as well as in genomic prediction models [29,30,31]. Considering that the domestication of a novel perennial crop such as IWG is a difficult task requiring selection on many traits, fortifying the genomic selection-based breeding scheme with significant markers discovered from linkage mapping can improve genetic gain and expedite the domestication process [30].
Therefore, this study was conducted with the primary purpose of discovering genetic loci in a biparental IWG F1 population that provide resistance to FHB and BLS. In addition, we report the percentage of phenotypic variance explained by these loci, the level of linkage disequilibrium, and recombination frequencies observed in the linkage maps in this IWG population. We also explored the usability of significant loci in practical breeding by testing QTL combination models and carrying out genomic predictions for reductions in disease severity.

2. Materials and Methods

2.1. Biparental Population for QTL Mapping

The IWG F1 mapping population used in this study was developed by crossing the genets C20-7 and A77-3 [27]. A genet is defined as a genetically unique organism and refers to individual plants in an outcrossing species such as IWG [30]. Both parents were from the first recurrent selection cycle at the University of Minnesota (UMN_C1) and were selected because of their contrasting levels of disease resistance in St. Paul, Minnesota (MN) during 2011–2013. Both parents were transplanted into a greenhouse from the field and allowed 4 weeks of vegetative growth. Plants were vernalized at 4 °C for 8 weeks, then placed in a greenhouse to induce flowering. Flowering spikes from both parents were enclosed in pollination bags during January–February 2014, and successful crosses were hand threshed. Plants germinated from the seeds were transplanted in the field in September 2014. Several tillers from each plant were cloned in September 2015 and were maintained in an outdoor plant nursery until October. The F1 population was vernalized during November–December, and disease phenotyping commenced in early 2016.

2.2. Breeding Population for Genomic Prediction

IWG genets from the third recurrent selection cycle of UMN IWG breeding population (UMN_C3) were subjected to FHB screening in the field during 2017 and 2018. UMN_C3 consists of 451 genets and has been described in detail by Bajgain et al. [29]. Field inoculation of UMN_C3 with FHB was done in St. Paul, MN by spreading maize kernels colonized by F. graminearum to provide a source of ascospore inoculum. The isolates of F. graminearum used were collected from wheat, barley, and IWG in 14 Minnesota locations during 2013–2017 (Table S1). Infected maize kernels were first spread 5–7 days prior to heading, followed by two additional broadcasts 10 and 20 days later. A mist-irrigation system, running for 10 min once an hour from 22:00 to 06:00, from 7 days pre-anthesis to 14 days post-anthesis was used to facilitate disease development. The UMN_C3 genets in both St. Paul years were observed to enter anthesis 18–21 days after heading and were highly resistant to FHB, with only 3% and 5% of the entire population deemed susceptible (≥50% severity) in 2017 and 2018, respectively. For this reason, no genomic analysis was done with the field data except for genomic prediction as outlined later in this section. Response of UMN_C3 to FHB in the field was recorded and coefficient of FHB infection calculated in the same manner as outlined below for the greenhouse experiments. The population was not rated for its response to field BLS due to the lack of a standard BLS inoculation protocol for IWG.

2.3. Genotyping

From each plant, 10–15 cm of leaf tissue was collected and dried on a silica bed for 5 days. DNA was extracted from ground leaf tissue using the BioSprint 96 DNA Plant Kit (QIAGEN, Valencia, CA, USA). Extracted DNA was quantified using picogreen, normalized, and double-digested libraries were created for sequencing using genotyping by sequencing [32]. Sequences obtained from Illumina HiSeq 2500 were filtered for minimum quality score of 30, de-multiplexed, and aligned to the IWG reference genome v2.1 [28]. The program ‘bwa’ was used for reference indexing [33], and ‘samtools’ followed by ‘bcftools’ [34] was used for allele calling. SNPs were filtered based on the following criteria: (1) minimum minor allele frequency of 35%, (2) maximum major allele frequency of 65%, (3) less than 10% missing data, (4) minimum read depth of 5 per allele, and (5) allele call between the two parents must be different nucleotide bases. Sequences of this mapping population are available on NCBI’s sequence read archive under BioProject PRJNA524302.

2.4. Linkage Map Construction and QTL Mapping

Linkage maps were constructed in Joinmap 4.1 [35]. As the parental alleles were known, segregating SNP markers were converted into the appropriate format for an outbreeding full-sib family, i.e., into <llxlm>, <hkxhk>, and <nnxnp>. Markers with similarity of ≥95% and P value of <0.001 in chi-square tests for segregation distortion were discarded. Since SNPs were called based on the IWG reference genome, chromosome names were used as anchors for marker assignment into linkage groups and ordering. Within each linkage group, SNP markers clustered together with logarithm of odds (LOD) of 8 or greater were selected for ordering. Markers were ordered based on the maximum likelihood algorithm and genetic distance was estimated using the Kosambi map function. Once a preliminary map was constructed, the nearest neighbor (N.N.) fit test was done to remove SNP markers that did not fit well at a given map position. Markers with N.N. stress value larger than 4 cM were removed and the map reordered until the optimal map was obtained.
Pairwise linkage disequilibrium (LD) between SNP markers in the linkage maps were calculated within Joinmap. LD between markers within a distance of 0.1 cM or less were not estimated. The rate of LD decay was calculated according to Hill and Weir [36]. Recombination frequencies between pairwise SNP markers were also estimated in Joinmap. Estimates of LD and recombination frequencies were plotted in R [37] against the pairwise genetic distance (cM) for each IWG chromosome. The R package ‘hsphase’ [38] was used to estimate the number of recombination events and draw haplotype blocks. Based on the LD results, 10 SNPs per recombination block were used to validate the breakpoints. Non-imputed genotypic data was used for this purpose as this produces better results, as suggested by Ferdosi et al. [38].
Trait data, genotype data, and map information were imported into MapQTL 6 [39] and interval mapping for a cross-pollinated model was used to uncover significant loci. A mixture model with mapping step size of 1 cM and maximum number of neighboring markers of 10 was run for 1000 iterations; QTL were declared significant at LOD value of ≥3.0. For all significant QTL, the peak LOD value, the peak SNP marker, and percentage of explained phenotypic variation (R2) are reported.

2.5. Phenotyping and Statistical Analysis

The mapping population was evaluated for resistance to bacterial leaf streak (BLS) and Fusarium head blight (FHB) under greenhouse conditions between January and April in 2016, 2017, and 2018. BLS inoculations were carried out 5–7 days prior to anthesis. Xtu strain CIX134, which was collected from IWG plants in St. Paul, MN in August 2012, was used for the greenhouse screenings [15]. Inoculum was prepared from 3 days-old purified bacterial cultures growing as lawns on Wilbrink’s agar [40]. Cells were suspended in sterile saline solution (0.85% NaCl w/v), adjusted to 0.100 OD540, and diluted 10-fold for a working concentration of 107 cfu ml−1. Inoculum was stored in ice and delivered to the plant within 1 h of preparation. Sterile saline solution was used as a mock control. Suspensions were loaded in blunt sterile syringes and infiltrated into the leaf surface until 0.1–0.3 mL of suspension entered the leaf. Three flag leaves from each plant were infiltrated in two replications of the population. Inoculated plants were grown at 28 °C/22 °C day/night with a 16 h photoperiod. Once the flowering spikes were inoculated with F. graminearum, the temperature regime was changed (described below) to favor Fusarium infection and the development of FHB. At 21 dpi, Xtu virulence were recorded on a discrete scale by measuring lesion lengths (cm) [15].
An F. graminearum isolate collected from IWG plants in St. Paul, MN (field L-4, Minnesota Agricultural Experiment Station) in 2014 was used for inoculations. The F. graminearum isolate was cultured in sterile mung bean broth as described by Gautam and Dill-Macky [41], adjusted to a concentration of 200,000 macroconidia mL−1, and macroconidia were stored in 20 mL polyethylene liquid scintillation vials (Wheaton Industries, Millville, NJ, USA) at −80 °C until the day of inoculation. This suspension was loaded in sterile syringes fitted with needles, and individual IWG spikes were inoculated at a rate of 5 µl of the spore suspension per spike. For each genet, a spike at anthesis (Z65; [42]) was inoculated at a single location near the middle of the spike. Five spikes were inoculated per plant in two replications of the population. Inocula were placed inside the glumes of a single floret of a single spikelet. Inoculated spikes were covered in a clear zip-lock plastic bag for 72 h to increase humidity and produce an environment optimal for Fusarium infection [43]. Post-inoculation, 25 °C/19 °C temperatures with 16 h photoperiod was maintained for 21 days. At 21 dpi, the number of infected spikelets and total spikelets per spike were counted. For each plant, the number of infected spikelets was divided by total number of spikelets for each spike, and the result of each inoculated spike averaged to get coefficient of FHB infection on a 0–1 scale, where 0 is completely resistant and 1 is completely susceptible.

2.6. Statistical Analyses and Genomic Predictions

All phenotypic data were corrected for environmental variability (trial effect) using the MIXED procedure in SAS 9.3.1, following Sallam et al. [44]. Obtained best linear unbiased estimates (BLUEs) were adjusted for trial effects. In order to improve the normality of data distribution, BLUEs were transformed using arcsine-square root (arcsine√ 1 − (CI + 1)/100), log (log10 (CI + 1)), and square root ((√ (CI + 1)/100)) methods. Improved normality of the transformed data was assessed using the Shapiro-Wilk normality test (shapiro.test function) in R. Despite the test results confirming improved normality, transformed data still departed from normality except for FHB17 and BLS17 (Table S2). Based on the Shapiro-Wilk normality test, log-transformed datasets were best overall and used in all subsequent analyses. Broad-sense heritability (H) of the two diseases was estimated on a genet mean basis [29].
SNP markers significantly associated with FHB in this study were used as fixed effects in a genomic selection model to study their effect on trait predictive ability in the UMN_C3 breeding population. The adjusted BLUE values were used for genomic prediction in rrBLUP using the function kin.blup [45]. Correlations were calculated using fourfold validation method, i.e., between the estimated values of the validation set (75% of UMN_C3) and the training set (25% of UMN_C3, sampled randomly without replacement), and were averaged from 1000 replications.

3. Results

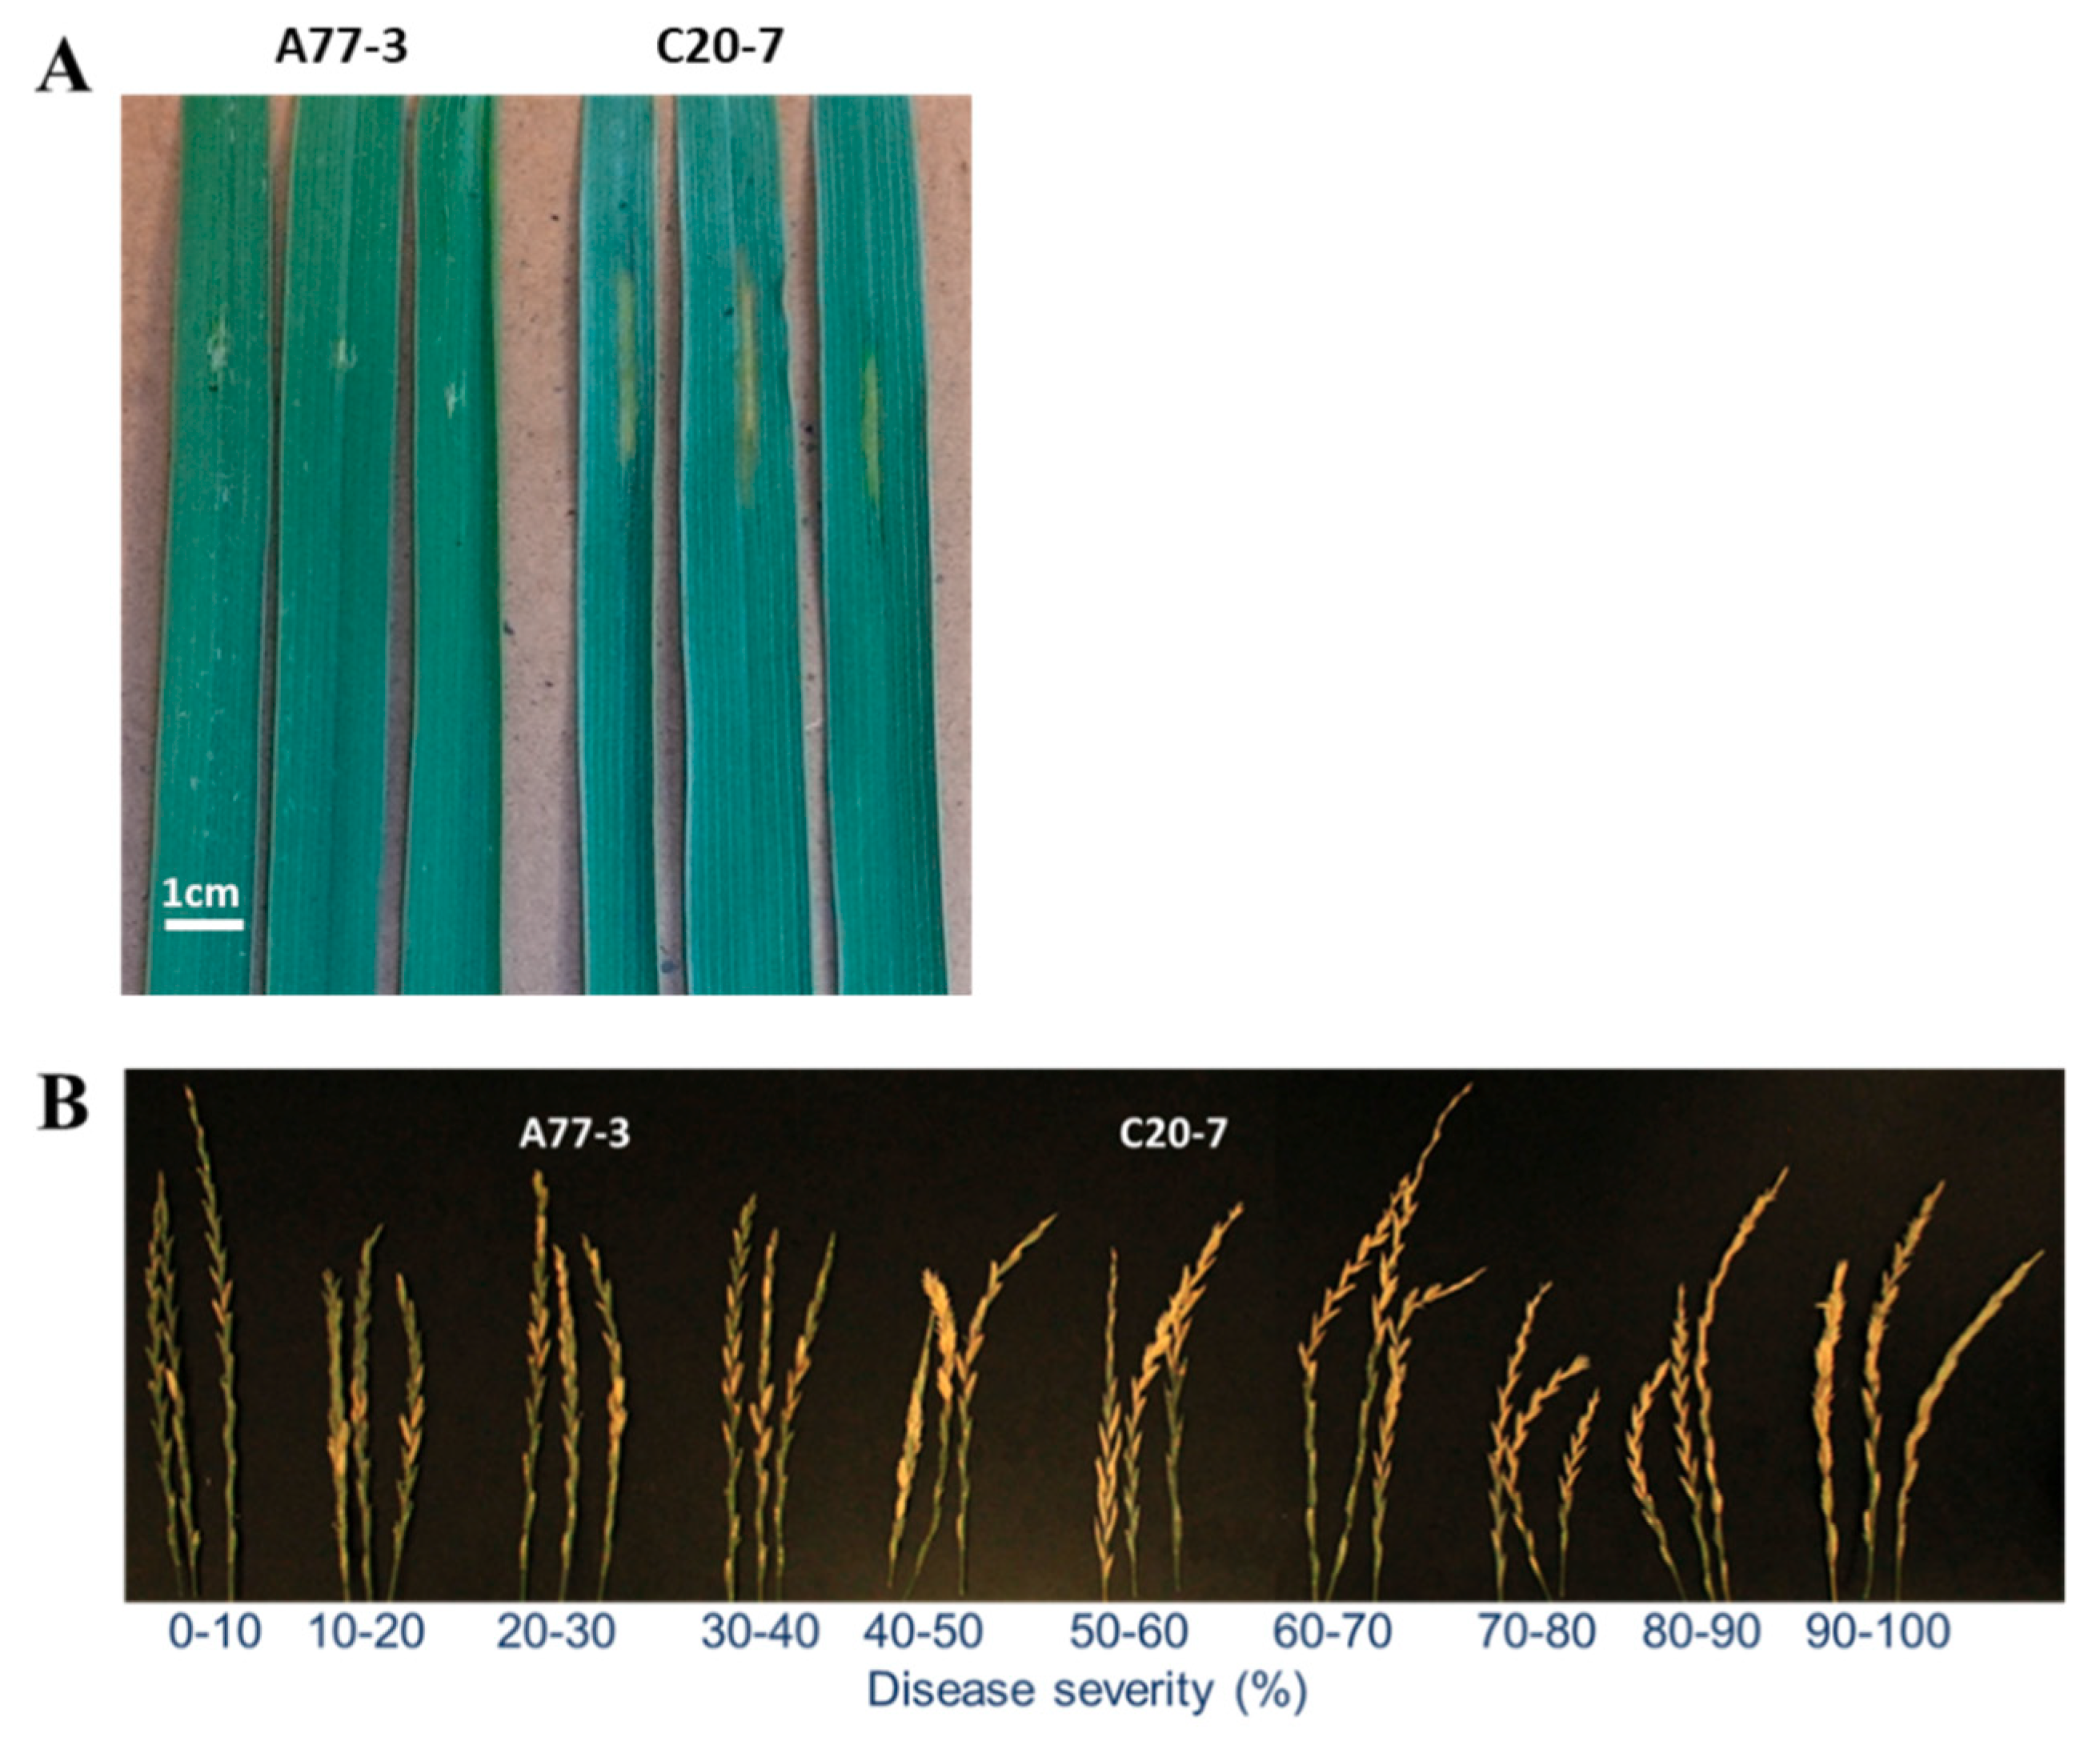
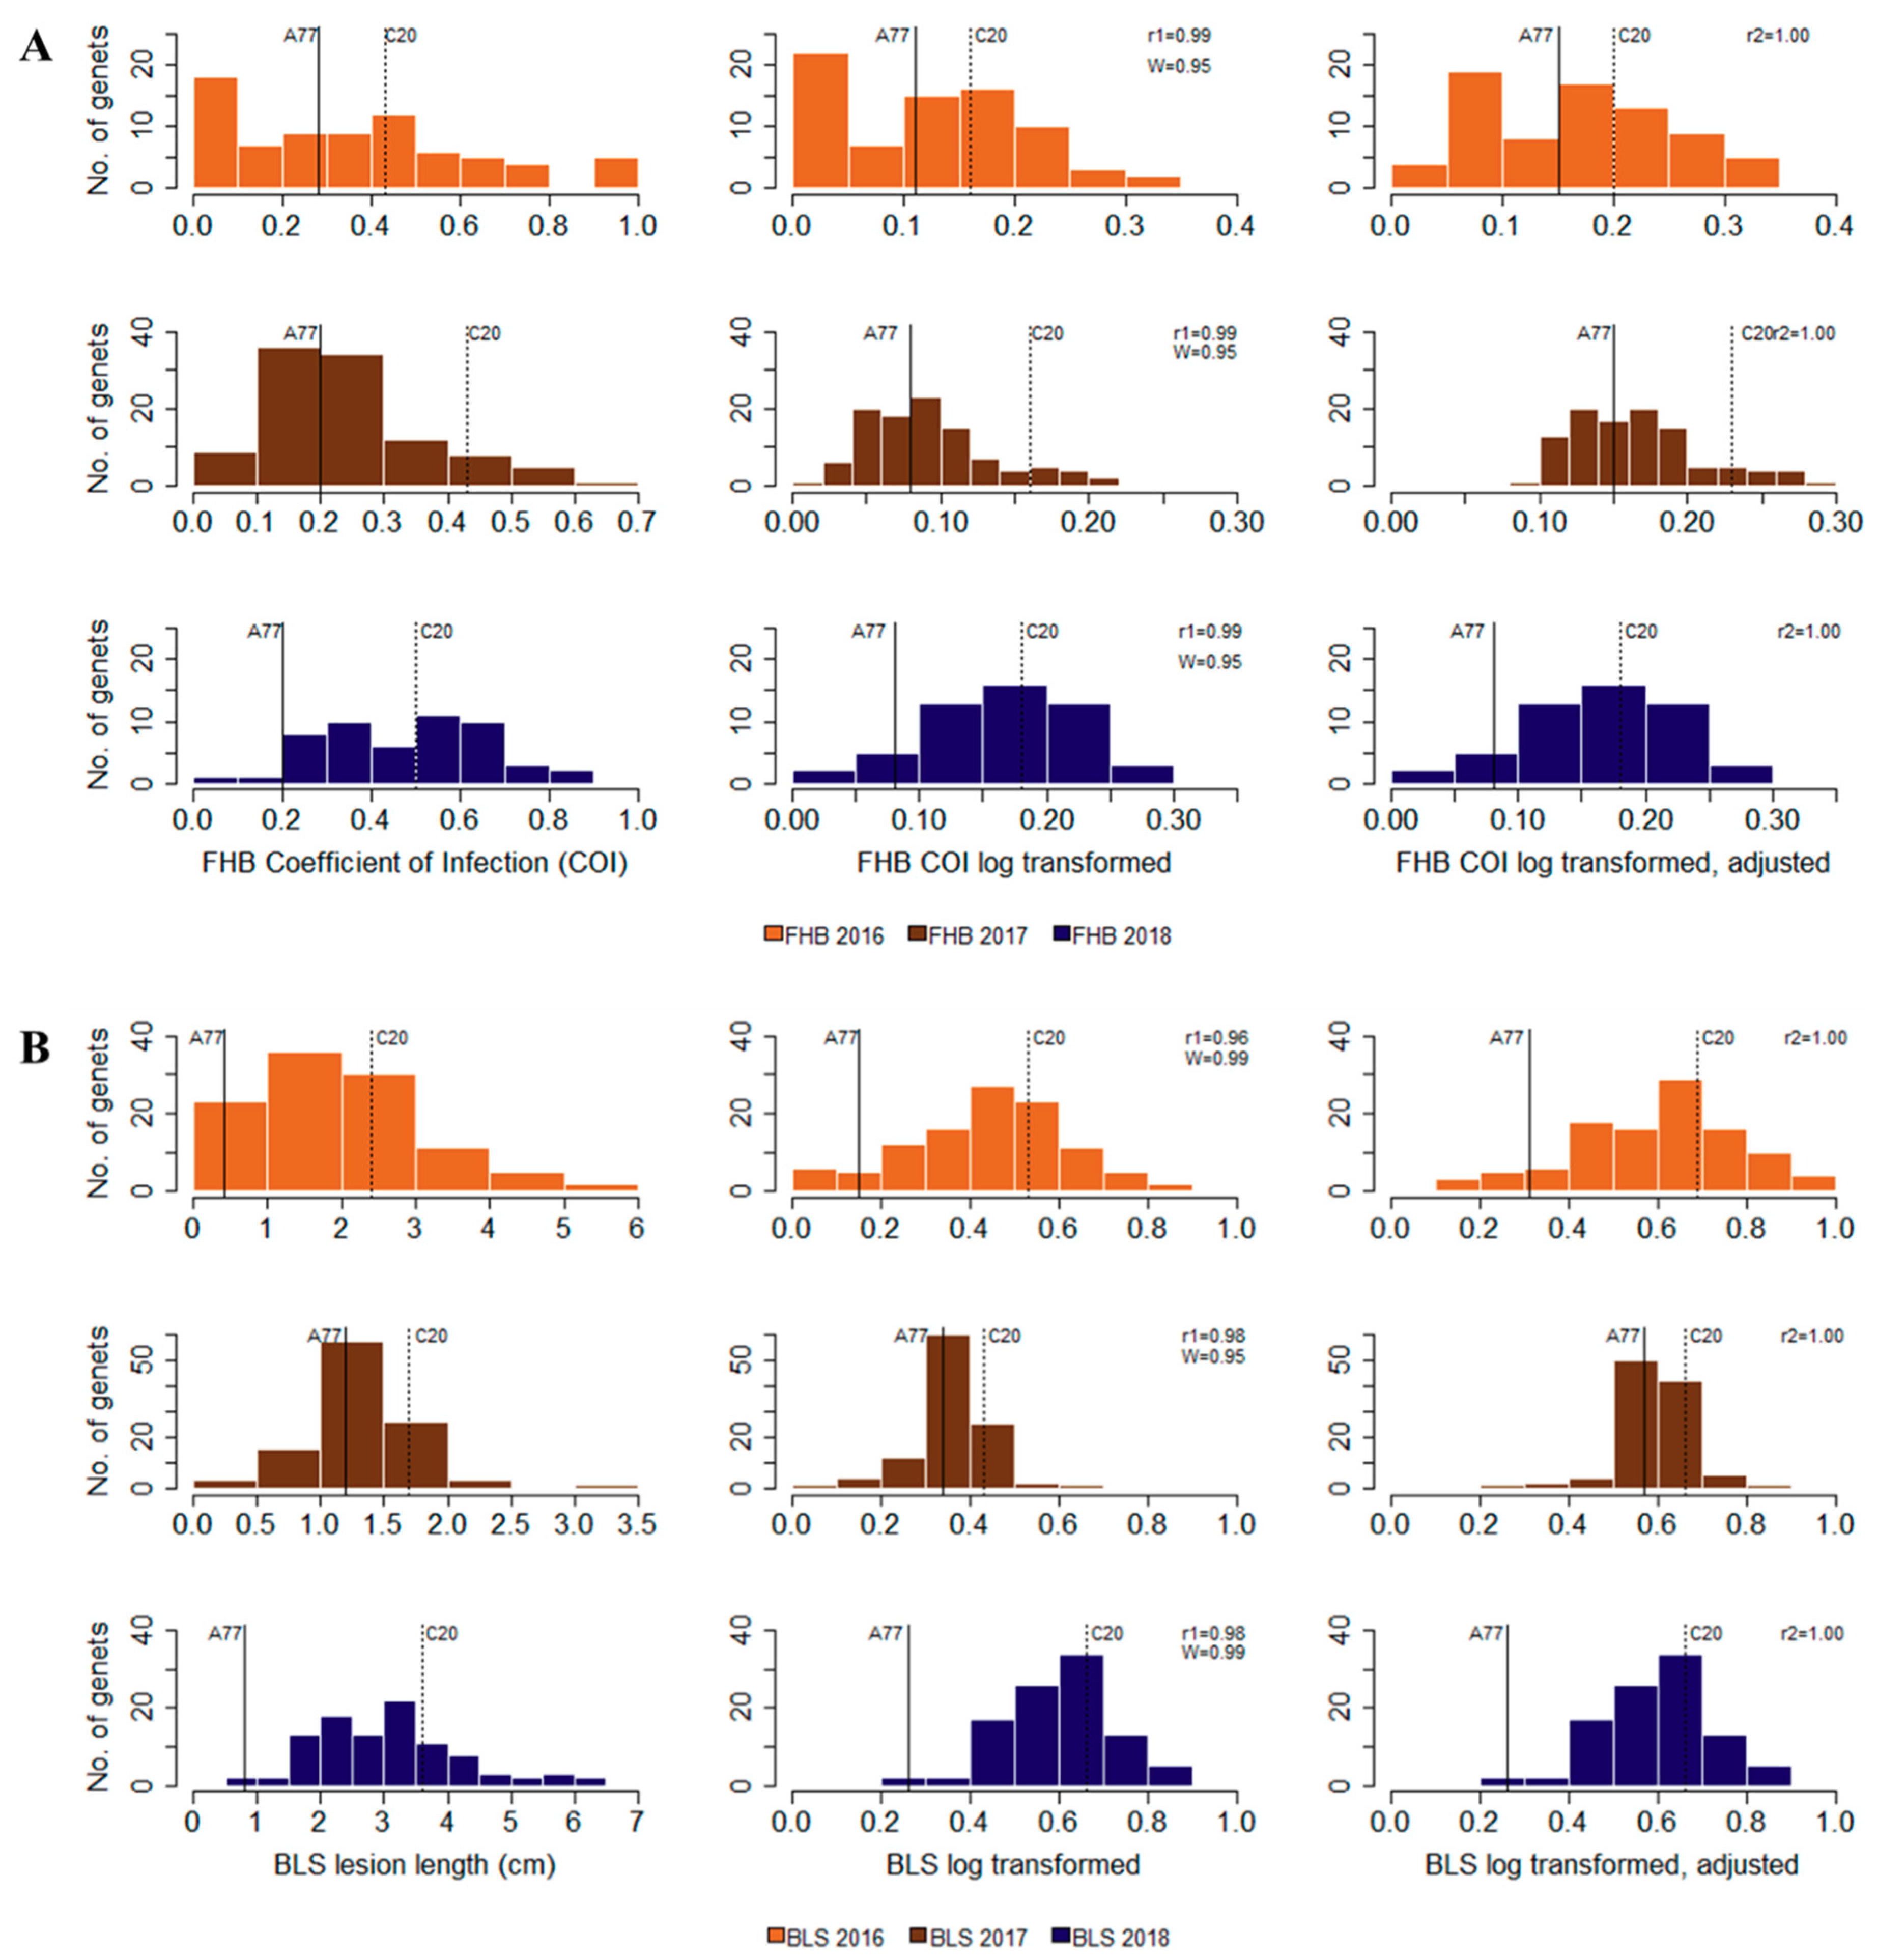
3.1. Disease Evaluation

The parent A77-3 exhibited high resistance to both FHB and BLS, whereas C20-7 showed high and medium levels of susceptibility to FHB and BLS, respectively (Table 1, Figure 1). Distribution of disease severity for both diseases were observed to be quantitative, yet with a predominance of more resistant types relative to the population mean. Significant differences were observed between A77-3 and C20-7 for their average responses to FHB across all three years (t-test p-value of 0.03 at α = 0.05), but the differences for their responses to BLS was not significant (t-test p-value of 0.12 at α = 0.05). Disease distribution for the population was strongly transgressive, with the coefficient of FHB disease distribution observed from 0.0 to 0.8 (0% to 80% susceptibility, in other words) and BLS ranging from 0.0 to 5.9 cm; the maximum BLS response observed in the population was nearly twofold that exhibited by the susceptible parent C20-7 (Figure 2). All pairwise correlations (r) among FHB16, FHB17, and FHB18 were significant at α = 0.05 and ranged from r = 0.22 to 0.35 (Table S3). The pairs BLS16–BLS17 (r = 0.21) and BLS17–BLS18 (r = 0.23) were also significant at α = 0.05, but BLS16–BLS18 was insignificant with r value of 0.16. Broad-sense heritability (H) for BLS across the three experimental years was 0.39 and H for FHB was 0.53.
The UMN_C3 population evaluated for its resistance to FHB in the field was highly resistant, with only 4% of the entire population susceptible (≥50% severity) to the fungus in 2017 and 2018 (Figure S1).

3.2. Genotyping and Linkage Maps

Sequencing of the A77-3 × C20-7 F1 mapping population generated approximately 1.5 million reads per genet. The most recent version (v. 2.1) of the Thinopyrum intermedium reference genome sequence was used for read alignment and allele calling. In total, 2,642,109 SNPs were detected in 21 chromosomes in the mapping population. After removing SNPs that did not meet the filtration criteria (described in Materials and Methods section), 43,730 SNPs remained (Table S4).
Construction of linkage maps was done in Joinmap 4.1 with minimum LOD value of 8 used to group SNP markers. During this process, markers with high resemblance to each other and markers that did not fit in a map were removed. The final map had 4622 SNP markers distributed among all 21 IWG chromosomes, with an average of 220 markers per chromosome (Table 2). The genome-wide allelic depth of these markers was 26 reads per SNP marker (Table S4). The total genome-wide length of all 21 maps was 3439 cM with an average inter-SNP distance of 0.74 cM. The linkage group representing Chromosome 5 had the fewest number of markers (73) and was the shortest, with a length of 91.5 cM. Although the linkage group representing Chromosome 13 had the most markers (378), Chromosome 18 had the longest map with a length of 251.6 cM. Map positions of SNP markers in all linkage groups and the physical locations of these markers were strongly correlated with genome-wide Pearson’s correlation value (r) of 0.75, and ranged from 0.47 in Chromosome 5 to 0.91 in Chromosome 7 (Table 2).

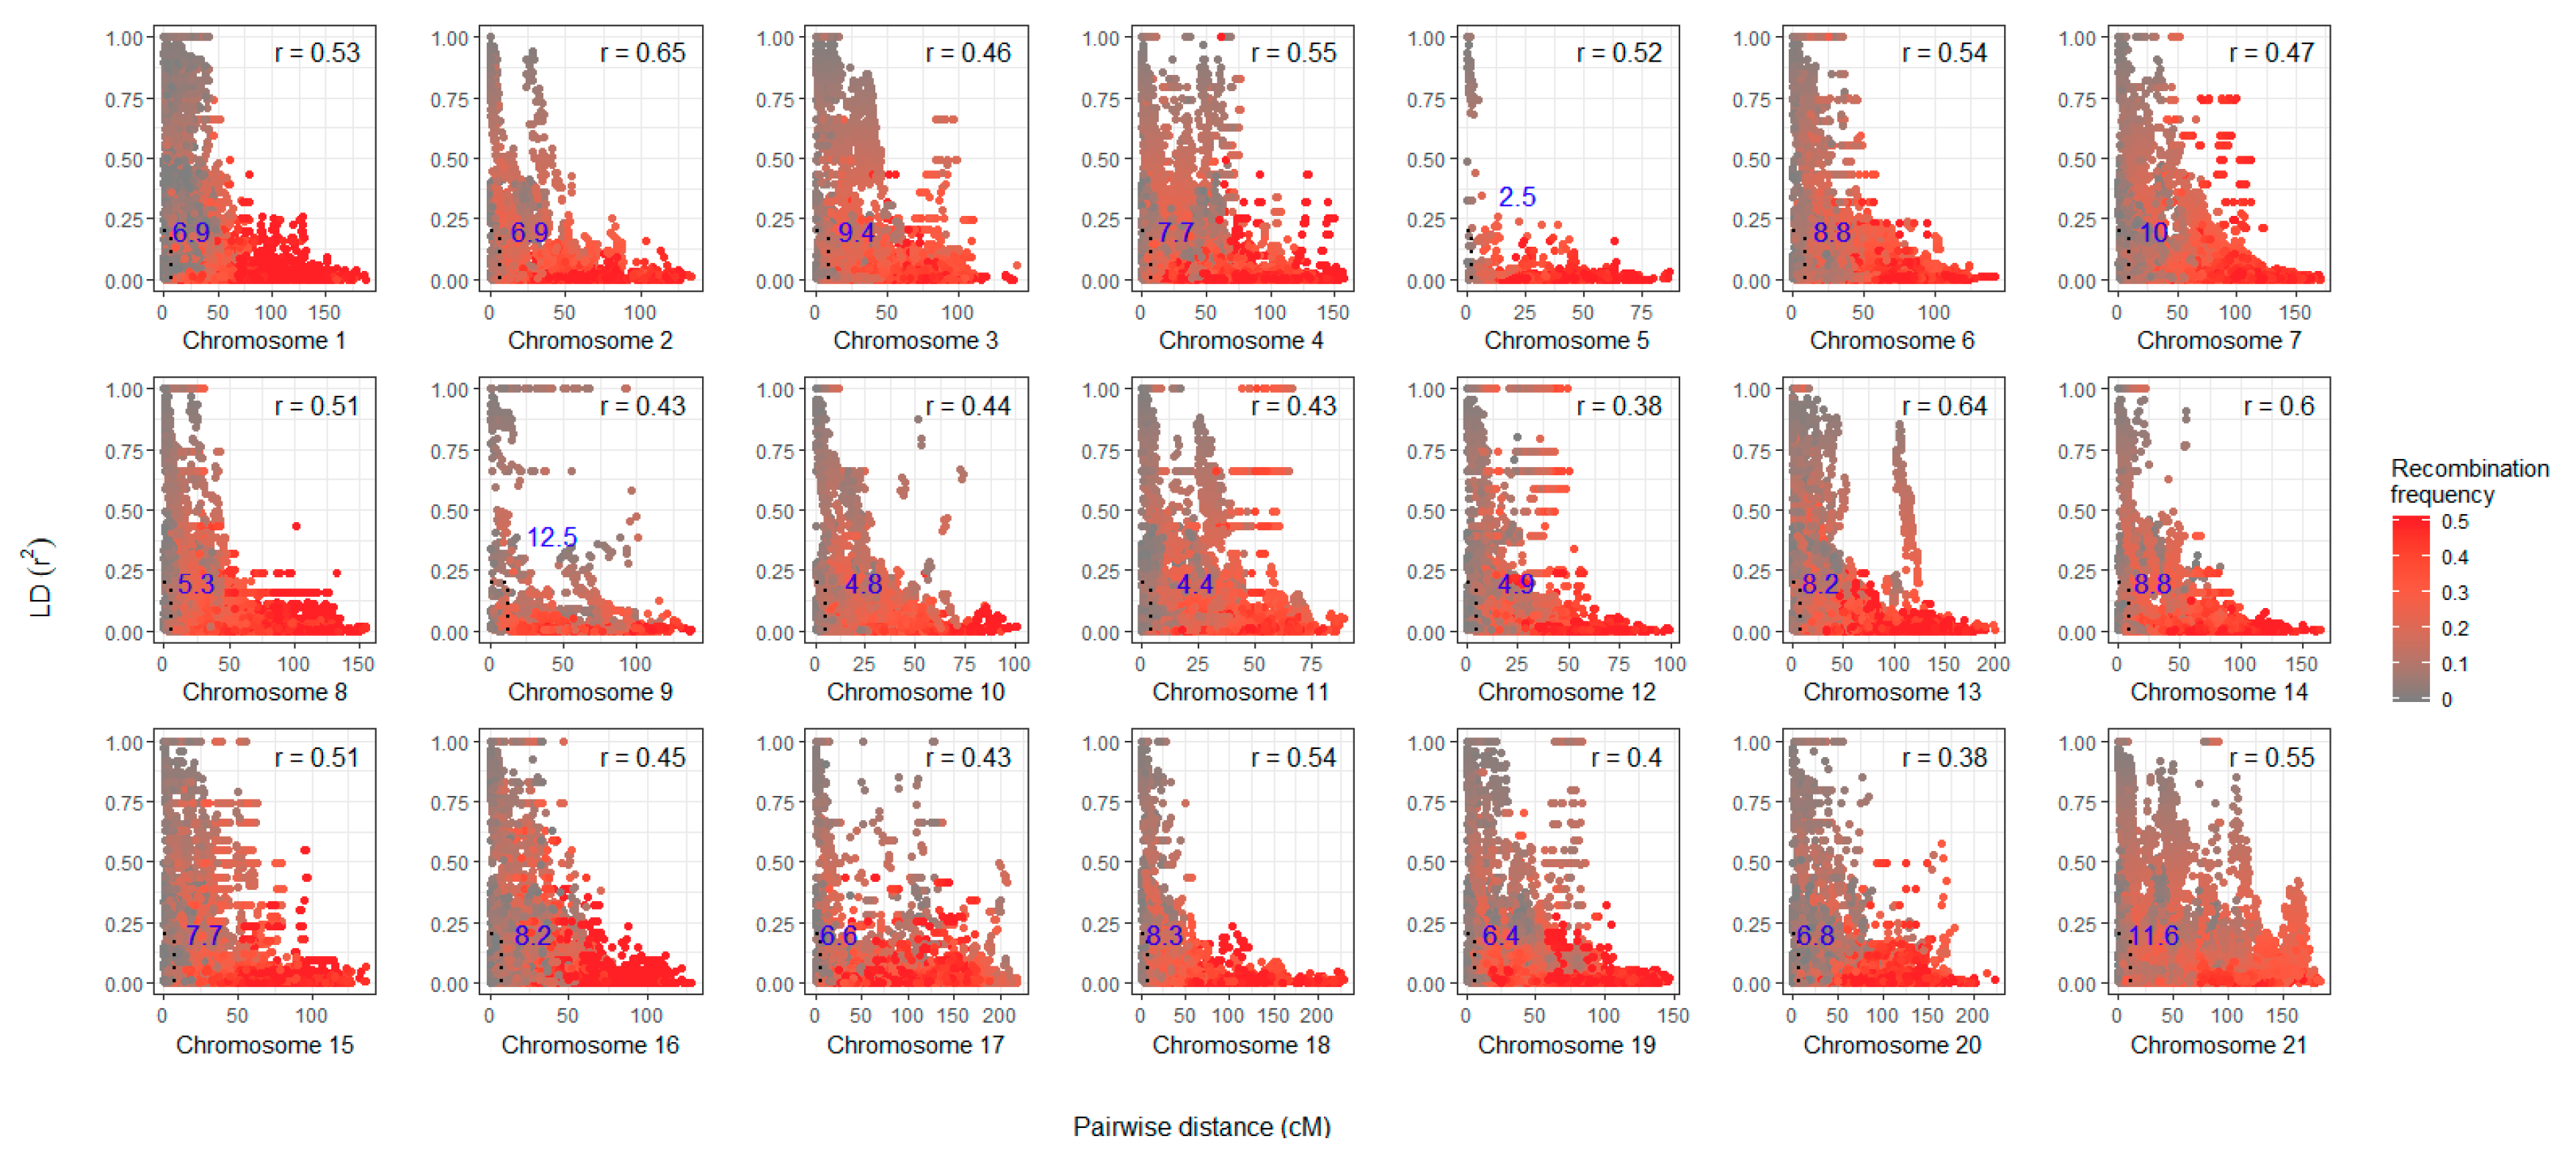
3.3. Linkage Disequilibrium and Recombination Events
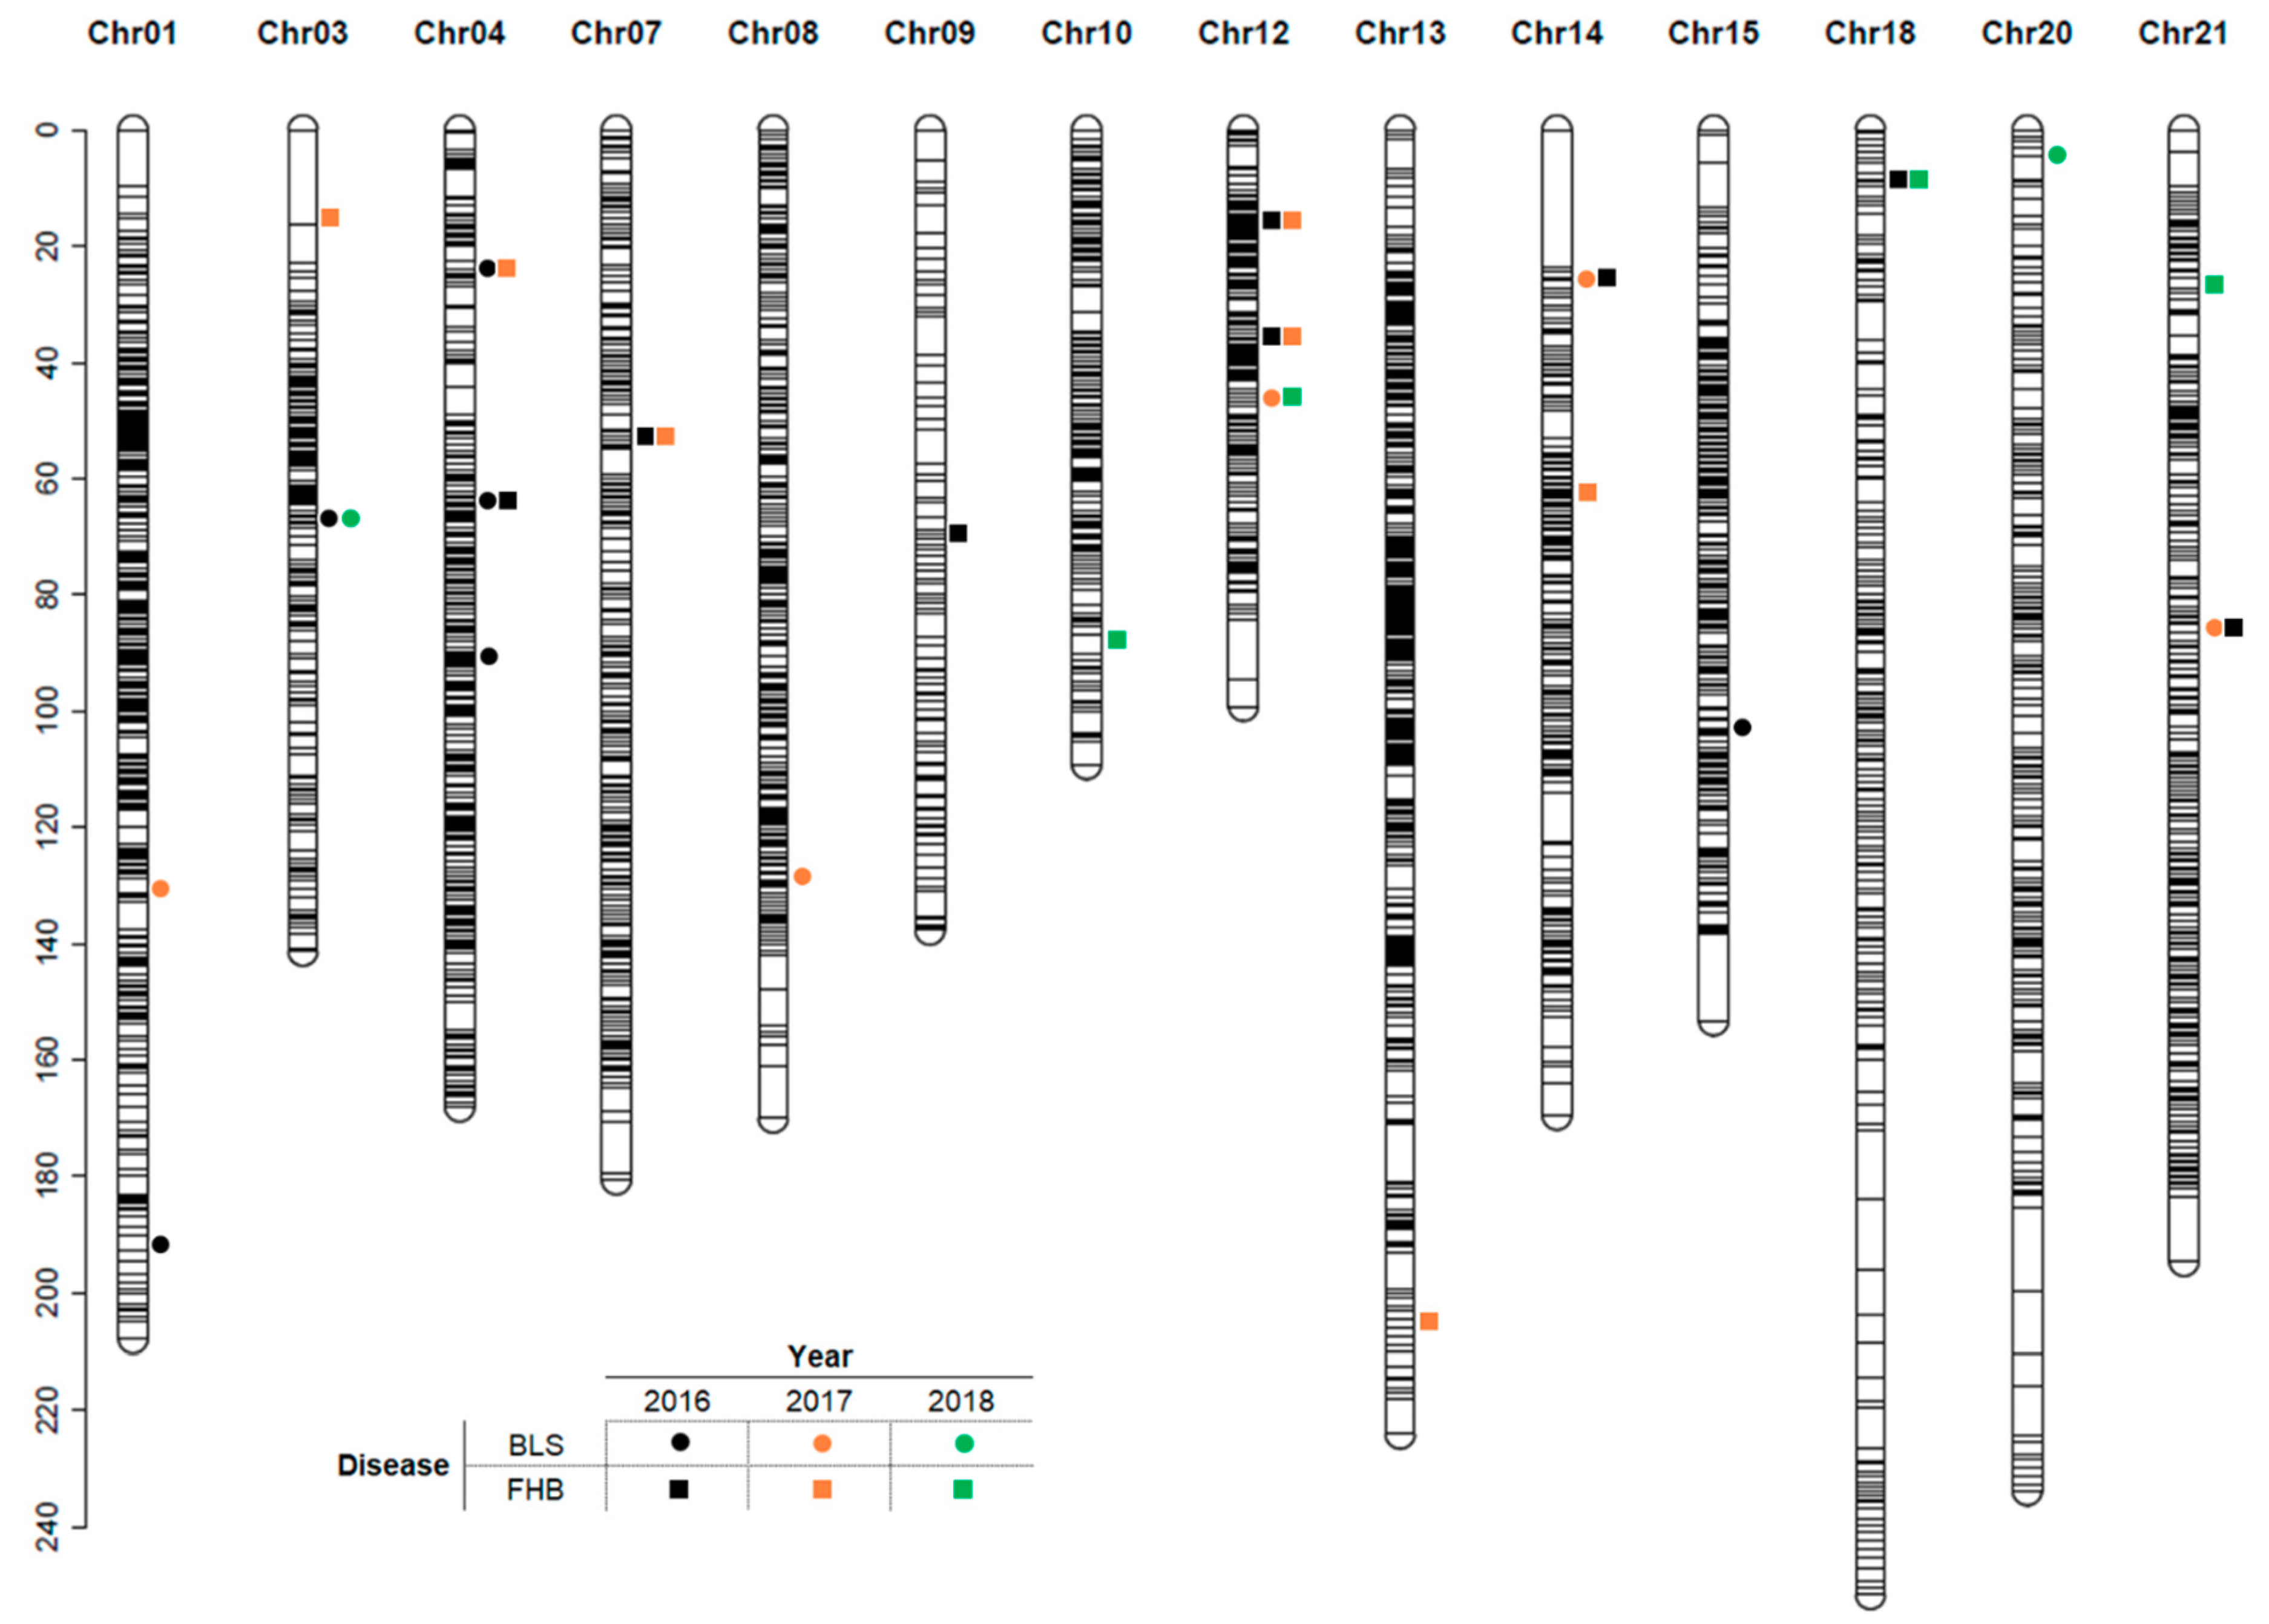
In the A77-3 × C20-7 IWG F1 population, the genome-wide distance for half decay of LD was estimated to be 7.5 cM. The fastest decline in LD was observed in Chromosome 5 at 2.5 cM, while Chromosome 9 had the largest distance (12.5 cM) for the LD to decline to 50% of its original value (Figure 3). As expected, recombination frequencies were the highest among SNP pairs located the furthest from each other and was supported by strong positive correlations between genome-wide recombination frequencies and LD (r = 0.50), and recombination frequencies and pairwise marker distance (r = 0.65). Across the whole genome, there were 2858 recombinations with an average of 136 per chromosome (Figure S2, Table S5). Chromosome 3 had the fewest recombination events (72), whereas Chromosome 13 had the most (278). The number of recombination events per genet ranged from 10 to 42, with an average of 22.

3.4. QTL Mapping

Interval mapping detected 22 QTL distributed in 14 chromosomes that provide resistance against BLS and FHB (Table 3, Figure 4). QTL have been named according to conventions used in wheat [46]. Across the three experimental years, 11 QTL were discovered for resistance against BLS and 15 against FHB. The lowest number of QTL (2) was detected in the BLS18 environment and the highest (8) was detected in the FHB16 environment. Five QTL were shared between the diseases (Figure 4):
i.
Two between BLS17 and FHB16 (Ti_Qbls.umn-Chr14.1 and Ti_Qfhb.umn-Chr14.1, and Ti_Qbls.umn-Chr21.2 and Ti_Qfhb.umn-Chr21.2).
ii.
One between BLS16 and FHB16 (Ti_Qbls.umn-Chr4.2 and Ti_Qfhb.umn-Chr4.2).
iii.
One between BLS16 and FHB17 (Ti_Qbls.umn-Chr4.1 and Ti_Qfhb.umn-Chr4.1).
iv.
One between BLS17 and FHB18 (Ti_Qbls.umn-Chr12.3 and Ti_Qfhb.umn-Chr12.3).
In addition, four QTL (Ti_Qfhb.umn-Chr7, Ti_Qfhb.umn-Chr12.1, Ti_Qfhb.umn-Chr12.2, and Ti_Qfhb.umn-Chr18) were common between two FHB disease environments, and one QTL (Ti_Qbls.umn-Chr3.2) was common between two disease environments. No QTL was common across all three environments for either disease. The resistant parent A77-3 contributed 9 out of 15 FHB QTL and 7 of the 11 BLS QTL (Table 3). QTL contributed by A77-3 explained on average 12% and 11% of the observed phenotypic variance for FHB and BLS, respectively, relative to 6% each for both diseases by C20-7.
The percentage of phenotypic variation (R2) explained by the BLS QTL ranged from 3.2 to 12.9; these values for FHB QTL were 3.1 and 17.6, respectively (Table 3). The largest QTL observed for any disease and environment combination was Ti_Qfhb.umn-Chr12.2 in the FHB18 environment with R2 value of 17.6%. This QTL was also present in the FHB16 environment and had a slightly lower R2 value of 12%. The largest BLS QTL was Ti_Qbls.umn-Chr14.1 in the BLS17 environment with R2 value of 12.9%.

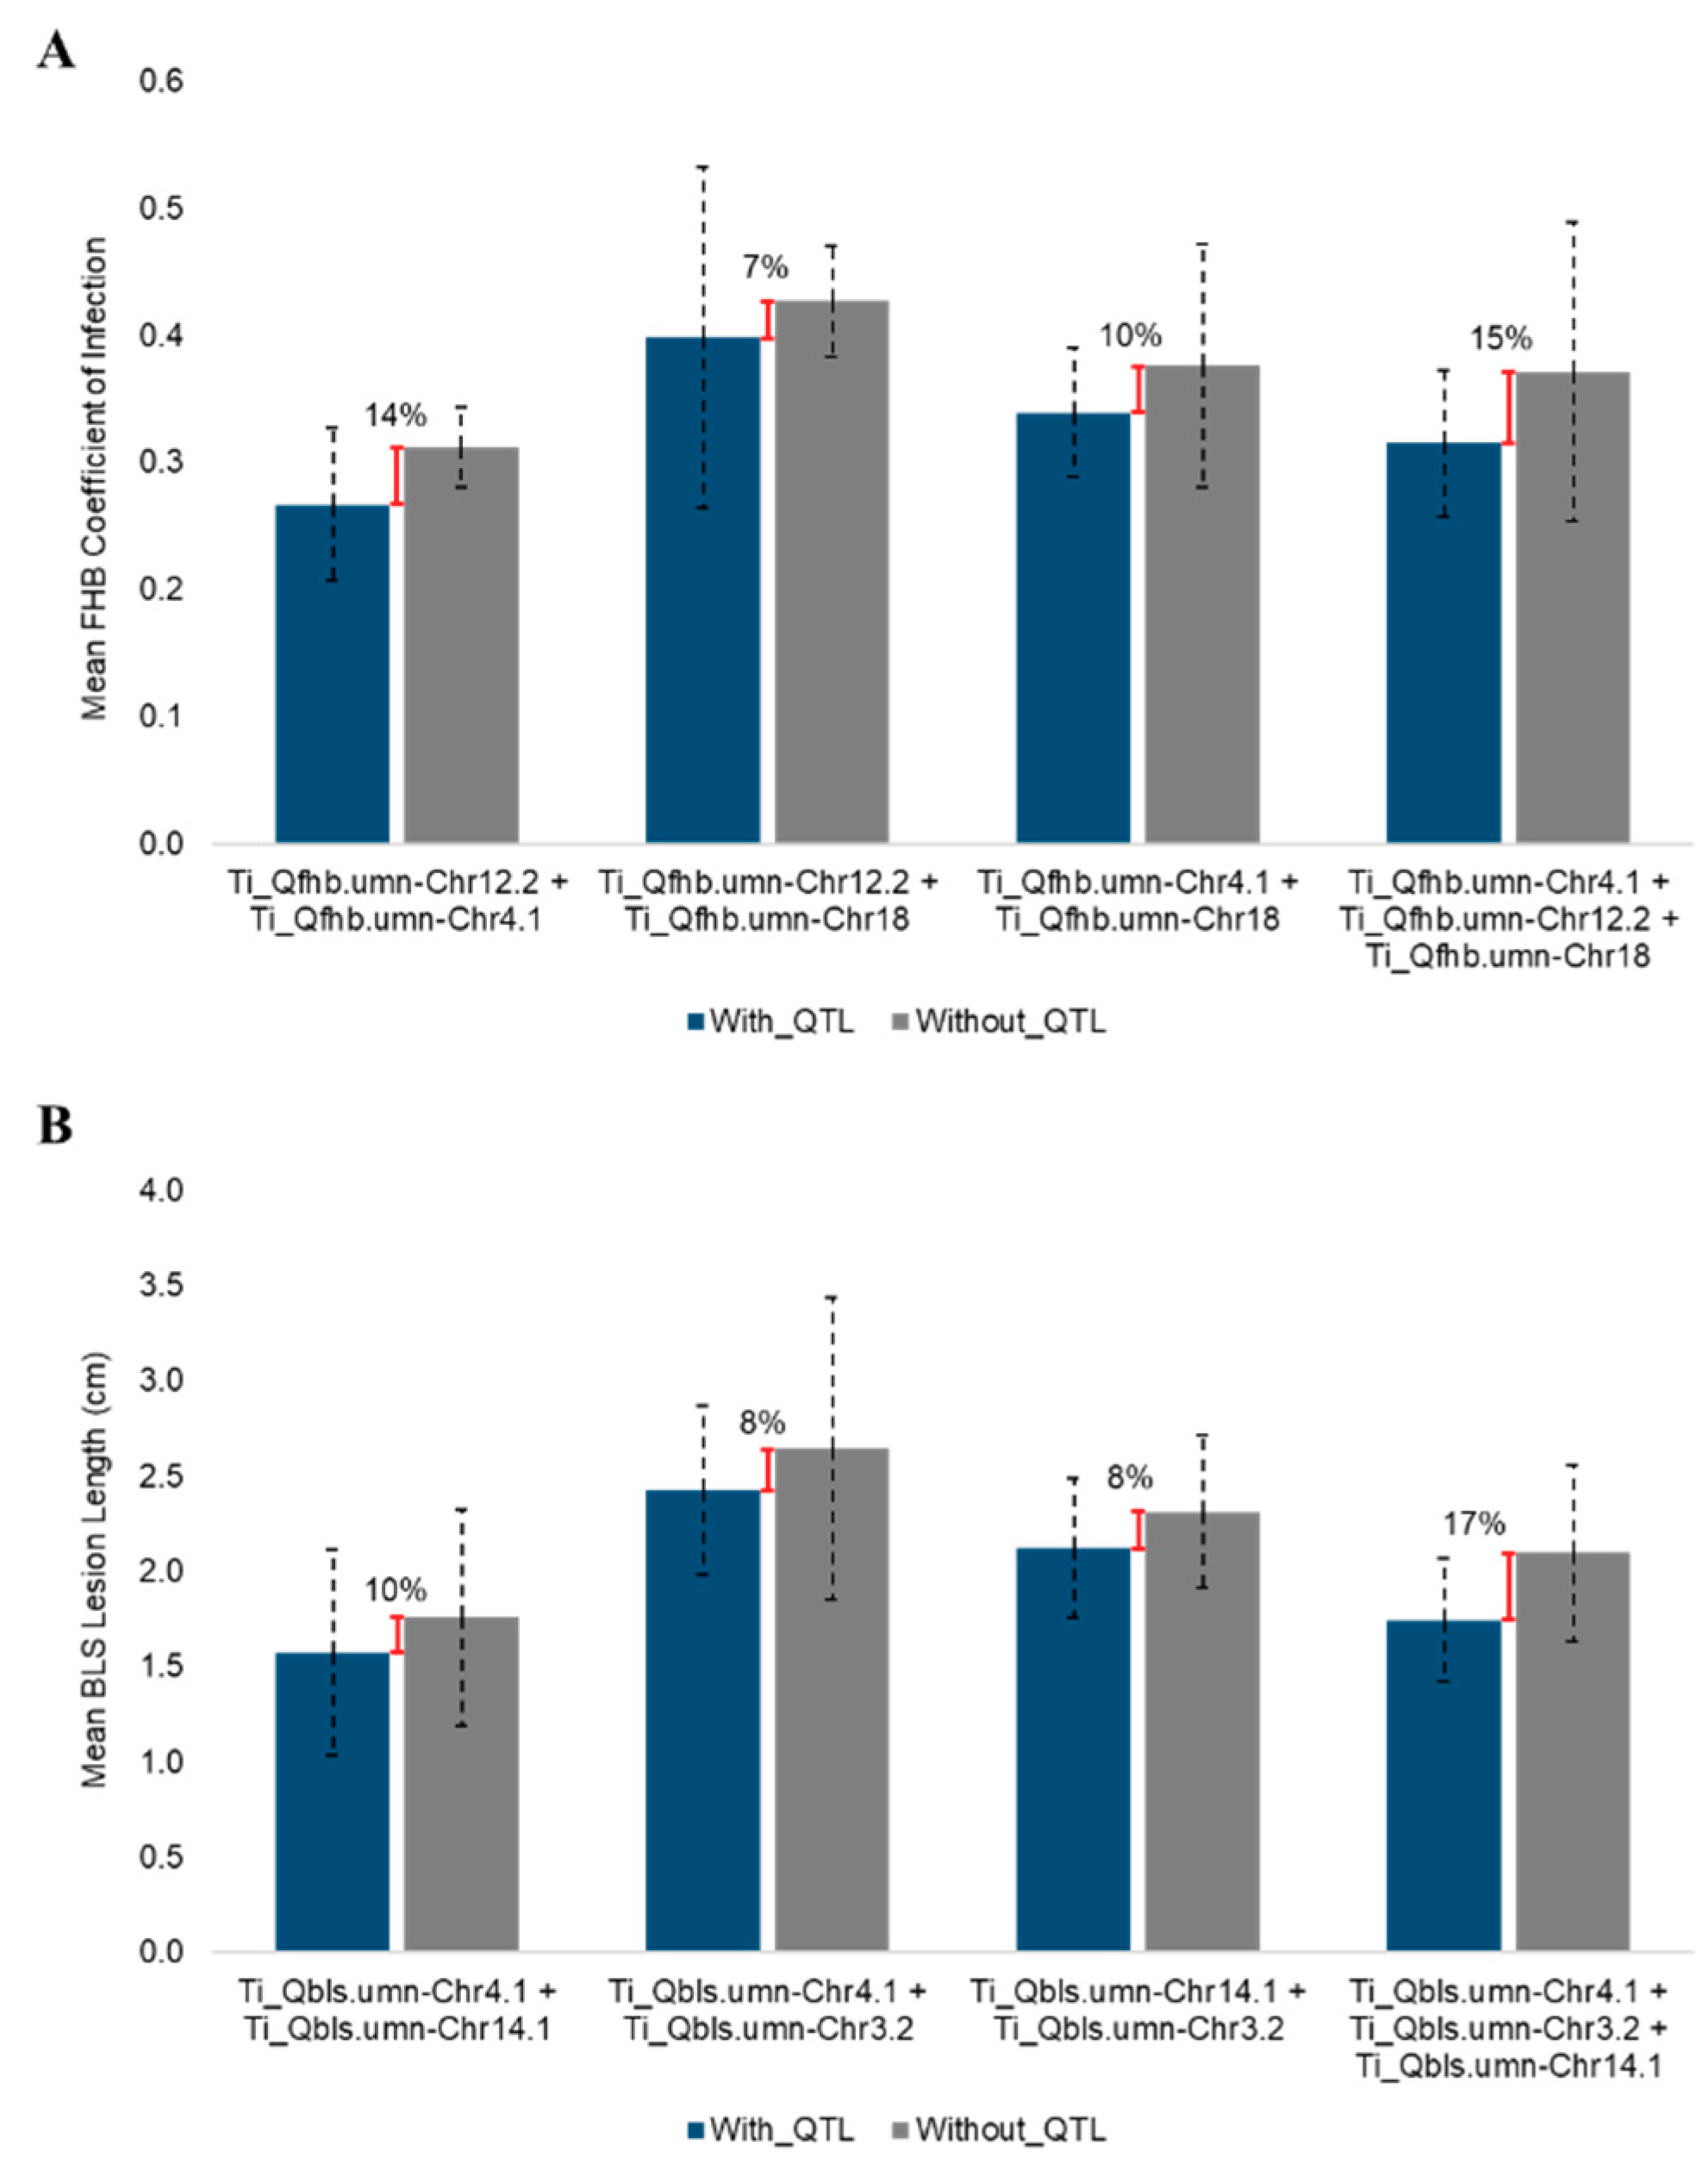
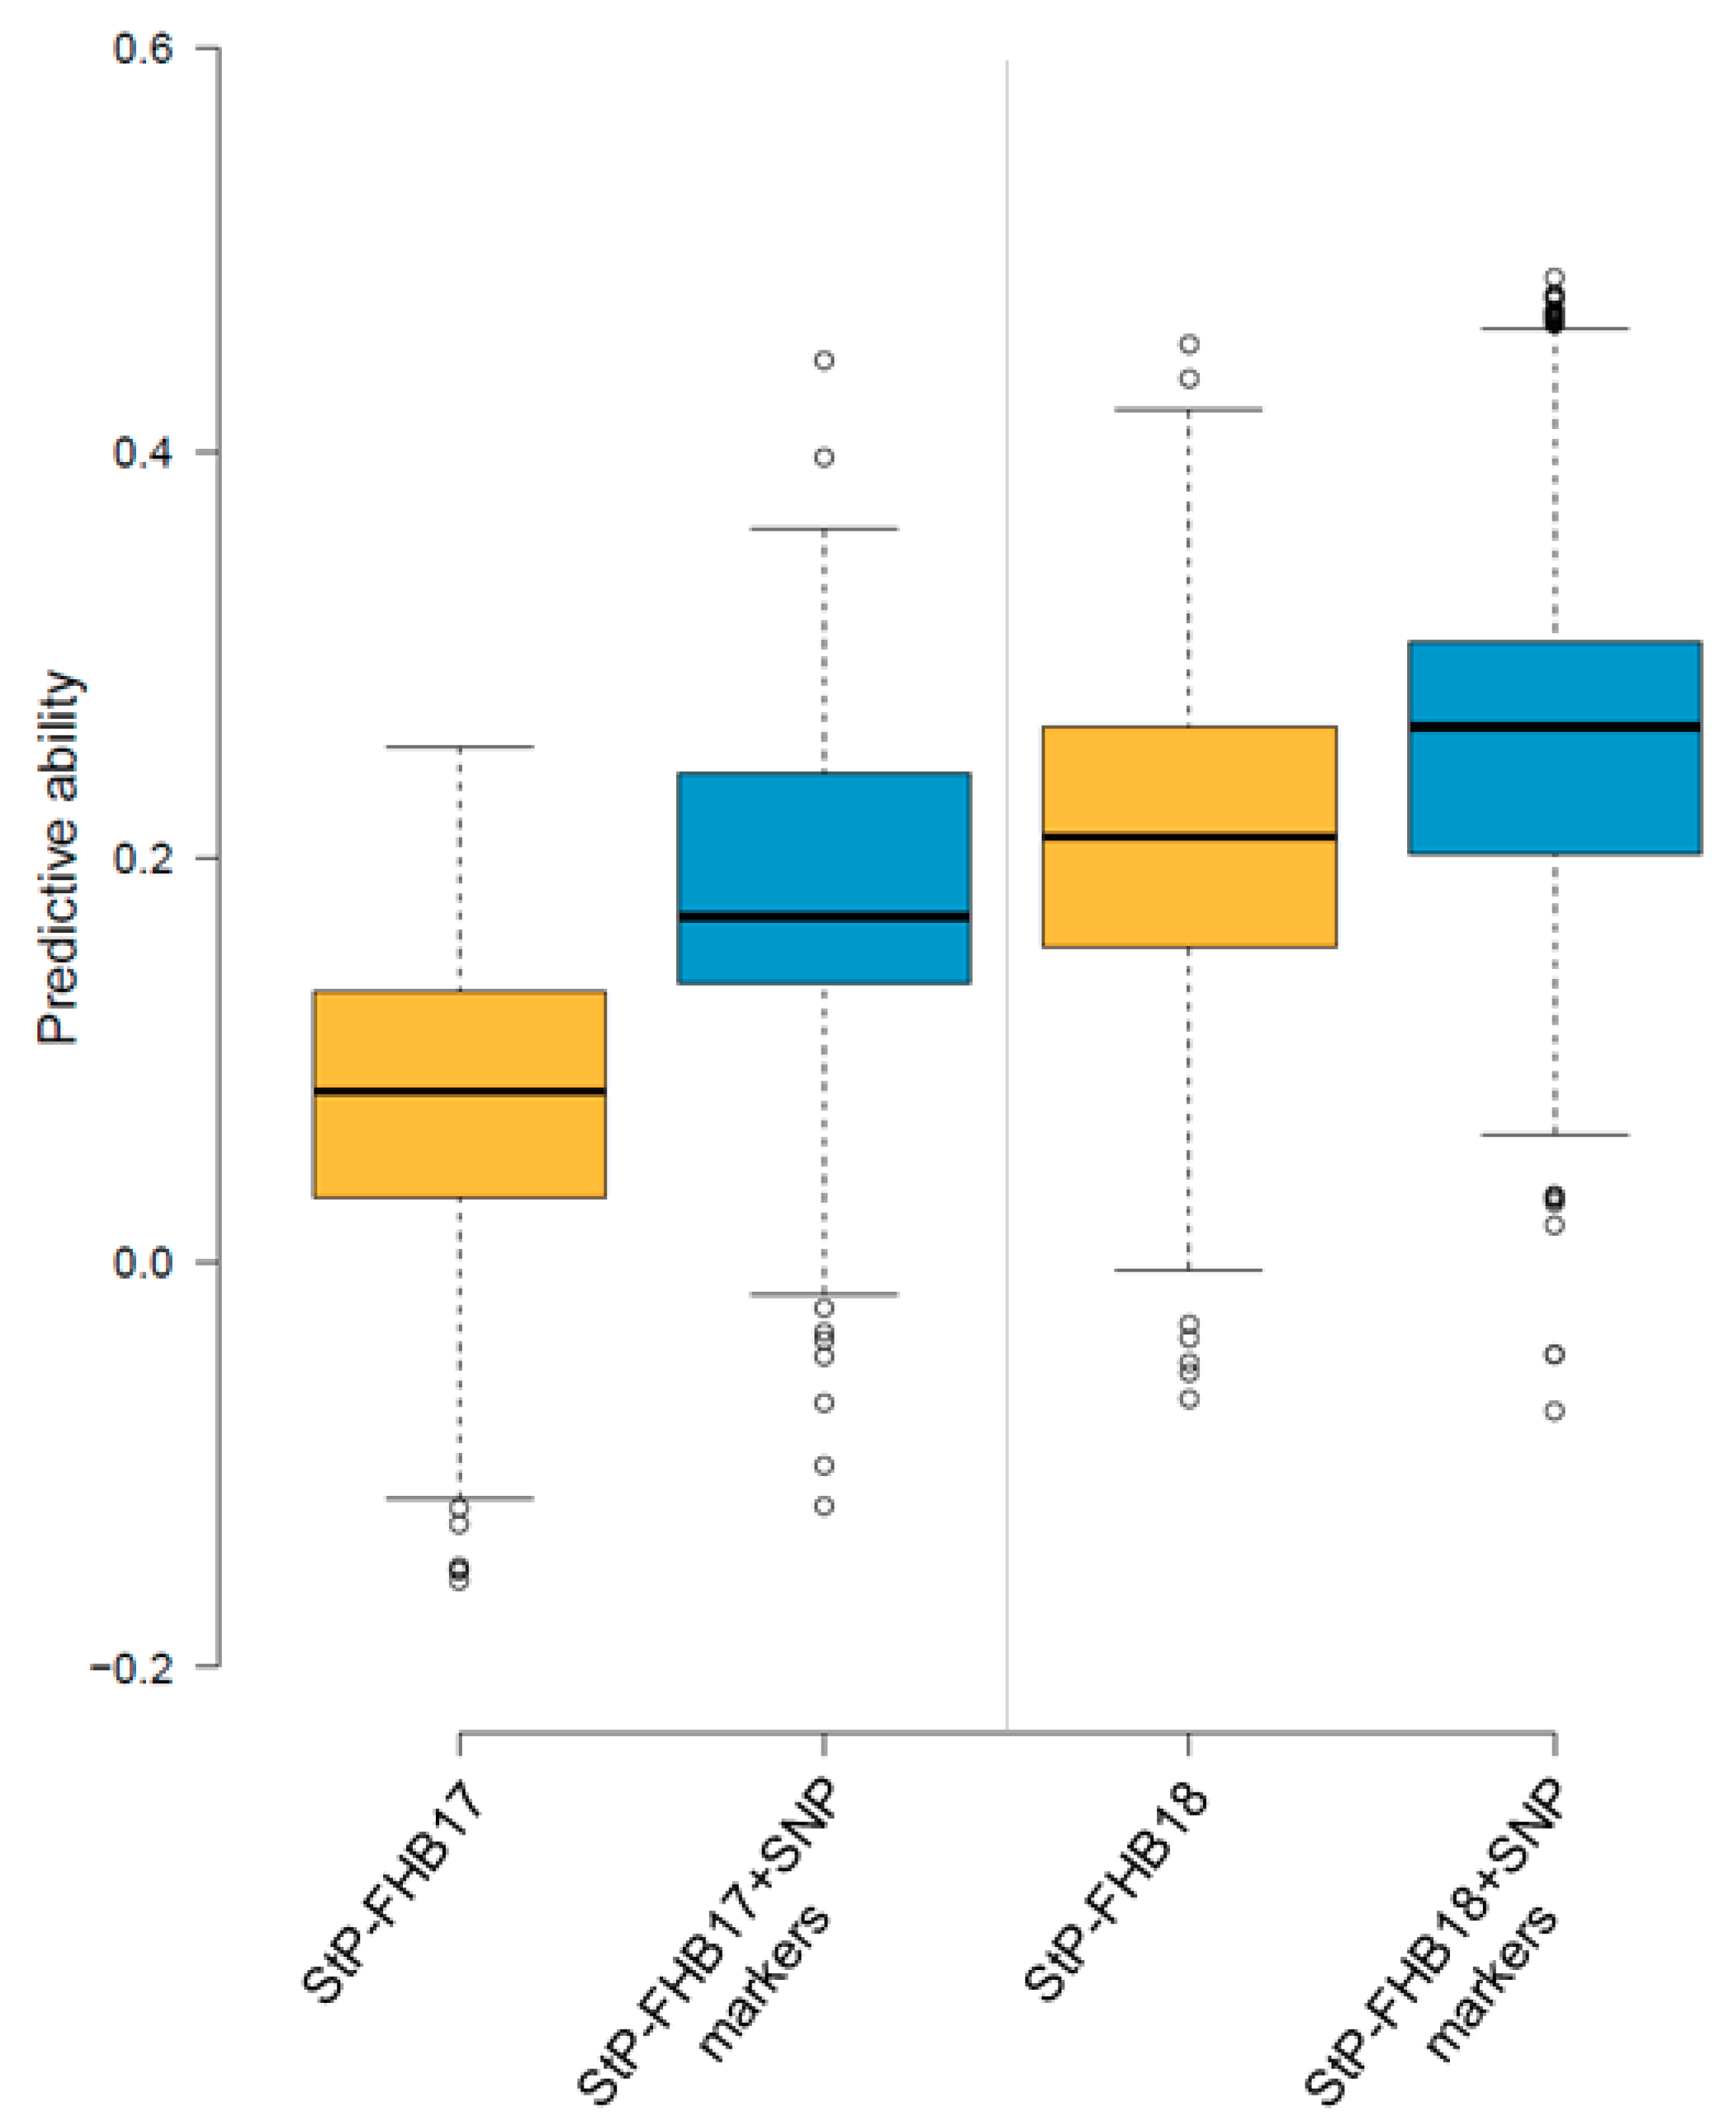
3.5. QTL Models and Genomic Selection for Disease Reduction

To estimate reduction in FHB and BLS severity, QTL models were generated using the largest QTL, i.e., QTL responsible for the highest amount of phenotypic distribution (R2), in each environment for both diseases. These two and three QTL models reduced FHB by 7–15% and BLS by 8–17% (Figure 5). In the UMN_C3 breeding population, these models reduced FHB by 3–18% in the 2017 environment and by 9–18% in the 2018 disease environment (Figure S3).
The use of SNP markers significantly associated with FHB resistance in this study as fixed covariates in rrBLUP’s ridge regression genomic prediction model improved its ability to predict the trait values (Figure 6). The average predictive ability for 2017 field FHB data without using significant SNP markers as fixed effects was 0.08, whereas this improved to 0.18 when significant SNP markers were used as fixed effects, an increase of 125%. Similarly, these values for the 2018 field FHB data were 0.21 and 0.26, respectively, an increase of 24% in the model with significant SNP markers.

4. Discussion

Fusarium head blight (FHB) is a devastating disease of cereal crops such as wheat and barley; and bacterial leaf streak (BLS) is an emerging disease that affects these crops in the Northern Great Plains. Combined, these two diseases pose serious threats to grain production in regions where they are prevalent. New sources of resistance genes such as the ones described in this study can provide higher degrees of resistance against these diseases and play an important role in protecting our staple crops. Indeed, IWG has been used as a source to successfully transfer resistance genes into other cereal crops against barley yellow dwarf virus [47,48], leaf rust [49,50], stem rust [7,51], and stripe rust [8,52]. As a novel grain crop under domestication, IWG offers unique genetic diversity in terms of discovery and deployment of resistance loci to other cereal crops.
The parents of the mapping population described here were selected from the first recurrent cycle of IWG breeding at UMN. In our experiments, they were significantly different for their reactions to FHB, but not to BLS. The population, however, showed good transgressive segregation with high standard deviations in disease distribution (Table 1). Phenotypic data obtained from three years (2016–2018) were mostly uncorrelated among each other, except few positive and significant correlations, mainly between the FHB environments: FHB16 and FHB17 (r = 0.27), and FHB17 and FHB18 (r = 0.23). Surprisingly, BLS18 had significant correlation with FHB16 (r = 0.20), yet none of the BLS environments were significantly correlated amongst each other, despite having positive correlations (Table S3). These weak correlations are unlikely from variability in F. graminearum and Xtu isolates because the same pathogen isolates were used in inoculations each experimental year. Rather, genotype by environment interactions may be responsible for the poor correlations. We propose this because of the quantitative nature of disease distributions, as well as the lack of distinct gene-for-gene interactions, because several small to medium effect QTL were involved in disease resistance. This is further supported by low heritability estimates for both diseases—i.e., H = 0.39 for BLS and H = 0.53 for FHB. While the resistance is conferred by several small loci, environmental factors also are large determinants of pathogen pressure and disease development.
Using interval mapping, we discovered 22 QTL associated with FHB and BLS resistance in the A77-3 × C20-7 IWG F1 population. These QTL ranged from small to moderately large in terms of the percent of phenotypic variance explained (R2 = 3.1–17.6%), with the largest QTL detected in the FHB18 environment. In wheat, resistance to BLS is likely conferred by several minor effect genes, as reported by previous studies [20,21]. QTL mapping in triticale populations also infected by Xtu revealed a single dominant gene (or few tightly linked genes) on chromosome 5R [53]. For FHB mapping in wheat, several QTL mapping studies have reported more than 100 QTL with varying levels of disease reduction [54,55]. All QTL observed in our population were of small to medium effect with median R2 values of 8.9% and 10.8% for BLS and FHB, respectively; one exception was the FHB QTL Ti_Qfhb.umn-Chr12.2, which showed a moderately large effect (17.6%). Further validation of medium and large QTL for both diseases in different mapping populations is necessary to confirm their effect and usability in marker-assisted selection. Based on the similar levels of effects observed between wheat and IWG, we hypothesize that resistance to FHB and BLS in IWG are conferred by small to medium effect QTL. Nonetheless, discovery of QTL with larger effects remains a possibility in future IWG mapping populations.
It has been well established that resistance to FHB in wheat is of a quantitative nature and combinations of multiple QTL additively protect the crop from the disease [54,55]. Our findings suggest that the resistance to FHB in IWG is also inherited in a quantitative manner. Yet, the levels of natural resistance to FHB in these two crop populations are vastly different. To illustrate, our UMN_C3 IWG breeding population was predominantly resistant to FHB in the field as only 4% of the population was susceptible. In wheat however, larger proportions of elite breeding populations have shown susceptibility as evident in European soft wheat [56], US soft red wheat [57], spring wheat from the US and CIMMYT [58], and Asian and European wheat lines [59]. The low disease severities in IWG support previous findings [13,14] and our own field observations that IWG is principally resistant to FHB. IWG, therefore, may be a source of novel FHB (and BLS) resistance loci for wheat and other annual cereal grain crops.
Measures of LD and recombination frequencies generally determine mapping precision as they dictate the relationship between causative variants and candidate genes [60]. In this IWG F1 mapping population, we observed that the average genome-wide LD decayed to half its value at a distance of 7.5 cM. The linkage maps of this population had approximately 10 markers every 7.5 cM (inter-SNP distance of 0.74 cM on average). In addition, the average genome-wide recombination events per genet was found to be 22. Thus, the overall marker density provided good coverage of genomic regions and we are confident of the mapping resolution and QTL mapping results. However, because LD extended over a long distance, functional annotation of regions flanking the QTL was not pursued. This will be our next task, likely in a larger breeding population with lower LD and higher frequency of recombination events. Such populations tend to have higher resolution for fine mapping a QTL and can aid in discovery of candidate genes [61]. Results obtained will be applied in marker-assisted selection and genomic selection models in our IWG breeding program. It should be noted that the half-decay distance in this population is slightly higher than those reported in other IWG populations: 5 cM in UMN_C1 breeding population [30] and 4.5 cM in UMN_C3 population [29]. This difference is possibly because of different population types: the population reported in this study is an F1 hybrid population obtained from crossing only two parents, whereas UMN_C1 and UMN_C3 populations were obtained from open pollination of many (n ≥ 70) genets.
A proven strategy to improve disease resistance is through gene pyramiding, in which multiple resistance genes are combined or stacked into a set of desirable parents to improve future breeding populations [62]. In our two and three QTL models, genets with the two or three largest effect QTL from each environment for both diseases showed up to 15% reduction in FHB severity and up to 17% reduction in BLS severity (Figure 5). These multi-QTL combinations could provide near-immunity, as stacking multiple genes and their simultaneous expression are hypothesized to create a difficult barrier for the pathogen to overcome [63]. Pyramiding several resistance genes can be a long-term breeding goal, whereas development of molecular markers linked with the QTL can be a short-term goal in a breeding program. We plan to embrace this strategy by using diagnostic markers to screen IWG genets carrying resistant loci and use them as parents to initiate future IWG breeding cycles. With help from marker-assisted selection and/or genomic selection, we will aim at increasing the frequency of resistant alleles, thereby aiding us in protecting this novel crop from potential disease epidemics in the future.
The University of Minnesota IWG breeding program routinely implements genomic selection to select the best parents in its recurrent selection breeding scheme. Multiple agronomic traits and disease phenotypes are combined with SNP markers obtained from high throughput sequencing to train the genomic selection models. Upon using SNP markers significantly associated with FHB resistance in the A77-3 × C20-7 IWG F1 population as fixed covariates in the ridge regression model [45], improvements were seen in the predictive ability of the model, albeit from only 0.08 to 0.19. For a novel crop such as IWG with a relatively short domestication history, this degree of increase in trait prediction is encouraging, and can boost the ongoing breeding efforts. In effect, application of genomic selection has practical and tangible implications for IWG improvement, as shown by previous studies [29,30]. Implementation of genomic selection has benefitted our IWG breeding program by saving time and resources, while also increasing the speed of genetic gain per breeding cycle. We intend to pursue QTL mapping endeavors for other traits in future IWG breeding cycles and populations, and use discovered significant loci in genomic selection models to improve our IWG breeding germplasm.

5. Conclusions

To our knowledge, this is the first study to carry out genetic mapping for resistance to Fusarium head blight and bacterial leaf streak in intermediate wheatgrass. We identified 15 genomic regions in IWG that provide resistance to FHB and 11 regions conferring resistance to BLS; five of which were common between the two diseases. Two or three QTL models reduced disease severity for both diseases. Likewise, using markers significantly associated with FHB resistance in genomic selection models improved trait prediction ability, although the highest average r value only reached 0.26. Likewise, as the University of Minnesota IWG breeding program implements a rigorous genomic selection-based approach for IWG breeding and domestication, improvement in trait predictions will help in the development of elite germplasm resistant to these potentially devastating diseases. These loci may also be explored for their use in annual cereal crops, such as wheat and barley, via gene introgression to provide resistance to these diseases.

Supplementary Materials

The following are available online at https://www.mdpi.com/2073-4395/9/8/429/s1. Table S1: Information on FHB isolates used in this study; Table S2: Shapiro-Wilk test of normality on the phenotypic data before and after transformation; Table S3: Pearson correlation coefficient (r) values observed among Fusarium head blight (FHB) and bacterial leaf streak (BLS) datasets in IWG F1 mapping population A77-3 × C20-7. The symbols ** and * indicate significance at p < 0.01 and p < 0.05, respectively; Table S4: Allelic depth of all filtered SNPs and SNPs in the linkage maps in the IWG F1 population A77-3 × C20-7; Table S5: LD and recombination frequency estimates in the IWG F1 population A77-3 × C20-7; Table S6: Raw BLS and FHB phenotypic data; Figure S1: Distribution of field FHB data observed in the UMN_C3 breeding population in St. Paul, MN during 2017 and 2018. Coefficient of infection of 0 indicates immunity and 1 indicates complete susceptibility; Figure S2: Haplotype blocks showing recombination breakpoints in the linkage maps of the IWG F1 mapping population A77-3 × C20-7. SNP markers are arranged along the X-axis in their respective orders in the linkage maps they belong to; the population is arranged on the Y-axis. Black color indicates missing allele calls; and Figure S3: Reductions in FHB disease levels in (A) 2017 field season and (B) 2018 field season in UMN_C3 population with two or three QTL models. To obtain these estimates, genets containing QTL with the highest R2 values observed in each environment were identified with the exception of Ti_Qfhb.umn-Chr4.1. This QTL was the second largest in FHB17 and was used since both FHB16 and FHB17 shared the largest QTL, Ti_Qfhb.umn-Chr4.1, in both environments. Text accompanied by red bars show the percentage reduction in disease when QTL are combined. Error bars represent the standard deviation of disease distribution.

Author Contributions

J.A.A. and X.Z. conceived the study and designed the experiments. X.Z., M.K.T., P.B., R.D.C., and B.H. carried out the experiments and collected phenotypic data. X.Z. sequenced the population and P.B. did SNP-calling. P.B. analyzed the data and drafted the manuscript. R.D.C., R.D.-M., C.A.I., and J.A.A. provided reagents, materials, pathogen inoculums, and other tools during the experiments. P.B., X.Z., M.K.T., R.D.C., B.H., R.D.-M., C.A.I., and J.A.A. contributed towards the final manuscript. J.A.A. supervised this study.

Funding

This project was supported by the Forever Green Initiative at the University of Minnesota through the Minnesota Department of Agriculture, and the Minnesota Department of Agriculture’s AGRI Crop Research Grant.

Acknowledgments

We thank the University of Minnesota Genomics Center and the University of Minnesota Supercomputing Institute for their sequencing and computational services. We extend our appreciation towards the members of Anderson Lab, Dill-Macky Lab, Dong Lab, and Ishimaru Lab for their technical support in different components of the study.

Conflicts of Interest

The authors declare no conflict of interest.

References

  1. Oerke, E. Crop losses to pests. J. Agric. Sci. 2006, 144, 31–43. [Google Scholar] [CrossRef]
  2. Savary, S.; Ficke, A.; Aubertot, J.-N.; Hollier, C. Crop losses due to diseases and their implications for global food production losses and food security. Food Secur. 2012, 4, 519–537. [Google Scholar] [CrossRef]
  3. Graybosch, R.A.; Peterson, C.J. Genetic improvement in winter wheat yields in the great plains of North America, 1959–2008. Crop Sci. 2010, 50, 1882–1890. [Google Scholar] [CrossRef]
  4. Garrett, K.A.; Andersen, K.F.; Asche, F.; Bowden, R.L.; Forbes, G.A.; Kulakow, P.A.; Zhou, B. Resistance genes in global crop breeding networks. Phytopathology 2017, 107, 1268–1278. [Google Scholar] [CrossRef]
  5. Cox, C.M.; Garrett, K.A.; Bockus, W.W. Meeting the challenge of disease management in perennial grain cropping systems. Renew. Agric. Food Syst. 2005, 20, 15–24. [Google Scholar] [CrossRef] [Green Version]
  6. Tsvelev, N.N. Grasses of the Soviet Union; (Russian Translations Series 8) Hardcover; Springer: Berlin, Germany, 1984. [Google Scholar]
  7. Friebe, B.; Jiang, J.; Raupp, W.J.; McIntosh, R.A.; Gill, B.S. Characterization of wheat-alien translocations conferring resistance to diseases and pests: Current status. Euphytica 1996, 91, 59–87. [Google Scholar] [CrossRef]
  8. Luo, P.-G.; Hu, X.-Y.; Chang, Z.-J.; Zhang, M.; Zhang, H.-Q.; Ren, Z.-L. A new stripe rust resistance gene transferred from Thinopyrum intermedium to hexaploid wheat (Triticum aestivum). Phytoprotection 2009, 90, 57–63. [Google Scholar] [CrossRef]
  9. Li, H.; Wang, X. Thinopyrum ponticum and Th. intermedium: The promising source of resistance to fungal and viral diseases of wheat. J. Genet. Genomics 2009, 36, 557–565. [Google Scholar] [CrossRef]
  10. Del Ponte, E.M.; Valent, B.; Bergstrom, G.C. A special issue on Fusarium head blight and wheat blast. Trop. Plant Pathol. 2017, 42, 143–145. [Google Scholar] [CrossRef] [Green Version]
  11. McMullen, M.; Bergstrom, G.; De Wolf, E.; Dill-Macky, R.; Hershman, D.; Shaner, G.; Van Sanford, D. A Unified effort to fight an enemy of wheat and barley: Fusarium head blight. Plant Dis. 2012, 96, 1712–1728. [Google Scholar] [CrossRef]
  12. Ward, T.J.; Clear, R.M.; Rooney, A.P.; O’Donnell, K.; Gaba, D.; Patrick, S.; Starkey, D.E.; Gilbert, J.; Geiser, D.M.; Nowicki, T.W. An adaptive evolutionary shift in Fusarium head blight pathogen populations is driving the rapid spread of more toxigenic Fusarium graminearum in North America. Fungal Genet. Biol. 2008, 45, 473–484. [Google Scholar] [CrossRef]
  13. Oliver, R.E.; Cai, X.; Xu, S.; Chen, X.; Stack, R.W. Wheat-alien species derivatives. Crop Sci. 2005, 45, 1353–1360. [Google Scholar]
  14. Turner, M.K.; DeHaan, L.R.; Jin, Y.; Anderson, J.A. Wheatgrass–wheat partial amphiploids as a novel source of stem rust and fusarium head blight resistance. Crop Sci. 2013, 53, 1994–2005. [Google Scholar] [CrossRef]
  15. Curland, R.D.; Gao, L.; Bull, C.T.; Vinatzer, B.A.; Dill-Macky, R.; Van Eck, L.; Ishimaru, C.A. Genetic diversity and virulence of wheat and barley strains of Xanthomonas translucens from the Upper Midwestern United States. Phytopathology 2018, 108, 443–453. [Google Scholar] [CrossRef]
  16. Duveiller, E.; van Ginkel, M.; Thijssen, M. Genetic analysis of resistance to bacterial leaf streak caused by Xanthomonas campestris pv. undulosa in bread wheat. Euphytica 1992, 66, 35–43. [Google Scholar] [CrossRef]
  17. Duveiller, E. Bacterial leaf streak or black chaff of cereals. EPPO Bull. 1994, 24, 135–157. [Google Scholar] [CrossRef]
  18. Adhikari, T.B.; Gurung, S.; Hansen, J.M.; Bonman, J.M. Pathogenic and genetic diversity of Xanthomonas translucens pv. undulosa in North Dakota. Phytopathology 2011, 102, 390–402. [Google Scholar] [CrossRef]
  19. Attari, H.E.; Hayes, P.M.; Rebai, A.; Barrault, G.; Dechamp-Guillaume, G.; Sarrafi, A. Potential of doubled-haploid lines and localization of quantitative trait loci (QTL) for partial resistance to bacterial leaf streak (Xanthomonas campestris pv. hordei) in barley. Theor. Appl. Genet. 1998, 96, 95–100. [Google Scholar] [CrossRef]
  20. Adhikari, T.B.; Gurung, S.; Hansen, J.M.; Jackson, E.W.; Bonman, J.M. Association mapping of quantitative trait loci in spring wheat landraces conferring resistance to bacterial leaf streak and spot blotch. Plant Genome 2012, 5, 1–16. [Google Scholar] [CrossRef]
  21. Gurung, S.; Mamidi, S.; Bonman, J.M.; Xiong, M.; Brown-Guedira, G.; Adhikari, T.B. Genome-wide association study reveals novel quantitative trait loci associated with resistance to multiple leaf spot diseases of spring wheat. PLoS ONE 2014, 9, e108179. [Google Scholar] [CrossRef]
  22. Mohan, S.K.; Bijman, V.P.; St. John, L. Bacterial leaf stripe caused by Xanthomonas translucens pv. cerealis on intermediate wheatgrass in Idaho. Plant Dis. 2001, 85, 921. [Google Scholar] [CrossRef]
  23. Rosenthal, J.P.; Dirzo, R. Effects of life history, domestication and agronomic selection on plant defence against insects: Evidence from maizes and wild relatives. Evol. Ecol. 1997, 11, 337–355. [Google Scholar] [CrossRef]
  24. Soltis, N.E.; Atwell, S.; Shi, G.; Fordyce, R.; Gwinner, R.; Gao, D.; Shafi, A.; Kliebenstein, D.J. Crop domestication and pathogen virulence: Interactions of tomato and Botrytis genetic diversity. bioRxiv 2018, 255992. [Google Scholar] [CrossRef] [Green Version]
  25. Wulff, B.B.H.; Moscou, M.J. Strategies for transferring resistance into wheat: From wide crosses to GM cassettes. Front. Plant Sci. 2014, 5, 692. [Google Scholar] [CrossRef]
  26. Ott, J.; Wang, J.; Leal, S.M. Genetic linkage analysis in the age of whole-genome sequencing. Nat. Rev. Genet. 2015, 16, 275–284. [Google Scholar] [CrossRef]
  27. Kantarski, T.; Larson, S.; Zhang, X.; DeHaan, L.; Borevitz, J.; Anderson, J.; Poland, J. Development of the first consensus genetic map of intermediate wheatgrass (Thinopyrum intermedium) using genotyping-by-sequencing. Theor. Appl. Genet. 2017, 130, 137–150. [Google Scholar] [CrossRef]
  28. Thinopyrum intermedium Genome Sequencing Consortium Thinopyrum intermedium, v2.1, DOE-JGI. Available online: http://phytozome.jgi.doe.gov/ (accessed on 15 May 2018).
  29. Bajgain, P.; Zhang, X.; Anderson, J.A. Genome-wide association study of yield component traits in intermediate wheatgrass and implications in genomic selection and breeding. G3 Genes Genomes Genet. 2019. [Google Scholar] [CrossRef]
  30. Zhang, X.; Sallam, A.; Gao, L.; Kantarski, T.; Poland, J.; DeHaan, L.R.; Wyse, D.L.; Anderson, J.A. Establishment and optimization of genomic selection to accelerate the domestication and improvement of intermediate wheatgrass. Plant Genome 2016, 9, 1–18. [Google Scholar] [CrossRef]
  31. Zhang, X.; Larson, S.R.; Gao, L.; Teh, S.L.; DeHaan, L.R.; Fraser, M.; Sallam, A.; Kantarski, T.; Frels, K.; Poland, J.; et al. Uncovering the genetic architecture of seed weight and size in intermediate wheatgrass through linkage and association mapping. Plant Genome 2017, 10, 1–15. [Google Scholar] [CrossRef]
  32. Poland, J.A.; Brown, P.J.; Sorrells, M.E.; Jannink, J.-L. Development of high-density genetic maps for barley and wheat using a novel two-enzyme genotyping-by-sequencing approach. PLoS ONE 2012, 7, e32253. [Google Scholar] [CrossRef]
  33. Li, H.; Durbin, R. Fast and accurate short read alignment with Burrows–Wheeler transform. Bioinformatics 2009, 25, 1754–1760. [Google Scholar] [CrossRef]
  34. Li, H. A statistical framework for SNP calling, mutation discovery, association mapping and population genetical parameter estimation from sequencing data. Bioinformatics 2011, 27, 2987–2993. [Google Scholar] [CrossRef] [Green Version]
  35. Van Ooijen, J.W. JoinMap 4; Software for the Calculation of Genetic Linkage Maps in Experimental Populations; Kyazma BV: Wageningen, The Netherlands, 2006. [Google Scholar]
  36. Hill, W.G.; Weir, B.S. Variances and covariances of squared linkage disequilibria in finite populations. Theor. Popul. Biol. 1988, 33, 54–78. [Google Scholar] [CrossRef]
  37. R Core Team. R. A Language and Environment for Statistical Computing; R Foundation for Statistical Computing: Vienna, Austria, 2018. [Google Scholar]
  38. Ferdosi, M.H.; Kinghorn, B.P.; van der Werf, J.H.; Lee, S.H.; Gondro, C. hsphase: An R package for pedigree reconstruction, detection of recombination events, phasing and imputation of half-sib family groups. BMC Bioinform. 2014, 15, 172. [Google Scholar] [CrossRef]
  39. Van Ooijen, J.W. MapQTL 6; Software for the Mapping of Quantitative Trait Loci in Experimental Populations of Diploid Species; Kyazma BV: Wageningen, The Netherlands, 2009. [Google Scholar]
  40. Sands, O.; Mizrak, G.; Hall, V.; Kim, H.; Bockelman, H.; Golden, M. Seed transmitted bacterial diseases of cereals: Epidemiology and control. Arab J. Plant Prot. 1986, 4, 125–127. [Google Scholar]
  41. Gautam, P.; Dill-Macky, R. Type I host resistance and trichothecene accumulation in Fusarium-infected wheat heads. Am. J. Agric. Biol. Sci. 2011, 6, 231–241. [Google Scholar] [CrossRef]
  42. Zadoks, J.C.; Chang, T.T.; Konzak, C.F. A decimal code for the growth stages of cereals. Weed Res. 1974, 14, 415–421. [Google Scholar] [CrossRef]
  43. Makandar, R.; Essig, J.S.; Schapaugh, M.A.; Trick, H.N.; Shah, J. Genetically engineered resistance to fusarium head blight in wheat by expression of Arabidopsis NPR1. Mol. Plant Microbe Interact. 2006, 19, 123–129. [Google Scholar] [CrossRef]
  44. Sallam, A.H.; Endelman, J.B.; Jannink, J.-L.; Smith, K.P. Assessing genomic selection prediction accuracy in a dynamic barley breeding population. Plant Genome 2015, 8, 1–15. [Google Scholar] [CrossRef]
  45. Endelman, J.B. Ridge regression and other kernels for genomic selection with R package rrBLUP. Plant Genome 2011, 4, 250–255. [Google Scholar] [CrossRef]
  46. McIntosh, R.; Yamazaki, Y.; Devos, K.; Dubcovsky, J.; Rogers, W.; Appels, R. Catalogue of gene symbols for wheat. In Proceedings of the 10th International Wheat Genetics Symposium, Istituto Sperimentale per la Cerealicoltura, Rome, Italy, 1–3 September 2003; pp. 1–34. [Google Scholar]
  47. Brettell, R.I.S.; Banks, P.M.; Cauderon, Y.; Chen, X.; Cheng, Z.M.; Larkin, P.J.; Waterhouse, P.M. A single wheatgrass chromosome reduces the concentration of barley yellow dwarf virus in wheat. Ann. Appl. Biol. 1988, 113, 599–603. [Google Scholar] [CrossRef]
  48. Anderson, J.M.; Bucholtz, D.L.; Greene, A.E.; Francki, M.G.; Gray, S.M.; Sharma, H.; Ohm, H.W.; Perry, K.L. Characterization of wheatgrass-derived barley yellow dwarf virus resistance in a wheat alien chromosome substitution line. Phytopathology 1998, 88, 851–855. [Google Scholar] [CrossRef]
  49. Dyck, P.L.; Friebe, B. Evaluation of leaf rust resistance from wheat chromosomal translocation lines. Crop Sci. 1993, 33, 687–690. [Google Scholar] [CrossRef]
  50. Friebe, B.; Jiang, J.; Gill, B.S.; Dyck, P.L. Radiation-induced nonhomoeologous wheat-Agropyron intermedium chromosomal translocations conferring resistance to leaf rust. Theor. Appl. Genet. 1993, 86, 141–149. [Google Scholar] [CrossRef]
  51. Khan, I.A. Molecular and agronomic characterization of wheat-Agropyron intermedium recombinant chromosomes. Plant Breed. 2000, 119, 25–29. [Google Scholar] [CrossRef]
  52. Kang, H.-Y.; Tang, L.; Li, D.-Y.; Diao, C.-D.; Zhu, W.; Tang, Y.; Wang, Y.; Fan, X.; Xu, L.-L.; Zeng, J.; et al. Cytogenetic study and stripe rust response of the derivatives from a wheat—Thinopyrum intermediumPsathyrostachys huashanica trigeneric hybrid. Genome 2016, 60, 393–401. [Google Scholar] [CrossRef]
  53. Wen, A.; Jayawardana, M.; Fiedler, J.; Sapkota, S.; Shi, G.; Peng, Z.; Liu, S.; White, F.F.; Bogdanove, A.J.; Li, X.; et al. Genetic mapping of a major gene in triticale conferring resistance to bacterial leaf streak. Theor. Appl. Genet. 2018, 131, 649–658. [Google Scholar] [CrossRef]
  54. Buerstmayr, H.; Ban, T.; Anderson, J.A. QTL mapping and marker-assisted selection for Fusarium head blight resistance in wheat: A review. Plant Breed. 2009, 128, 1–26. [Google Scholar] [CrossRef]
  55. Dweba, C.C.; Figlan, S.; Shimelis, H.A.; Motaung, T.E.; Sydenham, S.; Mwadzingeni, L.; Tsilo, T.J. Fusarium head blight of wheat: Pathogenesis and control strategies. Crop Prot. 2017, 91, 114–122. [Google Scholar] [CrossRef]
  56. Miedaner, T.; Würschum, T.; Maurer, H.P.; Korzun, V.; Ebmeyer, E.; Reif, J.C. Association mapping for Fusarium head blight resistance in European soft winter wheat. Mol. Breed. 2011, 28, 647–655. [Google Scholar] [CrossRef]
  57. Arruda, M.P.; Brown, P.; Brown-Guedira, G.; Krill, A.M.; Thurber, C.; Merrill, K.R.; Foresman, B.J.; Kolb, F.L. Genome-wide association mapping of fusarium head blight resistance in wheat using genotyping-by-sequencing. Plant Genome 2016, 9, 1–14. [Google Scholar] [CrossRef]
  58. Wang, R.; Chen, J.; Anderson, J.A.; Zhang, J.; Zhao, W.; Wheeler, J.; Klassen, N.; See, D.R.; Dong, Y. Genome-wide association mapping of fusarium head blight resistance in spring wheat lines developed in the Pacific Northwest and CIMMYT. Phytopathology 2017, 107, 1486–1495. [Google Scholar] [CrossRef]
  59. Hao, C.; Wang, Y.; Hou, J.; Feuillet, C.; Balfourier, F.; Zhang, X. Association mapping and haplotype analysis of a 3.1-mb genomic region involved in Fusarium head blight resistance on wheat chromosome 3BS. PLoS ONE 2012, 7, e46444. [Google Scholar] [CrossRef]
  60. Gaut, B.S.; Long, A.D. The lowdown on linkage disequilibrium. Plant Cell 2003, 15, 1502. [Google Scholar] [CrossRef]
  61. Meuwissen, T.H.E.; Goddard, M.E. Mapping multiple QTL using linkage disequilibrium and linkage analysis information and multitrait data. Genet. Sel. Evol. GSE 2004, 36, 261–279. [Google Scholar] [CrossRef]
  62. Bonnett, D.G.; Rebetzke, G.J.; Spielmeyer, W. Strategies for efficient implementation of molecular markers in wheat breeding. Mol. Breed. 2005, 15, 75–85. [Google Scholar] [CrossRef]
  63. Joshi, R.K.; Nayak, S. Gene pyramiding-A broad spectrum technique for developing durable stress resistance in crops. Biotechnol. Mol. Biol. Rev. 2010, 3, 51–60. [Google Scholar]
Figure 1. Reaction of the intermediate wheatgrass (IWG) parents A77-3 and C20-7, and F1 mapping population to (A) bacterial leaf streak (BLS) and (B) Fusarium head blight (FHB).
Agronomy 09 00429 g001
Figure 2. Distribution of phenotypic data observed in the A77-3 × C20-7 IWG F1 mapping population and their log-transformations: (A) Fusarium head blight (FHB), and (B) bacterial leaf streak (BLS) in 2016, 2017, and 2018. “r1” is the Pearson’s correlation value between the disease phenotypic data and log-transformed data, and “r2” is the correlation between log-transformed data and data adjusted in SAS for trial differences. The Shapiro-Wilk test statistic between the phenotypic data and log-transformed data is indicated by “W”. Data points of the parents A77-3 and C20-7 are shown with a solid line and dashed line, respectively.
Agronomy 09 00429 g002
Figure 3. Pairwise linkage disequilibrium (r2) and recombination frequencies among SNP markers in each chromosome in the IWG F1 mapping population A77-3 × C20-7. X-axis shows the pairwise SNP distances in centiMorgans (cM), Y-axis shows the r2 values, and the legend shows distribution of recombination frequency values. Correlation coefficient between r2 and recombination frequency, r, is shown on the top right of each plot. Blue text shows the decay distance when r2 = 0.2.
Agronomy 09 00429 g003
Figure 4. Distribution of discovered quantitative trait loci (QTL) on linkage groups representing IWG chromosomes; only the chromosomes with QTL detected are displayed. Ruler on the left shows the map length in centiMorgans (cM). Horizontal bars indicate SNP markers.
Agronomy 09 00429 g004
Figure 5. Reductions in (A) FHB and (B) BLS disease levels in A77-3 × C20-7 F1 genets containing two or three QTL models. For each disease, genets containing QTL with the highest R2 values observed in each environment were identified, with the exception of Ti_Qfhb.umn-Chr4.1. This QTL was the second largest in FHB17 and was used since both FHB16 and FHB17 shared the largest QTL, Ti_Qfhb.umn-Chr4.1, in both environments. Red bars and accompanying text show the percentage reduction in disease when QTL are combined. Error bars represent the standard deviation of disease distribution.
Agronomy 09 00429 g005
Figure 6. Predictive ability of Fusarium head blight (FHB) estimated by the ridge regression model in rrBLUP. SNP markers associated with FHB resistance in this study were used as fixed effects in the model to predict trait data collected in St. Paul, MN in 2017 (StP-FHB17) and 2018 (StP-FHB18). Each boxplot represents 1000 data points, i.e., correlations between the predicted trait value and actual trait value observed in the field obtained from 1000 independent runs.
Agronomy 09 00429 g006
Table 1. Distribution of phenotypic data collected during 2016–2018 for Fusarium head blight (FHB) and bacterial leaf streak (BLS) in A77-3 × C20-7 IWG F1 mapping population. Disease scale for FHB ranges from 0 to 1, where 0 is resistant and 1 is susceptible. BLS was assessed by recording lesion lengths (cm) as a form of discrete measurement.
DiseaseYearParent Disease Scores (mean ± SD)F1 Population Disease Scores
A77-3C20-7RangeMean ± SD
FHB20160.28 ± 0.000.43 ± 0.180.00–1.000.35 ± 0.27
20170.20 ± 0.090.43 ± 0.160.04–0.700.24 ± 0.13
20180.20 ± 0.140.56 ± 0.100.06–0.900.48 ± 0.19
Mean0.23 ± 0.080.47 ± 0.150.03–0.830.36 ± 0.20
BLS20160.48 ± 0.692.37 ± 0.490.00–5.901.99 ± 1.21
20171.22 ± 0.431.63 ± 0.300.16–3.501.33 ± 0.43
20180.77 ± 0.433.68 ± 0.720.88–6.083.07 ± 1.11
Mean0.82 ± 0.522.56 ± 0.500.35–5.122.13 ± 0.92
Table 2. SNP marker distribution in 21 linkage groups representing the chromosomes of intermediate wheatgrass (IWG). Marker order consistency is shown by correlation values (r) between the linkage maps and physical distances (bp). Negative value indicates a flipped orientation of the linkage map relative to the physical chromosome.
ChromosomeNo. of SNPsLength (cM)Average Inter-SNP Distance (cM)Correlation with Physical Distance
1352207.80.590.59
2224134.20.600.74
3164141.30.870.73
4270168.10.620.77
57391.51.27−0.47
6286159.60.560.76
7233180.60.790.91
8263170.00.650.88
994137.71.480.69
10163109.20.67−0.83
1123097.30.420.80
1217299.20.580.73
13378224.10.590.77
14193169.50.880.77
15237153.30.650.79
16198141.80.720.83
17179218.41.230.69
18201251.61.260.83
19258155.30.600.78
20200233.81.17−0.72
21254194.60.770.75
Sum46223438.9--
Average220163.80.810.75
Table 3. Quantitative trait loci (QTL) for Fusarium head blight and bacterial leaf streak detected in the A77-3 × C20-7 IWG population.
TraitQTL NamePeak SNP MarkerChrPos (cM)LODR2 (%)Contributing Parent
FHB16Ti_Qfhb.umn-Chr4.2S04_93002901464.833.904.3C20-7
Ti_Qfhb.umn-Chr7S07_145440056754.144.9511.9A77-3
Ti_Qfhb.umn-Chr9S09_325459398973.437.6911.3A77-3
Ti_Qfhb.umn-Chr12.1S12_2247453681217.036.5410.4A77-3
Ti_Qfhb.umn-Chr12.2S12_2977029371235.848.7412.0A77-3
Ti_Qfhb.umn-Chr14.1S14_15675681425.648.4610.1C20-7
Ti_Qfhb.umn-Chr18S18_4728248401811.417.5710.8A77-3
Ti_Qfhb.umn-Chr21.2S21_3256499292191.584.199.1A77-3
FHB17Ti_Qfhb.umn-Chr3.1S03_57465451316.313.638.1C20-7
Ti_Qfhb.umn-Chr4.1S04_44702081425.168.7915.3A77-3
Ti_Qfhb.umn-Chr7S07_145440056754.145.7311.0A77-3
Ti_Qfhb.umn-Chr12.1S12_2247453681217.036.8011.4A77-3
Ti_Qfhb.umn-Chr12.2S12_2977029371235.8410.3617.6A77-3
Ti_Qfhb.umn-Chr13S13_25777964613207.453.733.1C20-7
Ti_Qfhb.umn-Chr14.2S14_2820027811462.273.154.8C20-7
FHB18Ti_Qfhb.umn-Chr10S10_326748651091.403.235.3C20-7
Ti_Qfhb.umn-Chr12.3S12_3351310531246.836.9315.3A77-3
Ti_Qfhb.umn-Chr18S18_4728248401811.4111.8115.6A77-3
Ti_Qfhb.umn-Chr21.1S21_731219942131.773.195.1A77-3
BLS16Ti_Qbls.umn-Chr1.2S01_3714129741192.784.6010.5A77-3
Ti_Qbls.umn-Chr3.2S03_146509486368.564.4710.0A77-3
Ti_Qbls.umn-Chr4.1S04_44702081425.555.8111.3A77-3
Ti_Qbls.umn-Chr4.2S04_93002901464.833.666.8C20-7
Ti_Qbls.umn-Chr4.2S04_158111261493.693.1210.2C20-7
Ti_Qbls.umn-Chr15S15_7315582915103.016.6910.8A77-3
BLS17Ti_Qbls.umn-Chr1.1S01_5019733441132.183.393.7C20-7
Ti_Qbls.umn-Chr8S08_3878460088132.013.533.2C20-7
Ti_Qbls.umn-Chr12.3S12_3351310531246.837.7511.6A77-3
Ti_Qbls.umn-Chr14.1S14_15675681425.649.2312.9A77-3
Ti_Qbls.umn-Chr21.2S21_3256499292191.583.797.3A77-3
BLS18Ti_Qbls.umn-Chr3.2S03_146509486368.564.7711.6A77-3
Ti_Qbls.umn-Chr20S20_201616698209.663.325.6C20-7

