Article

Establishment and Characterization of Callus and Cell Suspension Cultures of Selected Sorghum bicolor (L.) Moench Varieties: A Resource for Gene Discovery in Plant Stress Biology

1
Plant Biotechnology Research Group, Department of Plant Sciences, University of the Free State, Qwaqwa Campus, Phuthadithjaba 9866, South Africa
2
Germplasm Development, Agricultural Research Council-Small Grain Institute, Bethlehem 9700, South Africa
3
Department of Zoology and Entomology, University of the Free State, Qwaqwa Campus, Phuthadithjaba 9866, South Africa
4
Department of Biosciences, Durham University, South Road, Durham DH1 3LE, UK
*
Author to whom correspondence should be addressed.
Agronomy 2019, 9(5), 218; https://doi.org/10.3390/agronomy9050218
Submission received: 26 March 2019 / Revised: 14 April 2019 / Accepted: 15 April 2019 / Published: 30 April 2019

Abstract

:
Sorghum, a naturally drought tolerant crop, is genetically diverse and provides a wide gene pool for exploitation in crop breeding. In this study, we experimentally assessed friable callus induction rates of seven sorghum varieties using shoot explant for the generation of cell suspension cultures. The cell suspensions were characterized in terms of cell growth and viability profiles as well as gene expression following 400 mM sorbitol-induced osmotic stress for 72 h. Only ICSB 338, a drought susceptible variety, was readily amenable to friable callus formation. Cell culture growth plots of both ICSB 338 and White sorghum (used as a reference line) depicted typical sigmoidal curves. Interestingly, Evans blue assay showed that ICSB 338 cell cultures are more susceptible to osmotic stress than the White sorghum cells. The osmotic stress treatment also triggered differential expression of eight target genes between the two cell culture lines. Overall, these results suggest that the genetic diversity of sorghum germplasm influences friable callus induction rates and molecular responses to osmotic stress, and could be further exploited in plant stress biology studies. Therefore, we have developed a valuable resource for use in molecular studies of sorghum in response to a range of biotic and abiotic stresses.

1. Introduction

Sorghum (Sorghum bicolor) is the fifth most important cereal crop worldwide after maize (Zea mays), rice (Oryza sativa), wheat (Triticum aestivum), and barley (Hordeum vulgare) [1]. Due to its wide genetic diversity [2,3] and its natural ability to tolerate drought [4,5], sorghum is a good model system in studying osmotic stress responses in cereals. With the current trajectory of global climatic change, which is characterized by an increase in the frequency and duration of drought episodes [6,7], biotechnological initiatives to develop drought stress-tolerant crops are pivotal in attempts to alleviate food insecurity.
Biotechnological studies aimed at understanding a range of fundamental processes in plants require, amongst others, in vitro experimental systems utilizing callus and cell suspension cultures. Therefore, the generation of efficient protocols for the production of these two plant tissue culture systems is invaluable. However, sorghum is considered to be one of the most recalcitrant cereal crops for in vitro experiments [8], possibly due to the accumulation of phenolics, low callus induction frequencies, and a long callus generation period [9]. In another sorghum study, the addition of lipoic acid to callus induction media greatly improved the callus induction frequency of immature embryos for plant regeneration and transformation systems [10]. Callus tissues are masses of undifferentiated thin-walled parenchyma cells that can either be friable or non-friable [11,12,13,14]. Friable callus consists of easily breakable cells and shows no apparent organ regeneration, while non-friable callus consists of densely packed, hard textured cells [12]. Some callus cultures show organ regeneration with root- and shoot-like structures developing on the callus masses [15].
Friable calli are particularly useful for the establishment of cell suspension cultures, which are populations of rapidly growing undifferentiated cells grown in a liquid medium [12,16]. Cell suspension cultures are useful experimental systems due to the high rates of cell multiplication, short life cycle, and their ease of maintenance by sub-culturing into fresh medium [17]. With generations of sub-cultures, single cells slowly break off from cell clusters, resulting in a finely suspended culture whose growth parameters, such as cell multiplication and viability, can be assessed.
In the field of plant biology, cell suspension cultures are useful experimental systems, including for studies on the composition of plant sub-proteomes (both intracellular and extracellular) and differential gene expression in response to both biotic and abiotic stress factors. As such, cell suspension cultures have been used to study plant responses to osmotic stress. In plants, limitations in water availability cause osmotic stress—also referred to as drought, water stress, or dehydration [18]. In cell cultures, osmotic stress can be induced using osmotica such as sorbitol and polyethylene glycol (PEG). Sorbitol has been used to induce osmotic stress in sorghum [19], sweet potato (Ipomoea batatas) [20], and tobacco (Nicotiana tabacum L.) [21] cell cultures. PEG has also been used on cell cultures of Stevia rebaudiana [22], sugarcane (Saccharum officinarum L.) [23], scots pine (Pinus sylvestris L.) [24], and Arabidopsis thaliana [25,26].
This study aimed to establish, maintain, and characterize sorghum callus and cell suspension culture systems from germplasm of known phenotypic traits. The in vitro culture systems developed here will be a vital resource for molecular studies aimed at understanding sorghum responses to a range of biotic and abiotic stress factors. Furthermore, comparative biochemical and molecular (including “omics”) studies using the in vitro culture systems derived from genotypes with distinct phenotypic traits will generate fundamental datasets that could be harnessed in the development of biotechnological solutions to mitigate crop loss to drought stress.

2. Materials and Methods

2.1. Plant Material

Eight sorghum (Sorghum bicolor L. Moench) varieties were used in this study. Seeds of the White sorghum variety, with an unknown drought response phenotype and previously used for callus induction [27], were obtained from Prof Bongani Ndimba, University of Western Cape/Agricultural Research Council (ARC)-Infruitec/Nietvoorbij, South Africa. The other seven varieties, characterized as either drought tolerant (SA 1441), drought resistant (ICSV 210, ICSV 112, ICSV 213), drought susceptible (ICSB 73, ICSB 338) or grain sorghum (Macia), were obtained from Dr Nemera Shargie, ARC-Grain Crops Institute, Potchefstroom, South Africa.

2.2. Seed Surface Sterilisation and Germination

Seeds from each of the eight sorghum varieties were surface sterilized as described previously [28] with minor modifications. The seeds were immersed in 70% (v/v) ethanol for 1 min followed by commercial bleach (3.5% (m/v) sodium hypochlorite) containing 0.1% (v/v) Tween® 20 for 25 min with intermittent shaking. Seeds were rinsed three times with sterile distilled water and air-dried on sterile filter paper for 5 min. Dried seeds were plated onto plastic petri dishes containing sorghum seed germination medium (2.2 g/L Murashige and Skoog basal (MS) medium [29]; 1% (w/v) sucrose; 5 mM 2-(N-Morpholino) ethanesulfonic acid (MES); pH 5.8, adjusted with 2M KOH; 0.8% (w/v) bacteriological agar) using sterile forceps. Seeds were left to germinate under dark conditions in a growth chamber at 25 °C for 4 days.

2.3. Initiation and Maintenance of Callus and Cell Suspension Cultures

Shoots from 4-day old sorghum seedlings were cut into 5 mm sections and used as explants for callus induction on sorghum callus initiation medium [4.4 g/L Murashige and Skoog Basal Salt with Minimal Organics (MSMO) medium [29]; 3% (w/v) sucrose; pH 5.8, adjusted with 1 M NaOH; 0.8% (w/v) bacteriological agar] as previously described [27]. Media were supplemented with plant growth hormones (PGHs) naphthaleneacetic acid (NAA) and 2,4-dichlorophenoxyacetic acid (2,4-D) as follows: (A) represents control medium without any PGH; (B) Medium supplemented with 3 mg/L of 2,4-D; (C) Medium supplemented with 4 mg/L of 2,4-D; (D) Medium supplemented with 2.5 mg/L of NAA; (E) Medium supplemented 3 mg/L of 2,4-D and 2.5 mg/L of NAA and; (F) Medium supplemented with 4 mg/L of 2,4-D and 2.5 mg/L of NAA. Calli were induced over a 4–5 week period under continuous dark conditions in a growth chamber at 25 °C. Callus induction rates of each sorghum variety per callus induction medium were estimated.
Only soft easily breakable (friable) calli were maintained in culture by sub-culturing 4–5 week-old callus (broken into small pea sized pieces of about 0.5 g fresh weight each) onto fresh sorghum callus induction medium. Light microscopic analyses of four-week old friable calli were carried out to evaluate their cell morphologies at the Laboratory for Microscopy, University of the Free State, Bloemfontein, South Africa. Friable calli were used to initiate cell suspension cultures. Three large clumps of actively growing 4–5-week-old friable calli (approximately 10 g total fresh weight) were broken into small pieces and placed in a 250 mL Erlenmeyer flask containing 50 mL of sorghum cell suspension culture medium [4.4 g/L MSMO [29], supplemented with 3% (w/v) sucrose, 3 mg/L 2,4-D, 2.5 mg/L NAA, pH 5.8]. The flasks were placed under dark conditions at 27 °C on an orbital incubator shaker with agitation at 130 rpm. After 4 days, the cell culture medium was topped up to a total volume of 100 mL with fresh medium and further incubated until cultures reached the desired cell density. This was done for three independent biological replicates per cell culture. To maintain the cell suspensions in culture, cells were sub-cultured every 10–12 days by transferring 30 mL of culture to a 250 mL flask containing 70 mL of fresh sorghum cell suspension culture medium.

2.4. Characterisation of Cell Suspension Cultures

The growth curve of the suspension cultures was monitored using the settled cell volume (SCV) method as previously described [30]. SCV readings were taken at two-day intervals (same time each day) starting from the day of sub-culture until the suspension cultures of three independently established cell cultures were too dense for consistent and reproducible sampling. The viability of three independently established cell suspension cultures was estimated using the 3-(4,5-dimethylthiazolyl-2)-2,5-diphenyltetrazolium bromide (MTT) assay as described [28]. Sampling started from the day of sub-culture until the day cells reached the stationary growth phase. Sampling was repeated for each biological replicate cell culture to give two technical replicates.

2.5. Osmotic Stress Treatment

Cell suspension cultures of both ICSB 338 and White sorghum were sub-cultured as described above. On day 8 post sub-culture (corresponding with the mid-log phase on the growth curve), each cell culture was sub-divided into two 50 mL cultures each for control and osmotic-stress treatment. This was done for three biological replicate cultures. Osmotic stressed cells were treated with 4 mL of a 5 M sorbitol stock solution, making the final concentration of 400 mM sorbitol. The same volume of autoclaved distilled water was added to all the control cultures. Immediately after treatment, the cultures were gently mixed by swirling the flasks and cells were sampled for the estimation of cell viability assays using the MTT and Evans blue assays at 0 (immediately after treatment), 24, 48, and 72 h. Sorbitol treated cell suspension cultures of ICSB 338 and White sorghum were harvested at time 0, 6, 24, 48, and 72 h following stress treatment, and immediately flash frozen in liquid nitrogen and stored at −80 °C prior to RNA extraction.

2.6. Viability Assays of Sorghum Cell Cultures

The MTT and Evans Blue assays were conducted as previously described [28]. For the Evans blue assay, minor modifications were made. Briefly, cell cultures were sampled at 0, 24, 48, and 72 h post-treatment. However, the boiled control samples were only taken at the 0 h time point. The cell samples were stained with Evans blue, washed with water, and the internalized stain released by disrupting the cells and evaluating the dye concentration spectrophotometrically at 590 nm. The baseline viability of cells sampled at 0 h was assumed to be 100%. Cell death at each time point was calculated thus: the difference in absorbance between each sample and the 0 h control sample as a percentage of the difference between the boiled sample and 0 h control sample.

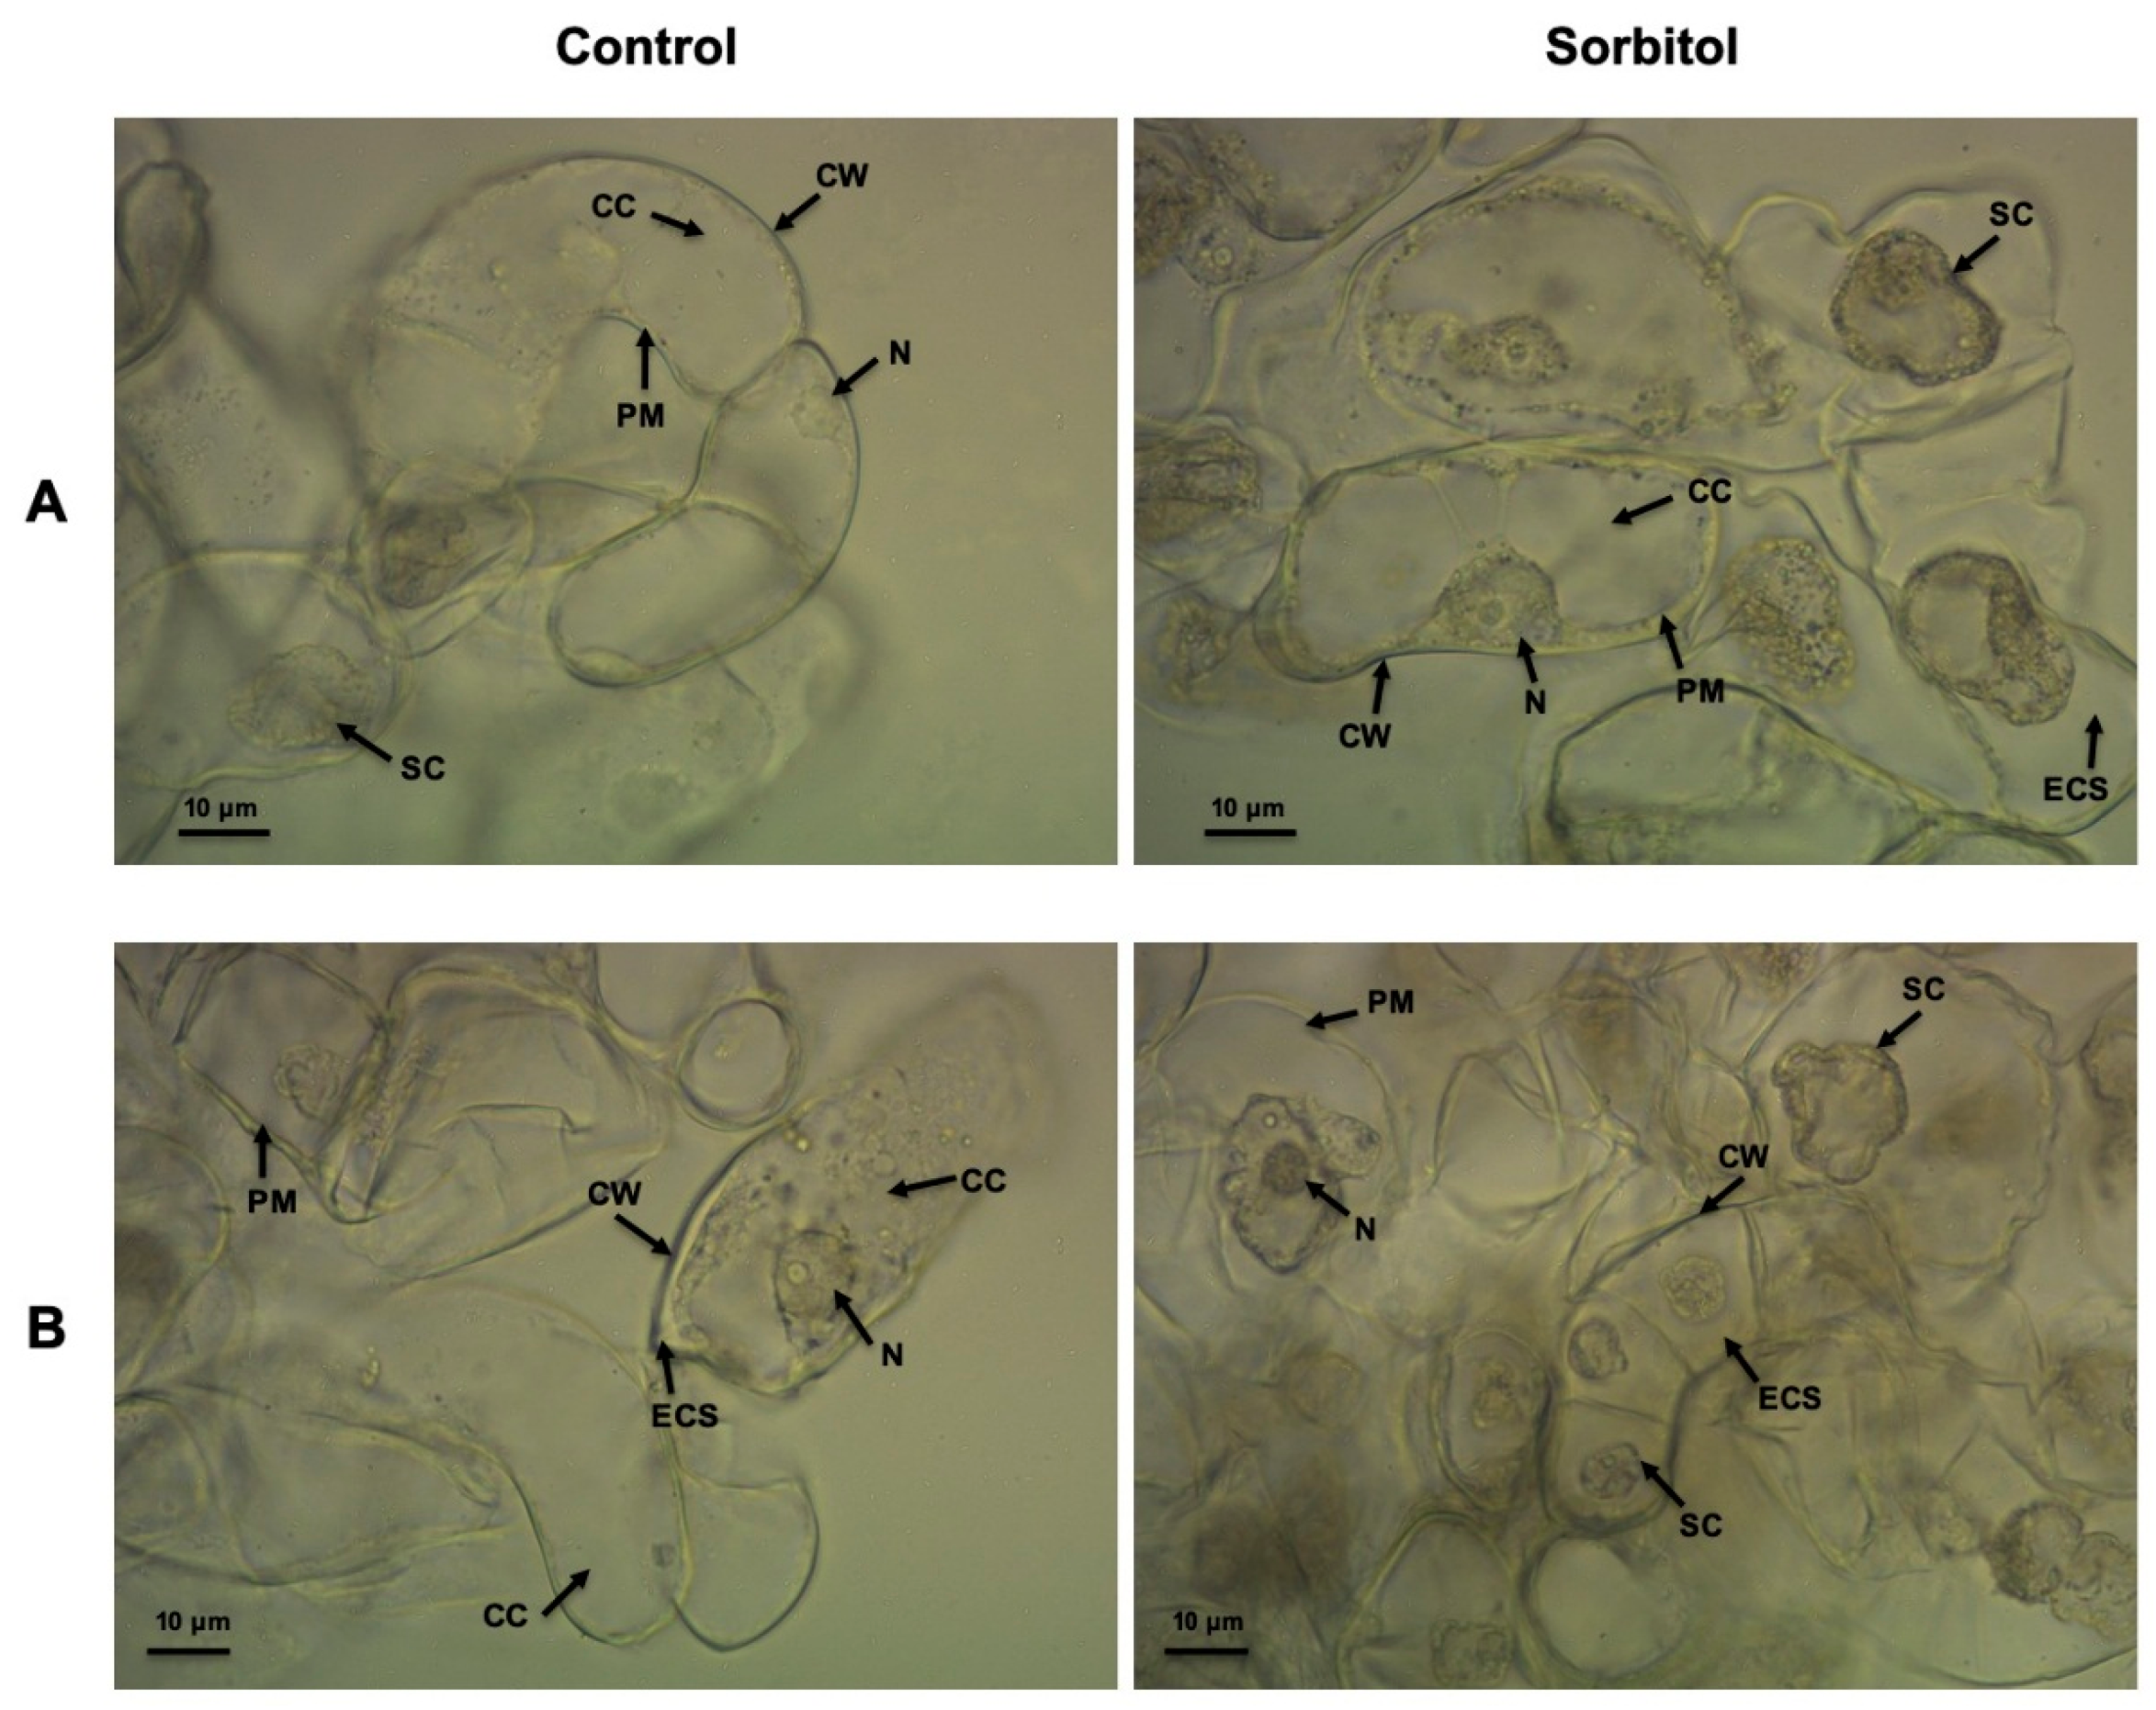
2.7. Light Microscopic Analysis of Osmotic Stressed Cell Cultures

Microscopic analyses of ICSB 338 and White sorghum control and sorbitol-treated cell cultures were carried out using a Nikon Eclipse E200 Light microscope fitted with a DeltaPix Digital camera (Tokyo, Japan) for imaging. Briefly, a drop of the cell culture was placed on a microscope slide and lightly pressed with the cover slip. The cell cultures were then analyzed on the light microscope, with images captured at different magnifications (10 ×   and 40 × ).

2.8. RNA Extraction and Gene Expression Analysis

Total RNA extraction, complementary DNA (cDNA) synthesis and gene expression analysis were carried out as described previously [19], with minor modifications. Briefly, total RNA was extracted from the cell suspension cultures using the Spectrum™ Plant Total RNA kit (Sigma-Aldrich, Dorset, UK) with an on-column DNase digestion step according to the manufacturer’s instructions. The first strand cDNA synthesis was performed on 2 μg total RNA template using the GoScriptTM Reverse Transcription System (Promega, Southampton, UK) according to the manufacturer’s instructions. Quantitative real-time polymerase chain reaction (qRT-PCR) was performed using the SensiFAST™ SYBR® No-ROX kit (Bioline, London, UK) on the Rotar Gene-6000 (Corbett Research, Sydney, Australia). The PCR reaction mixture consisted of 10 µL SensiFAST reagent, 0.4 µM each of the forward and reverse primers, and 5 µL of 30-fold dilution cDNA in a final volume of 20 µL. The qRT-PCR thermal cycling conditions were as follows: denaturation at 95 °C for 3 min followed by 40 cycles of 95 °C for 10 s, annealing at 56 °C for 15 s and extension at 72 °C for 25 s. All PCR reactions were carried out using three biological replicate cDNA templates.
Gene expression analysis of eight selected targets corresponding to proteins previously identified as highly responsive to drought stress in a sorghum isobaric tags for relative and absolute quantification (iTRAQ) experiment (unpublished data) [31] was performed. The genes and their gene products are SORBI_3008G134700 (aspartic peptidase), SORBI_3001G514200 (thioredoxin), SORBI_3003G136200 (germin), SORBI_3006G135500 (galactose oxidase), SORBI_3007G149600 (histone H2B), SORBI_3001G313200 (histone H4), SORBI_3001G073900 (malate dehydrogenase), and SORBI_3003g322400 (ribosomal protein S25). Data analysis was carried out using the REST2009 version 2.0.13 software (Qiagen, Manchester, UK) with sorghum genes Sb03g038910 [32] and Sb04g003390 [33] as constitutive reference controls. Primers were designed using the Primer-BLAST tool [34] and the sequences are listed in Table 1.

2.9. Statistical Analysis

Two-way ANOVA analysis was conducted on callus induction rates at 5% (p < 0.05) level of significance. Student’s t-test analyses were conducted on cell viability assessments using both MTT and Evans blue assays at 5% (p < 0.05) level of significance. All statistical analyses were conducted on GraphPad Prism® 7.0b software (www.graphpad.com).

3. Results

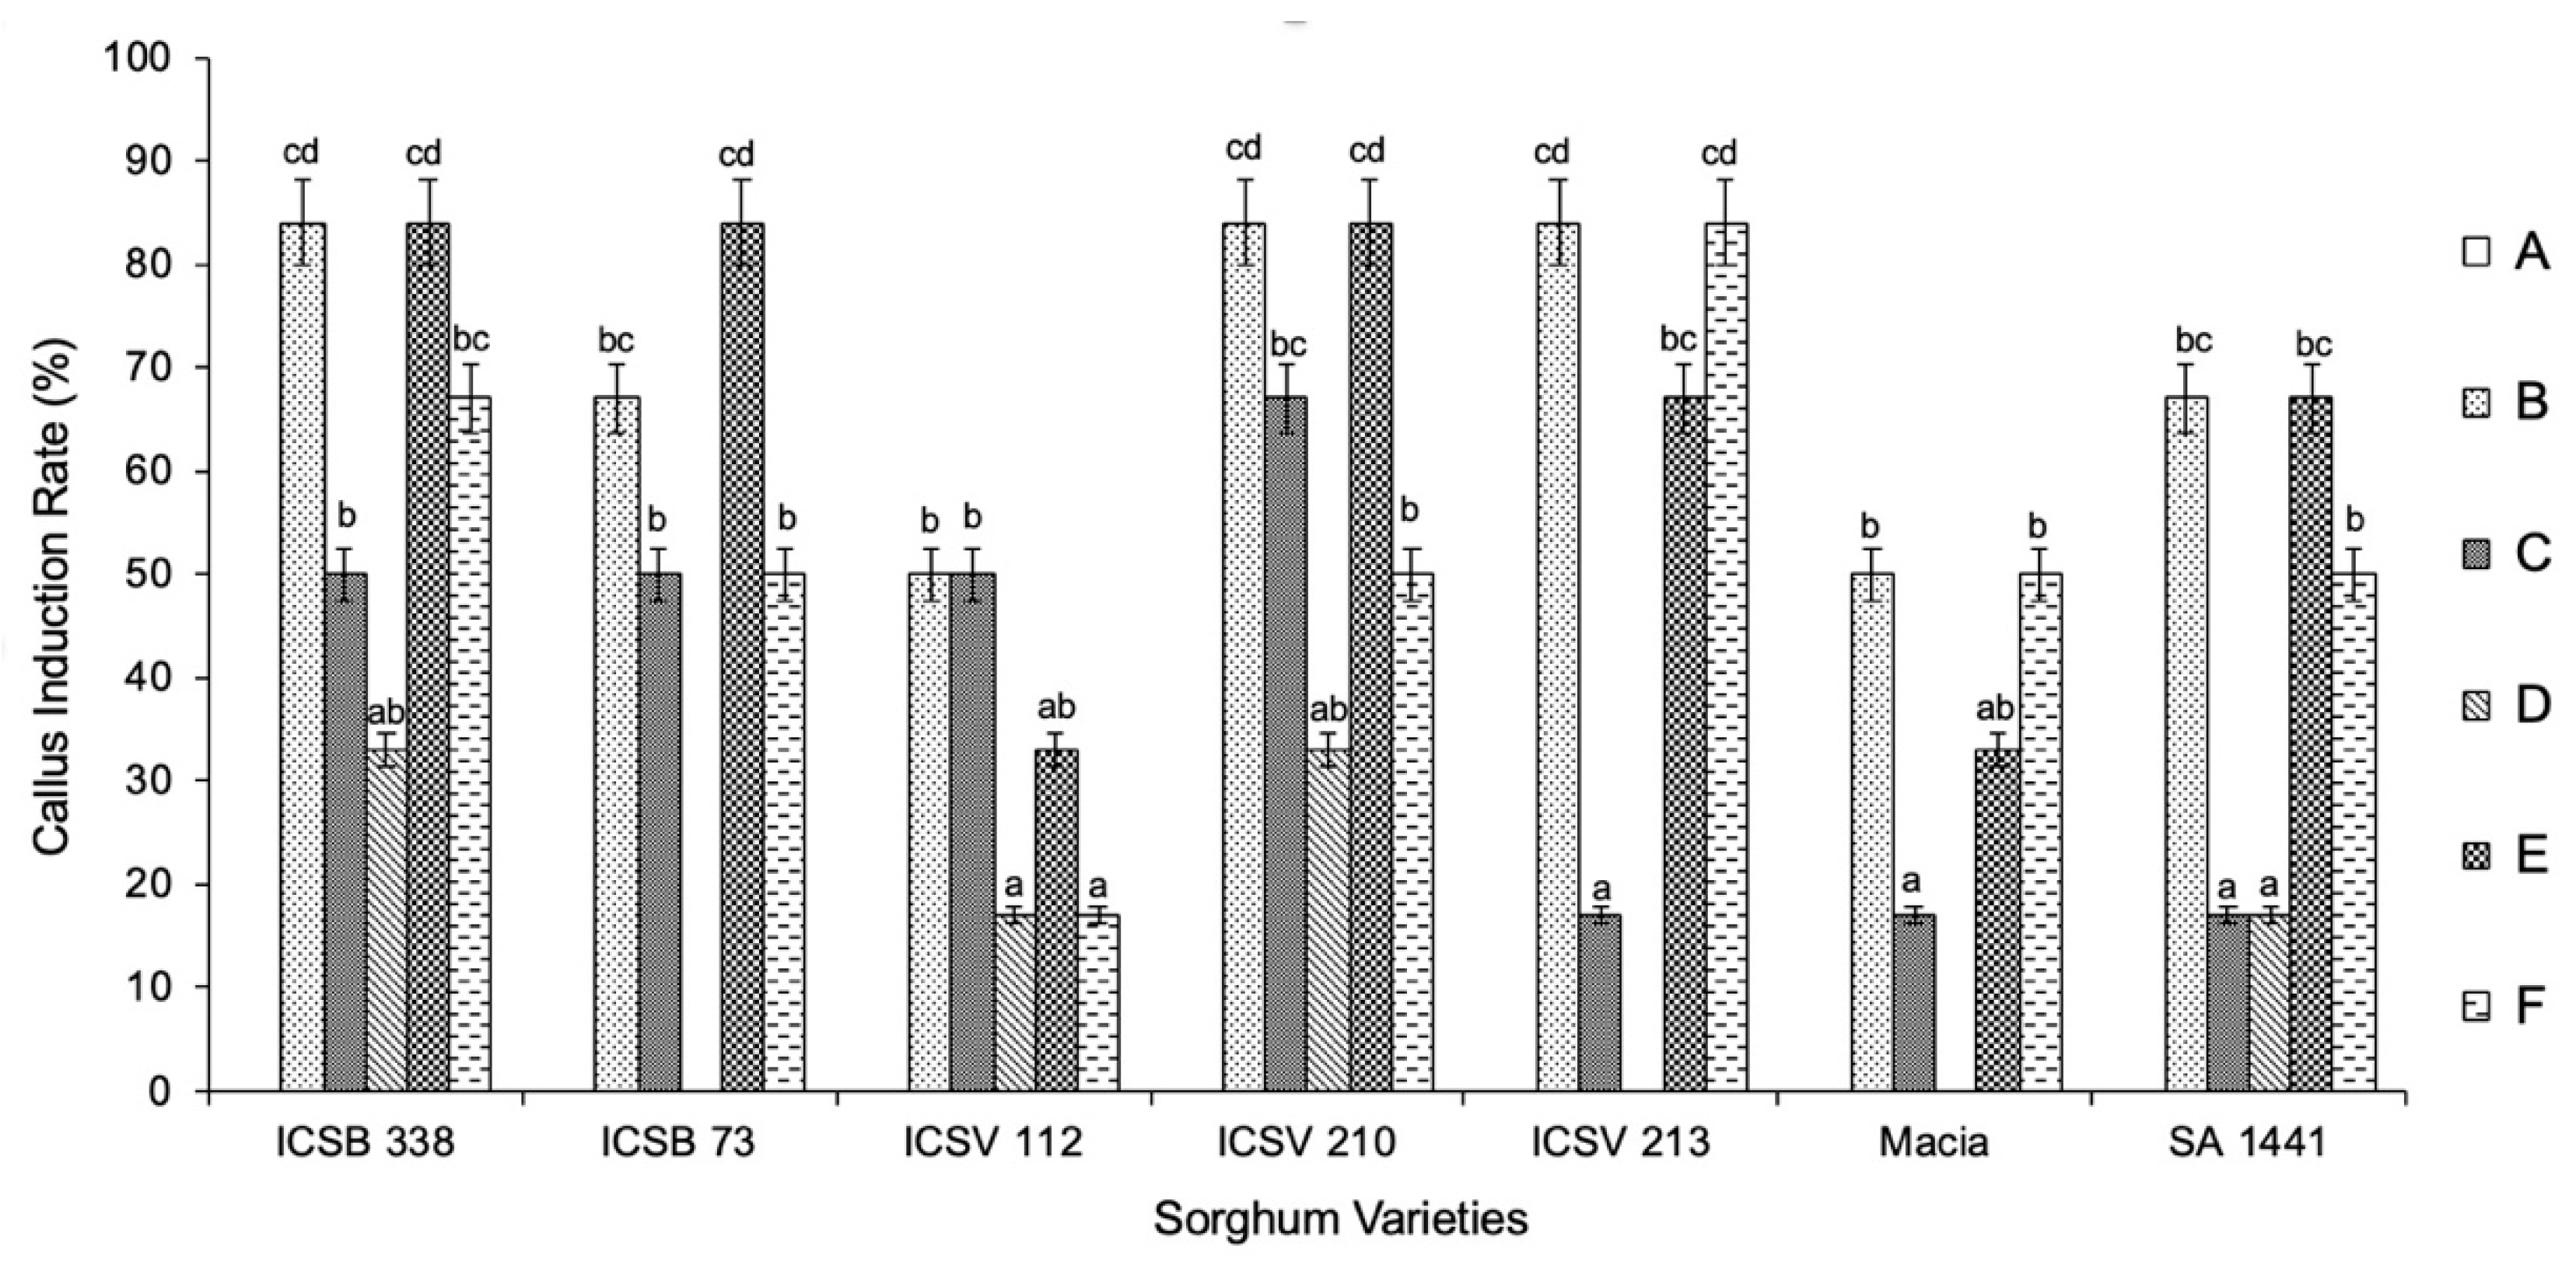
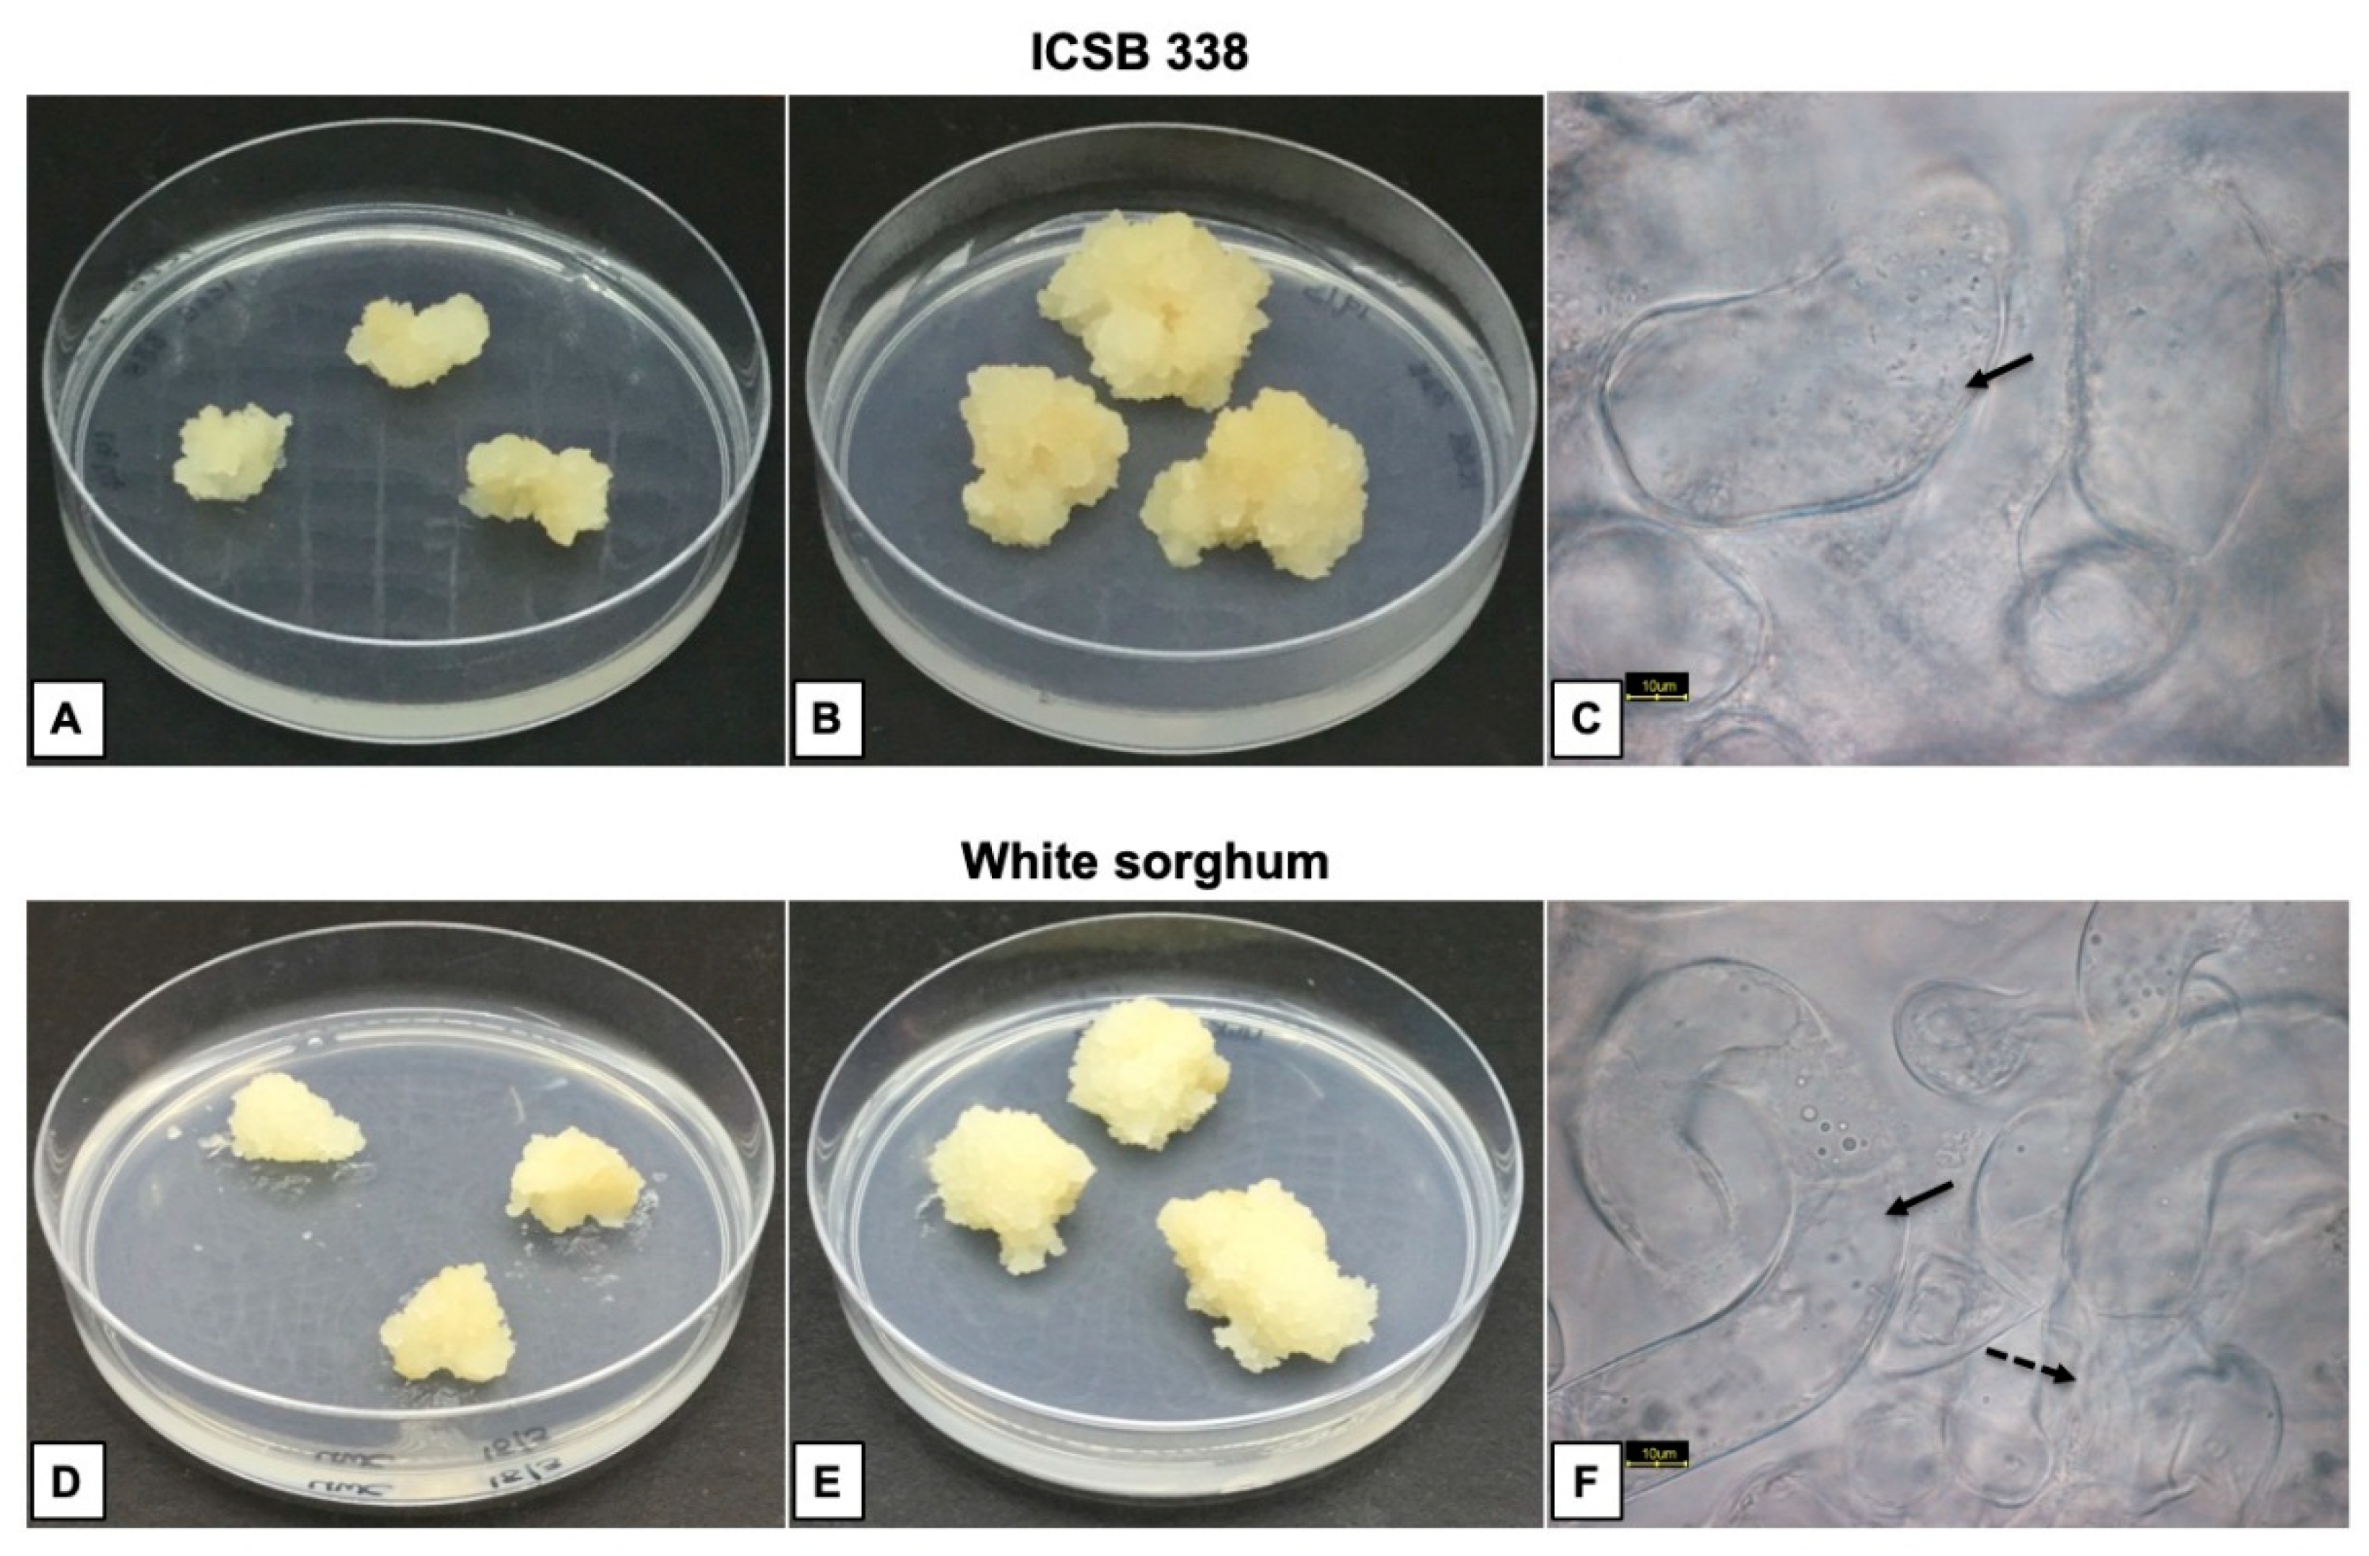
3.1. Callus Induction

Because White sorghum had previously been used in callus production procedures [27], this variety was excluded from callus induction rate calculations in the current study. The calculated callus induction rates in all seven sorghum varieties (SA 1441, ICSV 210, ICSV 213, ICSV 112, ICSB 73, ICSB 338, and Macia) ranged between 0% and 84% across media A–F (Figure 1).
Callus induction results of the seven sorghum varieties on different medium compositions are summarized (Supplementary Table S1). The control medium (medium A) did not induce callus on all varieties while medium B significantly induced callus in most of them (Supplementary Table S1). However, these callus masses were not friable (Supplementary Table S1; Supplementary Figure S1A). During the callus induction period, some SA 1441 shoot explants exuded a brown-purple pigment (Supplementary Figure S1B), whereas after a few generations of sub-culturing ICSV 210 callus masses, root-like callus tissues developed across medium B, C, E, and F (Supplementary Figure S1C). Amongst all the seven sorghum varieties (SA 1441, ICSV 210, ICSV 213, ICSV 112, ICSB 73, ICSB 338, and Macia) used for callus induction in this study, only the drought susceptible ICSB 338 had callus forming on a range of medium types. Medium compositions E and F induced large friable callus masses on ICSB 338. However, due to the larger size of callus from medium E as compared to medium F, medium E was selected for further maintenance of ICSB 338 callus masses for the establishment of cell suspension cultures. The different stages during callus maintenance of ICSB 338 (Figure 2A,B) and White sorghum (Figure 2D,E) are shown. ICSB 338 cells had a globular shape (Figure 2C), while White sorghum callus had elongated rod-like cells (Figure 2F). In order to produce enough callus masses for the establishment of cell suspensions, it took an average of 6 months of continuous maintenance in culture.

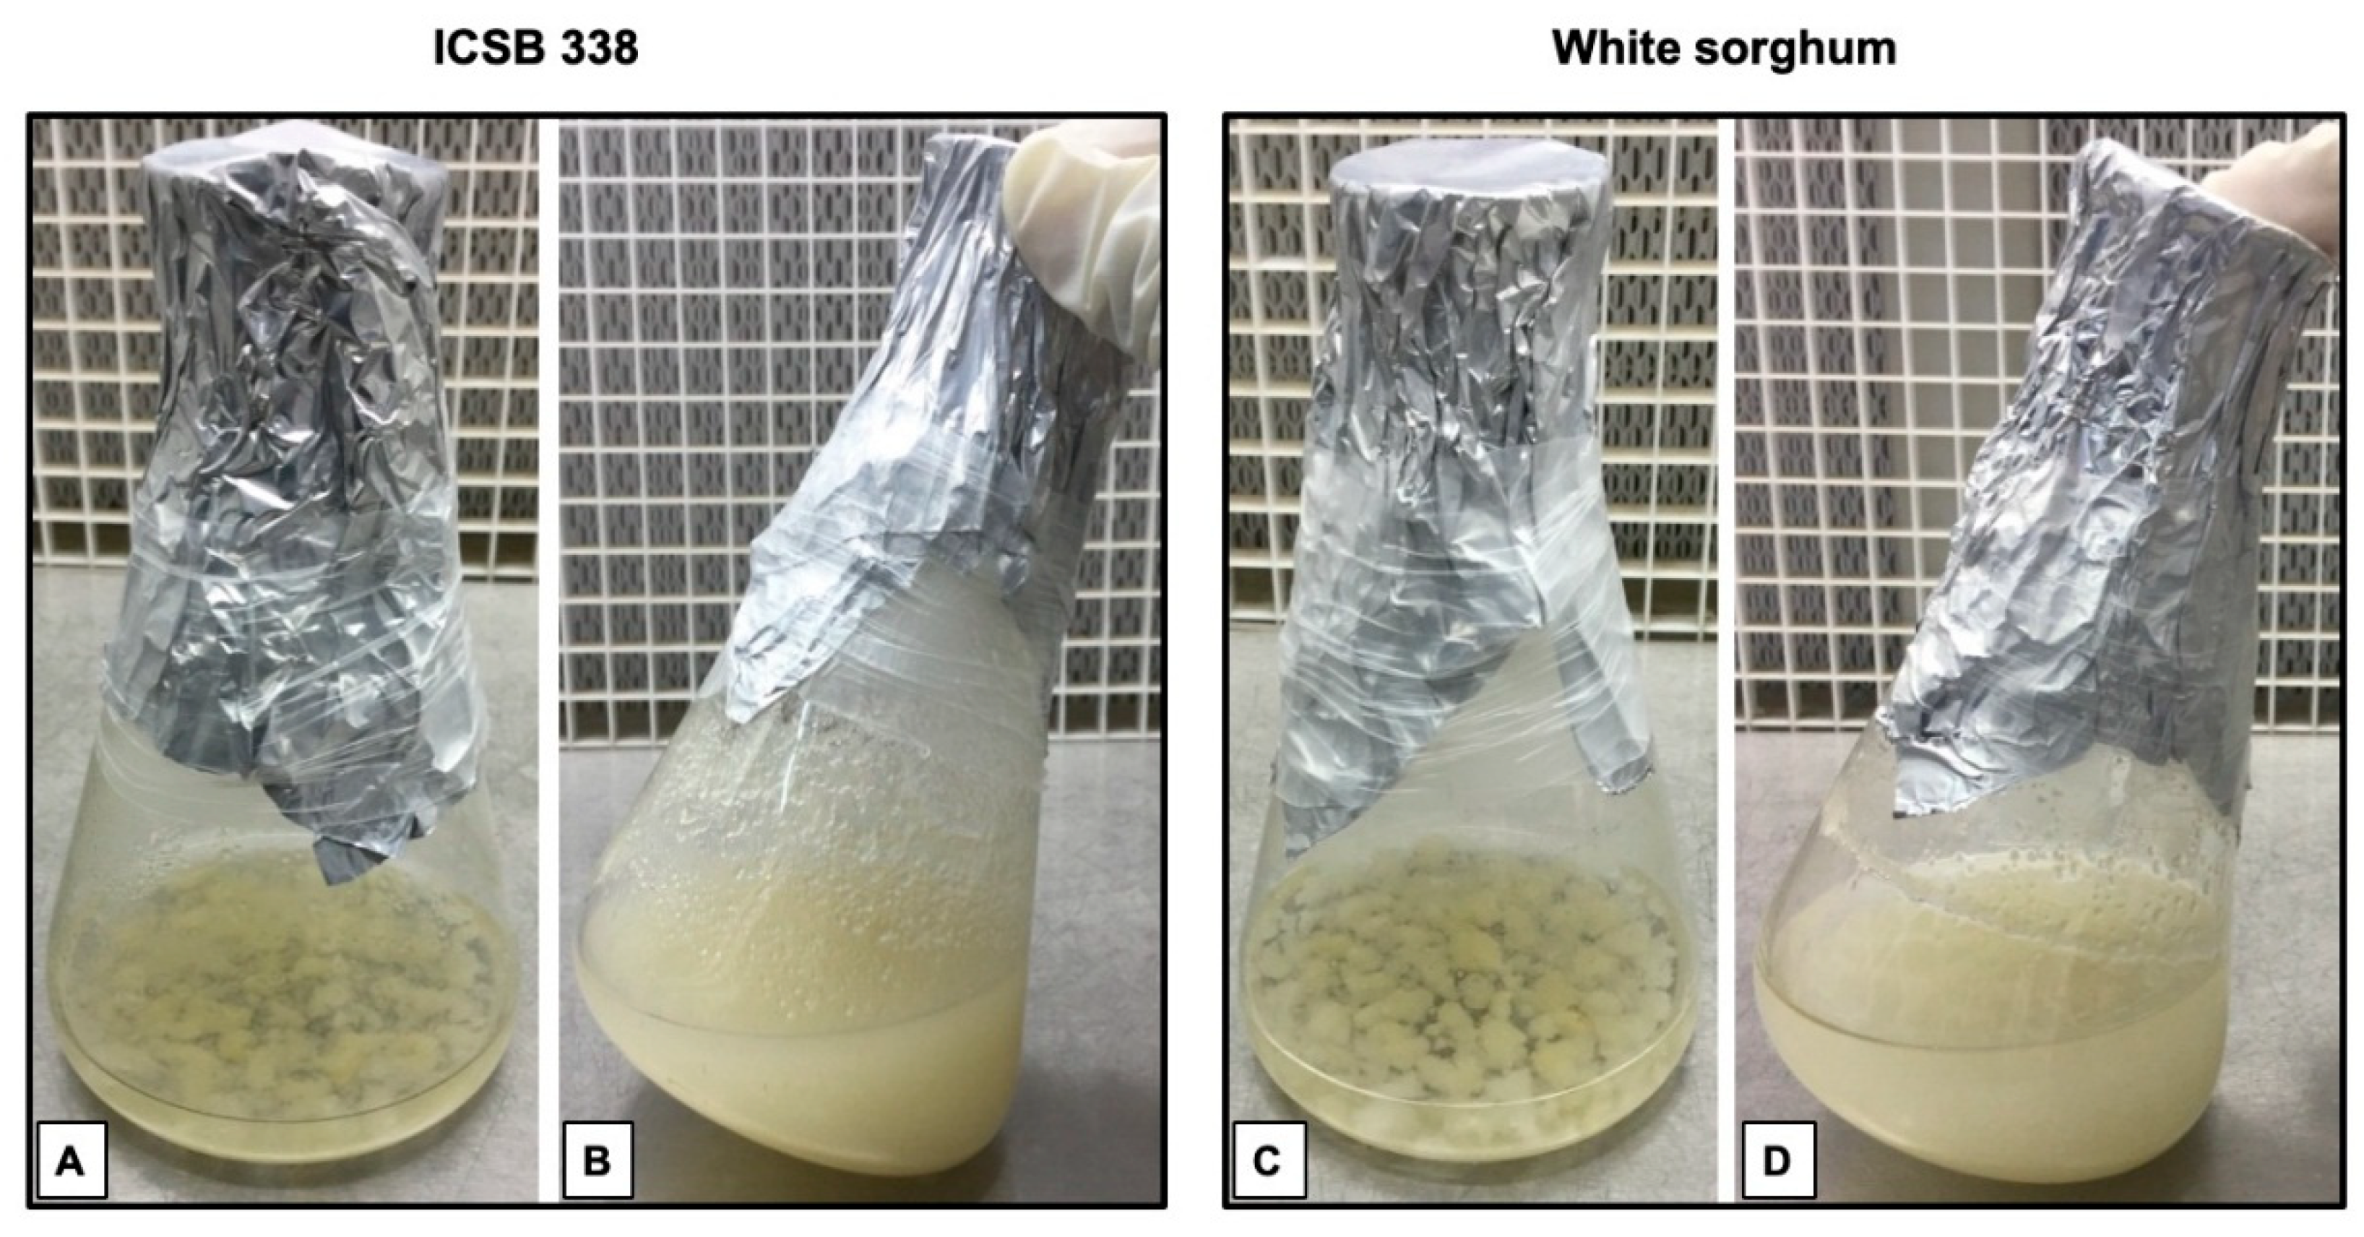
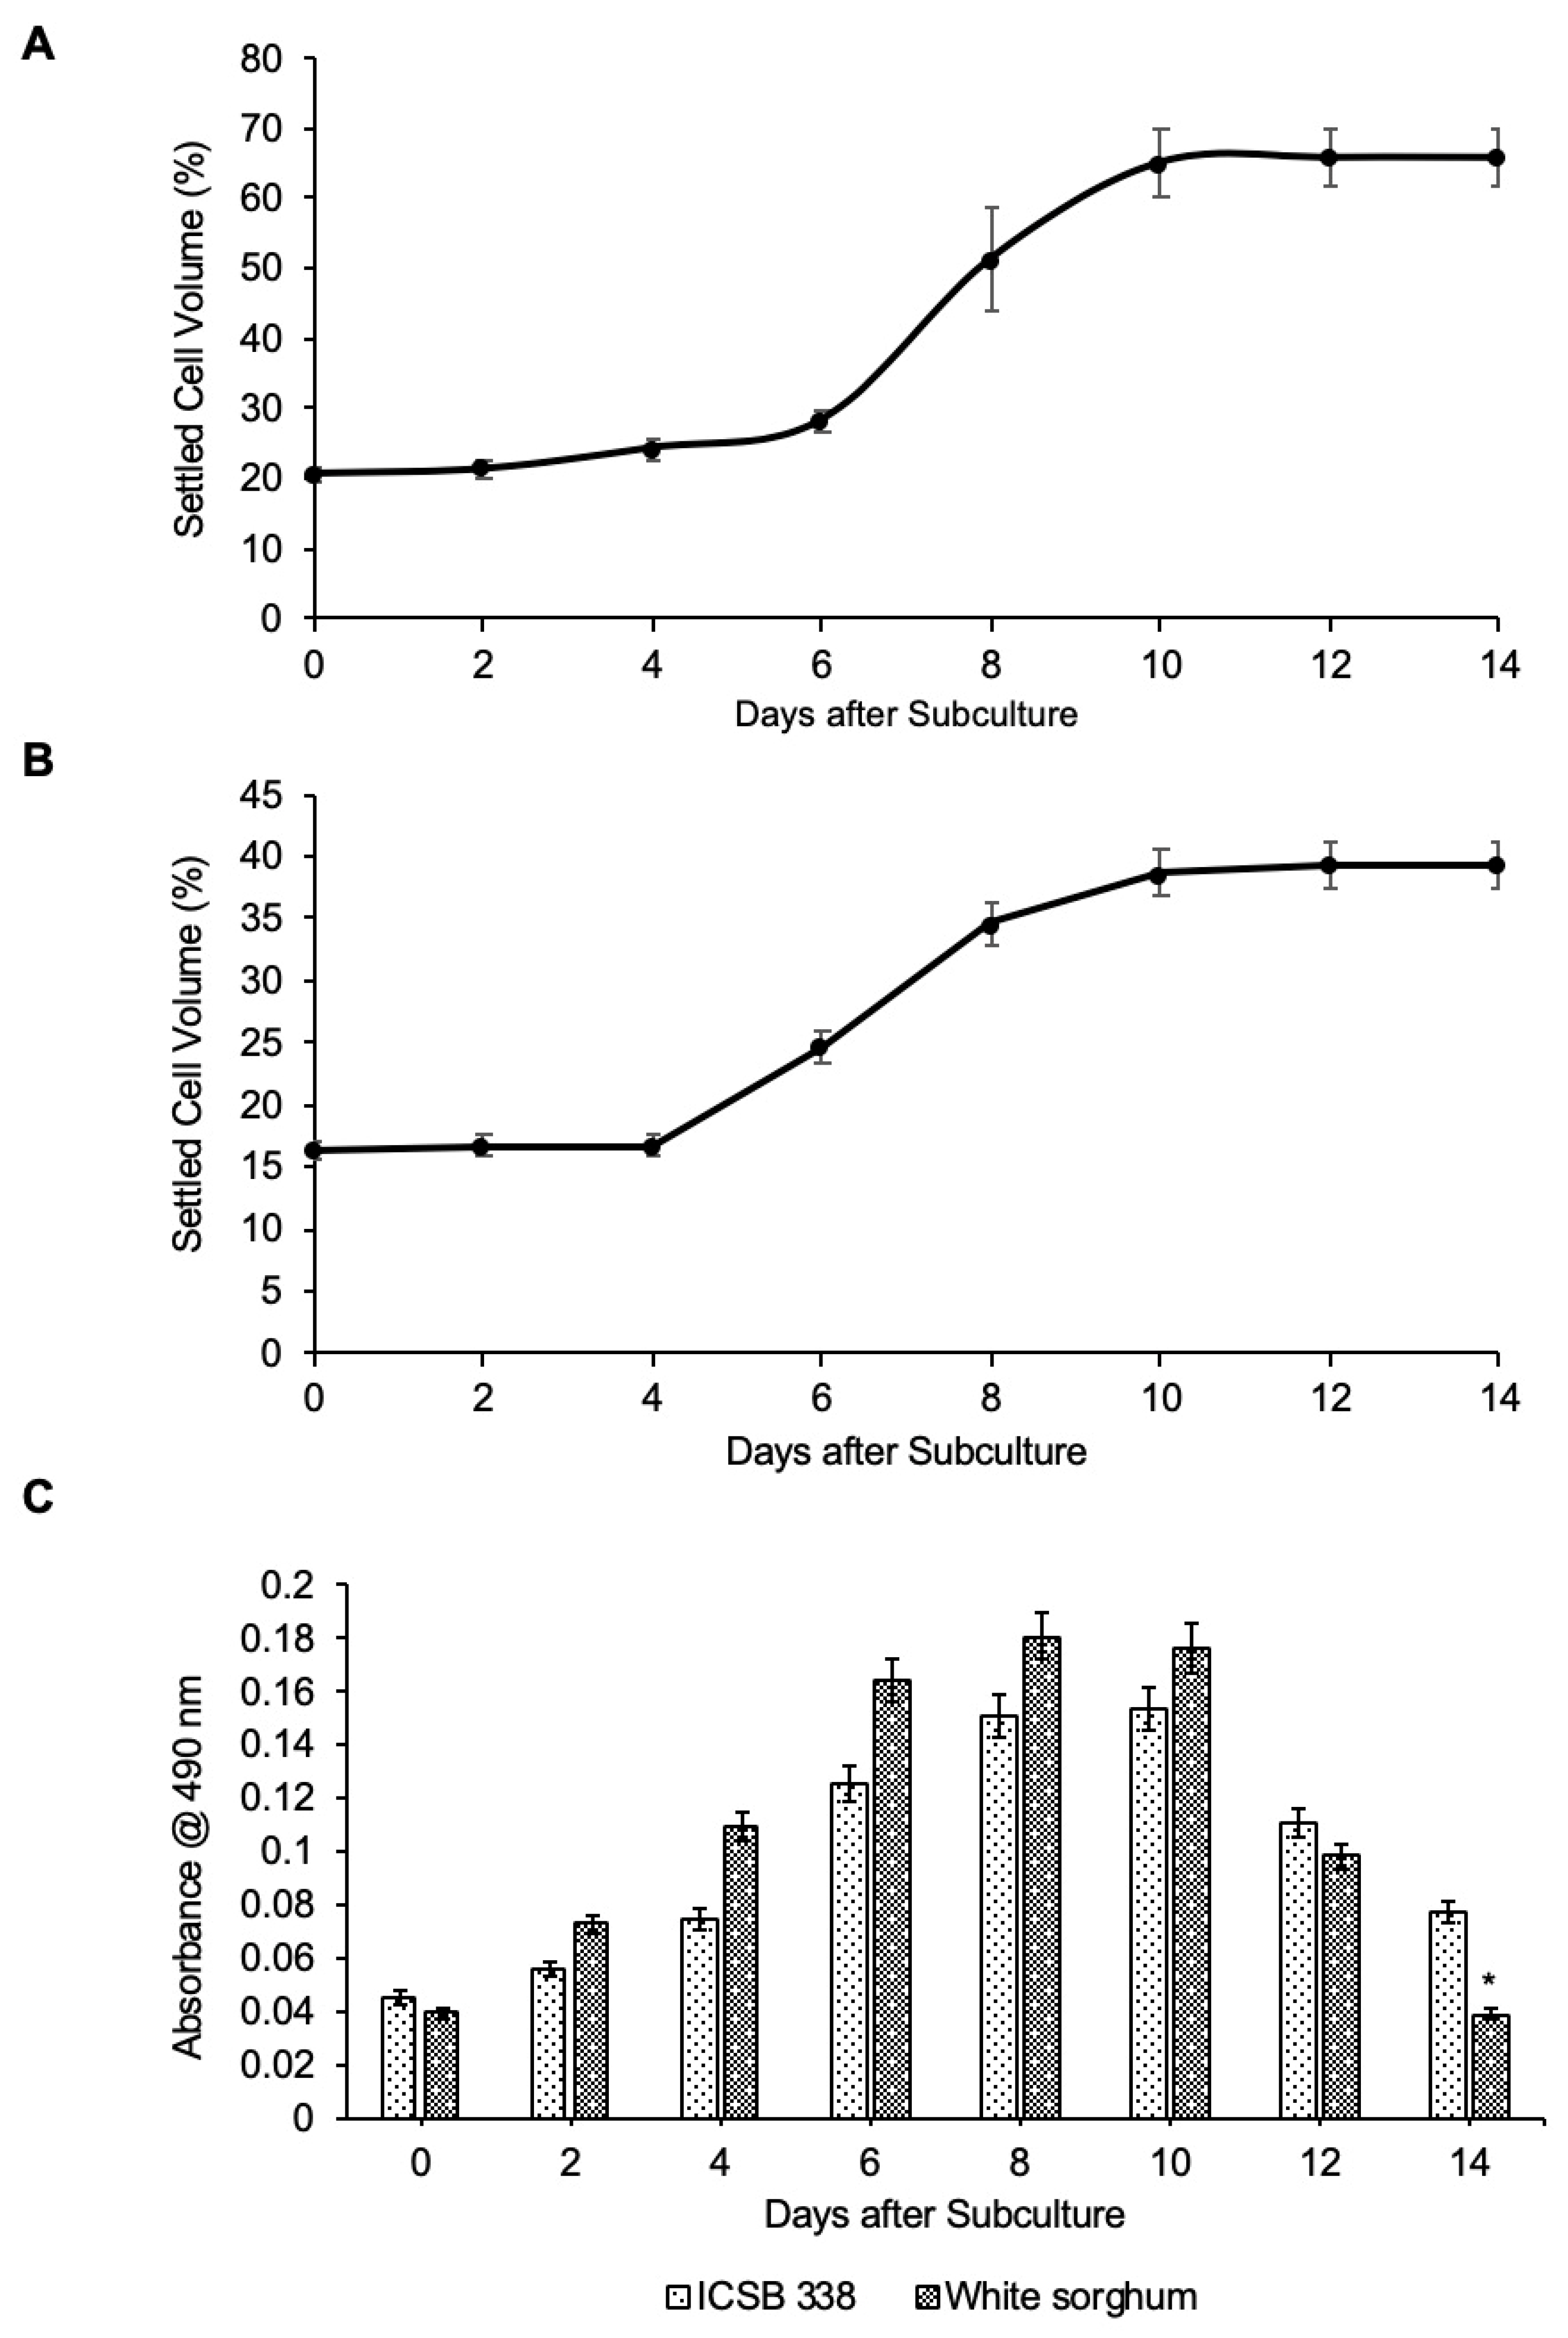
3.2. Establishment and Characterisation of Cell Suspension Cultures

From the seven sorghum varieties used in preliminary callus induction procedures in this study, ICSB 338 was selected for establishing cell suspension cultures because it readily produced large friable callus masses in a reproducible manner across several experiments. The White sorghum variety, previously used for callus induction procedures [27] was also used to establish cell suspension culture as a reference line. Cell suspensions of both ICSB 338 and White sorghum varieties are shown (Figure 3).
The growth of three independently established ICSB 338 and White sorghum cell cultures was assessed using the SCV method and sigmoidal growth curves of both cell cultures are presented (Figure 4A,B). Both growth curves showed three distinct growth phases; the lag phase, the log phase, and a stationary phase. These phases occurred in different days in the two cell culture lines (Figure 4A,B). The viability of the two cell suspension cultures, estimated using the MTT assay showed patterns similar to those shown by the growth curves (Figure 4C). The cell viability was low during lag phase. During log phase the viability increased until the cells reach the stationary phase where the viability gradually decreased, possibly indicating a change in cellular metabolism as cells stop multiplying and nutrients become limiting.

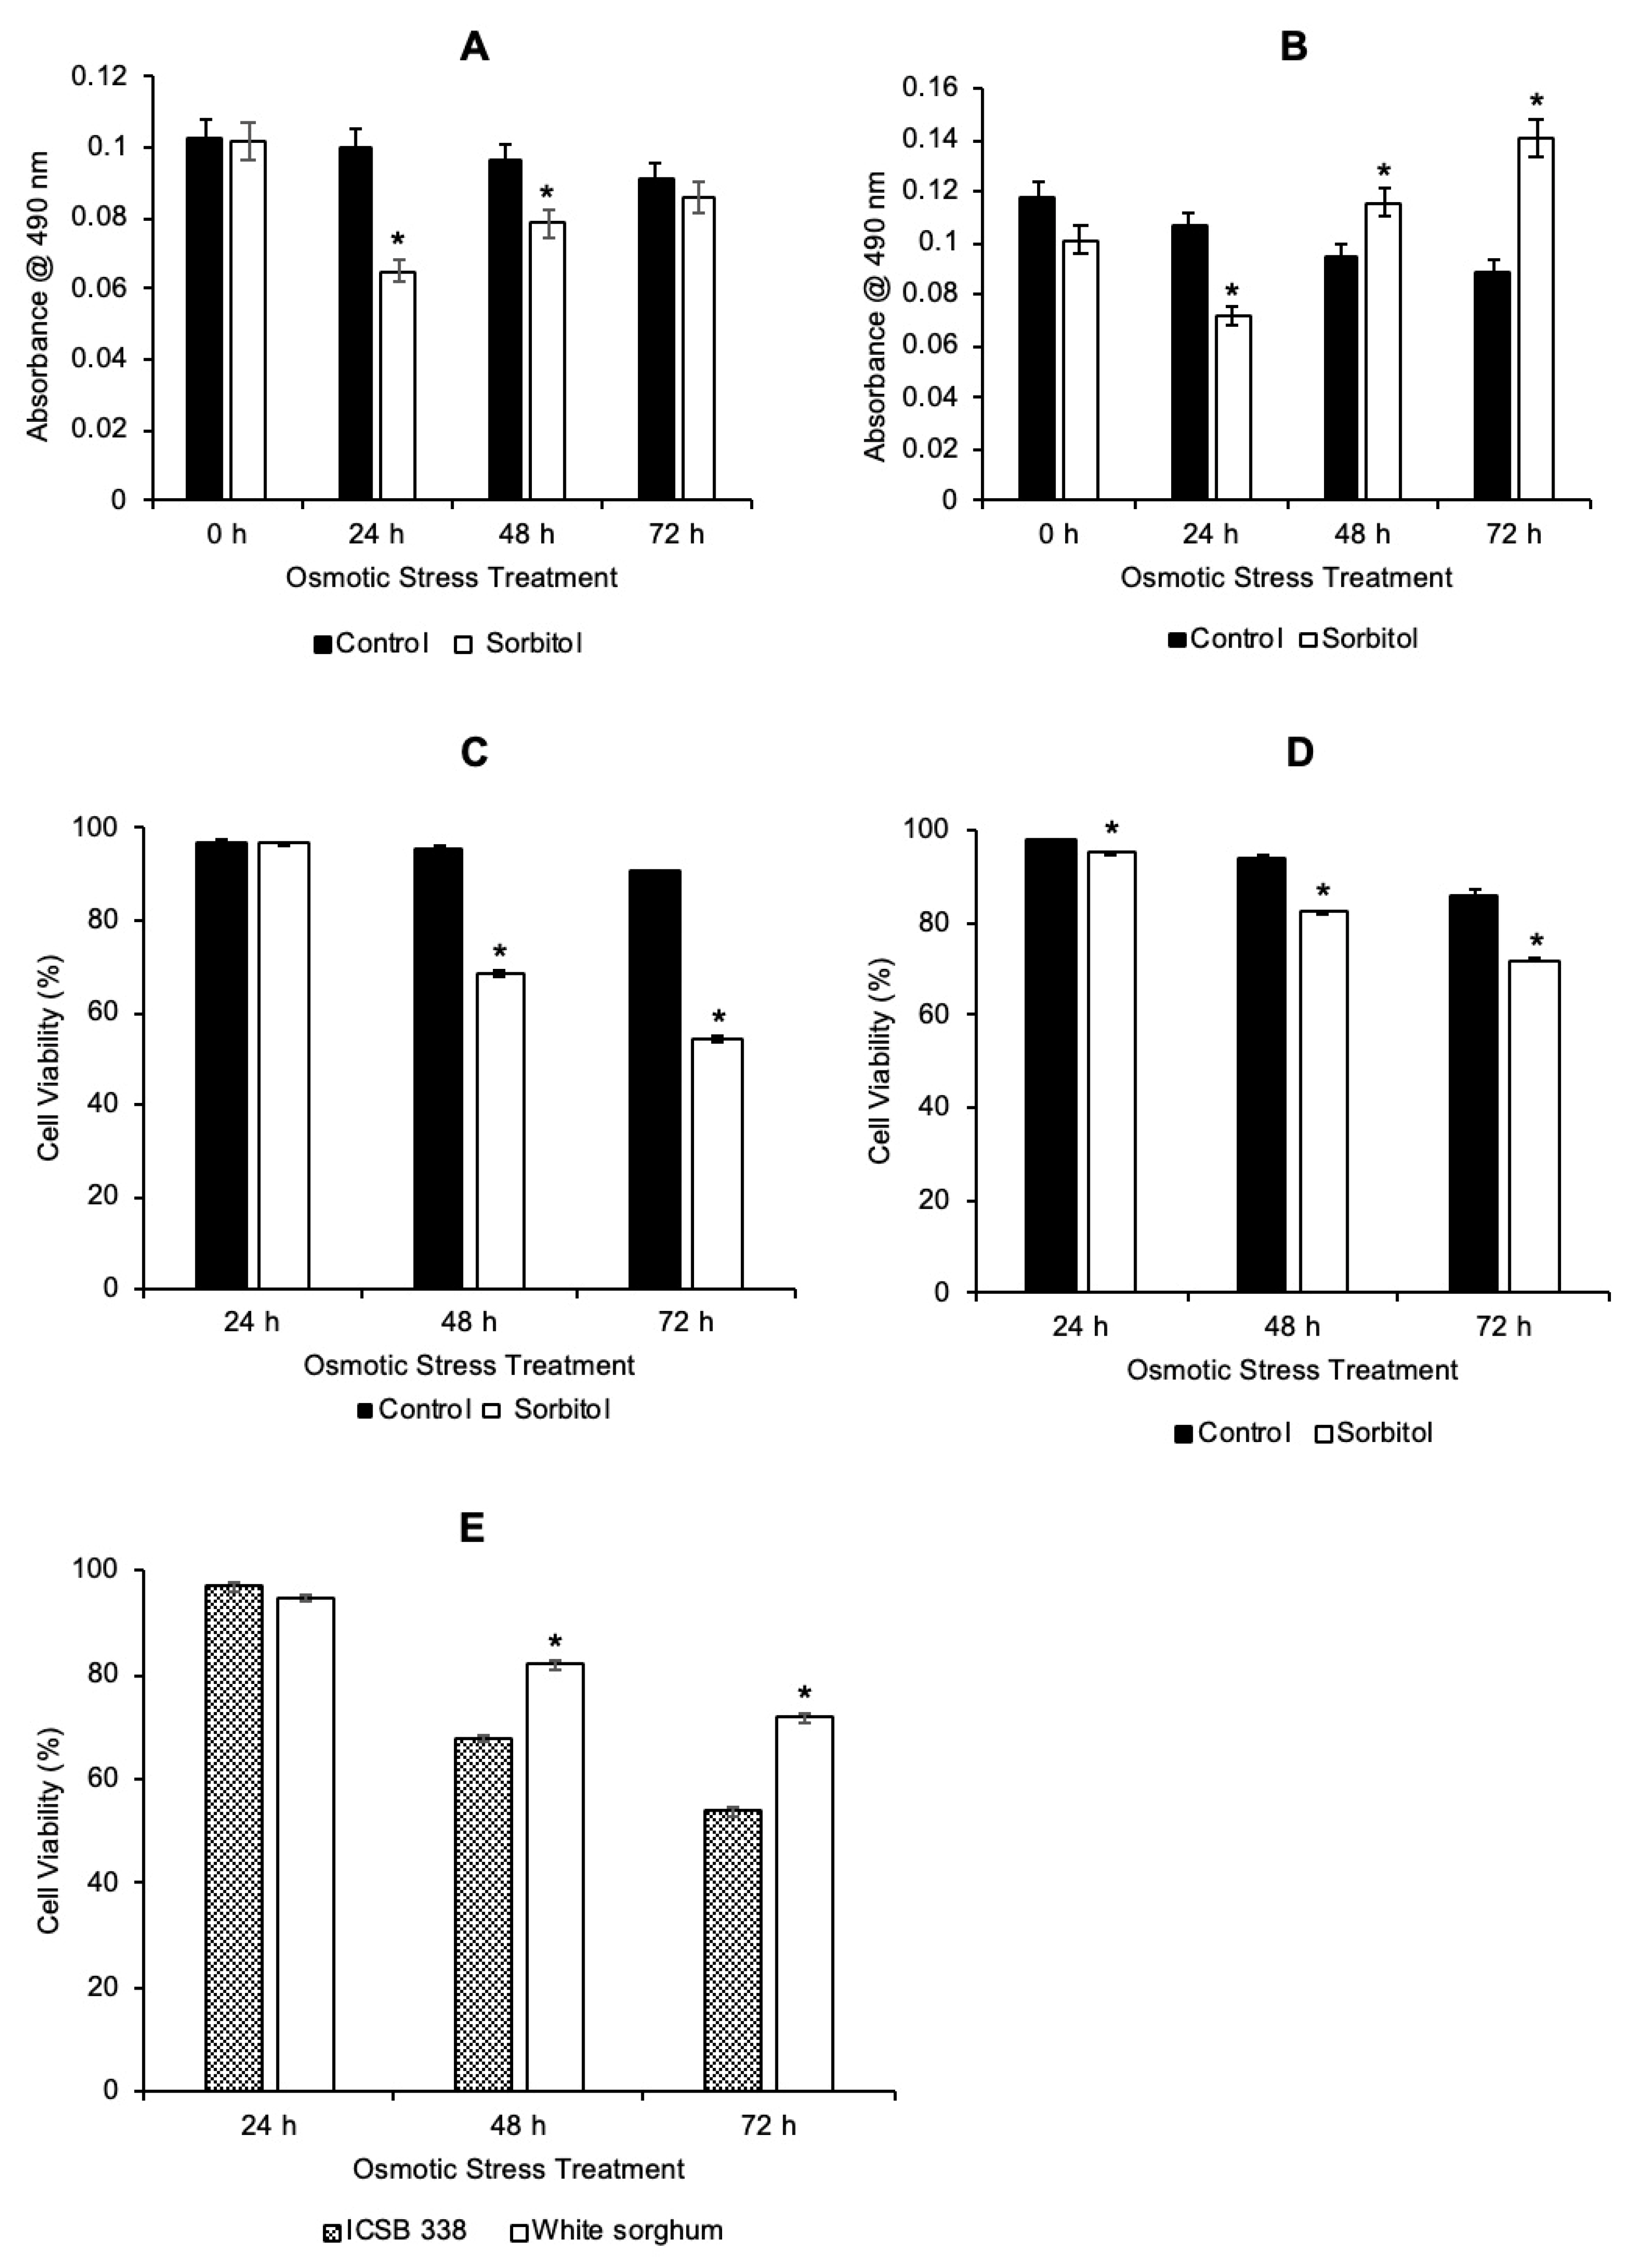
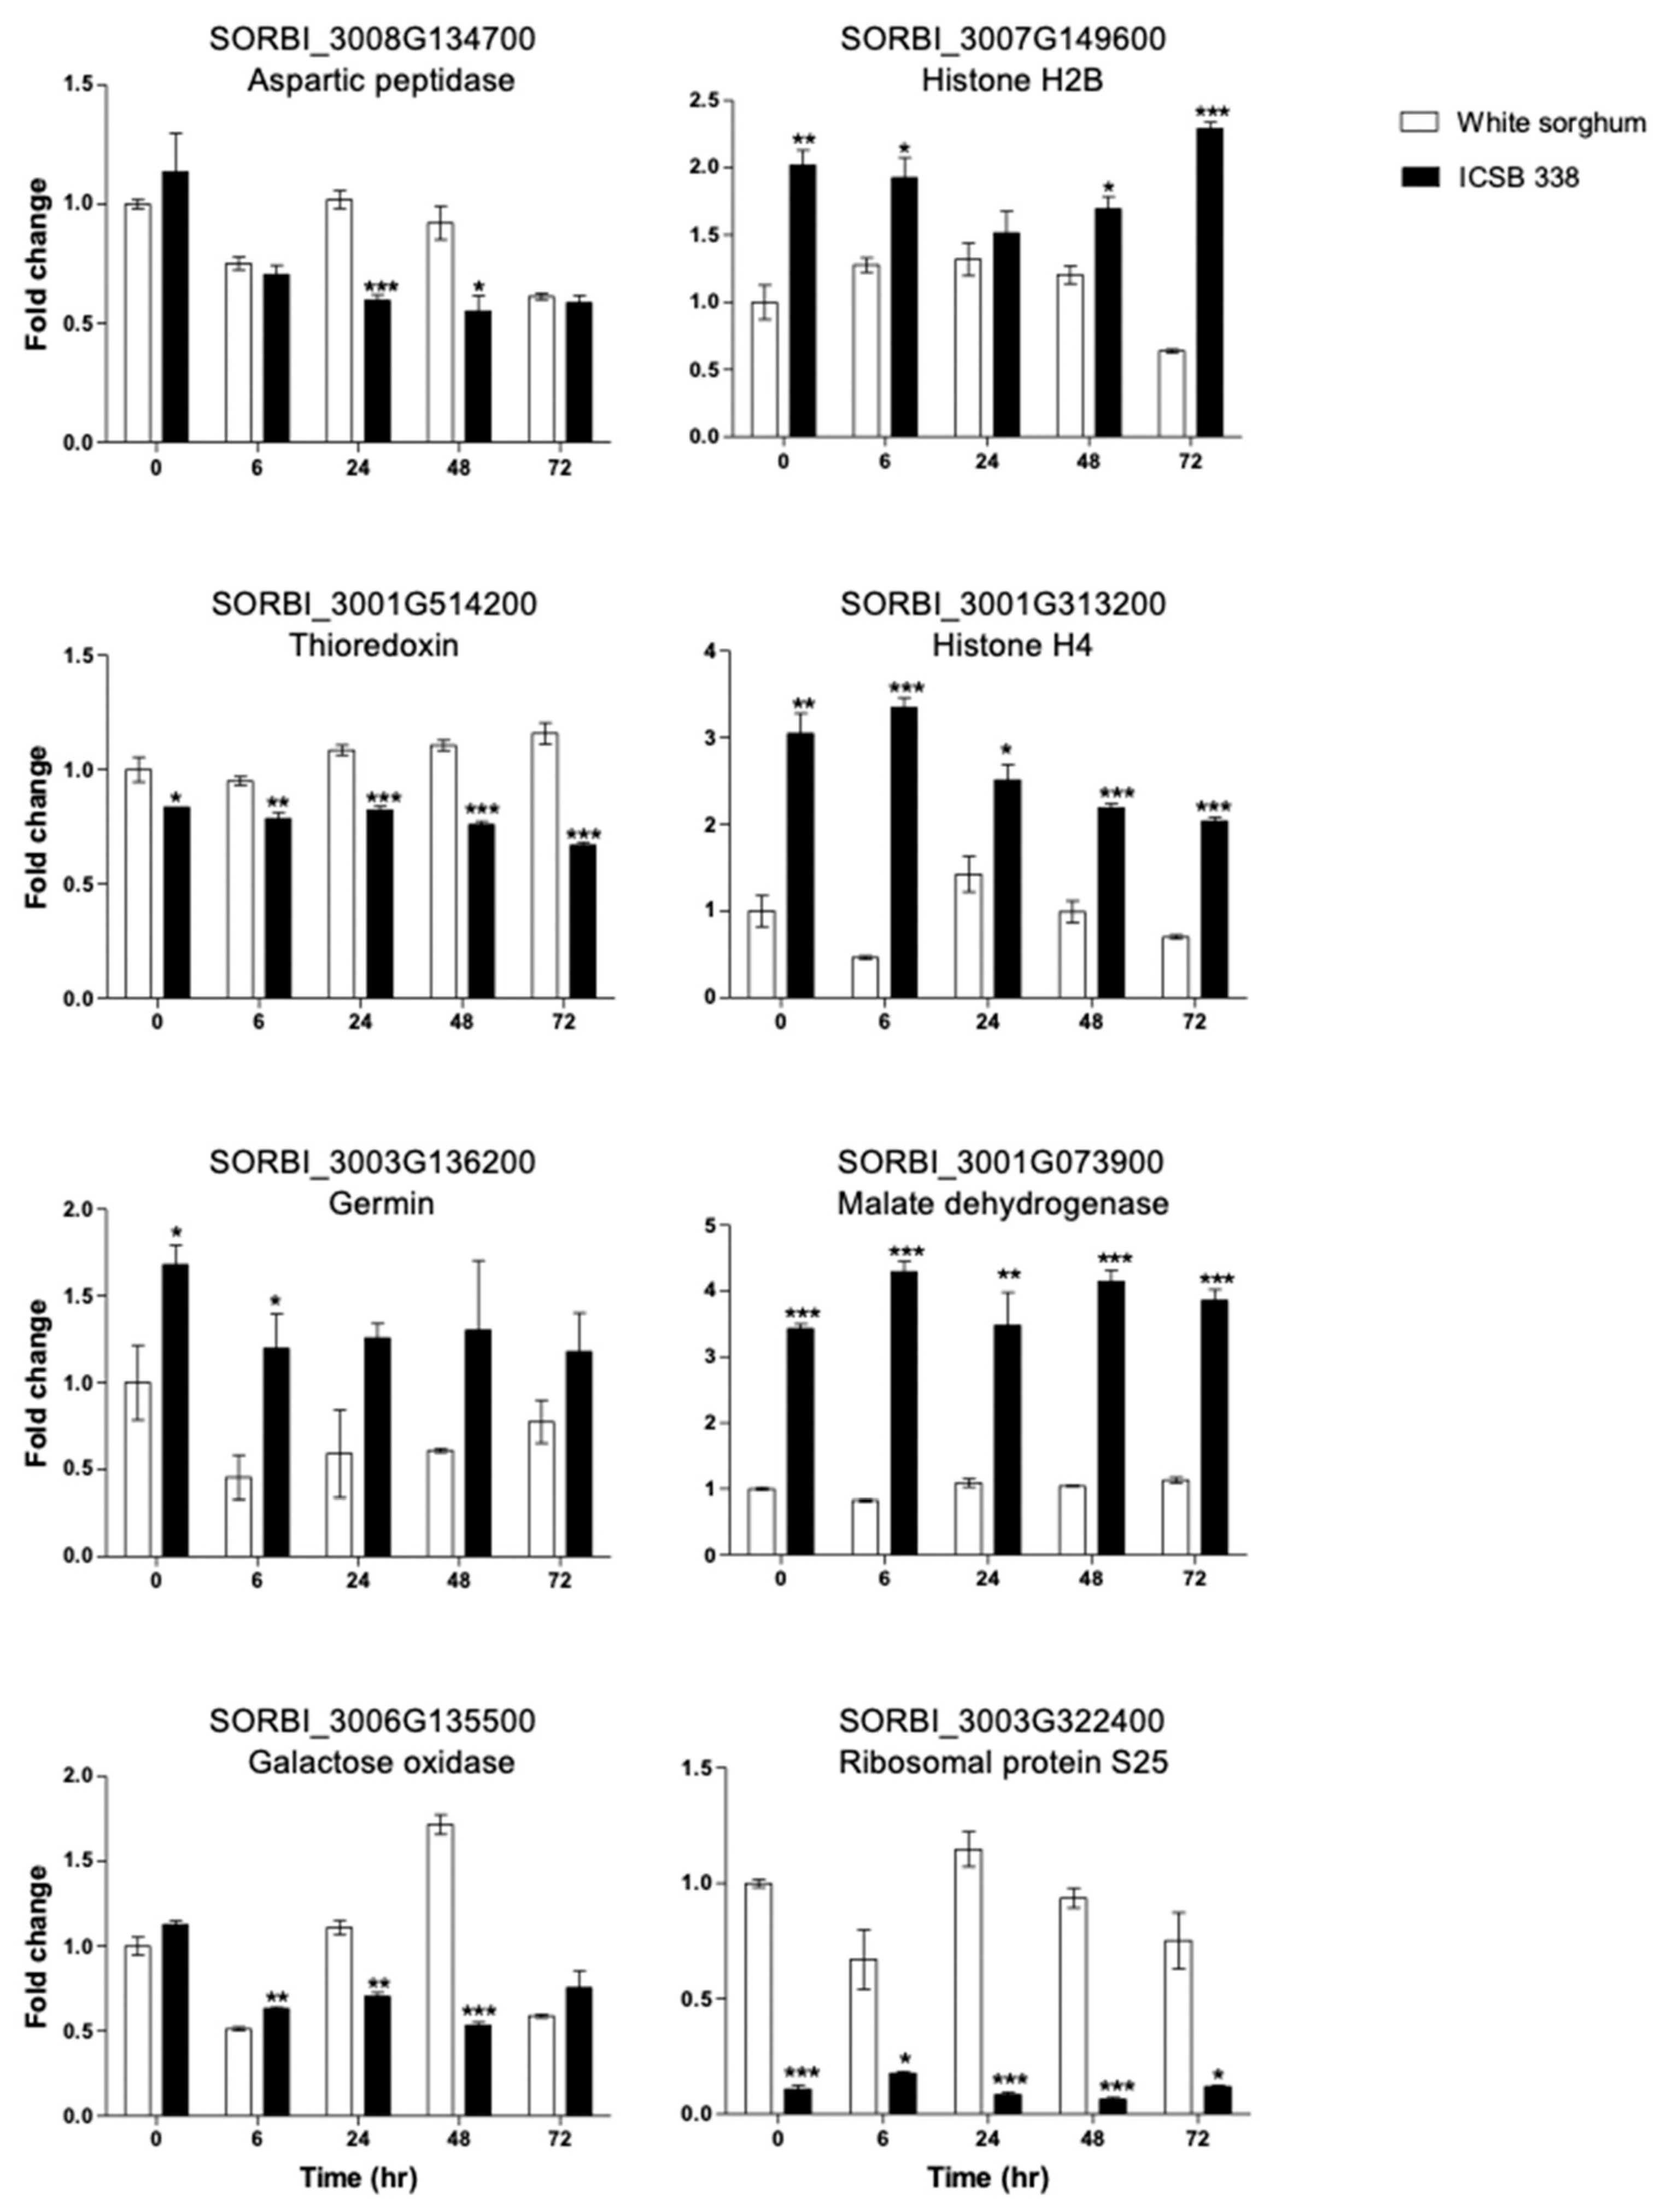
3.3. Comparative Analysis of the Two Sorghum Cell Suspension Cultures Following Osmotic Stress Treatment

Sorbitol-induced osmotic stress was imposed on the two cell cultures in order to compare their responses in terms of cell structure and viability, and gene expression following the stress treatment. Osmotic stress in both ICSB 338 and White sorghum cell cultures was induced using 400 mM sorbitol, while all control cultures were spiked with an equivalent volume of sterile distilled water, at day 8-post subculture. For each sorghum line, three biological replicate cell cultures were used in the experiment. The effect of osmotic stress on cell cultures was also evaluated using MTT and Evans blue assays and microscopic analysis of cell structure. For both the MTT and Evans blue assays, statistical analysis was conducted using the Student’s t-test at 5% level of significance.
Cell viability of control and sorbitol-treated cells for ICSB 338 and White sorghum cell cultures using the MTT assay are shown (Figure 5A,B). Generally, the viability of control cultures of both varieties gradually decreased over the duration of the experiment (0–72 h), although this decrease was not statistically significant. However, the sorbitol-treated cell fractions showed a statistically significant transient dip in cell viability 24 h post treatment for both cultures (Figure 5A,B). Cells seemed to recover from the stress from 48 h, with a remarkable increase in viability being observed in White sorghum cells 72 h post treatment (Figure 5B).
Evans blue test measures cell death, the inverse of which is cell viability. The Evans blue dye is absorbed by cells, which have a damaged plasma membrane (PM), thus making them permeable. This test was used to estimate the cell viability of control and sorbitol-treated cells. However, cell viability measurements were only carried out starting from 24 h post-treatment, with the assumption that the cell cultures used had 100% cell viability before treatment and immediately after treatment at time 0 h. Individual plots of cell viability results of the two cell cultures following 72 h of osmotic treatment using the Evans blue assay (Figure 5C,D) and a comparative plot of the sorbitol-treated samples of both cell cultures (Figure 5E) are shown. A significant decrease in cell viability was observed for the entire 72 h of osmotic stress treatment for both cell cultures (Figure 5E). However, ICSB 338 cells seemed to have been affected more by 400 mM sorbitol, as compared to White sorghum cells. This is explained by a steep decrease in cell viability from 97% at 24 h to 54% at 72 h, while for White sorghum, the decrease was from 95% at 24 h to 72% at 72 h post sorbitol treatment (Figure 5E).
Changes in cell structure of ICSB 338 and White sorghum cells were observed using a Nikon Eclipse E200 light microscope at a magnification of 40 × , 72 h following stress treatment. Figure 6A,B show microscopic images of control and sorbitol-treated cell cultures of ICSB 338 and White sorghum, respectively. It is clear from Figure 6 that sorbitol treatment caused changes in cell structure, with the main feature observed being plasmolysis. However, there were no discernible differences in morphological changes triggered by osmotic stress between the two cell lines.
A comparative gene expression analysis was performed between ICSB 338 and White sorghum cell culture lines in a time-course experiment. All eight genes tested exhibited differences in expression between the two cell cultures at least at two time-points during the 72 h stress treatment period (Figure 7). Expression levels of SORBI_3001G073900 and SORBI_3003G322400 genes were strikingly different between the two cell culture lines throughout the stress treatment period. For others such as SORBI_3008G134700 and SORBI_3006G135500, relatively similar basal levels were observed under control conditions at 0 h, followed by similar gene suppression trends 6 h after stress treatment. However, White sorghum cell cultures exhibited a rapid up-regulation of both genes at 24 and 48 h post-stress treatment, possibly indicating differences in gene regulation between the two cell culture lines. Overall, the qRT-PCR results suggest some inherent genetic diversity between the two cell culture lines, which may contribute towards differences in osmotic stress adaptive responses. However, more experimental studies are needed to validate the functions of the genes in osmotic stress adaptation.

4. Discussion

We established and characterized an in vitro experimental system that could be used in studies aimed at understanding sorghum adaptive responses to a range of stress factors. In such tissue culture experiments, reproducibility and low callus formation efficiency are a challenge in establishing fine cell suspensions. In this study, we encountered low callus induction frequencies (Figure 1), the production of potentially toxic pigments, possibly as a form of defense mechanism by the plant against wounding (Supplementary Figure S1b), and long periods of callus induction. Similar problems have been encountered in other studies using different sorghum cultivars [9,17,35,36]. To produce enough callus for the purposes of establishing cell suspension cultures and microscopic analyses, it took an average of 6 months for ICSB 338, SA 1441, and White sorghum varieties, whereas callus from the other sorghum varieties (ICSV 112, ICSV 210, ICSV 213, ICSB 73, and Macia) used in this study died.
Different medium compositions have been used in different sorghum studies, aimed at identifying the most optimal nutrient medium that will produce enough callus, be it for plant regeneration or molecular studies [9,10,36,37]. Sai and co-workers [36] evaluated 24 diverse sorghum varieties for their callus induction responses with two types of media, MS and nutrient broth medium supplemented with 1 mg/L kinetin, 1 mg/L NAA, and 1 mg/L 6-benzylaminopurine (NBKNB) using shoot tip explants. They reported a good response of callus induction for all the genotypes used on both media. Liu and co-workers [9] reported callus induction rates of between 38.7% and 84% for all the eight media types used in the study. In the current study, sorghum varieties ICSB 338, ICSV 210, and SA 1441 showed higher callus induction rates of 84%. However, during maintenance, ICSV 210 calli exhibited reduced growth rates and ultimately stopped growing. Differences in genotypic callus induction rates have also been recorded in other studies [38,39].
In the current study, MSMO medium supplemented with different PGH combinations was used for callus induction on all seven sorghum varieties. MSMO, supplemented with 3 mg/L 2,4-D and 2.5 mg/L NAA (medium E) produced high callus induction rates in all seven varieties. These results are in agreement with a previous study [27]. Although high induction rates were obtained from this medium composition, callus growth and reproducibility was still low for other sorghum varieties such as ICSV 112 and Macia, and the callus masses were not friable (Supplementary Table S1). Therefore, these non-friable callus masses could not be used for the establishment of cell suspension cultures. Media E and F (4 mg/L 2,4-D and 2.5 mg/L NAA) efficiently gave high callus induction rates for SA 1441, ICSV 210, and ICSB 338 (Figure 1). Most tissue culture studies combine two types of PGHs, auxin and cytokinins for callus induction [9,37,40] with low concentrations of 2,4-D being commonly used in cereals [41]. However, in the current study we combined two auxins (2,4-D and NAA), a method previously used in sorghum callus induction [27]. Medium E promoted the induction and growth of large ICSB 338 friable callus masses. For this reason, ICSB 338 was subsequently selected for the establishment of cell suspension cultures together with White sorghum, both on medium E. Cells were maintained in culture by culturing 30 mL (containing approximately 15–20% SCV) of cell culture and 70 mL fresh medium when sub-culturing the cell suspension cultures and after two generations of sub-culturing, cells became finely suspended in the medium.
Plant cell growth can be assessed by monitoring either the settled cell volume (SCV) or packed cell volume (PCV) in culture, fresh and/or dry weight, or cell numbers [12]. Cell growth measurements are then plotted against time, generating a growth curve, which shows the progression of cell growth over time. The typical sigmoidal growth curve consists of three distinct phases, namely, the lag phase, the exponential phase, and the stationary phase [42]. The growth of ICSB 338 and White sorghum cell suspensions were estimated using SCV method over a 14-day period. Although both cell cultures had typical sigmoidal shaped growth curves (Figure 4A,B), the duration of each of the lag and exponential phases differed between the cultures. The duration of growth phases in plant cell suspension cultures are reported to differ depending on the inoculum cell density, growth conditions, and plant species [30,43,44]. For example, the cell growth curve of White sorghum previously established [30] shows different lengths of phases from the current study. Although both studies used approximately the same inoculum cell density of between 15–16% SCV, the lag phase lasted for 8 days [30] and four days in the current study (Figure 4A,B). These distinct results could be attributed to differences in culture conditions and environments, and possibly technical differences in cell sampling. Growth curve readings were terminated at day 14 for both cell cultures because of two reasons. Firstly, the colour of the cell cultures started changing from light yellow to a brownish colour, possibly indicating reduced or change in cell metabolic activity. This observation can be correlated to low viability readings observed when cells started browning (Figure 4C). Secondly, the reproducibility and consistency in sampling became difficult even though cells were agitated before sampling. This is in agreement with previously reported observations [27].
Cell viability can be assessed across the growth curve using the MTT or Evans blue assays. The MTT-formazan assay is based on the principle that mitochondrial dehydrogenase of viable cells with active metabolism convert the yellow tetrazole MTT [3-(4,5-dimethylthiazolyl-2)-2,5-diphenyltetrazolium bromide] into a purple formazan, which is detected spectrophotometrically at 490 nm [45]. The Evans blue dye is effective in determining whether or not cells are alive in vascular plants. The dye penetrates through cells whose plasma membrane integrity is lost. The amount of dye absorbed by cells is then detected spectrophotometrically at 600 nm [46]. The viability of ICSB 338 and White sorghum cell suspension cultures was estimated using the MTT assay over a 14-day period. It was observed that the results of the cell viability tests of both ICSB 338 and White sorghum (Figure 4C) were in agreement with the results from the growth curve (Figure 4A,B). On the day of sub-culture, the cells were fewer in number due to the culture dilution with fresh medium and cells adapting to a new environment (lag phase), thus low cell viability values. The cell viability estimates gradually increased with an increase in cell volume (log phase) and possibly metabolic activity. Thereafter, the cell viability decreases as cell multiplication plateaus in the stationary phase possibly due to nutrient exhaustion.
Based on growth curve analysis and vital staining, the day on which these two sorghum cell cultures must be sub-cultured for maintenance and keeping the cells alive can be determined. The cells should be sub-cultured every 10–12 days after the previous sub-culture for both ICSB 338 and White sorghum. The results of White sorghum growth curve previously reported [30] are in agreement with the results of the current study. The duration of maintaining cells in culture differs depending on the initial volume of either settled or packed cells, and also from species to species. Abrus precatorius, an important medicinal plant, requires that the cell suspension be sub-cultured every two weeks [44], while Jatropha curcas and J. gossypifolia cell suspensions require sub-cultures every 20 days [47].
Sorghum germplasm is genetically diverse [2,3], making it an important resource for comparative studies in plant biology. We observed genotypic differences in friable callus induction amongst the seven varieties used in this study. Ultimately, ICSB 338 and White sorghum cell cultures provided us with two potentially distinct in vitro experimental systems for further characterisation. We designed an experiment using 400 mM sorbitol as osmoticum and assessed cell structural, viability and gene expression changes and/or differences between the two cell cultures following osmotic treatment. Light microscopic analysis showed that both ICSB 338 and White sorghum cell cultures plasmolyzed following stress treatment (Figure 6), which is consistent with cells placed in a hypertonic solution. Similar results have been observed in tobacco [21] and sorghum [28] cells after treatment with 400 mM sorbitol and sweet potato after a 600 mM sorbitol treatment [20]. In this study however, no discernible cell structural differences were observed between ICSB 338 and White sorghum cell cultures under osmotic stress treatment.
We further investigated the effect of 400 mM sorbitol stress treatment on cell viability of the two cell cultures using the MTT and Evans blue assays. The MTT cell viability results revealed that sorbitol caused a transient decrease in cell viability 24 h after treatment (Figure 5A,B). However, at 48 h following osmotic stress, cells appear to have recovered from and adapted to the osmotic stress as explained by a significant increase in metabolic activity (Figure 5A,B). The Evans blue assay showed that sorbitol treatment resulted in a decrease in cell viability throughout the entire treatment period (Figure 5C,D). However, based on the observation made from MTT assay, which measures metabolic activity, we propose that the cell viability measured by Evans blue assay can be explained as observing a transient change in membrane permeability, which is not lethal. Elicitors such as chitosan have been found to cause similar transient change in membrane permeability (or molecules leakage) when added to cell cultures [48]. Such changes occur when certain molecules are taken up by active transport or internalized via endocytosis. In the current study, sorbitol seems to have the same effect as that previously reported for chitosan. Therefore, a plausible explanation of the increase in Evans blue uptake is perhaps a sorbitol-induced activation of endocytosis, rather than plasma membrane damage leading to cell death. Thus, this study raises a caveat to the use of this assay in cell death analysis.
Variation in stress tolerance occurs within and between plant species [49,50]. In another study, RNA-seq analysis of the leaf meristem revealed differential gene expression patterns in two contrasting sorghum varieties in response to drought stress [51]. In this study, we observed differences in cell viability results of the two cell cultures in response to 400 mM sorbitol-induced osmotic stress (Figure 5), with ICSB 338 being more susceptible to the imposed stress compared to White sorghum cell cultures (Figure 5E). We also observed discernible differences in gene expression levels for all the selected targets between the two cell culture lines in response to sorbitol-induced osmotic stress (Figure 7). The observed differences in gene expression (Figure 7), suggest some inherent genetic diversity in the two cell culture lines, which may contribute towards their differences in osmotic stress responses and tolerance levels. It is known that plant cells alter gene, protein, and metabolite expression patterns in response to biotic and abiotic stress factors [50,52,53,54]. Such molecular changes ultimately contribute towards the maintenance of cellular homeostasis and the continuation of plant growth and developmental processes during periods of stress. However, the contributions of these differentially expressed genes to stress response and tolerance in the two sorghum culture lines would need to be experimentally validated.
We thus propose that ICSB 338 and White sorghum cell cultures are useful systems to be used in various comparative studies in plant biology, such as gene, protein, and metabolite profiling. Furthermore, sorghum has a long growth cycle, reaching physiological maturity in about 120 days depending on genotype. In contrast cell suspensions have a much shorter growth cycle (Figure 4) and thus provide a continuous supply of experimental material [27]. Studies utilizing Arabidopsis [55] and soybean (Glycine max) [56] cell suspensions have contributed immensely to our understanding of plant signaling molecules [57] and oxidative burst [58] in plant disease response, and proteome changes in response to abiotic stresses [26,59] and pathogen infection [60,61,62], to mention a few. The White sorghum cell culture has been used to study extracellular matrix proteins in response to osmotic stress [19], while the ICSB 338 cell culture has been used in a heat stress study (unpublished data) [63]. Hence, the sorghum cell cultures developed in the current study will provide the wider scientific community with an invaluable resource that could lead to discoveries in biochemical and molecular response networks of this crop towards a range of biotic and abiotic stress factors.

5. Conclusions

Sorghum’s natural drought tolerance makes it an ideal model system for physiological and molecular studies in plant stress biology. Comparative studies of sorghum in responses to drought stress are also feasible due to the availability of a genetically diverse germplasm with contrasting phenotypic traits. The results of this study showed the effect of genetic variation on callus induction rates amongst the sorghum germplasm used, with the drought sensitive ICSB 338 readily forming friable callus masses compared to other drought resistant and tolerant varieties. The cell cultures of ICSB 338 and White sorghum showed differences in cell viability and gene expression patterns in response to osmotic stress and thus offer in vitro experimental systems for use in a range of molecular studies in plant stress biology.

Supplementary Materials

The following are available online at https://www.mdpi.com/2073-4395/9/5/218/s1, Figure S1: Callus induction results showing non-friable callus, phytochemical exudates and root-like callus tissue, Table S1: Table summarizing callus initiation results of all seven sorghum varieties used in this study.

Author Contributions

Conceptualization, S.C. and R.N.; Data curation, E.R., S.C. and R.N.; Formal analysis, E.R., T.G., J.V.A., T.J.T., S.C. and R.N.; Funding acquisition, S.C. and R.N.; Investigation, E.R. and T.G.; Methodology, E.R. and T.G.; Project administration, R.N.; Resources, J.V.A., T.J.T., S.C. and R.N.; Supervision, T.J.T. and R.N.; Writing–original draft, E.R. and R.N.; Writing–review & editing, E.R., T.G., J.V.A., T.J.T., S.C. and R.N.

Funding

This research was funded by the National Research Foundation, grant 93612 and the Royal Society Newton Advanced Fellowship, grant NA160140. E.R. was supported by National Research Foundation and Agricultural Research Council student bursaries. T.G. was supported by a National Research Foundation bursary.

Acknowledgments

We thank Colleen Turnbull for technical support in the experimental setup.

Conflicts of Interest

The authors declare no conflict of interest. The funders had no role in the design of the study; in the collection, analyses, or interpretation of data; in the writing of the manuscript, or in the decision to publish the results.

References

  1. FAOSTAT. 2017. Available online: http://www.fao.org (accessed on 22 March 2019).
  2. Kimber, C.T.; Dahlberg, J.A.; Kresovich, S. The gene pool of Sorghum bicolor and its improvement. In Genomics of the Saccharinae; Paterson, A.H., Ed.; Springer: New York, NY, USA, 2013; Volume 11, pp. 23–41. [Google Scholar]
  3. Motlhaodi, T.; Geleta, M.; Chite, S.; Fatih, M.; Ortiz, R.; Bryngelsson, T. Genetic diversity in sorghum [Sorghum bicolor (L.) Moench] germplasm from Southern Africa as revealed by microsatellite markers and agro-morphological traits. Genet. Resour. Crop Evol. 2017, 64, 599–610. [Google Scholar] [CrossRef]
  4. Rosenow, D.T.; Quisenberry, J.E.; Wendt, C.W.; Clark, L.E. Drought tolerant sorghum and cotton germplasm. Agric. Water Manag. 1983, 7, 207–222. [Google Scholar] [CrossRef]
  5. Doggett, H. Sorghum, 2nd ed.; Longman Scientific & Technical: New York, NY, USA, 1988. [Google Scholar]
  6. IPCC. Summary for Policymakers; IPCC: Cambridge, UK, 2007; pp. 7–22. [Google Scholar]
  7. Nelson, G.C.; Rosegrant, M.; Koo, J.; Robertson, R.; Sulser, T.; Zhu, T.; Msangi, S.; Ringler, C.; Palazzo, A.; Batka, M.; et al. Climate Change. Impact on Agriculture and Costs of Adapation; International Food Policy Research Institure: Washington, DC, USA, 2009; p. 32. [Google Scholar]
  8. Pola, S. Isolation and culture of suspension cultures of Sorghum bicolor. Int. J. Bioassays 2014, 3. [Google Scholar] [CrossRef]
  9. Liu, G.; Gilding, E.K.; Godwin, I.D. A robust tissue culture system for sorghum [Sorghum bicolor (L.) Moench. S. Afr. J. Bot. 2015, 98, 157–160. [Google Scholar] [CrossRef]
  10. Belide, S.; Vanhercke, T.; Petrie, J.R.; Singh, S.P. Robust genetic transformation of sorghum (Sorghum bicolor L.) using differentiating embryogenic callus induced from immature embryos. Plant Methods 2017, 13, 109. [Google Scholar] [CrossRef] [PubMed]
  11. George, E.F.; Hall, M.A.; De Klerk, G.J. Plant tissue culture procedure-background. In Plant Propagation by Tissue Culture; George, E.F., Hall, M.A., De Klerk, G.J., Eds.; Springer: Dordrecht, The Netherlands, 2008; pp. 1–28. [Google Scholar]
  12. Evans, D.E.; Coleman, J.O.D.; Kearns, A. Plant Cell Culture; BIOS Scientific Publishers: London, UK, 2003. [Google Scholar]
  13. Ikeuchi, M.; Sugimoto, K.; Iwase, A. Plant callus: Mechanisms of induction and repression. Plant Cell 2013, 25, 3159–3173. [Google Scholar] [CrossRef] [PubMed]
  14. Collin, H.A.; Edwards, S. Plant Cell Culture; BIOS Scientific Publishers: Oxford, UK, 1998. [Google Scholar]
  15. Frank, M.; Rupp, H.M.; Prinsen, E.; Motyka, V.; Van Onckelen, H.; Schmulling, T. Hormone autotrophic growth and differentiation identifies mutant lines of Arabidopsis with altered cytokinin and auxin content or signaling. Plant Physiol. 2000, 122, 721–729. [Google Scholar] [CrossRef] [PubMed]
  16. Chourey, P.S.; Sharpe, D.Z. Callus formation from protoplasys of Sorghum cell suspension cultures. Plant Sci. 1985, 39, 171–175. [Google Scholar] [CrossRef]
  17. Cai, T.; Daly, B.; Butler, L. Callus induction and plant regeneration from shoot portions of mature embryos of high tannin sorghums. Plant Cell Tissue Organ Cult. 1987, 9, 245–252. [Google Scholar] [CrossRef]
  18. Anjum, S.A.; Xie, X.-Y.; Wang, L.C.; Saleem, M.F.; Man, C.; Lei, W. Morphological, physiological and biochemical responses of plants to drought stress. Afr. J. Agric. Res. 2011, 6, 2026–2032. [Google Scholar]
  19. Ngara, R.; Ramulifho, E.; Movahedi, M.; Shargie, N.G.; Brown, A.P.; Chivasa, S. Identifying differentially expressed proteins in sorghum cell cultures exposed to osmotic stress. Sci. Rep. 2018, 8, 8671. [Google Scholar] [CrossRef] [Green Version]
  20. Wang, H.-L.; Lee, P.-D.; Liu, L.-F.; Su, J.-C. Effect of sorbitol induced osmotic stress on the changes of carbohydrate and free amino acid pools in sweet potato cell suspension cultures. Bot. Bull. Acad. Sin. 1999, 40, 219–225. [Google Scholar]
  21. Monetti, E.; Kadono, T.; Tran, D.; Azzarello, E.; Arbelet-Bonnin, D.; Biligui, B.; Briand, J.; Kawano, T.; Mancuso, S.; Bouteau, F. Deciphering early events involved in hyperosmotic stress-induced programmed cell death in tobacco BY-2 cells. J. Exp. Bot. 2014, 65, 1361–1375. [Google Scholar] [CrossRef] [Green Version]
  22. Gupta, P.; Sharma, S.; Saxena, S. Biomass yield and steviol glycoside production in callus and suspension culture of Stevia rebaudiana treated with proline and polyethylene glycol. Appl. Biochem. Biotechnol. 2015, 176, 863–874. [Google Scholar] [CrossRef] [PubMed]
  23. Patade, V.Y.; Bhargava, S.; Suprasanna, P. Effects of NaCl and iso-osmotic PEG stress on growth, osmolytes accumulation and antioxidant defense in cultured sugarcane cells. Plant Cell Tissue Organ Cult. 2012, 108, 279–286. [Google Scholar] [CrossRef]
  24. Muilu-Mäkelä, R.; Vuosku, J.; Hamberg, L.; Latva-Mäenpää, H.; Häggman, H.; Sarjala, T. Osmotic stress affects polyamine homeostasis and phenolic content in proembryogenic liquid cell cultures of scots pine. Plant Cell Tissue Organ Cult. 2015, 122, 709–726. [Google Scholar] [CrossRef]
  25. Wang, L.; He, J.; Ding, H.; Liu, H.; Lu, B.; Liang, J.; Wang, L.; He, J.; Ding, H.D.; Liu, H.; et al. Overexpression of AT14A confers tolerance to drought stress-induced oxidative damage in suspension cultured cells of Arabidopsis thaliana. Protoplasma 2015, 252, 1111–1120. [Google Scholar] [CrossRef]
  26. Alqurashi, M.; Chiapello, M.; Bianchet, C.; Paolocci, F.; Lilley, K.S.; Gehring, C. Early responses to severe drought stress in the Arabidopsis thaliana cell suspension culture proteome. Proteomes 2018, 6, 38. [Google Scholar] [CrossRef]
  27. Ngara, R.; Rees, J.; Ndimba, B.K. Establishment of sorghum cell suspension culture system for proteomics studies. Afr. J. Biotechnol. 2008, 7, 744–749. [Google Scholar]
  28. Ngara, R. A Proteomic Analysis of Drought and Salt Stress Responsive Proteins of Different Sorghum Varieties. Ph.D. Thesis, University of the Western Cape, Cape Town, South Africa, 2009. [Google Scholar]
  29. Murashige, T.; Skoog, F. A revised medium for rapid growth and bio assays with tobacco tissue cultures. Physiol. Plant. 1962, 15, 473–497. [Google Scholar] [CrossRef]
  30. Ngara, R.; Ndimba, B.K. Mapping and characterisation of the sorghum cell suspension culture secretome. Afr. J. Biotechnol. 2011, 10, 253–266. [Google Scholar]
  31. Goche, T. Characterisation of the Physiological, Biochemical and Molecular Responses of Sorghum to Drought Stress. Ph.D. Thesis, University of the Free State, Bloemfontein, South Africa, 2018. [Google Scholar]
  32. Johnson, S.M.; Lim, F.L.; Finkler, A.; Fromm, H.; Slabas, A.R.; Knight, M.R. Transcriptomic analysis of Sorghum bicolor responding to combined heat and drought stress. BMC Genom. 2014, 15, 456. [Google Scholar] [CrossRef] [PubMed]
  33. Li, J.; Fan, F.; Wang, L.; Zhan, Q.; Wu, P.; Du, J.; Yang, X.; Liu, Y. Cloning and expression analysis of cinnamoyl-CoA reductase (CCR) genes in sorghum. PeerJ 2016, 4, e2005. [Google Scholar] [CrossRef] [PubMed]
  34. Ye, J.; Coulouris, G.; Zaretskaya, I.; Cutcutache, I.; Rozen, S.; Madden, T.L. Primer-blast: A tool to design target-specific primers for polymerase chain reaction. BMC Bioinform. 2012, 13, 134. [Google Scholar] [CrossRef]
  35. Cai, T.; Butler, L. Plant regeneration from embryogenic callus initiated from immature inflorescences of several high-tannin sorghums. Plant Cell Tissue Organ Cult. 1990, 20, 101–110. [Google Scholar] [CrossRef]
  36. Sai Kishore, N.; Visarada, K.B.; Aravinda Lakshmi, Y.; Pashupatinath, E.; Rao, S.V.; Seetharama, N. In vitro culture methods in sorghum with shoot tip as the explant material. Plant Cell Rep. 2006, 25, 174–182. [Google Scholar]
  37. Pola, S.; Mani, N.S.; Ramana, T. Plant tissue culture studies in Sorghum bicolor: Immature embryo explants as the source material. Int. J. Plant Prod. 2008, 2, 1–14. [Google Scholar]
  38. Rao, R.V.R.; Kumar, G.P.; Rao, M.V.S.; Manga, V. Differential in vitro response of genotypes of sorghum. Phytomorphology 2000, 50, 253–260. [Google Scholar]
  39. Gupta, S.; Khanna, V.K.; Singh, R.; Garg, G.K. Strategies for overcoming genotypic limitations of in vitro regeneration and determination of genetic components of variability of plant regeneration traits in sorghum. Plant Cell Tissue Organ Cult. 2006, 86, 379–388. [Google Scholar] [CrossRef]
  40. Shafi, A.; Gill, T.; Sreenivasulu, Y.; Kumar, S.; Ahuja, P.S.; Singh, A.K. Improved callus induction, shoot regeneration, and salt stress tolerance in Arabidopsis overexpressing superoxide dismutase from Potentilla atrosanguinea. Protoplasma 2015, 252, 41–51. [Google Scholar] [CrossRef]
  41. Chawla, H.S. Introduction to Plant Biotechnology; Science Publishers: Enfield, NH, USA, 2009. [Google Scholar]
  42. George, E.F.; Hall, M.A.; De Klerk, G.J. Stock plant physiological factors affecting growth and morphogenesis. In Plant Propagation by Tissue Culture; George, E.F., Hall, M.A., De Klerk, G., Eds.; Springer: Dordrecht, The Netherlands, 2008; pp. 403–422. [Google Scholar]
  43. Gupta, S.; Wardhan, V.; Verma, S.; Gayali, S.; Rajamani, U.; Datta, A.; Chakraborty, S.; Chakraborty, N. Characterization of the secretome of chickpea suspension culture reveals pathway abundance and the expected and unexpected secreted proteins. J. Proteome Res. 2011, 10, 5006–5015. [Google Scholar] [CrossRef] [PubMed]
  44. Rahman, M.S.; Miah, M.A.B.; Hossain, M.S.; Kabir, A.H.; Rahman, M.M. Establishment of cell suspension culture and plant regeneration in Abrus precatorius L., a rare medicinal plant. Not. Sci. Biol. 2012, 4, 86–93. [Google Scholar] [CrossRef]
  45. Angius, F.; Floris, A. Liposomes and MTT cell viability assay: An incompatible affair. Toxicol. In Vitro 2015, 29, 314–319. [Google Scholar] [CrossRef] [PubMed]
  46. Baker, C.J.; Mock, N.M. An improved method for monitoring cell death in cell suspension and leaf disc assays using evans blue. Plant Cell Tissue Organ Cult. 1994, 39, 7–12. [Google Scholar] [CrossRef]
  47. Ramos, L.Y.S.; Carballo, L.M.; Melara, M.V. Establishment of cell suspension cultures of two Costa Rican Jatropha species (Euphorbiaceae). Rev. Biol. Trop. 2013, 61, 1095–1107. [Google Scholar]
  48. Ndimba, B.K.; Chivasa, S.; Hamilton, J.M.; Simon, W.J.; Slabas, A.R. Proteomic analysis of changes in the extracellular matrix of Arabidopsis cell suspension cultures induced by fungal elicitors. Proteomics 2003, 3, 1047–1059. [Google Scholar] [CrossRef] [PubMed]
  49. Levitt, J. Responses of Plants to Environmental Stresses, 2nd ed.; Academic Press: New York, NY, USA, 1980; Volume II. [Google Scholar]
  50. Bray, E.A. Molecular responses to water deficit. Plant Physiol. 1993, 103, 1035–1040. [Google Scholar] [CrossRef]
  51. Fracasso, A.; Trindade, L.M.; Amaducci, S. Drought stress tolerance strategies revealed by RNA-seq in two sorghum genotypes with contrasting WUE. BMC Plant Biol. 2016, 16, 115. [Google Scholar] [CrossRef]
  52. Bray, E.A. Plant responses to water deficit. Trends Plant Sci. 1997, 2, 48–54. [Google Scholar] [CrossRef]
  53. Shinozaki, K.; Yamaguchi-Shinozaki, K. Molecular responses to drought and cold stress. Curr. Opin. Biotechnol. 1996, 7, 161–167. [Google Scholar] [CrossRef]
  54. Shinozaki, K.; Yamaguchi-Shinozaki, K. Gene expression and signal transduction in water-stress response. Plant Physiol. 1997, 115, 327–334. [Google Scholar] [CrossRef] [PubMed]
  55. May, M.J.; Leaver, C.J. Oxidative stimulation of glutathione synthesis in Arabidopsis thaliana suspension cultures. Plant Physiol. 1993, 103, 621–627. [Google Scholar] [CrossRef] [PubMed]
  56. Levine, A.; Tenhaken, R.; Dixon, R.; Lamb, C. H2O2 from the oxidative burst orchestrates the plant hypersensitive disease resistance response. Cell 1994, 79, 583–593. [Google Scholar] [CrossRef]
  57. Delledonne, M.; Zeier, J.; Marocco, A.; Lamb, C. Signal interactions between nitric oxide and reactive oxygen intermediates in the plant hypersensitive disease resistance response. Proc. Natl. Acad. Sci. USA 2001, 98, 13454–13459. [Google Scholar] [CrossRef] [PubMed] [Green Version]
  58. Rajasekhar, V.K.; Lamb, C.; Dixon, R.A. Early events in the signal pathway for the oxidative burst in soybean cells exposed to avirulent Pseudomonas syringae pv glycinea. Plant Physiol. 1999, 120, 1137–1146. [Google Scholar] [CrossRef] [PubMed]
  59. Ndimba, B.K.; Chivasa, S.; Simon, W.J.; Slabas, A.R. Identification of Arabidopsis salt and osmotic stress responsive proteins using two-dimensional difference gel electrophoresis and mass spectrometry. Proteomics 2005, 5, 4185–4196. [Google Scholar] [CrossRef]
  60. Chivasa, S.; Hamilton, J.M.; Pringle, R.S.; Ndimba, B.K.; Simon, W.J.; Lindsey, K.; Slabas, A.R. Proteomic analysis of differentially expressed proteins in fungal elicitor-treated Arabidopsis cell cultures. J. Exp. Bot. 2006, 57, 1553–1562. [Google Scholar] [CrossRef] [PubMed] [Green Version]
  61. Kaffarnik, F.A.; Jones, A.M.; Rathjen, J.P.; Peck, S.C. Effector proteins of the bacterial pathogen Pseudomonas syringae alter the extracellular proteome of the host plant, Arabidopsis thaliana. Mol. Cell. Proteom. 2009, 8, 145–156. [Google Scholar] [CrossRef] [PubMed]
  62. Oh, I.S.; Park, A.R.; Bae, M.S.; Kwon, S.J.; Kim, Y.S.; Lee, J.E.; Kang, N.Y.; Lee, S.; Cheong, H.; Park, O.K. Secretome analysis reveals an Arabidopsis lipase involved in defense against Alternaria brassicicola. Plant Cell 2005, 17, 2832–2847. [Google Scholar] [CrossRef] [PubMed]
  63. Ngcala, M.G. Molecular Responses of Sorghum Cell Suspension Cultures to High Temperature Stress. Master’s Thesis, University of the Free State, Bloemfontein, South Africa, 2018. [Google Scholar]
Figure 1. Callus induction results per sorghum variety. (A) Control medium without any plant growth hormones (PGH). (B) Medium supplemented with 3 mg/L of 2,4-D. (C) Medium supplemented with 4 mg/L of 2,4-D. (D) Medium supplemented with 2.5 mg/L of NAA. (E) Medium supplemented 3 mg/L of 2,4-D and 2.5 mg/L of napthaleneacetic (NAA). (F) Medium supplemented with 4 mg/L of 2,4-D and 2.5 mg/L of NAA. Data presented as mean ± SD (n = 6). Different letters above error bars denote differences in mean difference at 5% level of significance (p < 0.05).
Agronomy 09 00218 g001
Figure 2. Maintenance of friable callus and its light microscopic analysis. (A) ICSB 338 calli immediately after sub-culture. (B) The same ICSB 338 calli four-weeks post sub-culture. (C) Microscopic image of ICSB 338 callus. (D) White sorghum calli immediately after sub-culture. (E) The same White sorghum calli four-weeks post sub-culture. (F) Microscopic image of White sorghum callus. Black arrows indicate individual cells whereas dotted arrow indicate cell clusters. The microscopic images were taken using a Nikon E2000 light microscope fitted with a Nikon DMX 1200 digital camera (Nikon, Tokyo, Japan). The scale bar is 10 μm.
Agronomy 09 00218 g002
Figure 3. The establishment of ICSB 338 and White sorghum cell suspension cultures. (A) ICSB 338 callus masses on the day of cell culture initiation. (B) ICSB 338 culture suspension after two generations of sub-culture. (C) While sorghum callus masses on the day of cell culture initiation. (D) White sorghum culture suspension after two generations of sub-culture. Both ICSB 338 and White sorghum cell suspension cultures were initiated and maintained in liquid medium E (3 mg/L 2,4-D and 2.5 mg/L naphthaleneacetic (NAA)).
Agronomy 09 00218 g003
Figure 4. The growth curves and cell viability assays of sorghum cell suspension cultures. (A) Growth curve of ICSB 338. (B) Growth curve of White sorghum. The growth curve readings were done for three independent biological replicates for each seed type using the settled cell volume (SCV) method. (C) Cell viability readings of ICSB 338 and White sorghum cell cultures using the MTT assay. The cell viability readings at each time point is an average of two technical replicates from three independently established cell suspension cultures. Data presented as mean ± se (n = 3). * indicates statistically significance at a 5% level of significance according to Wilcoxon rank-sum test (p < 0.05).
Agronomy 09 00218 g004
Figure 5. Cell viability of sorghum cell cultures following osmotic stress treatment using the MTT and Evans blue assays. (A) MTT assay results of ICSB 338. (B) MTT assay results of White sorghum. (C) Evans blue assay results of ICSB 338. (D) Evans blue assay results of White sorghum. (E) Evans blue assay results for osmotic stressed samples of both ICSB 338 and White sorghum cell cultures. Osmotic stress treatment was induced with 400 mM of sorbitol while the control was treated with distilled water for the period of 72 h. The cell viability readings at each time point is an average of two technical replicates from three independently established cell suspension cultures. Data presented as mean ± SD (n = 3). * indicates statistically significance at a 5% level of significance according to a Student’s t-test (p < 0.05).
Agronomy 09 00218 g005
Figure 6. Light microscopic analysis of sorghum cell cultures following osmotic stress treatment. (A) ICSB 338 cells following 72 h osmotic stress. (B) White sorghum cells following 72 h osmotic stress. Eight-day old cell cultures were treated with distilled water (controls), and 400 mM sorbitol (treated) for 72 h. Microscopic images were taken using a fitted light microscope DeltaPix digital camera at a magnification of 40 × . CW indicates cell wall; ECS, extracellular space; PM, plasma membrane; CC, cytoplasmic contents; N, nucleus; and SC, compressed cytoplasm. The scale bar is 10 μm.
Agronomy 09 00218 g006
Figure 7. Sorbitol-induced gene expression in sorghum cell suspension cultures. ICSB 338 and White sorghum cell suspension cultures were exposed to 400 mM sorbitol-induced osmotic stress for 72 h. The cell cultures were harvested at 0, 6, 24, 48 and 72 h for quantitative real-time polymerase chain reaction (qRT-PCR). Error bars represent mean ± SE (n = 3). *, ** and *** indicate significant differences between ICSB 338 and White sorghum means at each time point, p ≤ 0.05, 0.01, and 0.001, respectively.
Agronomy 09 00218 g007
Table 1. List of primer sequences of sorghum genes used in quantitative real-time polymerase chain reaction (qRT-PCR) analysis.
Target Gene ID aForward PrimerReverse Primer
SORBI_3008G1347005′-CCCATCCACTGGAACGAGAC-3′5′-ACTGCGTCCAGATGAGGTTG-3′
SORBI_3001G5142005′-GGAACATCCTGGCGCATTTG-3′5′-AGAGCCAGACCGACACAAAC-3′
SORBI_3003G1362005′-TGCCACGCACAGAATACGAG-3′5′-TACACATGCCGGAGAATCGG-3′
SORBI_3006G1355005′-AGGGAAATGGTTGTACGGGC-3′5′-GTGCTGGTGCACAAAATATATAGC-3′
SORBI_3007G1496005′-TGCTCTCGTGAGATCGCTTG-3′5′-GCAATACCACTGCGTATCTGTTG-3′
SORBI_3001G3132005′-GGATCCCTGGATCTTCTGGAG-3′5′-TTTGGTGGCTCTGTGGTCAG-3′
SORBI_3001G0739005′-CTTCTTCAACACACGCGACC-3′5′-GTGTGGTGACGGATGGTAGG-3′
SORBI_3003G3224005′-AACGAGTATATGCATCCCCG-3′5′-AGCAGGCTCTAGGGTTTTGAG-3′
Sb04g003390 *5′-GATGAGATGCTCTCCCGTGG-3′5′-TGATCTCTAGGGCCTCTGGG-3′
Sb03g038910 *5′-TCCTGAAGCATCTTTCCCTCC-3′5′-ACAGCCTGATTAGTTGGGGG-3′
a Target gene IDs obtained from the Uniprot database. * Reference control genes.

