The Effect of Phosphorus and Root Zone Temperature on Anthocyanin of Red Romaine Lettuce
by
 ,
,
Mohammad Zahirul Islam
1 ,
,
Young-Tack Lee
1,
Mahmuda Akter Mele
2,
In-Lee Choi
2,3 and
Ho-Min Kang
2,3,* 1
Department of Food Science and Biotechnology, Gachon University, Seongnam 13120, Korea
2
Agriculture and Life Science Research Institute, Kangwon National University, Chuncheon 200-701, Korea
3
Division of Horticulture and Systems Engineering, Program of Horticulture, Kangwon National University, Chuncheon 24341, Korea
*
Author to whom correspondence should be addressed.
Agronomy 2019, 9(2), 47; https://doi.org/10.3390/agronomy9020047
Submission received: 3 January 2019
/
Revised: 21 January 2019
/
Accepted: 22 January 2019
/
Published: 24 January 2019
(This article belongs to the Section Horticultural and Floricultural Crops)
Abstract
:In this study, phosphorus (P) strength [(full strength: 1×-P, half strength: 0.5×-P and zero strength: 0×-P)] and root zone temperature (10 and 15 °C RZT) were investigated in red romaine lettuce to determine their effects on anthocyanin content. This experiment was conducted using a deep-flow technique (DFT) hydroponic system in a greenhouse during the winter in Gangwon province in the Korea Republic. The treatments were 1×-P (15 and 10 °C RZT), 0.5×-P (15 and 10 °C RZT) and 0×-P (15 and 10 °C RZT). The results showed that the P (phosphorus), K (potassium) and Ca (calcium) accumulation contents were lower in the 0×-P -treated red romaine lettuce leaves than in the other treatments. The maximum red romaine lettuce yields per plant, leaf number and leaf length were exhibited during the 1×-P at 15 °C RZT treatment. In 0×-P at 10 °C, RZT treatment showed lower leaf color values of L*, b*, chrome, ºh and higher leaf color a* values. Moreover, in the 0×-P treatment at 10 °C RZT, the leaf chlorophyll content (SPAD), chlorophyll a, chlorophyll b and chlorophyll total were the lowest. Anthocyanin content was the highest in the 0×-P treatment, followed by 0.5×-P and 1×-P treatments at both 15 and 10 °C RZT. Regardless of the P intensity treatment, anthocyanin content was higher at 10 °C RZT than at 15 °C RZT. In summary, the 1×-P at 15 °C RZT treatment is the best for red romaine lettuce leaf yield, and the 0×-P at 10 °C RZT treatment is the best for lettuce leaf anthocyanin content.
1. Introduction
Lettuce (Lactuca sativa L.) is a widely cultivated leafy vegetable. According to AFRA [1], the lettuce harvest area is 3387 hectares, and the production is 86128 tonnes in Korea. Lettuce cultivation in a controlled environment in winter is increasing daily due to greenhouses. However, improper treatment may lead to production costs and decreased anthocyanin content, which is beneficial to human health. Anthocyanin is associated with antioxidant, anticarcinogenic and anti-inflammatory properties that protect from the risk of cancer, heart disease, diabetes and cognitive function disorders [2].
Nutrient solution concentration is a vital factor of soil-less culture used to grow lettuce [3]. High nutrient concentrations promote ion toxicity, nutrient imbalance and osmotic stress, and low nutrient concentrations lead to nutrient deficiencies [4]. Lowering the root zone temperature in lettuce reduces the water and nutrient solution absorption [5]. P treatment may control flower stalk anthocyanin synthesis by regulating the epidermal pH value and enzymatic activity [6]. A nutrient solution with a low ion concentration showed higher anthocyanin production in the Lollo Rosso genotype, and a medium ion concentration showed higher anthocyanin production in the Red Oak Leaf genotype of lettuce [7].
Red romaine lettuce contains anthocyanin, which is a pigment that has antioxidant activity. Cell vacuoles accumulate anthocyanin mainly in the leaves, flowers, stems, seeds and other plant tissues of fruits and vegetables [8]. Increased anthocyanin content is good for consumers due to its beneficial health compounds.
The red color of leafy vegetables is attractive to consumers who look for a functional agricultural product. Lower growing temperatures and shorter periods are important to maximize economic returns from lettuce, which is a notable source of minerals, such as calcium (Ca), iron (Fe) and magnesium (Mg) [9]. The plant growth parameters (plant yield, leaf dry matter, fresh root weight, root length, root dry matter, leaf number, leaf length, leaf width), pigments (carotenoid, chlorophyll and anthocyanin) are important factors for cost-benefit analysis. Increased yield and anthocyanin content are expected, which can fulfill the consumers’ as well as the growers’ demands. Anthocyanin is a pigment that may increase in leaf lettuce during production in a controlled environment. This study was conducted to determine the effect of P strength [(full strength: 1×-P, half strength: 0.5×-P and zero strength: 0×-P)] and root zone temperature (15 and 10 °C RZT) on anthocyanin in red romaine lettuce.
2. Materials and Methods
2.1. Lettuce Growing Environment
Lettuce (Lactuca sativa L. cv. romaine) was grown with a deep-flow technique (DFT) hydroponic system in a greenhouse during the winter in Gangwon province in Korea Republic. The average growing atmosphere temperature (day/night), relative humidity (day/night) and carbon dioxide concentration (day/night) were maintained at 19.29/11.41 °C (Figure 1), 28.68/34.08%, and 448.30/461.43 ppm, respectively, in the greenhouse during the treatment.
2.2. Lettuce and Treatments
After 30 days of plug tray sowing, the seedlings (16 seedlings in each treatment and total seedlings were 96 for 6 treatments) were transplanted to the DFT system. Three phosphate strengths [(full strength: 1×-P, half strength: 0.5×-P and zero strength: 0×-P)] and two root zone temperatures (15 and 10 °C RZT) were treated to confirm the proper phosphate strength and root zone temperature for enhancing the anthocyanin content of red romaine lettuce grown in hydroponics.
The nutrient solution contained NO3–N (nitrate-nitrogen) 13, NH4–N (ammonium-nitrogen) 1.17, PO4–P (phosphate–phosphorus) 3.5, K (potassium) 9, Ca (calcium) 4, Mg (magnesium) 2, SO4–S (sulfate–sulphur) 2, Fe (iron) 0.07, B (boron) 0.14, Mn (manganese) 0.018, Zn (zinc) 0.002, Cu (cupper) 0.0006, and Mo (molybdenum) 0.0013 (me L−1) (Table 1). In the reducing P treatment, the other nutrient contents were constant. In the 0.5×-P strength, NH4–N 0.60 [NH4Cl (ammonium chloride)] and PO4–P 1.75 [NH4H2PO4 (ammonium dihydrogen phosphate)] (me L−1) were used in the nutrient solution. Moreover, in the 0×-P strength, NH4–N 0.60 [NH4Cl] and NH4–N 0.60 [(NH4)2SO4 (ammonium sulphate)] were used in the nutrient solution.
From germination to the seedling stage (days 0–15, 15 days), there was no additional nutrient solution added to the plug tray; only mixed peat moss and perlite (1:1, v/v) were added to the plug tray for seed germination. The 0.4× nutrient solution was supplied to the seedling stage (days 16–30, 15 days) with low electrical conductivity (EC) (0.75 dS m−1 EC and 6.0–6.5 pH). In the hardening stage in the DFT system, 0.4× nutrient solution (days 31–45, 15 days) with low EC strength (0.75 dS m−1 EC and 6.0–6.5 pH) was applied. Afterwards, it was adjusted to 1.80 dS m−1 EC and 6.0–6.5 pH. Every week, the nutrient solution was renewed and EC and pH (1.80 dS m−1 EC and 6.0–6.5 pH) were maintained, supplied by the DFT system (Table 2). The treatments were 1×-P (15 and 10 °C RZT), 0.5×-P (15 and 10 °C RZT) and 0×-P (15 and 10 °C RZT).
The nutrients were supplied to the DFT (deep flow technique) system which included PVC (polyvinyl chloride) trays that were 4 m long, 0.15 m wide and 0.20 m deep and were regulated by an electric pump set at a rate of 60 L/min [10]. Lettuce treatment started after the 15th day of transplanting to the DFT system. This treatment continued for 28 days, and during the treatment, we analyzed the leaf number, leaf length, leaf width, chlorophyll, and color value (L*, a*, b*, chrome and ºh). The lettuce experiments were conducted on days 0–30 (30 days) in plug trays, days 31–45 (15 days) in the DFT system for hardening and days 46–73 (28 days) in the DFT system during different treatments. The 73-day-old lettuce was harvested to measure the harvest time (20 °C) quality parameters.
2.3. Mineral Contents of Red Romaine Lettuce
Minerals were analyzed according to the Islam et al. [11] methods. Briefly, 0.50 ± 0.005 g of dried lettuce (80 °C) powder ashes with 10 mL of 69% nitric acid (HNO3) and 2 mL of 30% hydrogen peroxide (H2O2) were dissolved in a CEM microwave (MARS 5, Microwave Reaction System, CEM Corporation, and England) for 1 h at 175 °C. Inductively coupled plasma-atomic emission spectroscopy (Integra XL Dual, GBC, and Melbourne, Victoria, Australia) was used to measure mineral content.
2.4. Growth Parameters
Plant yield, leaf dry matter, fresh root weight, root length and root dry matter were measured. Leaf and root dry matter were measured by drying the sample at 80 °C. Leaf number, leaf length, leaf width and chlorophyll were recorded. A SPAD-502 Plus chlorophyll meter (Konica Minolta Sensing, Inc., Osaka, Japan) was used to measure the chlorophyll value. A Chroma Meter CR 400 Model (Konica Minolta Sensing, Inc., Osaka, Japan) was used to measure the lettuce leaf color value (L*, a*, b*, chrome and ºh) [12].
2.5. Chlorophyll (chl a, chl b and chl Total) and Anthocyanin Contents
The chlorophyll of fresh leaf red romaine lettuce (0.10 g) was extracted with 5 mL N,N-dimethylformamide overnight. The supernatant was measured by a UV-1601 spectrophotometer (Shimadzu, Kyoto, Japan) at 647 nm and 664 nm. Chl a and chl b values were determine according to the equations of Moran [13].
The total anthocyanin content was measured with a UV spectrophotometer (Shimadzu Corporation, Tokyo, Japan) at a 530 nm absorbance wavelength. Each 1 g leaf was extracted for 24 hours at 4 °C in dark conditions into 5 mL of 95% ethanol/1.5 N HCl (85:15, v:v). The anthocyanin was calculated according to the following formula: anthocyanin (mg/100 g fresh wt.) = (absorbance at 530 nm × volume of extraction solution × 100)/(wt. of sample of gm × 98.2). (Note, here, 98.2 is the factor of molar absorption value for the acid–ethanol solvent).
2.6. Statistical Analyses
Statistical Package for the Social Sciences (SPSS) V. 16 (SPSS Inc., Chicago, USA) was used to perform the statistical analysis of data. Differences between conditions were analyzed by a DMRT following a one-way ANOVA. In addition, Pearson correlation was analyzed between two parameters by SPSS.
3. Results
3.1. Mineral Contents of Red Romaine Lettuce
Regarding the N (nitrogen) absorption rates, the 0×-P at 15 °C RZT treatment appeared to be the highest (Table 3). Maximum N absorption occurred due to balancing the anion and cation concentrations of the root zone area. At 10 °C, the RZT (1×-P and 0.5×-P) treatments displayed low phosphorus (P) content due to the low temperature; as a result, the lettuce leaf color changed from green to reddish. High RZT showed high nutrient contents in red romaine leaf lettuce. Among the treatments, the 0×-P at 10 °C RZT treatment had the highest Fe (iron) content, which may have occurred due to the acidic condition of the nutrient solution (≤5.5 pH) during absorption. The Cl (chlorine) content was higher in the 0.5×-P and 0×-P treatments than in the 1×-P treatment because we added Cl with NH4Cl (ammonium chloride) to adjust the NH4 content. The PO4–P (phosphate–phosphorus) uptake depends on temperature because 15 °C RZT is more suitable for the uptake of PO4–P than 10 °C RZT.
3.2. Plant Yield, Leaf Dry Matter, Fresh Root Weight, Root Length and Root Dry Matter
The yield of red romaine lettuce was directly proportional to the phosphorus (P) content of the nutrient solution and the root zone temperature (RZT) (Table 4). At 10 °C RZT, regardless of whether the P strength was 1×-P or 0.5×-P, yields of red romaine lettuce plants were lower than other treatments due to the effects of a low RZT. At 15 °C RZT, greater yields were displayed than at 10 °C RZT. The lower temperature and P deficiency prohibited the growth and development of roots. The 0×-P (10 °C and 15 °C RZT) treatments displayed longer root lengths than the 0.5×-P treatments (10 °C and 15 °C RZT) or even the 1×-P (10 °C and 15 °C RZT) treatments. At 15 °C, RZT (1×-P, 0.5×-P and 0×-P) treatments, root length was significantly longer than with 10 °C RZT (1×-P, 0.5×-P and 0×-P) treatments, which may have occurred due to the increased temperature. Leaf and root dry matter exhibited higher values in the 0×-P (15 °C or 10 °C RZT) treatments compared with the other treatments because low RZT probably suppressed water absorption. Plant yield and leaf dry matter showed a negatively significant (p ≤ 0.01) correlation that may have occurred due to more nutrient content solution being absorbed by the 1×-P treatment at 15 °C RZT.
3.3. Leaf Number, Leaf Length, Leaf Width and Leaf Chlorophyll Content (SPAD)
In this experiment, the 15 °C RZT treatment resulted in a higher leaf number than the 10 °C RZT treatment (Table 5). In the 0×-P at 10 °C RZT treatment, the leaf length and the leaf width were the lowest because low temperature and 0×-P treatment suppresses the growth of red romaine lettuce leaf plants. There was a positively significant (p ≤ 0.01) correlation found between leaf length and leaf width. A higher root zone temperature (15 °C RZT) resulted in a higher leaf chlorophyll content (SPAD) than a lower root zone temperature (10 °C RZT), regardless of the P strength.
3.4. Leaf Color Value (L*, a*, b*, Chrome and ºh)
In the 0×-P treatment at the 10 °C root zone temperature (RZT), red romaine lettuce leaf exhibited the maximum color value of a* and the minimum color values of L*, b*, chrome and ºh (Table 6). The color values of b*, chrome and ºh showed significant differences in all treatments. Significant (p ≤ 0.01) negative Pearson correlations were found between the color values of a* and b* which indicates that if the color value of a* increases then the color value of b* decreases.
3.5. Chlorophyll (chl a, chl b and chl Total) and Anthocyanin Content
The chlorophyll (chl a, chl b and chl total) contents were lower in the 0×-P with the 10 °C RZT treatment when compared to the other treatments. Chlorophyll a, chlorophyll b and chlorophyll total had significant differences among the treatments (Table 7).
Anthocyanin content was maximum in the 0×-P treatment at 10 °C RZT, followed by the treatments with 0×-P at 15 °C RZT, 0.5×-P at 10 °C RZT, 1×-P at 10 °C RZT, 0.5×-P at 15 °C RZT and 1×-P at 15 °C RZT. Moreover, the 10 °C RZT treatment showed a significantly higher anthocyanin content than the 15 °C RZT treatment. Total chlorophyll and anthocyanin contents showed a significantly negative correlation (p ≤ 0.01).
4. Discussion
4.1. Mineral Contents of Red Romaine Lettuce
Phosphorus uptake was inhibited by the 10 °C root zone temperature (RZT) (1×-P and 0.5×-P). Mineral uptake requires energy for active transport by root respiration, but a low temperature suppresses root respiration [14]. Moreover, Lee et al. [15] reported that lettuce reduced evapotranspiration, and mineral uptake (P (phosphorus) > K (potassium) > NO3−) and increased electrolyte leakage at low temperatures. However, an elevated root zone temperature increased the uptake of P in melons and cucumbers [16,17]. In lettuce, an increased root zone temperature increased the mineral uptake rate [18].
Nutrient absorption is higher at high temperatures than at low temperatures in cucumbers and leafy vegetables, because low temperatures suppress water absorption [17,19]. Absorption of N, P, K, Ca, Mg, Fe and Cl is influenced by P strength and the RZT of the nutrient solution. The NO3–N (nitrate–nitrogen) absorption trends resulted from the PO4–P (phosphate–phosphorus) and the PO4–P absorption resulting from NH4–N (ammonium–nitrogen). The absorption of NH4–N increased, probably due to the increased pH (≥6). When NH4–N is taken up by plant roots, plant roots leak hydrogen ions and, as a result, the pH is lowered (acidity increases); when plants prefer to uptake NO3–N, then hydroxyl ions are leaked by plant roots, thus the pH increases (acidity decreases) [19]. Park et al. [19] also mentioned that low temperatures promote the absorption of NH4–N and high temperatures lead to absorbed NO3–N in roots because the former lowers the pH by leaking hydrogen ions and the latter increases the pH by leaking hydroxyl ions in roots. If the temperature increases from 15 °C to 25 °C, the NO3 content increases in lettuce plants due to nitrate reductase and glutamine synthase, which are involved in nitrogen metabolism in lettuce plants [20].
The NO3–N, NH4–N, K and PO4–P uptake and assimilation are influenced by enzymes, substrate concentration, internal concentration, species and temperature [17,21,22,23]. Possibly, the reduction of PO4− in the nutrient solution will increase the uptake of other anions (mostly NO3− in the nutrient solution) by the plant. The reduction in the uptake rate of mineral nutrients at a low temperature was followed by reductions in potassium, nitrate and nitrogen [24]. Low P reduced leaf 3-phosphoglycerate (PGA) and ribulose-1,5-bis-phosphate, and, as a result, photosynthetic CO2-fixation was limited, Calvin cycle enzyme activity reduced and adenosine triphosphate (ATP)/adenosine diphosphate (ADP), nicotinamide adenine dinucleotide phosphate (NADPH)/nicotinamide adenine dinucleotide phosphate (NADP+) and triose-phosphate (TP)/PGA ratios were increased in plants [25]. Therefore, the optimum RZT and optimum P content can influence the mineral content uptake of red romaine lettuce plants.
4.2. Plant Yield, Leaf Dry Matter, Fresh Root Weight, Root Length and Root Dry Matter
P deficiency reduced Brassica cultivars and kale growth and development [6,26]. The yield of red romaine lettuce plants showed a significant difference between the P strengths and RZT treatments. High temperatures in the root zone showed high plant growth and yield compared with low temperatures [19,27]. Similarly, Boo et al. [28] reported that temperatures of 20/13 °C (day/night) are reasonable to grow lettuce. In this experiment, the 15 °C root zone temperature (RZT) (day/night) gave the maximum yield of red romaine lettuce.
The 0×-P treatment had the lowest fresh root weight at 10 °C RZT, because a lower temperature promotes water stress that hampers leafy vegetable root growth [27], and a small head is produced. Moreover, P deficiency reduced the kale fresh root weight [6].
The low RZT suppressed the growth of root hair. Clarkson et al. [22] agreed that high temperature increases root length when compared to a low temperature because a low temperature inhibits the transport process of nutrients. In this experiment, low temperature treatments (1×-P, 0.5×-P and 0×-P) suppressed root growth. In cucumber, at low temperatures, the root growth is limited [17], and nutrient uptake is hampered due to decreased hydraulic conductivity and root pressure [29].
The treatment at 10 °C RZT produced more leaf dry matter than at 15 °C, regardless of the P strength. Becker et al. [30] reported that dry matter content in lettuce was higher at temperatures of 12/7 °C (day/night) when compared to 20/15 °C (day/night). In addition, Luna et al. also found that dry matter was more abundant in winter growing lettuce than in summer growing lettuce [7]. Dry matter of red romaine lettuce results from a dilution effect, [19] and this effect mainly occurs in those plant parts that receive more water. In addition, increased dry matter content probably results from the trade-off in resource allocation between the vegetative, root and fruit growth parts of the plant [31]. Therefore, 0×-P and low temperature increase the leaf and root dry matter in red romaine lettuce.
4.3. Leaf Number, Leaf Length, Leaf Width and Leaf Chlorophyll Content (SPAD)
At 20/15 °C (day/night), the temperature appeared to promote a higher lettuce leaf number than at 12/7 °C (day/night), because this temperature influenced the metabolic process and quickened the growth of leaf lettuce [30]. Moreover, Costa et al. [32] reported that a 20 °C temperature promoted the maximum number of leaves in corn salad baby leaf plants compared to 15 °C or even 25 °C.
The leaf length and the leaf width were lower in the 0×-P at 10 °C RZT treatment compared with other treatments. This is related to Hoque et al.’s [33] finding that suboptimal application of P causes slower leaf growth due to less cell expansion and suppression of photosynthesis. Moreover, lower leaf number and leaf lengths were observed in kale in a P-deficit treatment [6].
The nutrient solution at 20 °C exhibited a higher leaf chlorophyll content (SPAD) than the 15 °C nutrient solution, but the 25 °C nutrient solution showed the lowest leaf chlorophyll content (SPAD) among those temperatures in corn salad baby leaf [32]. Moreover, the 0×-P and 10 °C RZT treatment manifested the lowest leaf chlorophyll content (SPAD) among the treatments. The energy process is difficult without P nutrients [34], and this limits photosynthesis [35]. Therefore, an elevated RZT (15 °C) increases the leaf number, leaf length, leaf width, and leaf chlorophyll content of red romaine lettuce compared with a lower RZT (10 °C).
4.4. Leaf Color Value (L*, a*, b*, Chrome and ºh)
The red lettuce displayed lower color values of L* and chrome, which is in agreement with Mampholo et al. [36]. In the 0×-P treatment at 10 °C RZT, the hue angle (ºh) decreased in lettuce leaves. This is related to Gazula et al.’s [37] finding that if anthocyanin increases, then the hue angle (ºh) decreases in lettuce leaves.
4.5. Chlorophyll (chl a, chl b and chl Total) and Anthocyanin Content
The 1×-P treatment at 15 °C RZT showed elevated chlorophyll a, chlorophyll b and chlorophyll total. In kale, low and deficit P treatments exhibited lower chlorophyll contents than the normal treatment [6]. In addition, the photoreceptor (photochromic) is anthocyanin (red pigment), which prevents photoinhibition and photodamage by the absorption of solar radiation and perhaps could be absorbed by chloroplast pigments [38]. The 0×-P treatment of 10 °C RZT decreased the chlorophyll (chl a, chl b and chl total) content and increased the anthocyanin content of red romaine lettuce leaf. The treatments with higher anthocyanin contents accumulated a lower P content. Temperatures of 13/10 °C (day/night) displayed higher anthocyanin contents than temperatures of 30/25 °C (day/night) when growing lettuce [28,30]. Gazula et al. [39] found that the accumulation of anthocyanin content with temperatures of 20/20 °C (day/night) was higher than with temperatures of 30/30 °C (day/night) when growing lettuce. A comparatively lower temperature most likely leads to the accumulation of a greater anthocyanin content due to the lower rate of photosynthesis (phytochrome) and the lower accumulation of P by lettuce. Arabidopsis thaliana and kale exhibited increased anthocyanin content when there was a P deficit [6,40]. Anthocyanin is also influenced by chlorophyll [41]. For instance, if anthocyanin increases, then the chlorophyll content decreases. Becker et al. [30] reported that low temperatures slow the enzymatic activity of photosynthesis, as light intercepts and photosynthetic electron transport in chloroplast thylakoid membranes is interrupted. Therefore, low temperature (10 °C RZT) and 0×-P growing red romaine lettuce plants increase the accumulation and synthesis of anthocyanin.
5. Conclusions
In this experiment, the effects of P (1×-P, 0.5×-P and 0×-P) and RZT treatments on anthocyanin in red romaine lettuce were investigated. The 1×-P treatment showed elevated yields per plant, leaf number and leaf length in red romaine lettuce at 15 °C RZT. Moreover, the 0×-P at 10 °C RZT treatment displayed lower leaf color values of L*, b*, chrome and ºh and higher leaf color values of a* than in other treatments. Furthermore, the 0×-P treatment at 10 °C RZT exhibited the lowest leaf chlorophyll contents (SPAD) for chlorophyll a, chlorophyll b and chlorophyll total, and the highest anthocyanin content among the treatments. In conclusion, treatments with 1×-P at 15 °C RZT and 0×-P at 10 °C RZT could be useful for the yield and anthocyanin content, respectively. These research methods and findings will help to produce enhanced red romaine lettuce leaf anthocyanin content in DFT hydroponic systems in greenhouses during the winter to fulfill consumer demands.
Author Contributions
Conceptualization, M.Z.I. and H.M.K.; Methodology, M.Z.I. and M.A.M.; Software and Formal Analysis, M.Z.I. and M.A.M.; Investigation, M.Z.I. and H.M.K.; Data Curation, M.Z.I. and M.A.M.; Writing—Original Draft Preparation M.Z.I. and M.A.M.; Writing—Review & Editing, M.Z.I., Y.T.L. M.A.M. and H.M.K.; Supervision, H.M.K.; Funding Acquisition, H.M.K.
Funding
This work was supported by the Korea Institute of Planning and Evaluation for Technology in Food, Agriculture, Forestry (IPET) through the Agri-Bio Industry Technology Development Program, funded by the Ministry of Agriculture, Food and Rural Affairs (MAFRA) (117038-03-1-SB010).
Conflicts of Interest
There is no conflict of interest.
References
- AFRASTAT. Agriculture, Food and Rural Affairs Statistics Yearbook; Ministry of Agriculture, Food and Rural Affairs, Republic of Korea, Director-General for Policy Planning Bureau: Sejong, Korea, 2017; p. 104. [Google Scholar]
- Tsormpatsidis, E.; Henbest, R.G.C.; Davis, F.J.; Battey, N.H.; Hadley, P.; Wagstaffe, A. UV irradiance as a major influence on growth, development and secondary products of commercial importance in Lollo Rosso lettuce “Revolution” grown under polyethylene films. Environ. Exp. Bot. 2008, 63, 232–239. [Google Scholar] [CrossRef]
- Sublett, W.L.; Barickman, T.C.; Sams, C.E. The effect of environment and nutrients on hydroponic lettuce yield, quality, and phytonutrients. Horticulturae 2018, 4, 1–15. [Google Scholar]
- Fallovo, C.; Rouphael, Y.; Rea, E.; Battistelli, A.; Colla, G. Nutrient solution concentration and growing season affect yield and quality of Latuca sativa L. var. acephala in floating raft culture. J. Sci. Food Agric. 2009, 89, 1682–1689. [Google Scholar] [CrossRef]
- Nozzi, V.; Graber, A.; Schmautz, Z.; Mathis, A.; Junge, R. Nutrient management in aquaponics: comparison of three approaches for cultivating lettuce, mint and mushroom herb. Agronomy 2018, 8, 27. [Google Scholar] [CrossRef]
- Chen, R.; Song, S.; Li, X.; Liu, H.; Huang, D. Phosphorus deficiency restricts plant growth but induces pigment formation in the flower stalk of Chinese kale. Hortic. Environ. Biotechnol. 2013, 54, 243–248. [Google Scholar]
- Luna, M.C.; Martınez-Sanchez, A.; Selma, M.V.; Tudela, J.A.; Baixaulib, C.; Gil, M.I. Influence of nutrient solutions in an open-field soilless system on the quality characteristics and shelf life of fresh-cut red and green lettuces (Lactuca sativa L.) in different seasons. J. Sci. Food Agric. 2013, 93, 93415–93421. [Google Scholar] [CrossRef]
- Goto, T.; Kondo, T. Structure and molecular stacking of anthocyanins-flower color variation. Angew. Chem. Int. Ed. 1991, 30, 17–33. [Google Scholar]
- Sublett, W.L.; Barickman, T.C.; Sams, C.E. Effects of elevated temperature and potassium on biomass and quality of dark red ‘Lollo Rosso’ lettuce. Horticulturae 2018, 4, 11. [Google Scholar] [CrossRef]
- Islam, M.Z.; Mele, M.A.; Choi, K.Y.; Kang, H.M. Nutrient and salinity concentrations effects on quality and storability of cherry tomato fruits grown by hydroponic system. Bragantia 2018, 77, 385–393. [Google Scholar]
- Islam, M.Z.; Mele, M.A.; Baek, J.P.; Kang, H.M. Cherry tomato qualities affected by foliar spraying with boron and calcium. Hortic. Environ. Biotechnol. 2016, 57, 46–52. [Google Scholar] [CrossRef]
- Mele, M.A.; Islam, M.Z.; Baek, J.P.; Kang, H.M. Quality, storability, and essential oil content of Ligularia fischeri during modified atmosphere packaging storage. J. Food Sci. Technol. 2017, 54, 743–750. [Google Scholar] [CrossRef] [PubMed]
- Moran, R. Formulate for determination of chlorophyllous pigments extracted with N,N-dimethylformamide. Plant Physiol. 1982, 69, 1376–1381. [Google Scholar] [CrossRef] [PubMed]
- Tachiban, S. Effect of root temperature on the rate of water and nutrient absorption in cucumber cultivars and figleaf gourd. J. Jpn. Soc. Hort. Sci. 1987, 55, 461–467. [Google Scholar] [CrossRef]
- Lee, S.; Jung, J.; Sung, J.; Ha, S.; Lee, D.; Kim, T.; Song, B. Responses of nutrient uptake, carbohydrates and antioxidants against low temperature in plants. C.N.U. J. Agric. Sci. 2014, 41, 75–83. [Google Scholar]
- Urrestarazu, M.; Salas, M.C.; Valera, D.; Go´me, A.; Mazuela, P.C. Effects of heating nutrient solution on water and mineral uptake and early yield of two cucurbits under soilless culture. J. Plant Nutr. 2008, 31, 527–538. [Google Scholar] [CrossRef]
- Yan, Q.; Duan, Z.; Mao, J.; Li, X.; Dong, F. Effects of root-zone temperature and N, P, and K supplies on nutrient uptake of cucumber (Cucumis sativus L.) seedlings in hydroponics. Soil. Sci. Plant Nutr. 2012, 58, 707–717. [Google Scholar] [CrossRef]
- Albornoz, F.; Lieth, J.H. Diurnal macronutrients uptake patterns by lettuce roots under various light and temperature levels. J. Plant Nutr. 2015, 38, 2028–2043. [Google Scholar] [CrossRef]
- Park, K.W.; Chiang, M.H.; Won, J.H.; Jang, K.H. The effect of nutrient solution temperature on the absorption of water and minerals in Chinese leafy vegetables. J. Kor. Soc. Hort. Sci. 1995, 36, 309–316. [Google Scholar]
- Lee, E.H.; Kim, B.Y.; Lee, K.D.; Lee, J.W.; Kwon, Y.S. Nitrate content and activities of nitrate reductase and glutamine synthetase as affected by temperature and pH of nutrient solution in leaf lettuce and water dropwort. Kor. J. Soc. Hort. Sci. 1998, 39, 157–160. [Google Scholar]
- Syrett, P.J. Nitrogen metabolism of microalgae. Can. Bull. Fish Aquati. Sci. 1981, 210, 182–210. [Google Scholar]
- Clarkson, D.T.; Hopper, M.J.; Jones, L.H.P. The effect of root temperature on the uptake of nitrogen and the relative size of the root system in Lolium perenne. I. Solutions containing both NH4+ and NO3−. Plant Cell Environ. 1986, 9, 535–545. [Google Scholar]
- Pedersen, A.; Kraemer, G.; Yarish, C. The effects of temperature and nutrient concentrations on nitrate and phosphate uptake in different species of Porphyra from Long Island Sound (USA). J. Exp. Mar. Biol. Ecol. 2004, 312, 235–252. [Google Scholar] [CrossRef]
- Mackay, A.D.; Barber, S.A. Soil temperature effects on root growth and phosphorous uptake by com. Soil Sci. Soc. Amer. J. 1984, 48, 818–823. [Google Scholar] [CrossRef]
- Fredeen, A.L.; Raab, T.K.; Rao, I.M.; Terry, N. Effects of phosphorus nutrition on photosynthesis in Glycine max (L.) Merr. Planta 1990, 181, 399–405. [Google Scholar] [PubMed]
- Akhtar, M.S.; Oki, Y.; Adachi, T. Genetic diversity in Brassica cultivars under deficiently buffered P-stress environment: I. Biomass accumulation, P-concentration, P-uptake, and related growth parameters. J. Am. Sci. 2007, 3, 55–63. [Google Scholar]
- Hurd, R.G.; Graves, C.J. Controlling the water supply. Grower 1981, 96, 21–22. [Google Scholar]
- Boo, H.O.; Heo, B.G.; Gorinstein, S.; Chon, S.U. Positive effects of temperature and growth conditions on enzymatic and antioxidant status in lettuce plants. Plant Sci. 2011, 181, 479–484. [Google Scholar] [CrossRef] [PubMed]
- Lee, S.H.; Singh, A.P.; Chung, G.C.; Ahn, S.J.; Noh, E.K.; Steudle, E. Exposure of roots of cucumber (Cucumis sativus) to low temperature severely reduces root pressure, hydraulic conductivity and active transport of nutrients. Physiol. Plant. 2004, 120, 413–420. [Google Scholar]
- Becker, C.; Klaering, H.-P.; Kroh, L.W.; Krumbein, A. Cool-cultivated red leaf lettuce accumulates cyaniding-3-O-(6˝-O-malonyl)-glucoside and caffeoylmalic acid. Food Chem. 2014, 146, 404–411. [Google Scholar]
- Bordonaba, J.G.; Terry, L.A. Manipulating the taste-related composition of strawberry fruits (Fragaria ananassa) from different cultivars using deficit irrigation. Food Chem. 2010, 122, 1020–1026. [Google Scholar]
- Costa, L.D.; Tomasi, N.; Gottardi, S.; Iacuzzo, F. The effect of growth medium temperature on corn salad [Valerianella locusta (L.) Laterr] baby leaf yield and quality. HortScience 2011, 46, 1619–1625. [Google Scholar]
- Hoque, M.M.; Ajwa, H.; Othman, M.; Smith, R.; Cahn, M. Yield and postharvest quality of lettuce in response to nitrogen, phosphorus and potassium fertilizers. HortScience 2010, 45, 1539–1544. [Google Scholar]
- Fernandez-Falcon, M.; Hernandez, M.; Alvarez, C.E.; Borges, A.A. Variation in nutrition along time and relative chlorophyll content of Leucospermum cordifolium cv. ‘High Gold’, and their relationship with chlorotic symptoms. Sci. Hortic. 2006, 107, 373–379. [Google Scholar]
- Mengel, K.; Kirkby, E.H. Principles of Plant Nutrition; Kluwer Academic Publishers: Boston, MA, USA, 2001. [Google Scholar]
- Mampholo, B.M.; Maboko, M.M.; Soundy, P.; Sivakumar, D. Phytochemicals and overall quality of leafy lettuce (Lactica sativa L.) varieties grown in closed hydroponic system. J. Food Qual. 2016, 39, 805–815. [Google Scholar] [CrossRef]
- Gazula, A.; Kleinhenz, M.D.; Scheerens, J.C.; Ling, P.P. Anthocyanin levels in nine lettuce (Lactuca sativa) cultivars: influence of planting date and relations among analytic, instrumented, and visual assessments of color. HortScience 2007, 42, 232–238. [Google Scholar]
- Gitelson, A.A.; Merzlyak, M.N.; Chivkunova, O.B. Optical properties and nondestructive estimation of anthocyanin content in plant leaves. Photochem. Photobiol. 2001, 74, 38–45. [Google Scholar] [CrossRef]
- Gazula, A.; Kleinhenz, M.D.; Streeter, J.G.; Miller, A.R. Temperature and cultivar effects on anthocyanin and chlorophyll b concentrations in three related Lollo Rosso lettuce cultivars. HortScience 2005, 40, 1731–1733. [Google Scholar]
- Sánchez-Calderón, L.; López-Bucio, J.; Chacón-López, A.; Gutiérrez-Ortega, A.; Hernández-Abreu, E.; Herrera-Estrella, L. Characterization of low phosphorus insensitive mutants reveals a crosstalk between low phosphorus-induced determinate root development and the activation of genes involved in the adaptation of Arabidopsis to phosphorus deficiency. Plant Physiol. 2006, 140, 879–889. [Google Scholar] [CrossRef]
- Mele, M.A.; Islam, M.Z.; Kang, H.M.; Giuffrè, A.M. Pre-and post-harvest factors and their impact on oil composition and quality of olive fruit. Emir. J. Food Agric. 2018, 30, 592–603. [Google Scholar]
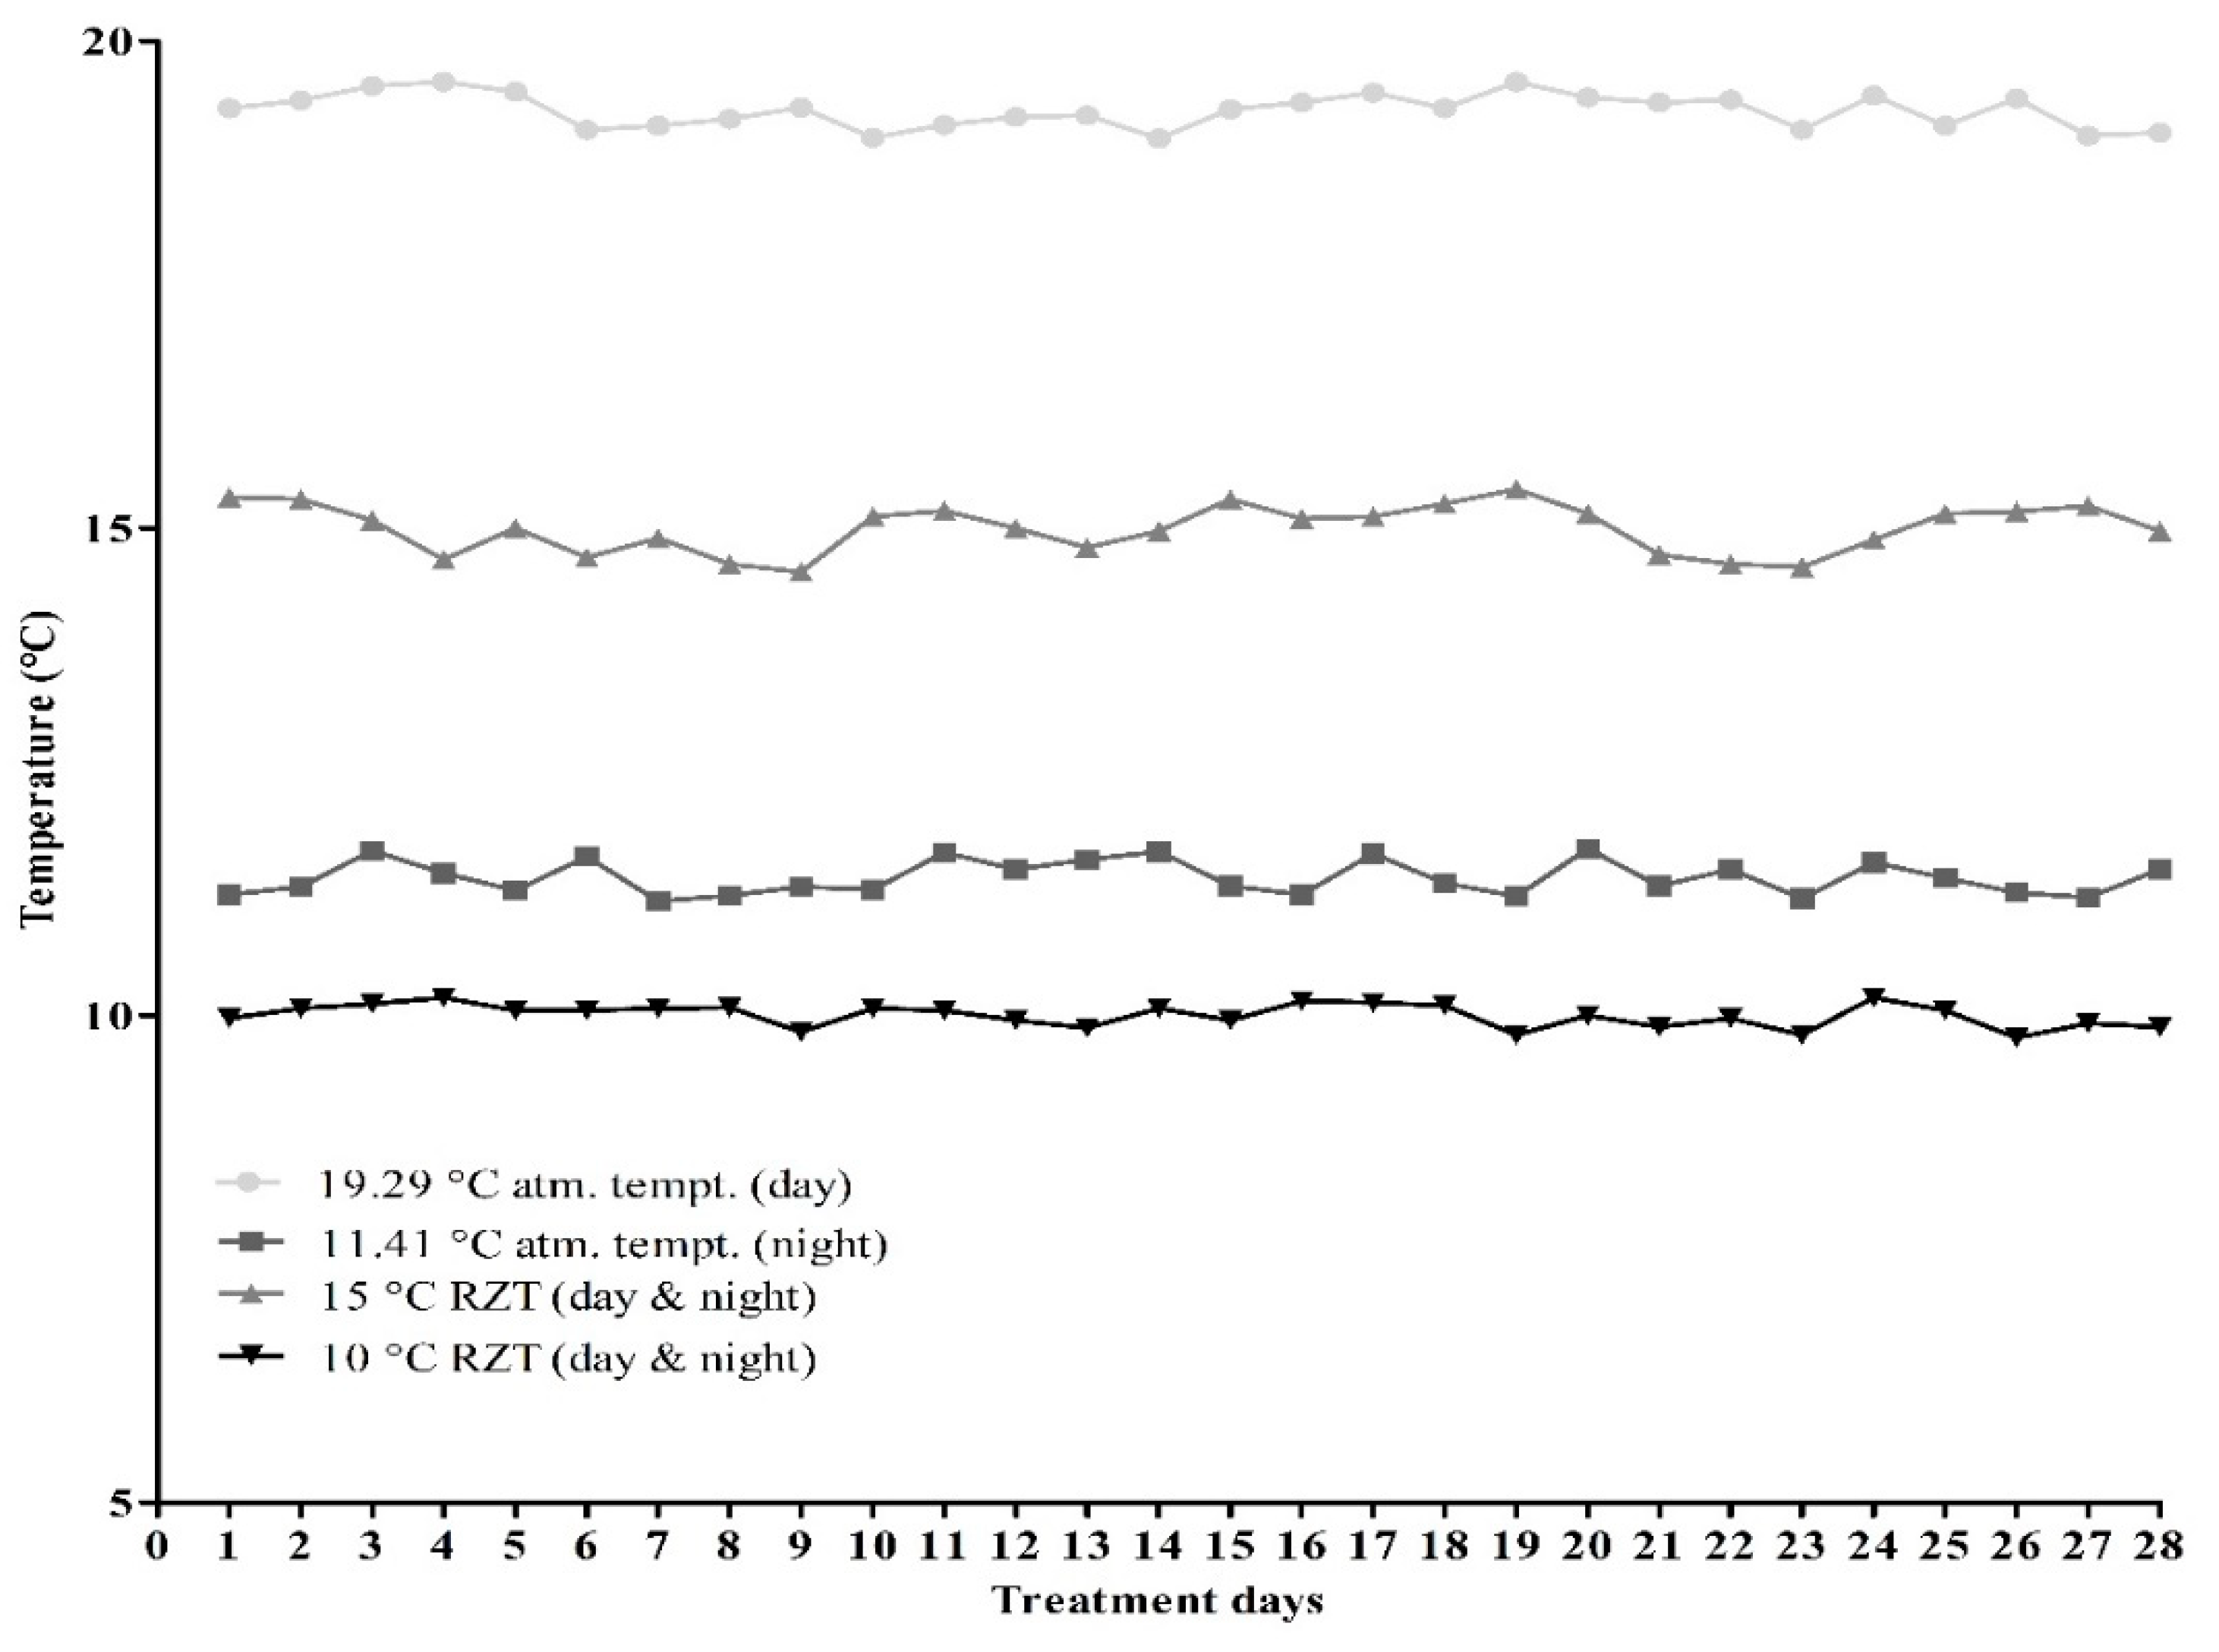
Figure 1.
Lettuce growing atmosphere temperature (19.29/11.41, day/night) and treated root zone temperature (RZT 15/10, day and night) for 28 days in a deep flow technique (DFT) system during growth and development. Note: 18th January to 14th February 2018.
Figure 1.
Lettuce growing atmosphere temperature (19.29/11.41, day/night) and treated root zone temperature (RZT 15/10, day and night) for 28 days in a deep flow technique (DFT) system during growth and development. Note: 18th January to 14th February 2018.


Table 1.
Nutrient solution characteristics of low strength ion concentration (0.4×) in the seedling stage in the plug tray and the hardening stage in the deep flow technique (DFT), and full (1×-P), medium or half (0.5×-P) and no (0×-P) P ion concentrations at the growth and development stage in the DFT system of hydroponic red romaine lettuce.
| Ion Concentration | ||||||
|---|---|---|---|---|---|---|
| Stage | Germination stage in plug tray | Seedling stage in plug tray | Hardening stage in DFT | Growth and development stage in DFT system | ||
| Strength | - | 0.4× (low) | 0.4× (low) | 1×-P (full) | 0.5×-P (half) | 0×-P (none) |
| Treatment days | Days 0–15 (15 days) | Days 16–30 (15 days) | Days 31–45 (15 days) | Days 46–73 (28 days) | Days 46–73 days (28 days) | Days 46–73 (28 days) |
| pH | - | 6.0–6.5 | 6.0–6.5 | 6.0–6.5 | 6.0–6.5 | 6.0–6.5 |
| EC (dS m −1) | - | 0.75 | 0.75 | 1.80 | 1.80 | 1.80 |
| NO3–N | - | 5.20 | 5.20 | 13 | 13 | 13 |
| NH4–N | - | 0.46 | 0.46 | 1.17 | 0.60 [NH4Cl] | 0.60 [NH4Cl] and 0.60 [(NH4)2SO4] |
| PO4–P | - | 1.40 | 1.40 | 3.5 [NH4H2PO4] | 1.75 [NH4H2PO4] | 0 |
| K | - | 3.60 | 3.60 | 9 | 9 | 9 |
| Ca | - | 1.60 | 1.60 | 4 | 4 | 4 |
| Mg | - | 0.80 | 0.80 | 2 | 2 | 2 |
| SO4–S | - | 0.80 | 0.80 | 2 | 2 | 2 |
| Fe | - | 0.02 | 0.02 | 0.07 | 0.07 | 0.07 |
| B | - | 0.05 | 0.05 | 0.14 | 0.14 | 0.14 |
| Mn | - | 0.0072 | 0.0072 | 0.018 | 0.018 | 0.018 |
| Zn | - | 0.0008 | 0.0008 | 0.002 | 0.002 | 0.002 |
| Cu | - | 0.00024 | 0.00024 | 0.0006 | 0.0006 | 0.0006 |
| Mo | - | 0.00052 | 0.00052 | 0.0013 | 0.0013 | 0.0013 |
Note: Values are expressed in me L−1. EC—Electrical conductivity.
Table 2.
The pH values of the nutrient solution at the adding time and before the adding time.
| P Strength | Temp. | pH Value | |
|---|---|---|---|
| Nutrient Solution Adding Time | Nutrient Solution before Adding Time | ||
| 1×-P (Full) | 15 °C | 6.45a z | 5.75a |
| 10 °C | 6.40ab | 5.68a | |
| 0.5×-P (Half) | 15 °C | 6.33ab | 5.73a |
| 10 °C | 6.35ab | 5.65a | |
| 0×-P (None) | 15 °C | 6.38ab | 5.50a |
| 10 °C | 6.25b | 5.05b | |
| p-value of St. & Temp. | * | *** | |
| p-value at 15 °C | NS | * | |
| p-value at 10 °C | NS | *** | |
z Mean separation within columns by Duncan’s multiple range tests (DMRT) (n = 4). NS, *, ***; not significant, significant at p ≤ 0.05 and 0.001 respectively. Same letters are significantly different to other treatment at different probability level (p ≤ 0.05 and 0.001). Note: St.—strength and Temp.—temperature.
Table 3.
Mineral content of red romaine lettuce leaf.
| P Strength | Temp. | % DW | µg/gm DW | ||||||
|---|---|---|---|---|---|---|---|---|---|
| N–NO3 | N–NH4 | P–PO4 | K2O | CaO | MgO | Fe | Cl | ||
| 1×-P (Full) | 15 °C | 0.92d z | 0.28cd | 0.63a | 0.63a | 0.09a | 0.013ab | 6.09bc | 6.72ab |
| 10 °C | 0.72d | 0.22d | 0.41b | 0.57ab | 0.08ab | 0.010b | 5.23b | 6.40b | |
| 0.5×-P (Half) | 15 °C | 1.19cd | 0.43bc | 0.37bc | 0.54abc | 0.07abc | 0.017abc | 8.77abc | 7.66ab |
| 10 °C | 1.59bc | 0.32cd | 0.24cd | 0.40bcd | 0.06bcd | 0.020abc | 7.12abc | 7.15ab | |
| 0×-P (None) | 15 °C | 2.52a | 0.67a | 0.13d | 0.38cd | 0.05cd | 0.023bc | 10.31a | 9.15a |
| 10 °C | 1.95ab | 0.55ab | 0.10d | 0.29d | 0.04d | 0.027c | 9.49ab | 8.81ab | |
| p-value of St. & Temp. | *** | *** | *** | *** | *** | ** | *** | *** | |
| p-value at 15 °C | *** | *** | *** | *** | *** | * | ** | ** | |
| p-value at 10 °C | *** | *** | *** | *** | *** | ** | *** | * | |
z Mean separation of columns by Duncan’s multiple range tests (DMRT) (n = 3). *, **, ***; significant at p ≤ 0.05, 0.01 and 0.001, respectively. Same letters are significantly different to other treatment at different probability level (p ≤ 0.05, 0.01 and 0.001). Note: St.—strength, Temp.—temperature and DW—dry weight.
Table 4.
Plant yield, leaf dry matter, root fresh weight, root length and root dry matter of red romaine lettuce at harvest day (28 days after treatment).
Table 4.
Plant yield, leaf dry matter, root fresh weight, root length and root dry matter of red romaine lettuce at harvest day (28 days after treatment).
| P Strength | Temp. | Yield/Plant (g) | Leaf Dry Matter (g) | Root Fresh Weight (g) | Root Length (cm) | Root Dry Matter (g) |
|---|---|---|---|---|---|---|
| 1×-P (Full) | 15 °C | 47.68a z | 5.80d | 4.76ab | 35.06b | 7.81c |
| 10 °C | 26.25b | 8.03c | 2.89c | 23.38d | 10.19b | |
| 0.5×-P (Half) | 15 °C | 45.40a | 5.94d | 4.75ab | 36.06ab | 7.80c |
| 10 °C | 27.22b | 9.00c | 3.10bc | 25.75cd | 11.25ab | |
| 0×-P (None) | 15 °C | 13.94c | 11.29b | 4.85a | 40.94a | 7.91c |
| 10 °C | 11.23c | 13.25a | 3.29abc | 30.75bc | 12.25a | |
| p-value of St. & Temp. | *** | *** | *** | *** | *** | |
| p-value at 15 °C | *** | *** | *** | *** | * | |
| p-value at 10 °C | *** | *** | *** | *** | *** | |
z Mean separation within columns by Duncan’s multiple range tests (DMRT) (n = 10). *, ***; significant at p ≤ 0.05 and 0.001, respectively. Same letters are significantly different to other treatment at different probability level (p ≤ 0.05 and 0.001). Note: St.—strength and Temp. —temperature.
Table 5.
Leaf number, leaf length, leaf width and leaf chlorophyll content (SPAD) of red romaine lettuce at harvest day (28 days after treatment).
Table 5.
Leaf number, leaf length, leaf width and leaf chlorophyll content (SPAD) of red romaine lettuce at harvest day (28 days after treatment).
| P Strength | Temp. | Leaf Number | Leaf Length (cm) | Leaf Width (cm) | Leaf Chlorophyll Content (SPAD) |
|---|---|---|---|---|---|
| 1×-P (Full) | 15 °C | 8.70a z | 19.30a | 12.20a | 27.21a |
| 10 °C | 8.30ab | 16.60ab | 11.25ab | 26.55ab | |
| 0.5×-P (Half) | 15 °C | 8.60a | 18.50a | 13.70a | 27.03ab |
| 10 °C | 8.40ab | 17.15a | 11.50ab | 25.59abc | |
| 0×-P (None) | 15 °C | 7.80b | 14.00b | 9.30ab | 24.35ab |
| 10 °C | 7.70b | 13.80b | 8.25b | 23.39c | |
| p-value of St. & Temp. | * | *** | *** | *** | |
| p-value at 15 °C | * | *** | ** | ** | |
| p-value at 10 °C | * | *** | ** | *** | |
z Mean separation within columns by Duncan’s multiple range tests (DMRT) (n = 10). *, **, ***; significant at p ≤ 0.05, 0.01 and 0.001 respectively. Same letters are significantly different to other treatment at different probability level (p ≤ 0.05, 0.01 and 0.001). Note: St.—strength and Temp.—temperature.
Table 6.
Leaf color value (L*, a*, b*, chrome and ºh) of red romaine lettuce at harvest day (28 days after treatment).
Table 6.
Leaf color value (L*, a*, b*, chrome and ºh) of red romaine lettuce at harvest day (28 days after treatment).
| P Strength | Temp. | Color (L*) | Color (a*) | Color (b*) | Color (chrome) | Color (ºh) |
|---|---|---|---|---|---|---|
| 1×-P (Full) | 15 °C | 38.90a z | −2.52b | 5.44a | 6.86a | 111.87a |
| 10 °C | 37.42ab | −1.21ab | 3.29bc | 3.55ab | 106.80ab | |
| 0.5×-P (Half) | 15 °C | 38.37ab | −1.40ab | 4.23ab | 4.38ab | 109.34ab |
| 10 °C | 37.34ab | −1.06ab | 2.70bc | 2.76b | 104.83ab | |
| 0×-P (None) | 15 °C | 36.88ab | −0.88ab | 2.15c | 2.23b | 102.07b |
| 10 °C | 36.12b | −0.43a | 1.81c | 2.04b | 100.77b | |
| p-value of St. & Temp. | * | ** | *** | *** | *** | |
| p-value at 15 °C | NS | NS | *** | ** | ** | |
| p-value at 10 °C | NS | * | *** | ** | * | |
z Mean separation within columns by Duncan’s multiple range tests (DMRT) (n = 10). NS, *, **, ***; not significant, significant at p ≤ 0.05, 0.01 and 0.001, respectively. Same letters are significantly different to other treatment at different probability level (p ≤ 0.05, 0.01 and 0.001). Note: L* = lightness or brightness, +a = redness, −a = greenness, b* = yellowness, St.—strength and Temp.—temperature.
Table 7.
Chlorophyll (chl a, chl b and chl total) and anthocyanin content after harvest (28 days after treatment at 20 °C) of red romaine lettuce.
Table 7.
Chlorophyll (chl a, chl b and chl total) and anthocyanin content after harvest (28 days after treatment at 20 °C) of red romaine lettuce.
| P Strength | Temp. | Chlorophyll a (µg/mL) | Chlorophyll b (µg/mL) | Chlorophyll Total (µg/mL) | Anthocyanin (mg/100 g FW) |
|---|---|---|---|---|---|
| 1×-P (Full) | 15 °C | 9.99a z | 13.62a | 23.61a | 0.64d |
| 10 °C | 8.04ab | 11.77ab | 19.80abc | 1.44cd | |
| 0.5×-P (Half) | 15 °C | 8.93ab | 12.77ab | 21.70ab | 0.77cd |
| 10 °C | 7.87ab | 11.30ab | 19.17abc | 2.15c | |
| 0×-P (None) | 15 °C | 7.78ab | 10.54ab | 18.32bc | 4.80b |
| 10 °C | 7.59b | 9.31b | 16.90c | 6.65a | |
| p-value of St. & Temp. | * | *** | *** | *** | |
| p-value at 15 °C | NS | * | *** | *** | |
| p-value at 10 °C | NS | * | NS | *** | |
z Mean separation within columns by Duncan’s multiple range tests (DMRT) (n = 10). NS, *, ***; not significant, significant at p ≤ 0.05 and 0.001, respectively. Same letters are significantly different to other treatment at different probability level (p ≤ 0.05 and 0.001). Note: St.—strength and Temp.—temperature.
© 2019 by the authors. Licensee MDPI, Basel, Switzerland. This article is an open access article distributed under the terms and conditions of the Creative Commons Attribution (CC BY) license (http://creativecommons.org/licenses/by/4.0/).
Share and Cite
MDPI and ACS Style
Islam, M.Z.; Lee, Y.-T.; Mele, M.A.; Choi, I.-L.; Kang, H.-M. The Effect of Phosphorus and Root Zone Temperature on Anthocyanin of Red Romaine Lettuce. Agronomy 2019, 9, 47. https://doi.org/10.3390/agronomy9020047
AMA Style
Islam MZ, Lee Y-T, Mele MA, Choi I-L, Kang H-M. The Effect of Phosphorus and Root Zone Temperature on Anthocyanin of Red Romaine Lettuce. Agronomy. 2019; 9(2):47. https://doi.org/10.3390/agronomy9020047
Chicago/Turabian StyleIslam, Mohammad Zahirul, Young-Tack Lee, Mahmuda Akter Mele, In-Lee Choi, and Ho-Min Kang. 2019. "The Effect of Phosphorus and Root Zone Temperature on Anthocyanin of Red Romaine Lettuce" Agronomy 9, no. 2: 47. https://doi.org/10.3390/agronomy9020047
Note that from the first issue of 2016, this journal uses article numbers instead of page numbers. See further details here.