1. Introduction
Washington State University’s Apple Breeding Program developed a new cultivar, “WA38”, commercially traded as “Cosmic Crisp
®”. It was released to the fruit industry for commercial production in 2017. Millions of trees are projected to be planted in Washington (WA) in the upcoming years (nearly seven million “WA38” trees were planted in spring 2018, and five million more are expected to be planted in 2019) [
1]. A minimal amount of published research is available on how to best manage this new cultivar.
“WA38” is the result of a cross between “Enterprise” and “Honeycrisp” [
2]. “WA38” is classified for its growth habit as a type IV cultivar [
3], which indicates an acrotonic tree growth, with a natural tendency to produce on the outer part of the canopy, leaving “blind wood” or unproductive wood closer to the trunk.
To minimize the effect of “blind wood”, a “click” pruning technique can be applied to type IV cultivars [
4]. This pruning technique is based on the dormant cutting of one-year-old wood in both the apical and basal zone, and requires branches oriented with an angle of 40–45° to the vertical. Mohammadi et al. [
5] reported an increase of flower bud formation when using the click technique in apple. Click pruning requires that about 20% to 25% of the branches should be renovated every year to maintain high fruit quality.
“WA38” is also characterized by a self-thinning capacity with one or two fruitlets set per cluster after 4–6 weeks after full bloom (WAB) [
6]. This peculiar trait requires only fine adjustments, with respect to crop load management. Harvest time is at the end of September to the beginning of October in WA (+4 weeks from Gala). “WA38” is a “bi-color” cultivar, capable of reaching 90% red overcolor (and a dark red hue) depending on the growing region and management practices [
2]. It is noted to have remarkable eating quality, being large in size, crispy, juicy, and firm, and has a long-term storage capability with no significant incidence of important storage disorders [
2].
It is well known that management practices in the orchard influence tree canopy balance and the production of high apple fruit quality. For this reason, defining the optimal crop load of a new cultivar characterized by the trait of setting one or two fruits per cluster requires a fine-tuning of all the management techniques [
7]. In fact, pruning trees helps maintain a sufficient and well-illuminated canopy to act as a source for photosynthate production [
8], whereas apple crop load management adjusts the number of sinks to reduce resource competition and have enough carbon for developing fruits [
9]. Carbohydrates are transported and utilized across the tree to several competing locations. Tree growth and resource allocation is dependent upon the carbon availability and the demand strength of “sinks”, organs, and processes within the tree that require carbohydrates [
10]. Physiological processes that are dependent upon sufficient carbohydrate supply include respiration, fruit development, bud formation, growth of shoots, leaves, branches, roots, and reserve allocation [
11]. These processes and “sinks” demand resources at different “strengths” and change their needs throughout the growing season [
12]. Kramer and Kozolowski [
13] proposed a prioritized ranking in apple of “sink” strengths in the following order from strongest to weakest: fruits and seeds, new leaves and stems, mature leaves, vascular tissues, roots, and carbon reserves. After bloom, there is a high demand of carbon by a high number of developing fruits, competing and exponentially growing during their cell division phase (2–4 weeks after bloom, WAB) [
14]. Apple fruit thinning ideally should take place during this phase so as to reduce the number of sinks dependent on a limited carbon availability. The removal of competing fruit at this phase encourages large fruit, as fruit size is more dependent upon cell number than cell volume [
15,
16,
17,
18].
The apple industry increasingly focused on crop load management in recent years. Cultivars like “Honeycrisp” present a strong biennial bearing tendency with negative effects on fruit quality [
19,
20]. Biennial bearing is the natural tendency of some apple cultivars to set a heavy crop load one year (“on” year), and a minimal crop load in the following year (“off” year) [
21]. Crop load management techniques (i.e., bloom/green-fruit thinning) were shown to be effective in reducing biennial bearing, as well as enhancing canopy growth, increasing fruit size, and producing consistent high-quality fruit [
9,
18,
22,
23,
24]. Also, some disorders like bitter pit can be related to poor crop load management [
20].
Precision crop load management consists of three different steps: winter pruning (flower bud removal), blossom thinning at bloom, and green-fruit thinning during cell division [
22]. The culmination of these horticultural tasks should aim to result in an appropriate number of fruit sinks for a balanced carbon supply and optimal fruit size, yield, and quality [
25]. Palmer et al. [
26] demonstrated that “Braeburn” trees with lower crop loads yielded fruit of higher quality, i.e., redder in color, higher soluble solids content, reduced starch content, and increased dry matter. In general, heavier crop loads delay maturity and negatively impact fruit quality with respect to sugar content, color development, titratable acidity, and firmness [
9,
20]. Higher crop loads can also lead to deleterious effects on vegetative parameters, especially the leaf-to-fruit ratio [
9].
Higher leaf-to-fruit (L:F) and leaf-area-to-fruit (LA:F) ratios were shown to enhance the weight, size, color, sugar content, ripeness, and maturity in tree fruit, like cherries [
27,
28,
29]. Trees with larger LA:F ratios yield higher-quality fruit in peach trees [
30]. However, higher LA:F ratios may not always be desirable, as excessive leaf area can lead to intra-tree shading, which can result in reduced fruit quality, fruit abscission, undesired shoot growth, and a reduction in return bloom [
21,
31,
32]. The relationship between leaf area and fruit quality remains to be fully investigated in apple. However, the appropriate number of fruits per tree and crop load management were researched more intensively, but these targets may be dependent upon the cultivar and the size/age of the tree [
9].
Fruit from heavily cropped “Honeycrisp” trees were less firm, but had lower incidences of storage issues like bitter pit, scald, rot and senescent breakdown [
33]. High crop loads in “Honeycrisp” led to reduced flower bud formation, delayed fruit ripening, and poor coloration, and lowered the overall quality, which negatively impacted fruit storage capability [
20]. Fruits from lighter cropped trees produced higher-quality fruit and resulted in longer storability [
20]. Embree et al. [
22] noted that “Honeycrisp” can produce consistent high-quality fruit in Nova Scotia (Canada), but only under optimal crop level conditions. Embree et al.’s [
22] results indicated that a crop load level of 6 fruits/cm
2 of trunk cross-sectional area (TCSA) yielded high-quality fruit and mitigated biennial production. This target crop load level was confirmed by Serra et al. [
20], with their suggestion ranging from 4.7 to 7.5 fruits/cm
2 of TCSA in Washington State’s (WA) conditions.
Optimal crop load levels for consistent high-quality fruit in varieties like “Honeycrisp” were suggested [
20,
22]. However, further cultivar-specific research is needed, especially for newly released varieties, like “WA38”. To date, there remains no research published addressing its potential for biennial bearing, as well as the impact crop load has on “WA38” apples. This study was conducted to assess the impact of crop load management on fruit quality, vegetative parameters, mineral composition, and return bloom in “WA38”. In 2017, 24 trial trees were selected and adjusted to four crop load treatments (2, 4, 6, and 8 fruits/TCSA cm
2). These trees and their fruit were evaluated for quality, leaf area, mineral composition, and flower bud development in the following spring of 2018.
2. Materials and Methods
2.1. Experimental Design
In June 2013, an orchard of Washington State University’s new apple (
Malus domestica Borkh), variety “WA38”, was planted in an experimental trial in Rock Island, Wenatchee, WA, United States of America (USA) (47.309776 N, −120.064593 W). The tree was selected in a complete randomized design, assessing three training systems, two rootstocks, and two pruning methods. The selected “WA38” trees (24 in total across four separate blocks) for the study were trained to a spindle system (3.0 m × 0.9 m ≈ 3700 trees/ha), grafted on Malling-9 Nic29 (Nic29), and “click” pruned. The “click” pruning technique consists of simplifying branches, heading back on one-year-old dormant shoots, and training branches to a crotch angle of 45 degrees [
4]. The orchard was irrigated through drip lines and sprinklers, and was fertilized and managed as per industry standards.
Trunk diameter was measured on 20 April 2017 (fifth leaf) and on 13 March 2018 (sixth leaf) at 15 cm above the graft union. TCSA was calculated starting from averaging two orthogonal diameter measures of the trunk and expressing it in cm
2. Twenty-four trees were selected with an average TCSA of 12.26 ± 2.00 cm
2. Flower buds were counted on each tree on 20 April 2017, prior to full bloom, which occurred on 6 May 2017. Flower buds were characterized into three categories based on bud location: terminal position on “brindilla” (one-year-old wood with an apical flower bud only) and “ramo misto” (one-year-old wood with apical and lateral flower buds) wood, laterals on “brindilla” and “ramo misto” wood, and buds on spurs located on branches and on the main axis [
34]. An initial fruit set count was conducted on 12 June 2017 to determine the natural crop load capability. Initial crop loads across the selected 24 trees ranged from 3.0 to 9.3 fruits/cm
2 TCSA. Trees were then thinned to the closest possible target crop load category. Four crop load levels 2, 4, 6, and 8 fruits/TCSA (cm
2) were selected and manually adjusted on 17 June 2017 (seven WAB), with six trees per each crop load. At harvest, the real crop load levels were as follows: 2.1, 4.1, 6.0, and 7.8 fruits/TCSA (cm
2).
2.2. Fruit Grading and Quality Analysis
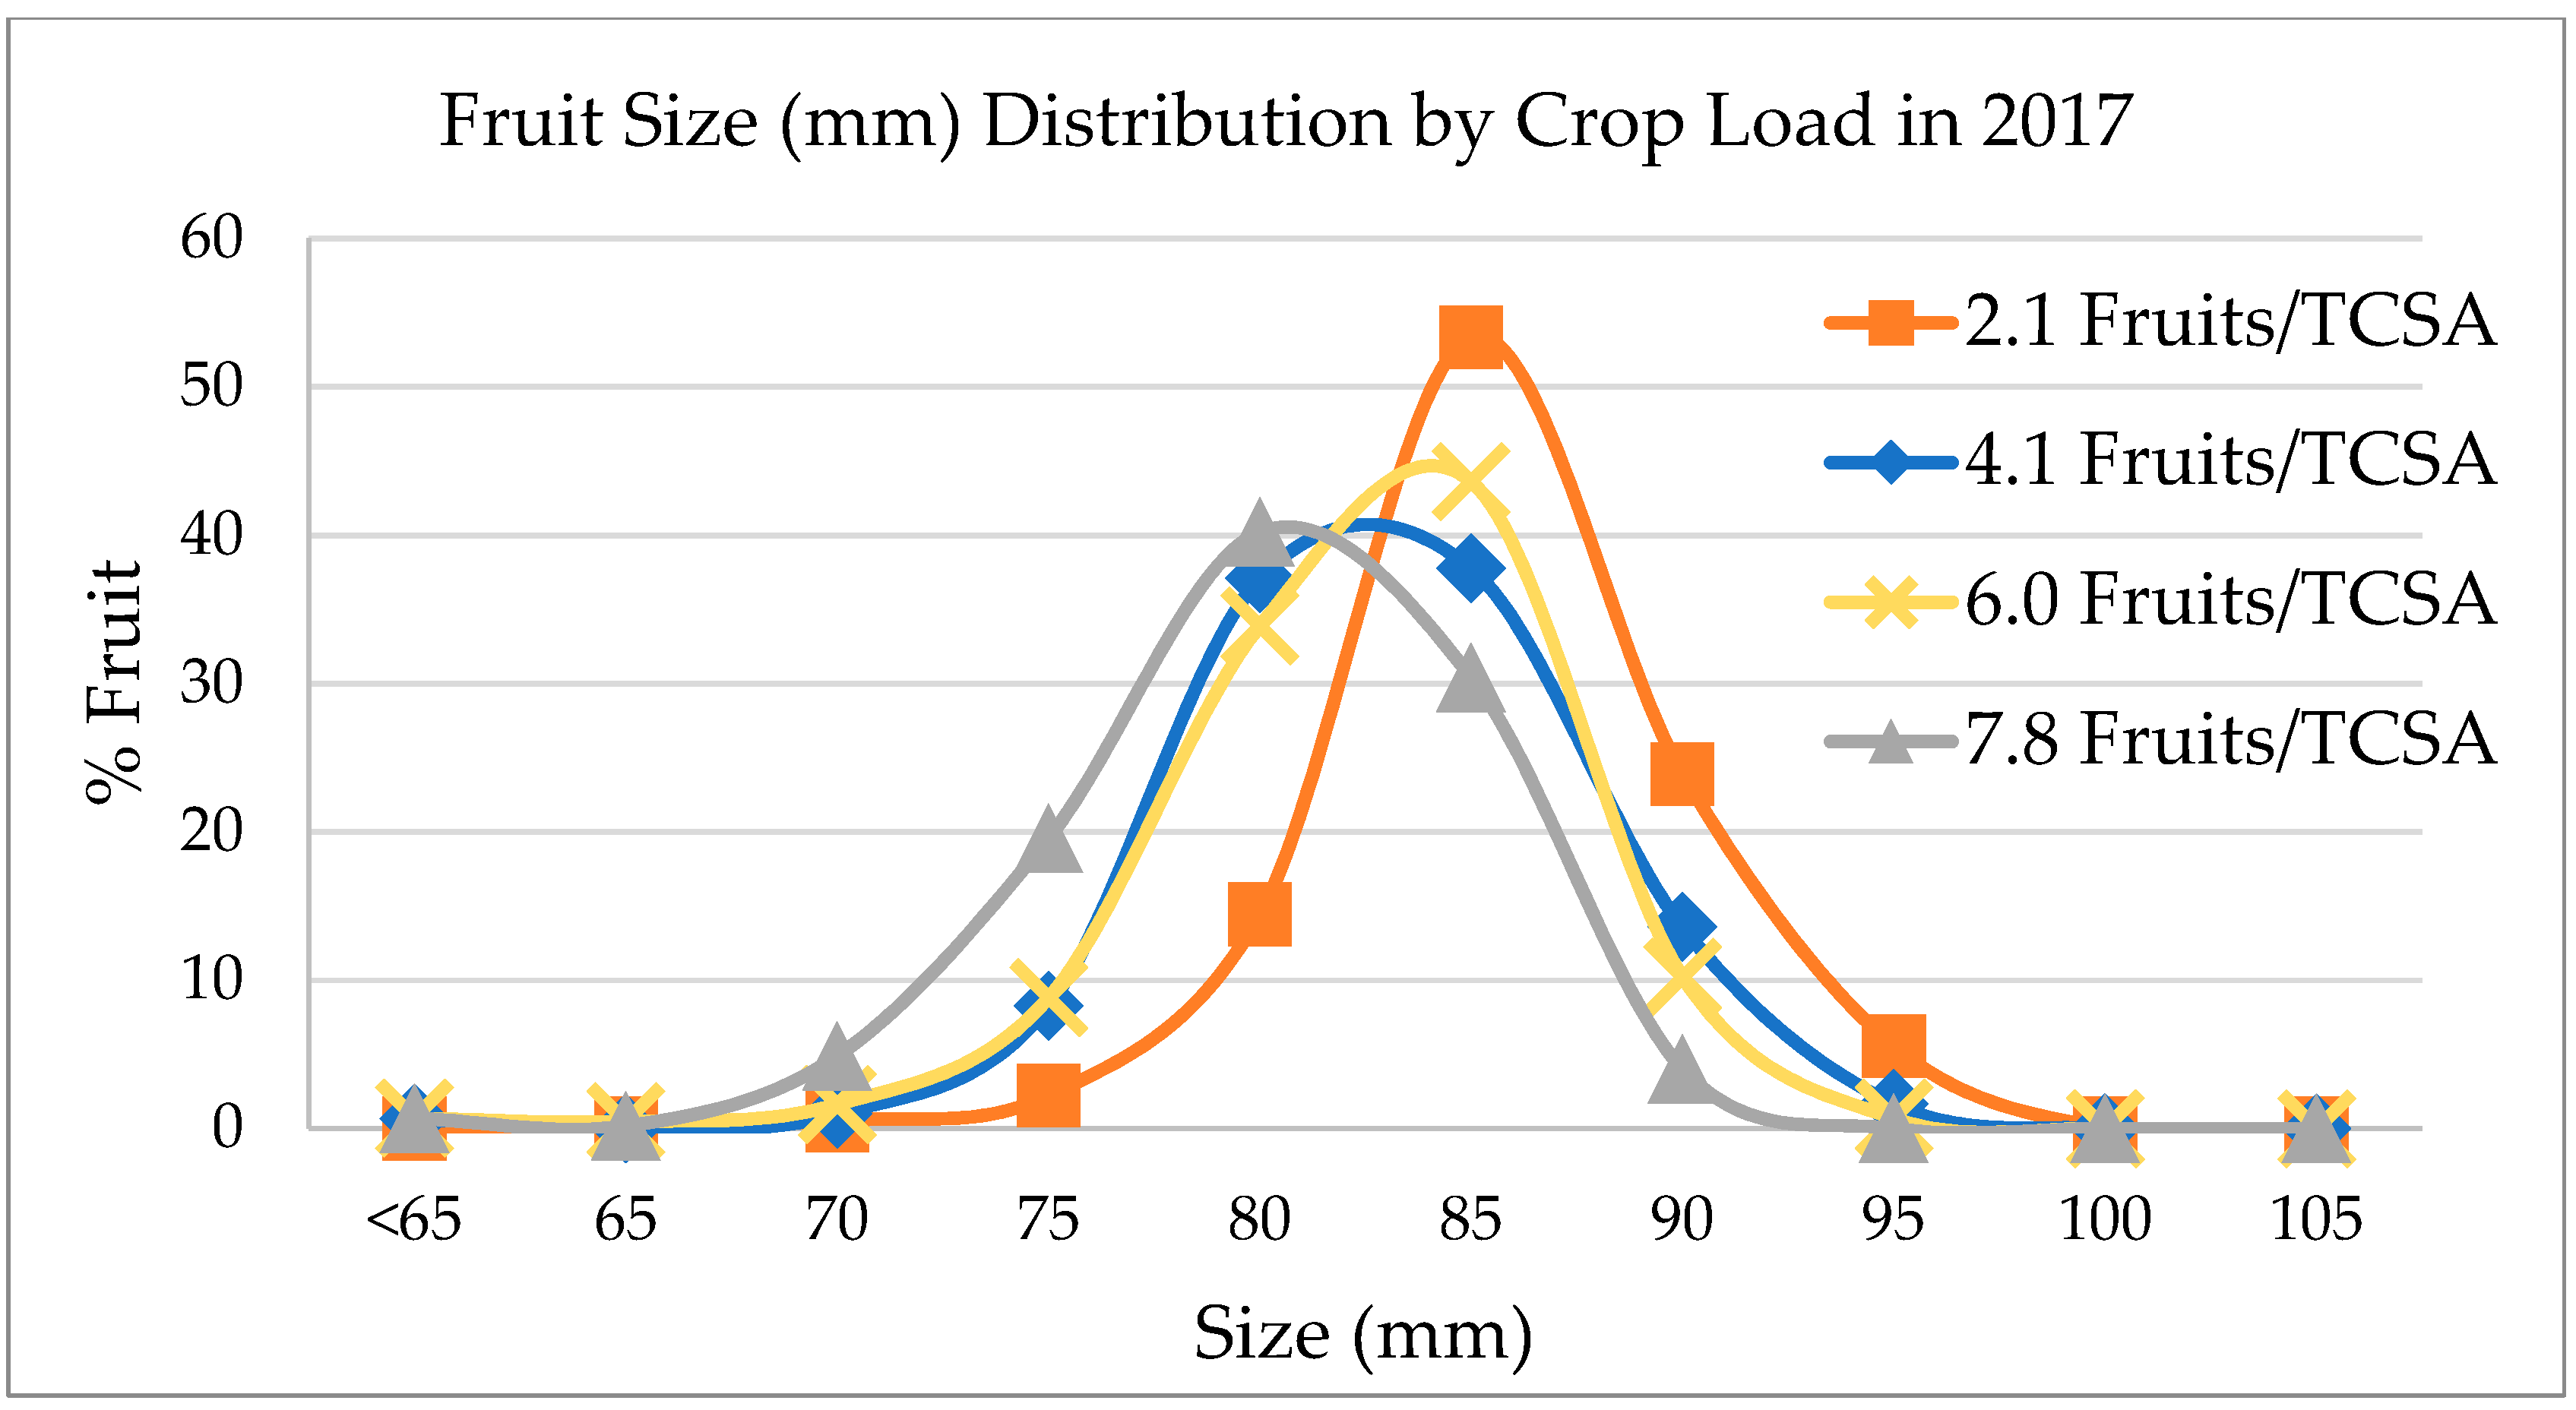
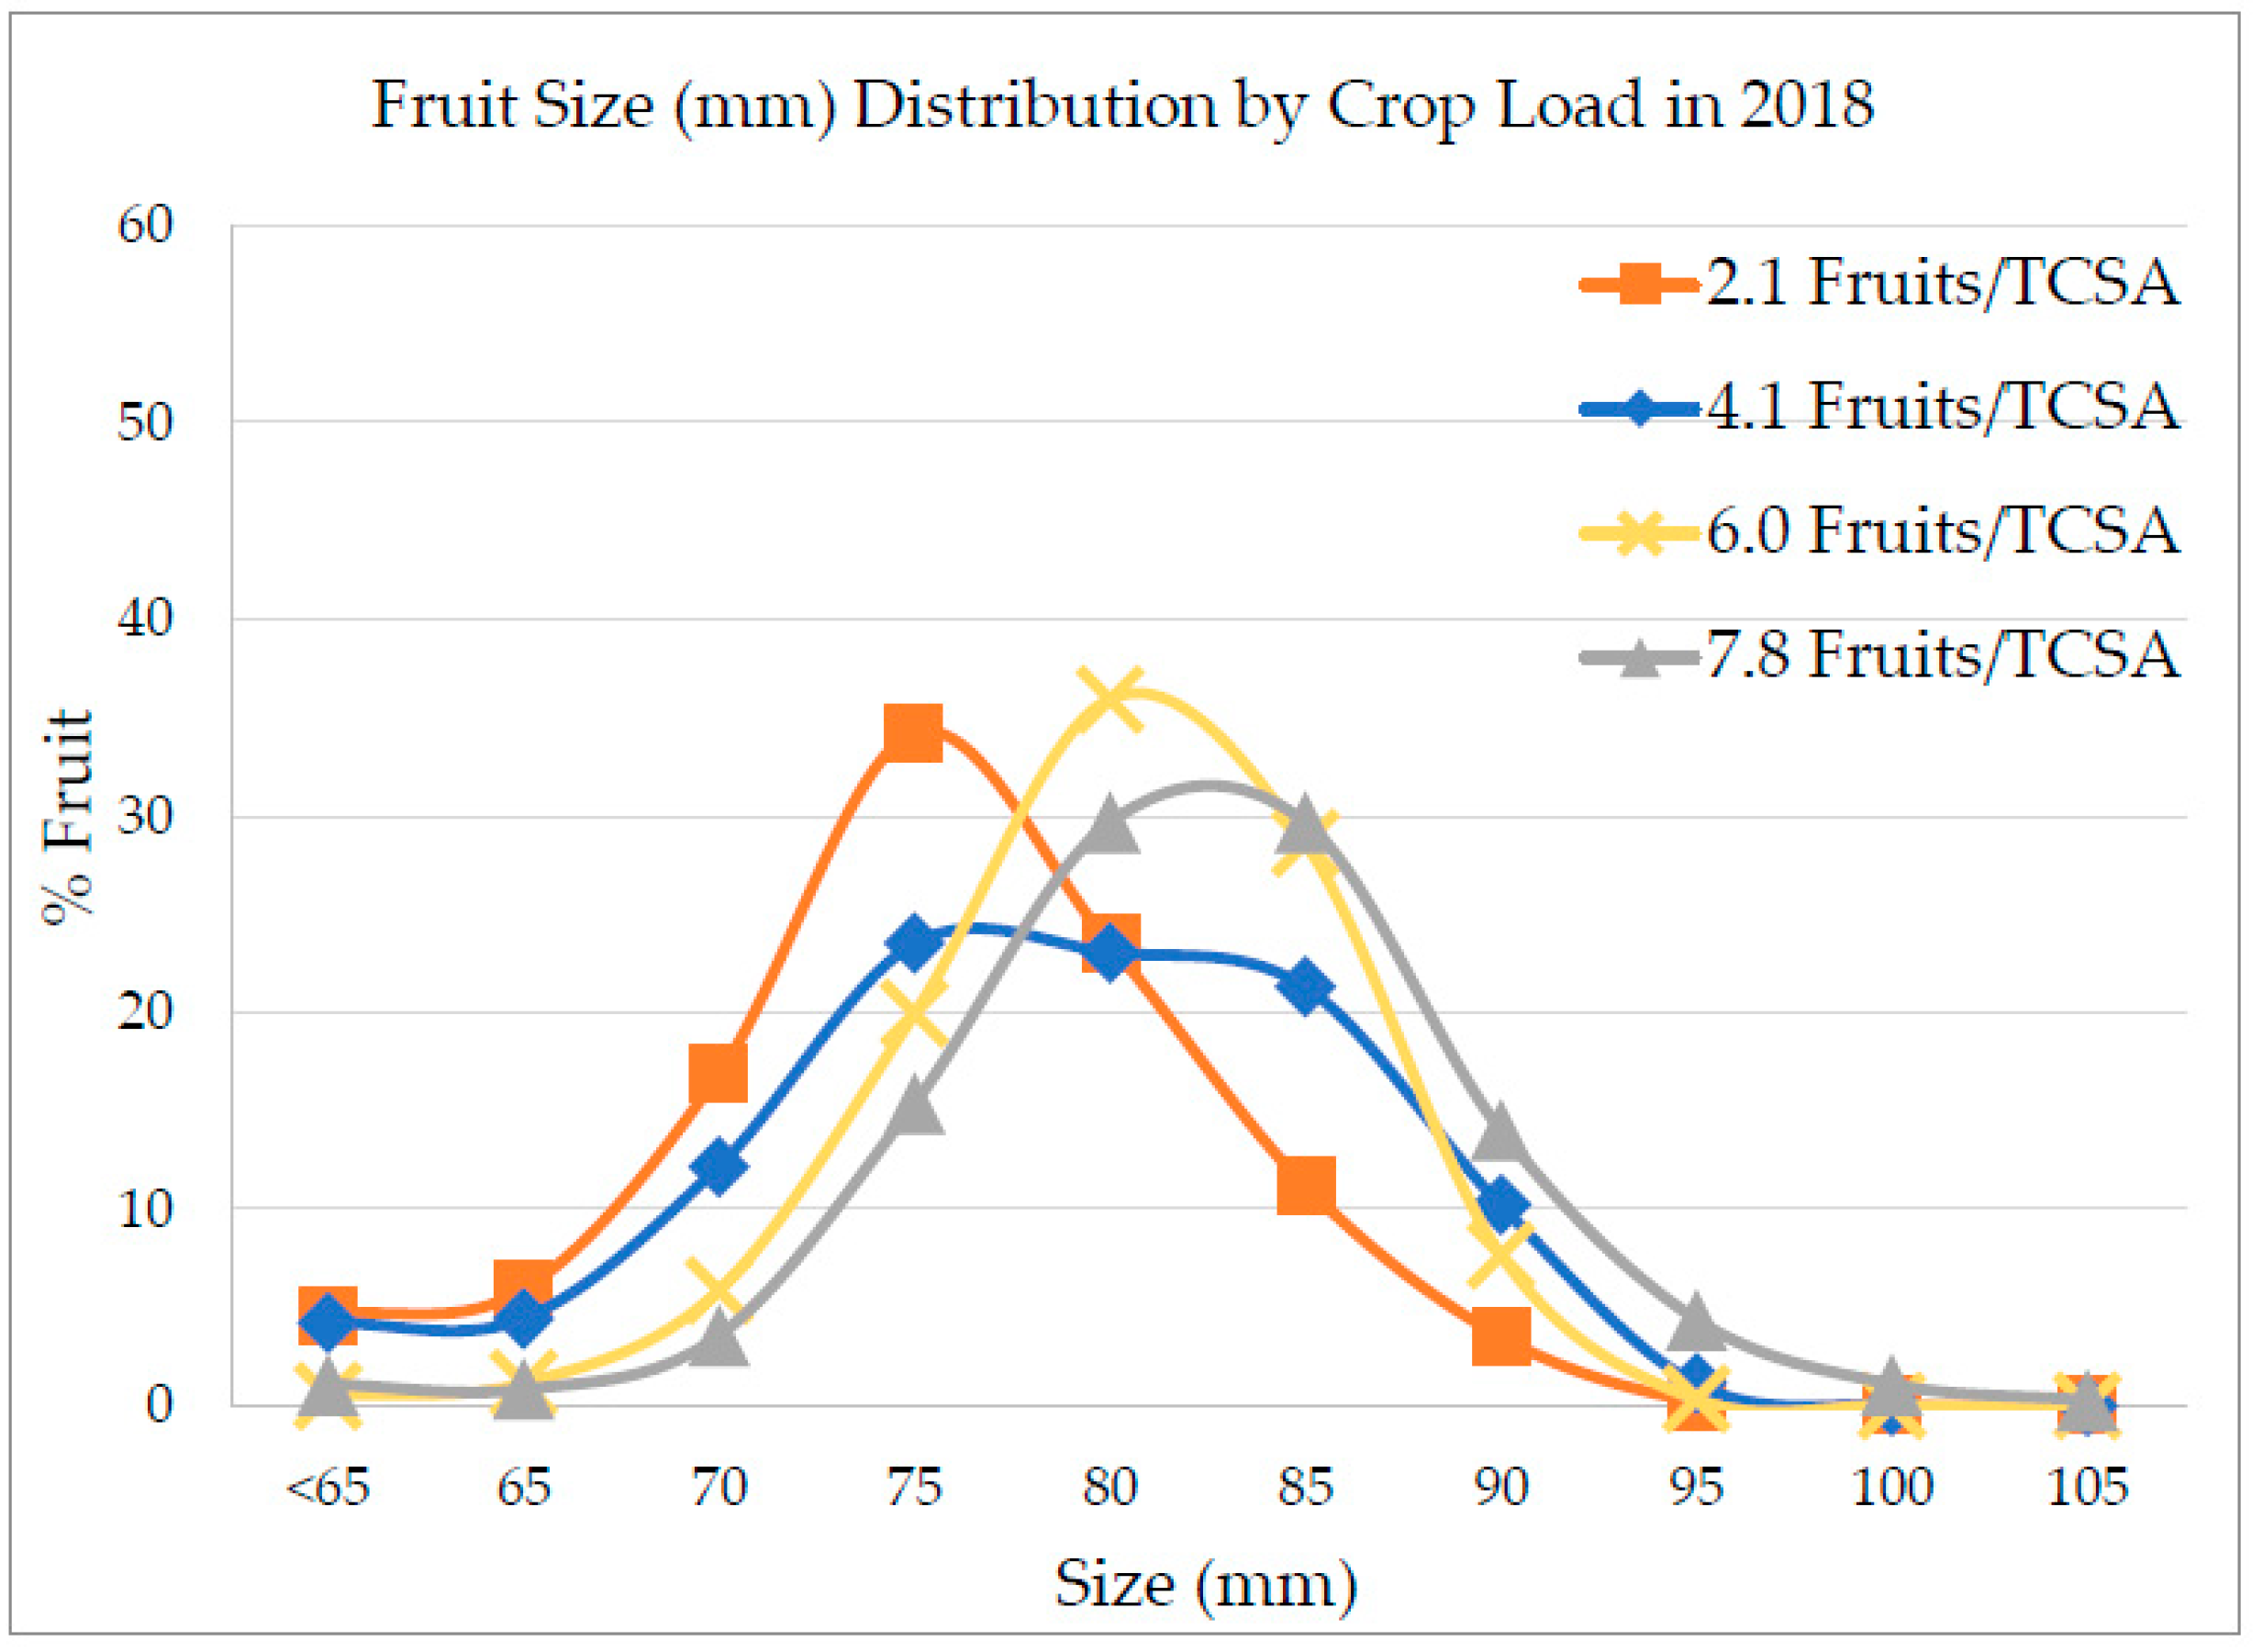
Fruit was harvested on 9 October 2017 (third crop for the orchard at fifth leaf) and in the following year on 21 September 2018 (fourth crop, sixth leaf). Number of harvested fruit and yield (kg/tree) were assessed for each tree. In 2018, a few trees were excluded from harvest due to damages to the tree. Apples were sized by the following categories to account for larger fruit: <65.00, 65.00–69.99, 70.00–74.99, 75.00–79.99, 80.00–84.99, 85.00–89.99, 90.00–95.99, 95.00–99.99, 100.00–104.99, 105.00–109.99, and ≥110.00 mm in diameter using a customized fruit sizer (
Figure S1, Supplementary Materials). Quality evaluation was assessed on the subsampled fruit when they exhibited an average starch grading of 1.64. Fruit quality analysis was not conducted on the fruit harvested in 2018, only sizing.
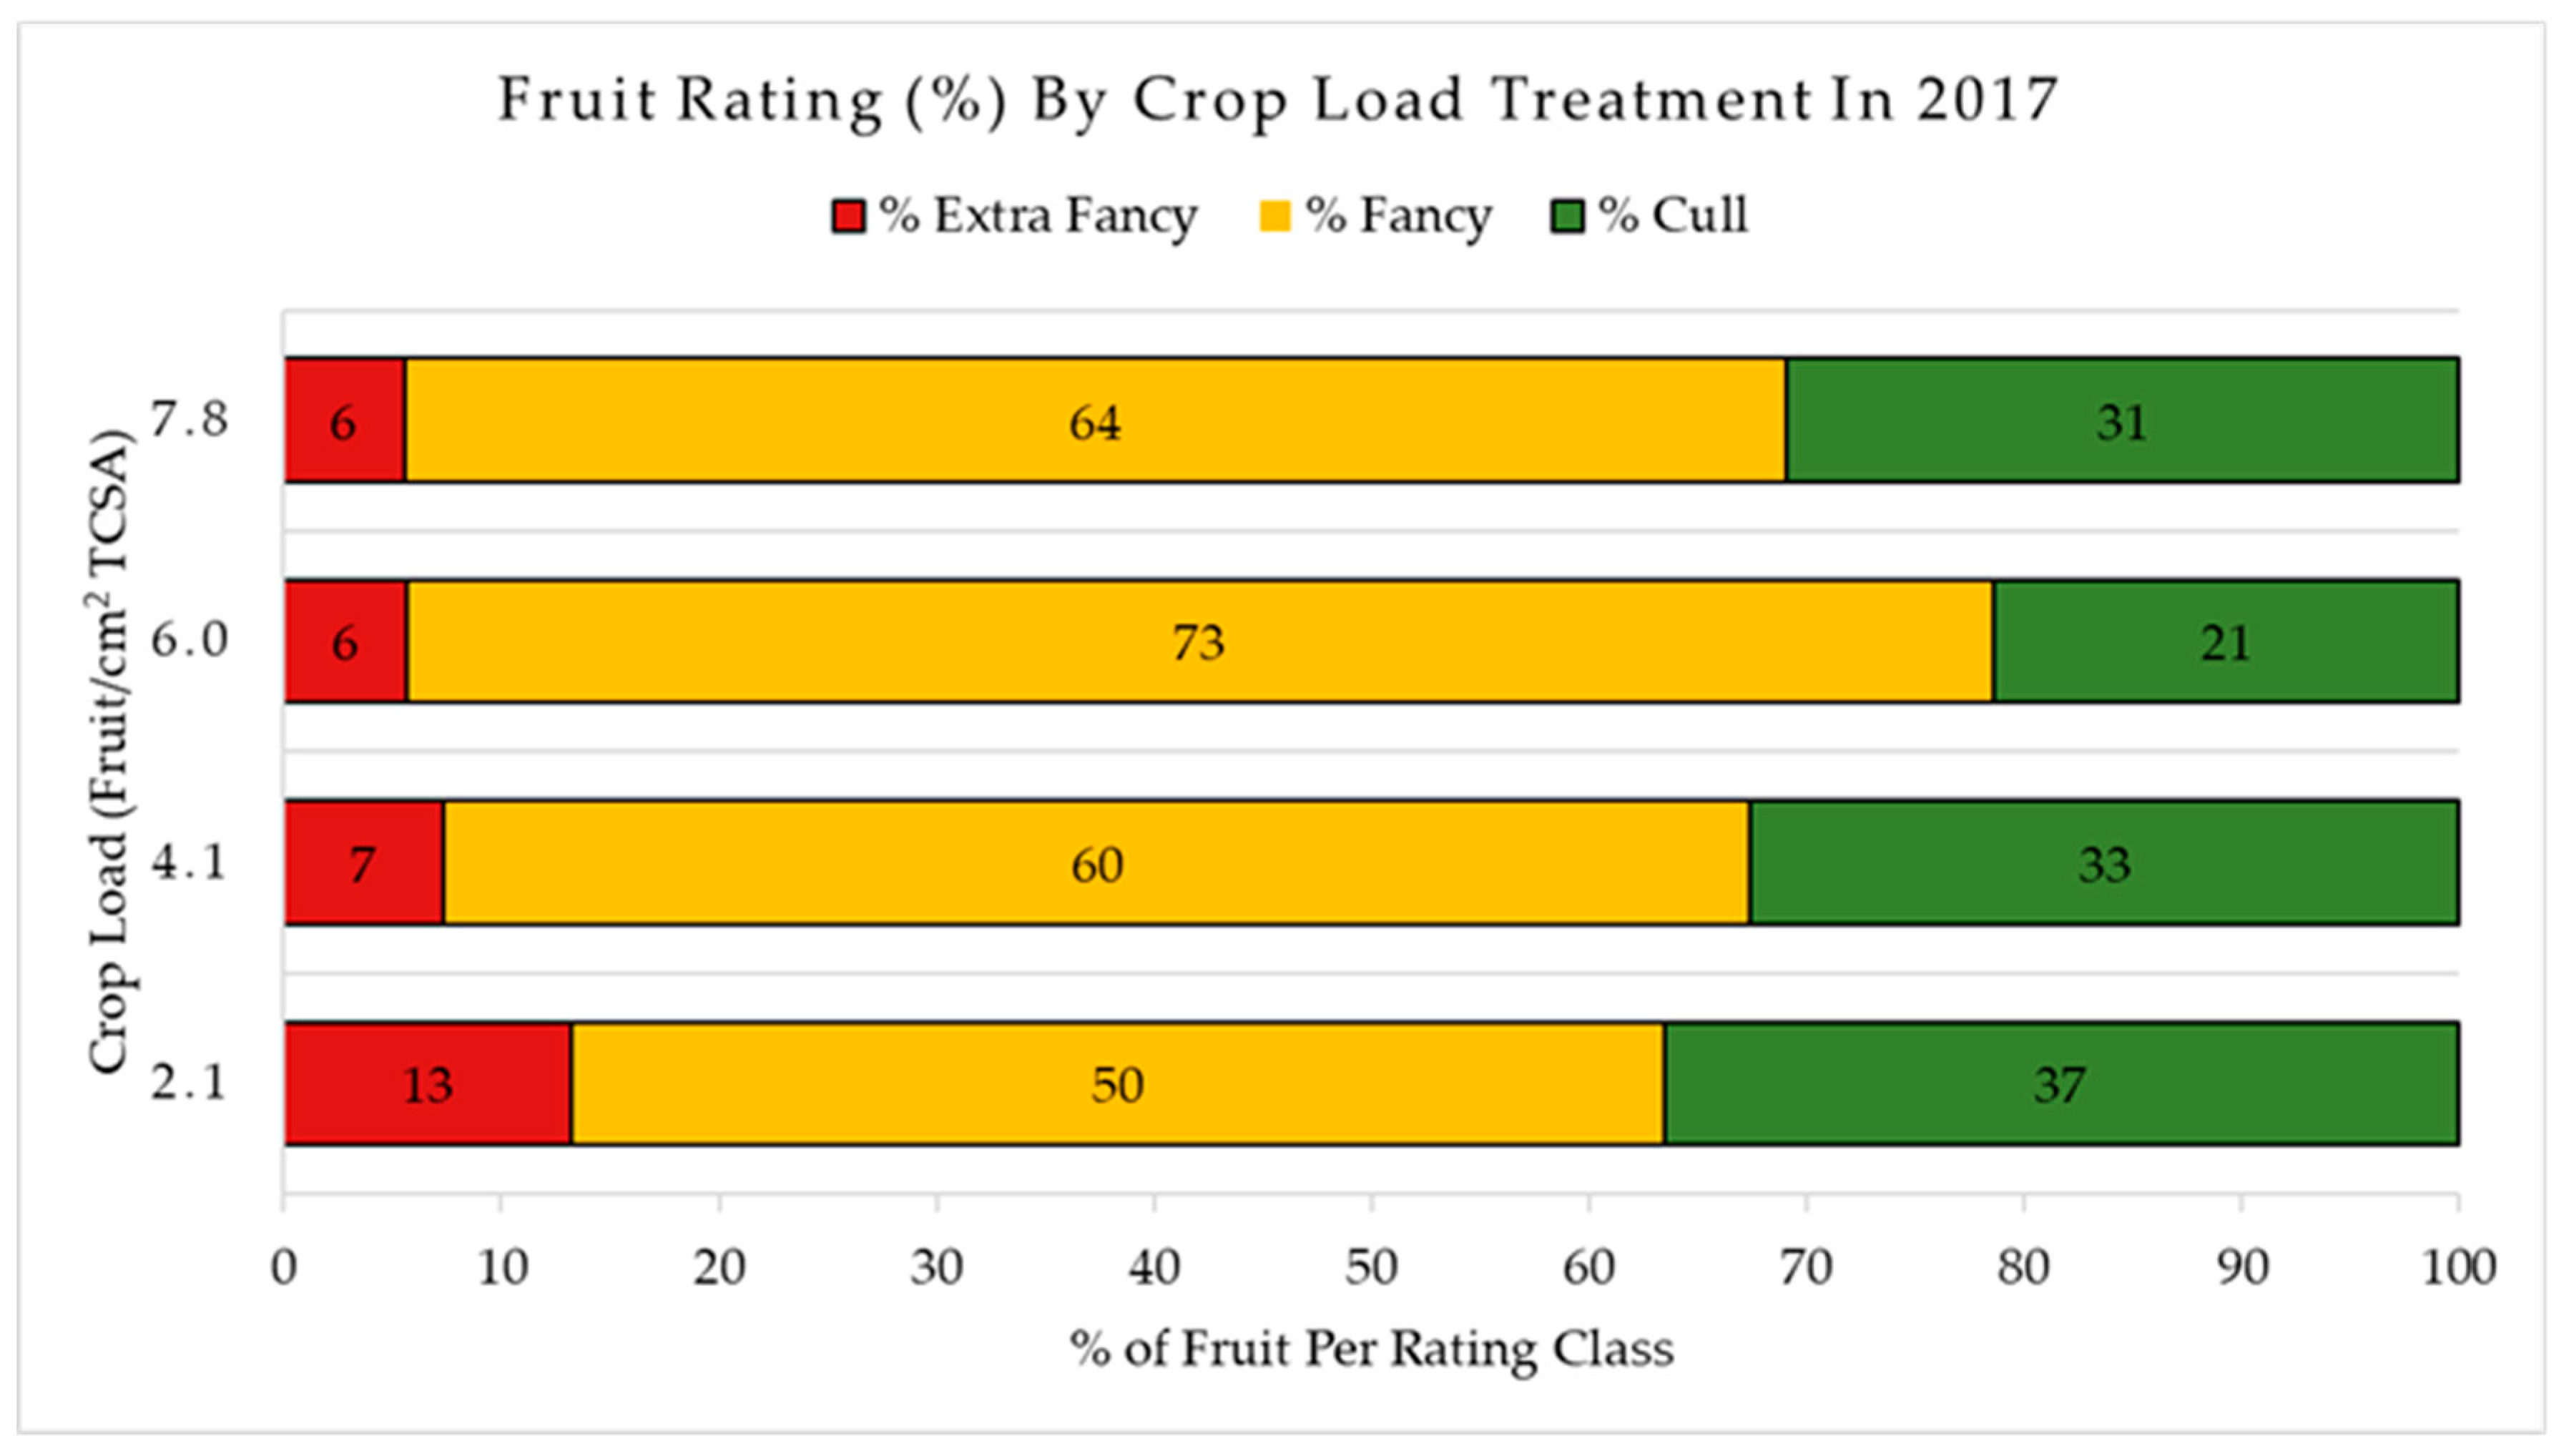
In 2017, fruit designated for quality analysis ranged from 80–90 mm (most representative size range for this harvest) to limit the variability due to effect of size on fruit quality. Fruit was also graded in the field for external disorders such as sunburn, green spot, bitter pit, stem split, insect damage, depression, bird damage, limb rub/bruise, leaf shade, russet, decay, and cracking accordingly to a customized “WA38” disorder guideline developed by authors over recent years. After all the apples were graded, 16 fruits (one tray of a 64-capacity box) from each experimental tree were selected showcasing no or minimal external defects (all fruit showing defects with cortex exposure were discarded for this purpose and assigned as a “cull”) and boxed (96 apples for each crop load level for a total of 384 fruit). All boxes were then immediately moved to storage under regular atmosphere (RA) conditions at approximately 1.0 °C until they could be processed for quality over the following two days.
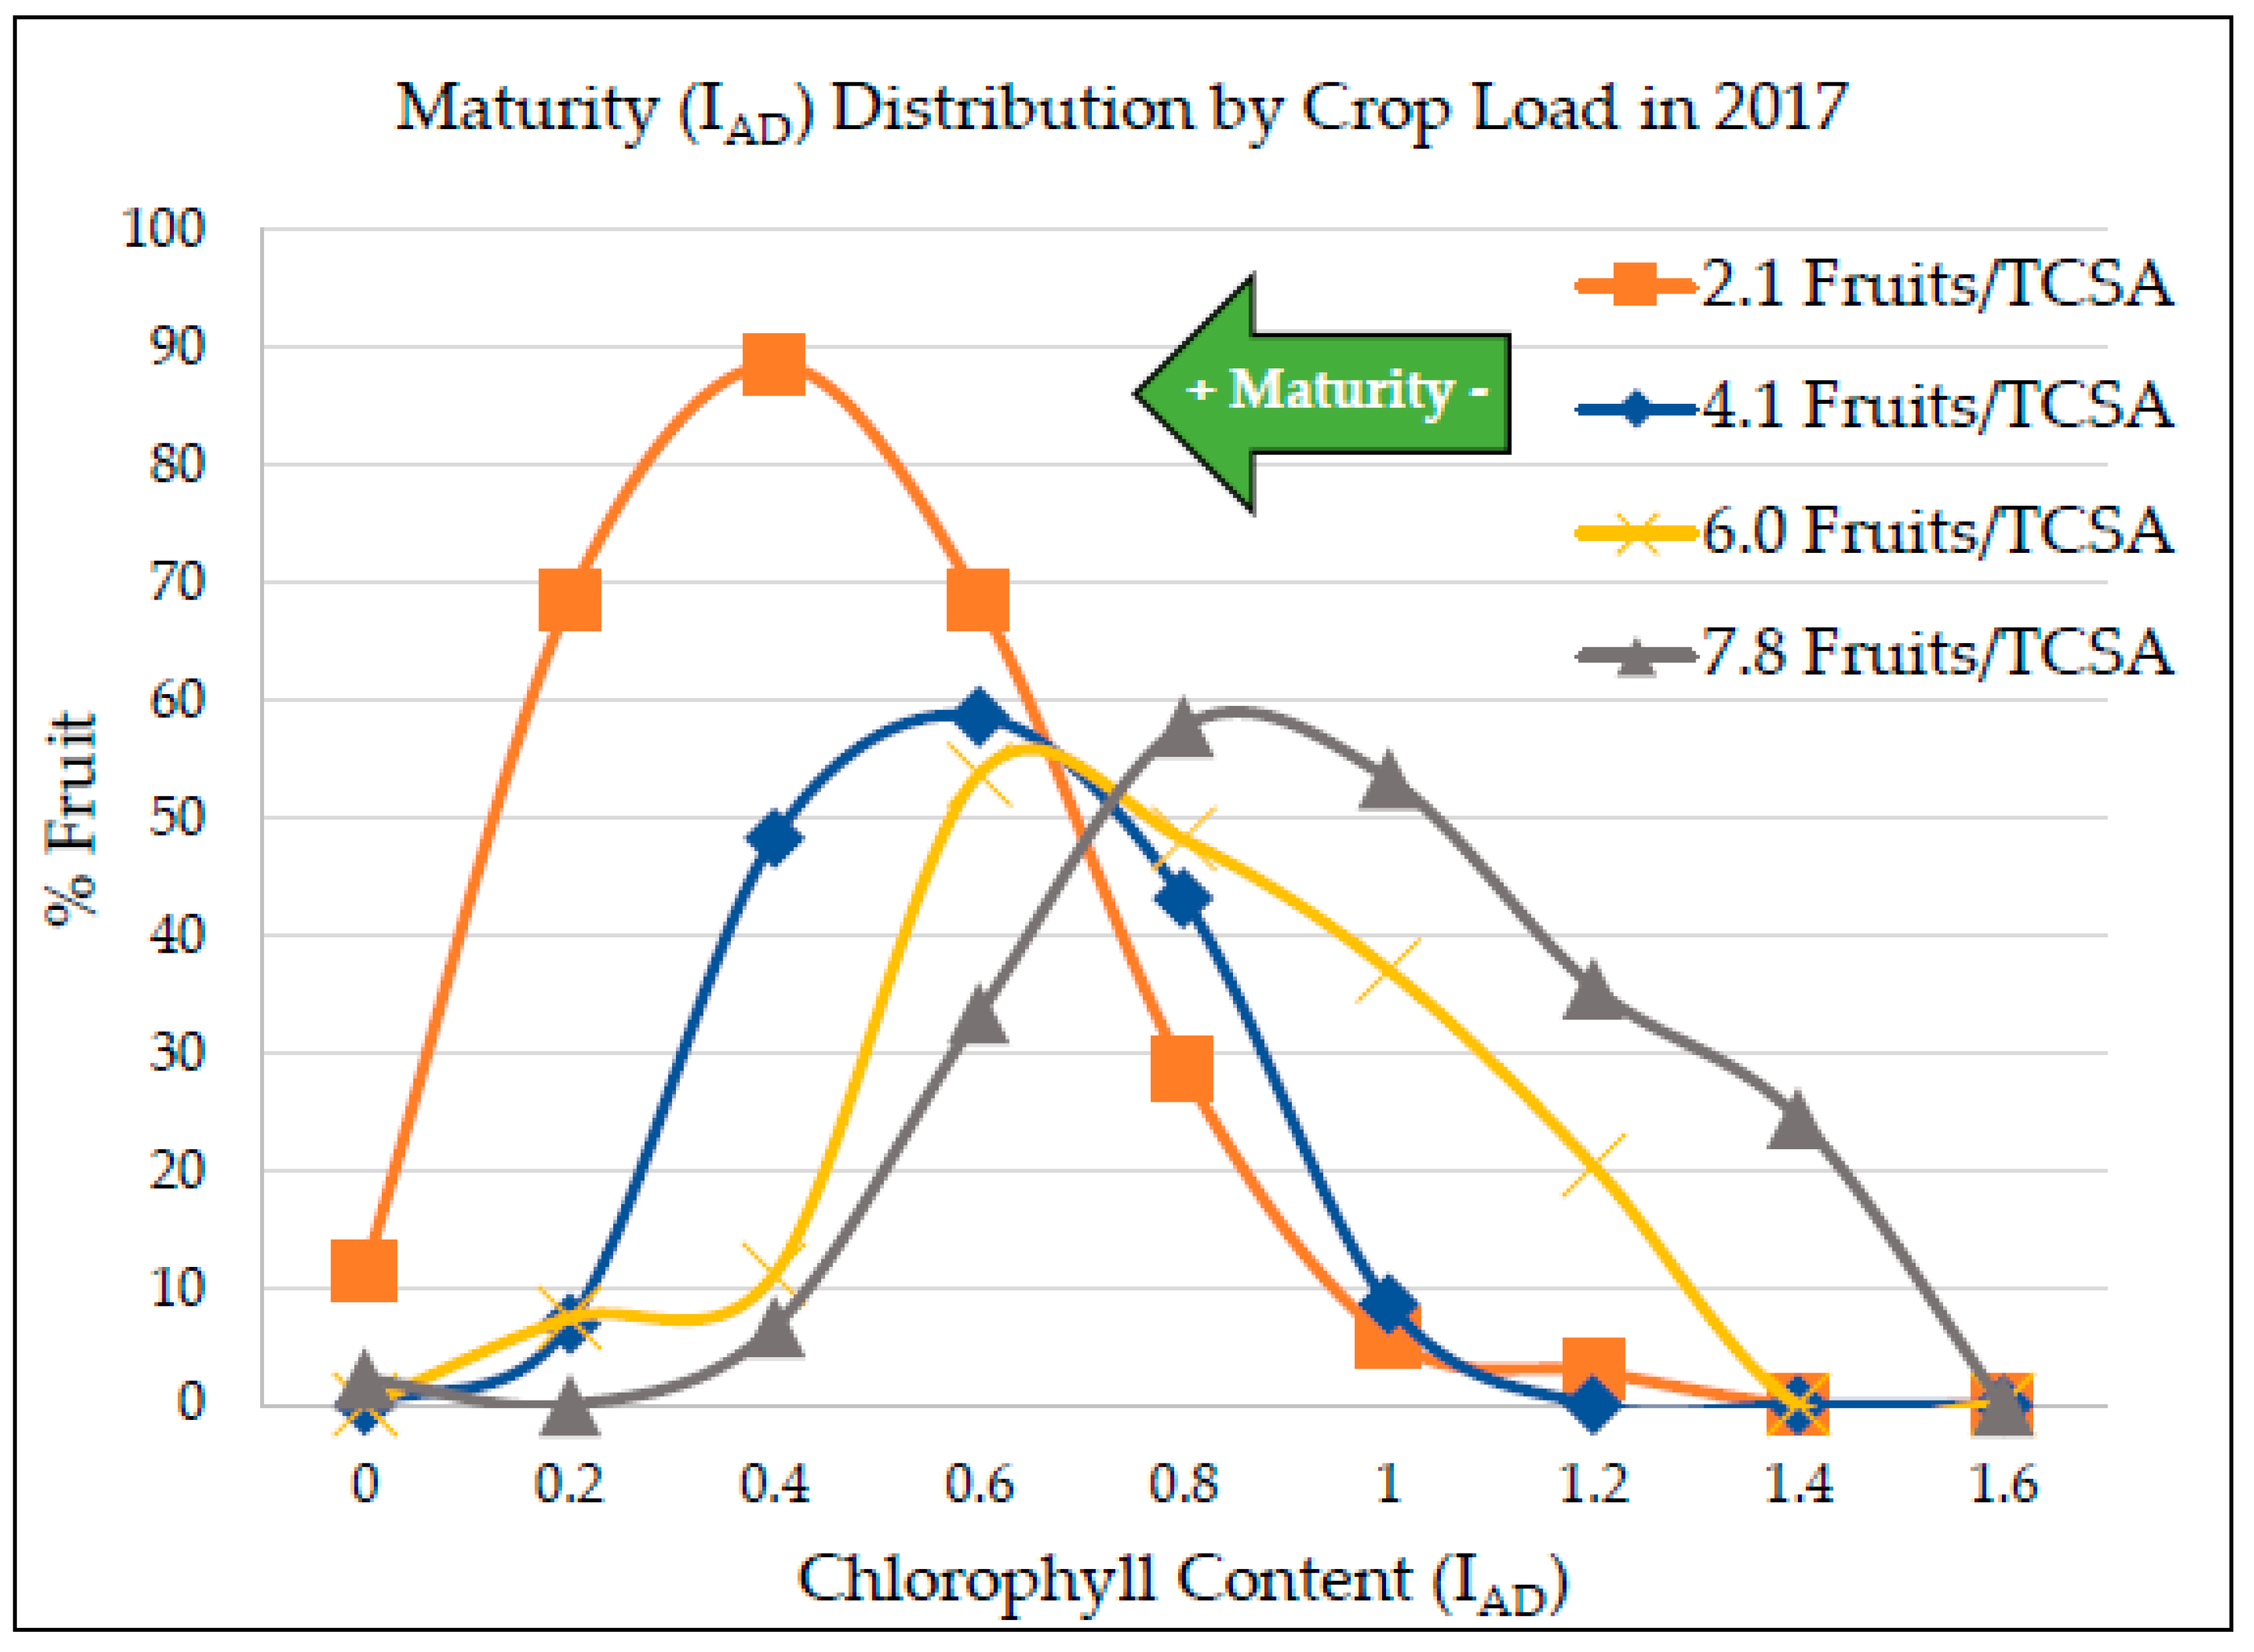
Maturity and quality parameters were evaluated on all sampled apples. Maturity was measured using the DA Meter (Sinteleia, Bologna, Italy), which measures the index of absorbance difference (I
AD), a non-destructive metric indicating fruit ripening/maturity by chlorophyll content estimation in the flesh below the skin, previously used for peaches [
35] and other apple cultivars such as “Honeycrisp” [
20,
36]. I
AD measurements were taken along the equatorial line of the shade and sun cheeks of the fruit and averaged.
Additional non-destructive quality parameters assessed included fruit weight (g), red overcolor surface (%), average red intensity of the blushed area (on a scale of 1–5), and the overcolor, background color, hue angle, and chroma were calculated for each fruit as per Serra et al. [
20], using the Minolta colorimeter (Minolta CR-300 Chroma meter, Konica Minolta, Tokyo, Japan). The destructive quality parameters assessed were flesh firmness (kg/cm
2), soluble solid content (SSC, °Brix), starch–iodine index (SI) [
35], dry matter (%), and titratable acidity (TA).
Firmness was evaluated using the Fruit Texture Analyzer (FTA) (Guss Manufacturing Ltd., Strand, South Africa) on both the sun and shade side of the apple using a 10-mm puncturing probe after peeling the area of perforation. Sun and shade side firmness values were averaged to present the whole-fruit firmness.
Starch–iodine (SI) evaluations took place on approximately 1-cm-thick cross-sectional apple slices and were sprayed with iodine solution (15 g∙L
−1 potassium iodine and 6 g∙L
−1 iodine). Five minutes after application, SI was rated by the same operator for the entire assessment on a scale of 1–6 (1 = no starch hydrolysis (black cortex), 6 = starch degradation complete (clear cortex)) accordingly to the Washington Tree Fruit Research Commission’s SI scale [
37].
Another cross-sectional slice ranging in weight between 15 g and 25 g was used to assess dry matter percentage (traditional destructive method). Each slice was cored (27 mm) to remove the seed cavities and peeled to sample only cortex tissue. Being a time-consuming procedure and requiring a lot of space to dry them out inside ovens, only three slices from each trial tree were sampled for this purpose (three slices per tree × six trees per crop load = 18 slices per crop load). Initial slice fresh weight (FW) was recorded and then the slices were placed into a forced air oven (model 179 L VWR®, Radnor, PA, USA) at 60 °C for approximately one–two weeks until weight fluctuation was minimal/absent. Dry weights (DW) were then recorded when slice weights were stable. Dry matter was calculated using the following formula: dry matter (DM)% = (DW (g) × 100)/FW (g).
Two opposite (sun and shade) thin wedges from the equatorial portion of the fruit were placed into a garlic press and juiced into a pocket refractometer (PAL-1; Atago USA Inc., Bellevue, WA, USA) to measure SSC and values expressed in Brix.
TA assessments were performed on juice samples that were obtained through the juicing of four wedges approximately 3 cm
3 in size from the top and bottom, sun and shade sides of the apple. Three replications of juice (made from equally distributed fruit) from each treatment combination were obtained, placed into 50-mL Falcon centrifuge tubes avoiding the juicing foam and immediately frozen. Later juice samples were thawed, and 5-mL juice samples were analyzed using a Tiamo titrator (Metrohm AG, Herisau, Switzerland) 888 Titrando and Sample Processor Robotic Titrosampler. The titrant used was potassium hydroxide (0.1 N). TA units were expressed as % malic acid as reported in Serra et al. [
20].
2.3. Leaf Area Quantification
Defoliation bags measuring 1.8 m × 7.0 m were made of 20% pearl shade netting (Green-Tek, Janesville, WI, USA). Nets were hung over the top wire and draped around each tree. The sides were sewn using mason line (100% nylon twine) and tied off at the bottom. Nets were hung on 30 October 2017, prior to any natural leaf drop. Leaves naturally abscised and accumulated in the basal portion of the net, where they were collected every seven to 10 days. Five leaf collections took place from 11 November 2017 to 11 December 2017.
Leaf area quantification and estimations (methodology and formulas) were conducted according to the Knerl et al. [
38], and were also assessed with an SPAD 502 Chlorophyll Meter (Spectrum Technologies, Inc., Aurora, IL, USA).
2.4. Leaf-to-Fruit Ratio Calculations
Total leaf area per tree (TLA) (sum of five collections) = ∑ LA (m2) (collection 1 to collection 5);
Total no. of leaves per tree (TLN) = ∑ total no. of leaves in sample (collection 1 to collection 5);
Leaf-area-to-fruit (LA:F) ratio = TLA/number of fruits per tree [
27];
Leaf-to-fruit ratio (L:F) = TLN/number of fruits per tree [
27];
Specific leaf area (SLA) = average leaf area (cm
2)/average leaf fresh weight (g) [
39].
2.5. Leaf and Fruit Mineral Analysis
Leaf sampling took place during the growing season on 18 July 2017. Thirty leaves (pedicel included) from each tree were selected for sampling. Three leaves were selected from the middle portion of ten one-year-old shoots (five on the east side, and five on the west side of the canopy) between the second and third wire of the canopy, approximately 1.0–1.5 m from the ground. Leaves were bagged, placed in a cooler, and brought back to the lab. Leaves were then gently scrubbed with water and Tween20 (Amresco LLC, Solon, OH, USA) then rinsed through the following steps: tap water, deionized (DI) water, and distilled water. Leaf samples were then quickly dried with a salad spinner (OXO, Chambersburg, PA, USA) and placed into a forced air oven (model 179 L VWR®, Radnor, PA, USA) for approximately one week at 60 °C until weights were stable. After samples were fully dried, dry weight (g) was recorded and ground up to powder using the A11 Basic Analytical Mill (IKA Works, Inc. Wilmington, OH, USA). The ground-up leaf samples were packaged in 50-mL Falcon tubes and sent to a certified analytical laboratory for plant tissue mineral analysis for the following macro- and micro-nutrients: N, P, K, S, Ca, Mg, Zn, Mn, Cu, Fe, and B.
During fruit quality analysis, four apples from each trial tree (six trees per crop load = 24 fruits per crop load) were selected for mineral analysis. A cross-section was sliced from each of the mineral analysis fruits. These cross-sections typically ranged from approximately 15–25 g in weight. Slices were cored, chopped into pieces, placed into six 133-mL specimen cups (one per experimental tree) and placed into the −80 °C freezer. Fruits were then freeze-dried with a lyophilizer (FreeZone 12 plus, Labconco Corporation, Kansas City, MO, USA), ground up to powder, and sent out for fruit tissue mineral analysis for the following macro- and micro-nutrients: N, P, K, S, Ca, Mg, Zn, Mn, Cu, Fe, and B.
2.6. Return Bloom
In the spring of 2018, return bloom was evaluated on the trial trees at the tight pink cluster stage. Flower cluster counting was conducted on 17 April 2018. Four trees were excluded from the return bloom counts because they were accidentally pruned during the dormant season. Return bloom was assessed classifying flower clusters by their location on different types of fruiting wood. These three categories were (a) clusters coming from terminal buds on “brindilla” and “ramo misto”, (b) clusters from lateral buds on “ramo misto”, and (c) clusters located on spurs on older branches (2+ years old) or on the main axis/tree leader. The total number of flower clusters per tree was the sum of the count from each of the three categories. Fruit set was also counted on 14 June 2018 by totaling the number of fruits on each experimental tree. Fruit set percentage was calculated by the following formula:
Fruit set % = number of fruits counted/(total flower buds (at bloom) × 6 flowers per cluster) × 100.
Trees were then tracked until harvest, to assess for “return yield”. This was the amount of fruit naturally produced per tree after being adjusted for crop load in the summer of 2017 to assess for biennial bearing.
2.7. Statistical Analysis
Yield, fruit quality at harvest, leaf area, mineral analysis, return bloom, and return yield data were all analyzed using proc -GLM in SAS (SAS Inc. Cary, NC, USA). The effects of crop load on yield, fruit quality, leaf area, mineral analysis, and return bloom were assessed for significance with an analysis of variance (ANOVA) using the Proc GLM type III sum-of-squares test (model considered significant with p < 0.05). A Student–Newman–Keuls test was performed as a post hoc means separation test to assign differing letter groups where the model was significant.


