Article

Pre-Sowing Irrigation Plus Surface Fertilization Improves Morpho-Physiological Traits and Sustaining Water-Nitrogen Productivity of Cotton

Key Laboratory of Oasis Eco-Agriculture, Xinjiang Production and Construction Group, Shihezi University, Shihezi 832003, China
*
Authors to whom correspondence should be addressed.
The authors contributed equally to this article.
Agronomy 2019, 9(11), 772; https://doi.org/10.3390/agronomy9110772
Submission received: 23 September 2019 / Revised: 12 November 2019 / Accepted: 15 November 2019 / Published: 19 November 2019
(This article belongs to the Special Issue Herbaceous Field Crops Cultivation)

Abstract

:
The changing climatic conditions are causing erratic rains and frequent episodes of moisture stress; these impose a great challenge to cotton productivity by negatively affecting plant physiological, biochemical and molecular processes. This situation requires an efficient management of water-nutrient to achieve optimal crop production. Wise use of water-nutrient in cotton production and improved water use-efficiency may help to produce more crop per drop. We hypothesized that the application of nitrogen into deep soil layers can improve water-nitrogen productivity by promoting root growth and functional attributes of cotton crop. To test this hypothesis, a two-year pot experiment under field conditions was conducted to explore the effects of two irrigation levels (i.e., pre-sowing irrigation (W80) and no pre-sowing irrigation (W0)) combined with different fertilization methods (i.e., surface application (F10) and deep application (F30)) on soil water content, soil available nitrogen, roots morpho-physiological attributes, dry mass and water-nitrogen productivity of cotton. W80 treatment increased root length by 3.1%–17.5% in the 0–40 cm soil layer compared with W0. W80 had 11.3%–52.9% higher root nitrate reductase activity in the 10–30 cm soil layer and 18.8%–67.9% in the 60–80 cm soil layer compared with W0. The W80F10 resulted in 4.3%–44.1% greater root nitrate reductase activity compared with other treatments in the 0–30 cm soil layer at 54–84 days after emergence. Water-nitrogen productivity was positively associated with dry mass, water consumption, root length and root nitrate reductase activity. Our data highlighted that pre-sowing irrigation coupled with basal surface fertilization is a promising option in terms of improved cotton root growth. Functioning in the surface soil profile led to a higher reproductive organ biomass production and water-nitrogen productivity.

1. Introduction

Cotton is a commercial cash crop providing fiber, oil, and animal feed globally [1]. With the increasing population comes an increased demand for food and fiber, but the threats of climate change are challenging crop production. Crop intensification to produce more food, fiber and feed needs more water, but water resources are limited. Although cotton is considered a drought resistance crop, its productivity is negatively affected by drought stress and nutrient deficiency which results in reduced growth, physiological, biochemical and molecular events [2,3]. Drought stress causes a 50% to 73% reduction in cotton yield [4]. Transgenic cotton cultivars are more susceptible to moisture deficit conditions [3]. Therefore, lower water availability has threatened the productivity of irrigated cotton ecosystem. Hence, strategy to increase water conservation and nutrient uptake are needed to achieve optimal cotton yield [5,6].
Water-nitrogen productivity and cotton production can be improved by application of water-nutrient at the proper growth period of cotton crop [7,8]. However, many water-nutrient conservations strategies can lead to unbalanced organs development such as, the competition between root and aerial plant part (mainly reproductive organs), thus vegetative organs growth surpass reproductive organs development, which in turn decreased water productivity and yield. Moreover, greater above ground dry matter accumulation, especially in reproductive organs can drive cotton yield [9]. An excessive root expansion can reduce growth of aerial plant parts [10,11], but lower root dry matter accumulation affects root distribution and physiological activity in the soil [12,13]. Therefore, it is essential to enhance cotton root activity and distribution in the soil to achieve higher water-nutrient productivity via balancing the growth and development between aerial and underground parts of cotton plant.
Root morphology and physiology are closely associated with the growth and development of aboveground plants. The rates and modes of water and nutrient application influences crop growth and water-nutrient productivity [11,14,15] by affecting root morphological and physiological activity [16]. Poor irrigation practices can develop a large root system and induce aging signals (such as, ABA) that can lead to low dry matter accumulation and water-nutrient productivity [17,18,19]. An efficient water-nitrogen management can enhance root functioning, increases water-nitrogen absorption, which in turn promote reproductive organ dry matter accumulation and water-nutrient productivity [16,20]. Hence, facilitating the relationship between root and water-nutrient in the root zone is essential for improving water-nutrient productive potential of reproductive organs to achieve higher water-nutrient use efficiency.
Xinjiang is the major cotton growing province in China, contributing 67% to the total national lint production [21], where low water availability and poor nutrient management have imposed a great challenge to cotton production. In cotton, root development occurs before full flowering stage and is mainly affected by soil moisture and basal fertilization. Post-sowing irrigation and snow melt can enrich deep water layer (important soil moisture storage) in the soil. This can lead to a deeper root growth, enhance water uptake, improve photosynthetic capacity and reduces irrigation frequency [20,22]. Basal fertilization can promote root growth and increase nutrient availability [23,24]. Single effects of deep water layer [20] and basal fertilization [23] on cotton root have been documented, but the effect of combine application on cotton root growth and physiology in different soil profile to regulate water-nitrogen productivity is elusive. The aim of this study was firstly to determine the effects of pre-sowing irrigation and basal fertilization on soil water content, available nitrogen, root morpho-physiological traits and above dry mass production and secondly to analyze the relationship between root growth and water-nutrient productivity in the root zone of cotton crop.

2. Materials and Methods

2.1. Details of Experimental Site

A two-year pot experiment under field conditions was conducted at the research station of Shihezi University Xinjiang, China (45°19ʹ N, 74°56ʹ E) during 2015 and 2016 growing seasons. In the region, evapotranspiration was 1425 mm. The mean rainfall and temperatures in both years are presented in Figure 1. Cotton cultivar Xinluzao 45 seeds were sown in polyvinyl chloride (PVC) tubes (diameter, 30 cm; the tubes consisted of three stacked sections; each section was 40 cm high with 120 cm height). The bottom of the tube was covered with a wire to hold soil. The soil was clay loam comprised of 1.43 g m−3 bulk density, 24.6% field capacity, 7.6 pH, 54.9 mg kg−1 alkali hydrolysable N, 16.8 mg kg−1 Olsen-P, 196 mg kg−1 exchangeable K and 12.5 g kg−1 organic matter.

2.2. Experimental Design and Crop Management

A randomized complete block design was employed with four treatments with 32 tubes per treatment. Irrigation treatments were: pre-plant irrigation (W80, watered with 0.28 m3 (80 ± 5% of field capacity) per tube before sowing), no pre-plant irrigation (W0, no water was applied over the entire depth of the tube) with two fertilization depth (i.e., surface application (F10, sufficient basal fertilizer in the 10–20 cm soil layer before sowing and deep fertilization (F30, sufficient basal fertilizer in the 30–40 cm layer before sowing)) in each tube. Nitrogen (N) was applied at the ratio of 1:4 as basal fertilizer by topdressing method. Phosphorus (P2O5) and potassium (K2O) were supplemented as basal fertilization. Urea (CO(NH2)2, 46.0% N) at the rate of 13.8 g per tube was used for N and mono-potassium phosphate at the rate of 18 g ((KH2PO4) 52.0% P2O5 and 35.4% K2O) was used per tube as P2O5 and K2O.
Four seeds per tube were sown at a depth of 3 cm on April 25th and May 1st in 2015 and 2016 growing season. Seeds were placed 10 cm apart in one direction and 20 cm apart in another direction. Four seedlings were left per tube. Drip laterals (Beijing Lvyuan Inc., Beijing, China) were installed on the top of each tube with a single emitter. The top of the tube was covered with a polyethylene film to reduce evaporation. Each pot was drip-irrigated each after four days. The total amount of water supplied to the plants was 434 mm each year. Standard local pest control measures were adopted in both cropping seasons.

2.3. Observations

During both years, soil water content, available N, dry matter accumulation, root morphological and physiological traits were assessed at 39, 54, 69, 84 and 99 days after emergence (DAE).

2.4. Soil Water Content and Available Nitrogen

The irrigation amount during growth period was based on measurement of the soil moisture content in the 0–40 cm soil layer using the Time Domain Reflectometry (TDR). Water supplied to the crop can be defined as:
A= (WpWa) × H
where A is the volume of water supplied (mm) and Wp is the field capacity in the 0–40 cm soil profile. Wa is the average relative soil moisture content in the 0–40 cm soil profile that was measured by TDR and H is the thickness of the soil layers using drip irrigation system (mm). Changes in soil moisture content in the 0–120 cm soil profile was determined by the stoving method. During root sampling, fresh soil samples were immediately collected from each soil layer (i.e., 20 cm or 10 cm) in each tube of three replications in 2015 and 2016 growing seasons. Soil was weighted then dried at 85 °C for constant weight. Soil moisture content was expressed as moisture content (g) per dry soil (g). Soil available N was determined by the alkaline hydrolysis diffusion method [25] and was expressed in mg kg−1 dry soil.

2.5. Root Growth Traits

Three tubes (each treatment) were carefully dug out from the ground level and cut down into 20 cm segments in 2015 and 10 cm segments in 2016 growing season. The segments were immersed in the water for 1 h; roots were placed on a 0.5 mm sieve and rinsed with running water. Plant debris such as weeds and dead roots were separated from ‘living’ roots according to Gwenzi et al. [26]. The live roots were placed in denoised water and stored in a refrigerator at 4°C for further analysis. Live roots were evenly spread on a plastic tray with deionized water and scanned using a flatbed scanner (300 dpi). Root images were obtained using WinRhizo image analysis software (Regent Instruments, Quebec, Canada). The software was configured to measure root length and then roots were oven-dried at 85 °C for 48 h and weighed.

2.6. Root Nitrate Reductase Activity (NR)

Nitrate reductase activity was measured according to Zhou et al. [27] method. Roots were homogenized in extraction buffer and centrifuged for 15 min at 4000 rpm. The supernatants were collected and added to the reaction buffer. After incubation at 25 °C for 30 mins, the reaction was suspended by 1 mL 1% sulphanilamide. The mixture was further centrifuged for 5 mins at 5000 rpm and N-(1-naphthyl) ethylenediamine dihydrochloride was added; the supernatant was used to assess nitrite production at 540 nm after. Root NR activity was expressed as nitrite production (µg) 1 g fresh root per hour.

2.7. Biomass Accumulation

To determine cotton biomass accumulation, three tubes (12 plants), in each treatment were chosen and cut down at the cotyledon node during each sampling day. Plant samples were dissected into leaves, stems, buds, flowers, bolls and roots. These samples were oven-dried at 85 °C for 48 h and weighed to a constant weight. A logistic function was used to describe the progress of biomass accumulation [28,29]:
Y = K 1 + a e b t
In the formula, t (d) is the number of days after emergence (DAE), Y (g) is the biomass at t, K (g) is the maximum biomass while a and b are the constants.
Based on Formula (2), we could calculate:
t 1 = 1 b ln ( 2 + 3 a )
t 2 = 1 b ln ( 2 3 a )
t m = l n a b
V m = b K 4
V t = Y 2 Y 1 t 2 t 1
where Vm (g d−1) is the highest biomass accumulation rate; tm (d) is the largest biomass accumulation period, beginning at t1 and terminating at t2. The factors Y1 and Y2 represent biomass at t1 and t2; Vt is the average biomass accumulation from t1 to t2.

2.8. Water-Nitrogen Productivity

Nitrogen productivity was defined as the total biomass (g plant−1) or the biomass of each plant organ (root, stem and leaf, bud and boll) per unit of applied fertilizer-nitrogen (g plant−1) at different growth stages [30]. In this study, nitrogen productivity was assessed at 39, 54, 69, 84 and 99 DAE.
Water productivity and soil moisture consumption rates were calculated at 39, 54, 69, 84 or 99 DAE according to the method described by Luo et al. [20]. Water productivity is the total biomass (g plant−1) or the biomass of each organ (root, stem and leaf, bud and boll) per unit water consumption (cm3 plant−1). Moisture consumption rate was calculated according to Luo et al. [20].

2.9. Statistical Analysis

Analysis of variance (ANOVA), path analysis was performed using SPSS software version 16.0 (SPSS Inc., Chicago, IL, USA). Correlation analysis was performed using the “heatmap” package in R version 3.5.2. Treatments were separated using the least significant difference (LSD) tests at p ≤ 0.05. Figures were constructed using Sigma Plot software version 10.0 (Systat Software Inc., San Jose, CA, USA). Data represent means ± SD.

3. Results

3.1. Soil Water Content and Available Nitrogen
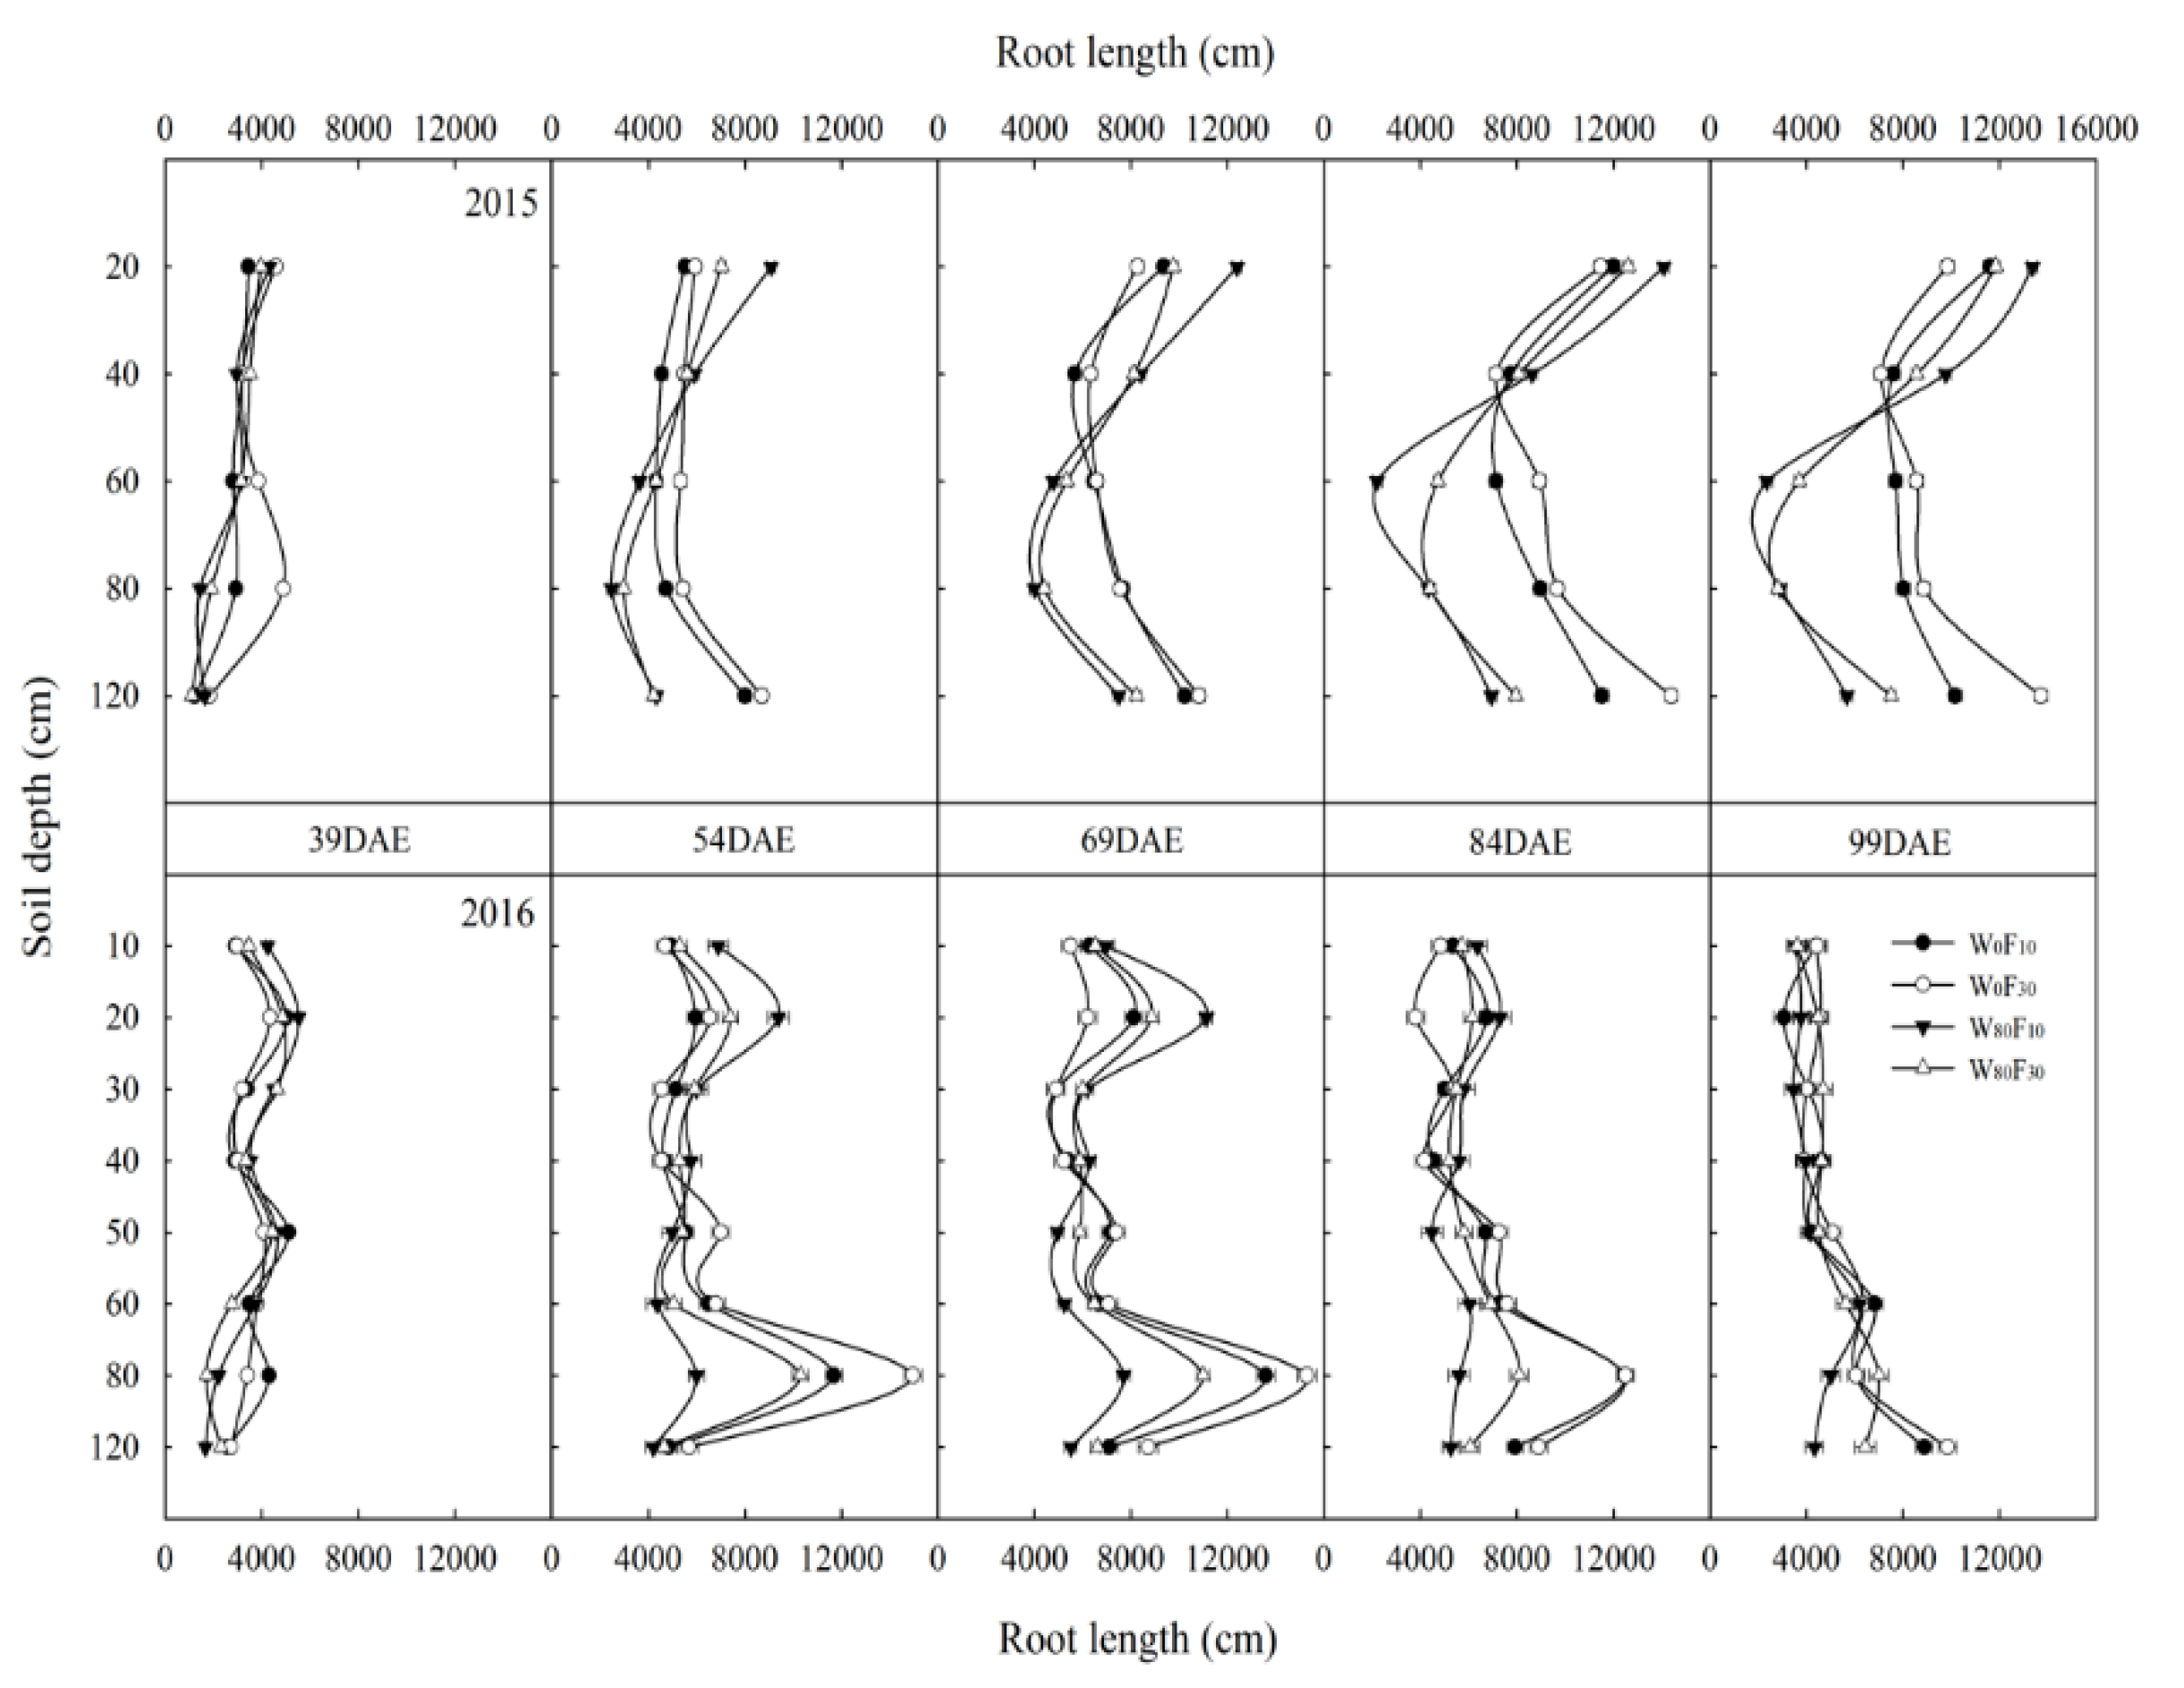
Soil moisture content increased by 30.8%–53.1% for W80 treatment compared with W0 in the 40–120 cm soil layer prior to 84 DAE (Figure 2). Water consumption of W80 was 28.1% more than that of W0 in the 0–40 cm soil profile during whole growth period. No significant differences were observed between F10 and F30 treatment.
Under W80 treatment soil available N decreased by 22% in the 0–40 cm soil layer throughout the growth period (Figure 2) but increased by 7.6% in the 60–120 cm soil layer compared with W0 treatment. No significant differences were observed in the 40–60 cm soil layer. F10 treatment had 0.8% and 13.0% lower soil available N compared with F30 treatment in the 0–30 cm and 60–80 cm soil layer before 84 DAE, while other soil layer remained unaffected.

3.2. Root Length

Cotton plant root length was significantly affected by irrigation levels and fertilization during the whole growth period. Root length gradually increased with the plant development but decreased later in the season (Figure 3). W80 treatment increased root length by 3.1–17.5% in the 0–40 cm soil layer but decreased by 7.7–66.1% in the 40–120 cm soil layer after 54 DAE than W0 treatment. W80 F10 treatment had 3.5%–29.5% higher root length in the 0–40 cm soil layer, but 1.2%–10.5% lowered root length was observed in the 40–120 cm soil layer after 54 DAE compared with W0 F30.

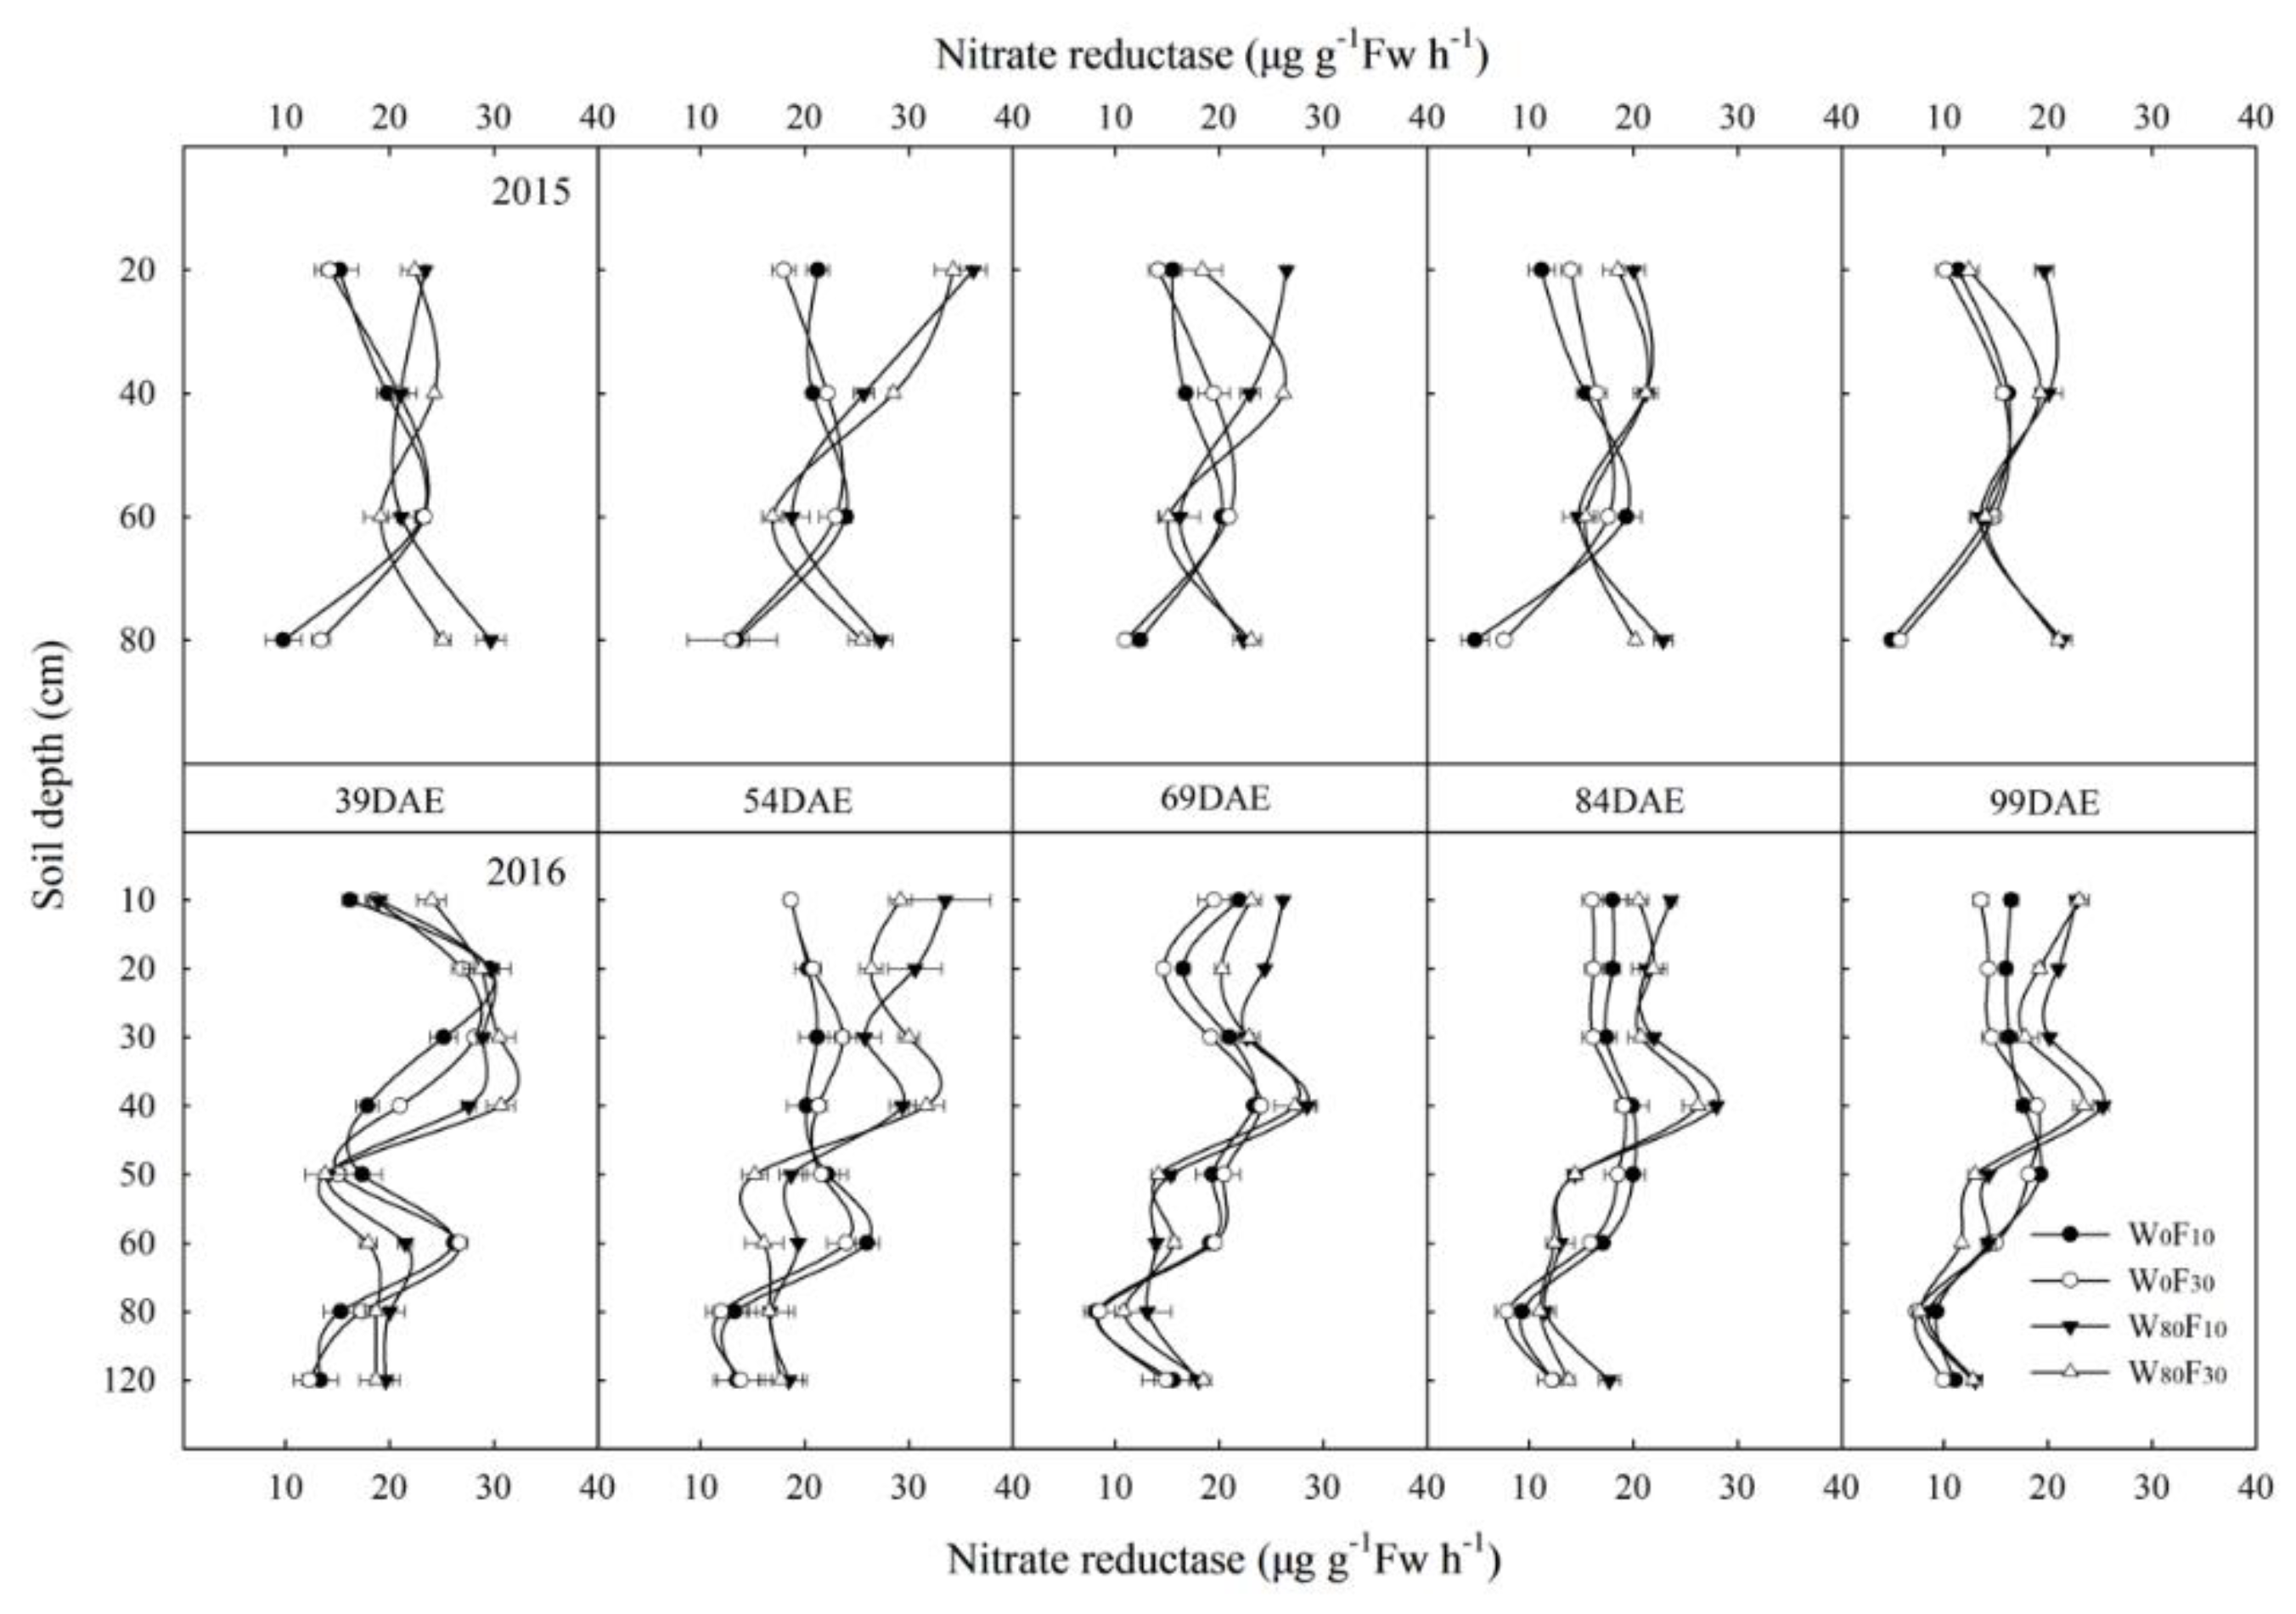
3.3. Root Nitrate Reductase Activity

Nitrate reductase activity was rose with the plant development but gradually decreased in the 0–10 cm layer (Figure 4). Compared with W80 treatment, nitrate reductase activity in W0 increased by 11.3%–52.9% and 18.8%–67.9%, respectively in the 0–40 and 60–120 cm soil depth at each growth stage but decreased by 13.5%–24.0% in the 40–60 cm soil profile. F10 treatment had 4.3%–44.1% and 7.2–18.3% higher nitrate reductase activity in the 10–20 cm and 40–60 cm soil layer soil profile at 54 to 84 and prior 69 DAE over F30 fertilization.

3.4. Cotton Plant Biomass Accumulation

Nitrogen and irrigation application method significantly altered cotton plant vegetative and reproductive organs biomass accumulation during both years (Table 1). Root, stem plus leaf, bolls and total plant biomass accumulation increased by 11.6%, 30.5%, 48.2% and 22.4%, respectively, in W80 over W0 treatment. A 10% and 2% higher root and reproductive organs biomass produced in W80 F10 treatment compared with W80 F30 during both growing seasons.
Simulation of biomass accumulation with respect to DAE was determined by formulas 2, 3, 4, 5, 6 and 7 (Table 2). In W80 treatments, total biomass and above biomass fast accumulation period was prolonged by 2–7 d and 5–10 d, root and boll biomass accumulation at fastest accumulation period was shortened by 2 d and 4–5 d, respectively, compared with W0 treatment. W80 treatment had higher both total reproductive and vegetative organ biomass accumulation for maximum and average biomass accumulation rates during the fastest accumulation period than W0 treatment. Under W80F10 total, stem, leaf and root biomass accumulation were extended by 1, 2, 10 and 1 d at fastest accumulation period compared with F30. W80F10 had 13.9%, 12.5%, 10.9%, 15.0%, 17.5% 13.9%, 10.0% and 28.6% higher maximum and average accumulation rates of total, aerial plant parts, boll, stem plus leaf and root biomass accumulation compared with W80F30 treatment.

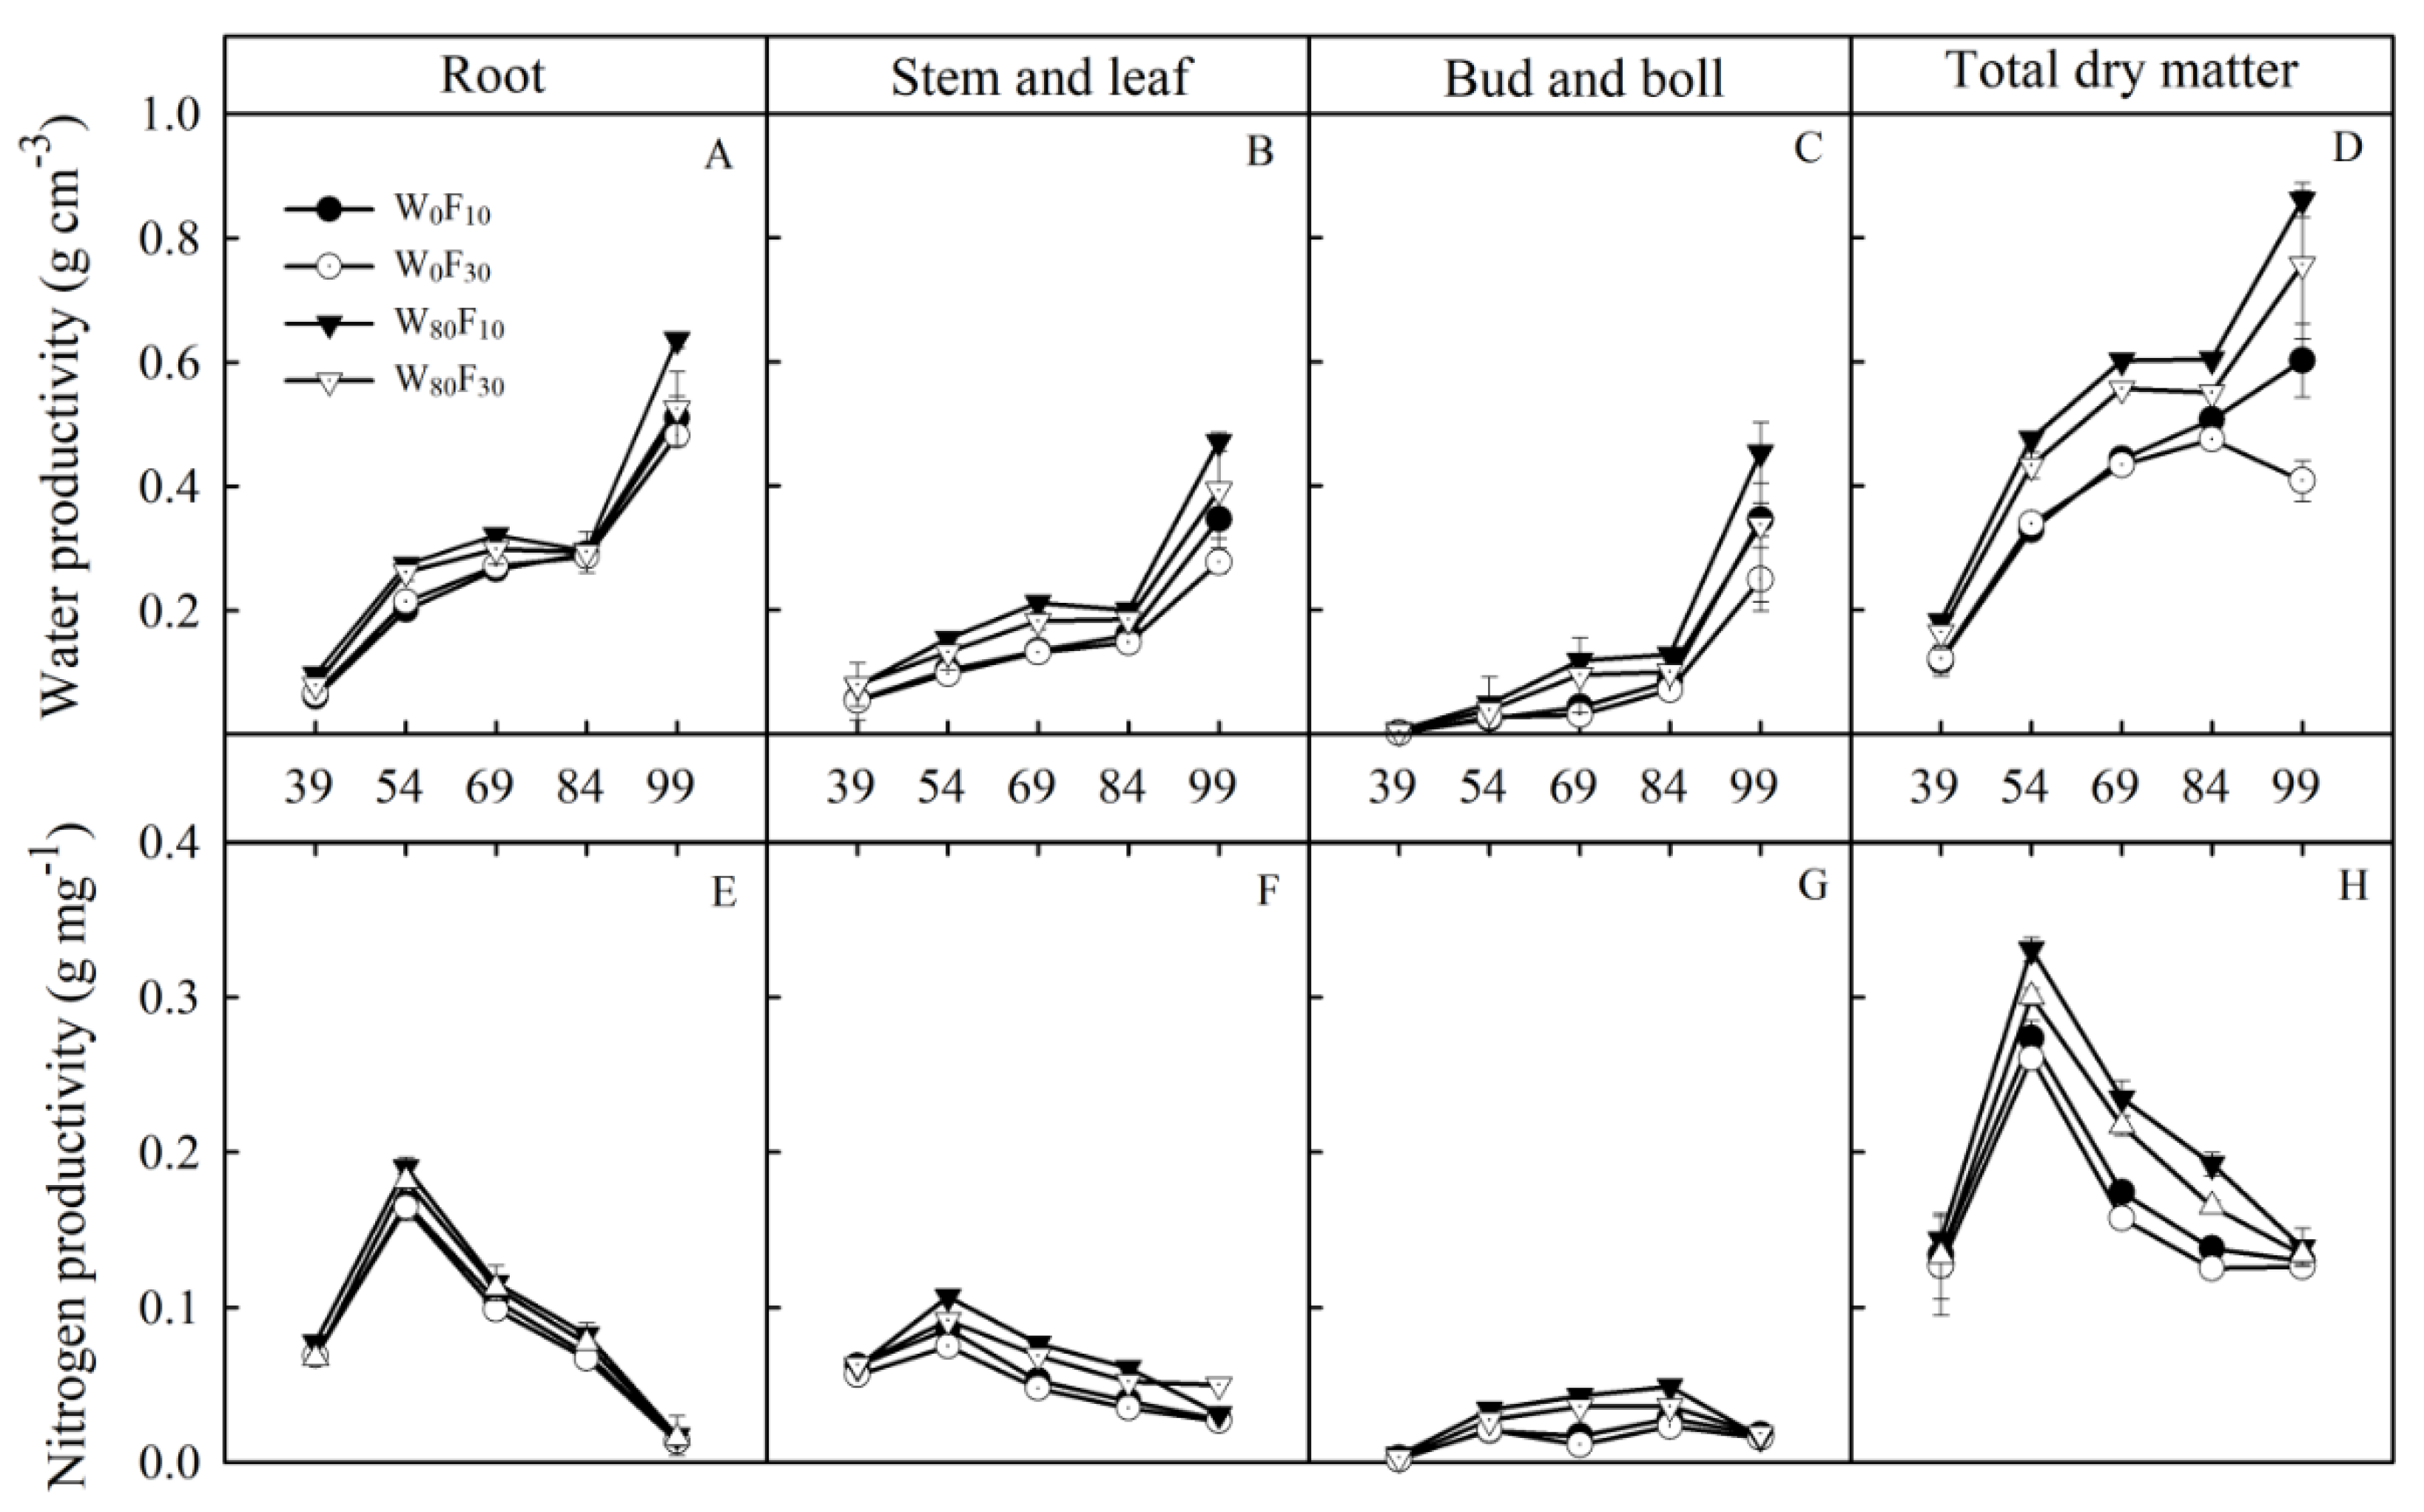
3.5. Water-Nitrogen Productivity

Moisture consumption rate remained unaffected under both W80 and W0 treatment (Table 3). Compared with W0, 8.1%, 31.1%, 52.6% and 39.2% greater root, stem plus leaf, bud plus boll and total biomass water productivity resulted in W80 in all growth stages (Figure 5). W80F10 resulted in 32.0% and 15.2% higher total water and reproductive organs productivity respectively, compared with F30 after 84 DAE.
Root nitrogen productivity had no significant difference under both W80 treatment and W0 treatment (Table 4, Figure 6). Nitrogen productivity of stem plus leaves, reproductive organs and total productivity increased by 31.3%, 42.9% and 23.1% in W80 compared with W0 at 54 to 99 DAE. F10 produced 18.2%, 22.2% and 6.5% greater root, reproductive organs and total N productivity compared with F30 from 54 DAE to 99 DAE.

3.6. Factors Affecting Productivity

Soil moisture content was positively related to nitrate reductase activity and available N, but had a negative relationship with root length, root dry matter, vegetative and reproductive organs dry matter accumulation (Figure 6). Water productivity of stem, leaf, bud and boll were negatively associated with soil moisture content and available N, but had a positive relationship with root dry matter, stem plus leaf dry matter and bud plus boll dry matter production. Root, stem and leaf water-N were positively related with bud plus boll water and N productivity.
Pathway analysis showed that root length, nitrate reductase activity had a strong direct effect on boll water-nitrogen productivity (Table 5). Nitrate reductase activity had higher indirect effect on bud plus boll water productivity through soil moisture content. Nitrate reductase activity had significantly indirect effect on bud plus boll nitrogen productivity through available nitrogen than root length. This shows that improved root distribution and physiological activities could directly, or indirectly enhance water-nitrogen productivity.

4. Discussion

Water-nutrient application is an efficient strategy for improving plant performance under harsh environmental conditions i.e., drought stress, which ensures high cotton yield due to optimize root growth and activity in the soil [16,31]. In the present study, pre-sowing irrigation and basal surface fertilization significantly increased root distribution and physiological activity in the surface or deep soil profile at the boll setting stage. Improvement in these root traits contributed to greater shoot biomass and higher reproductive organ biomass accumulation led to greater water-nitrogen productivity.
Deeper root penetration can maximize soil moisture and nutrients uptake that can lead to maintain a high plant water and nutrient status [16,32,33]. We observed that pre-sowing irrigation and surface fertilization significantly increased root distribution and physiological activity in the surface soil (0–30 cm), indicating that improved the absorption and utility of water-nitrogen [34]. Because basal surface fertilizer application increased available water-N in the surface soil layer, which promoted cotton root distribution and physiological activity in the surface soil. This improved the absorption and utility of water-N and reduced the residual water-N in the surface soil profile. Moreover, root nitrate reductase activity in the deep soil profile (60–120 cm) enhanced, which indicated that decreasing root distribution regardless of improved root physiological activity in deep soil profile [20]. It is suggested that higher root distribution and physiological activity in both surface and deep soil profile could facilitate root and water-nutrient environment in the root zone, which can lead to higher root water-nitrogen absorption in cotton.
A strong relationship existed between root and shoot; shoots supply sufficient carbohydrates to roots that can develop and maintain root functioning which in turn can improve shoot growth by supplying a sufficient amount of nutrients, water and phytohormone. This further ensures crop productivity [5,35,36]. In this study, we observed that greater dry matter accumulated and allocation to the aerial parts has led to lower dry matter production in root and its physiological activity later in the season. The reason might be due to functional period of root (within 54–84 DAE) and the root biomass fast accumulation period (28–40 DAE) under different water-nitrogen management did not correspond. Root proliferation and physiological activity are positively associated with the root zone environment [32,33]. Therefore, pre-sowing irrigation and basal surface fertilization coordinates the relationship between root and water-nutrient in the soil. This in turn increased root absorptive capacity of water-nitrogen.
It is noteworthy that optimal water-nitrogen application could change the distance between water-nitrogen and root in the soil [16,37] as well as root physiological activity [33] to enhance the absorption of water-nitrogen. However, our data across the two years demonstrated that the water-nitrogen is an important management practice that can adjust the water-nitrogen productive ability in different plant organs which could result in greater water-nitrogen uptake. The possible reason might be improved root distribution and physiological activity in the surface soil and root physiological activity in the deep soil profile at 54–84 DAE promoted absorption of water-nitrogen from irrigation and deep layer water. This resulted in higher water-nitrogen productivity of reproductive organs at the boll setting stage. Secondly, root distribution and physiological activity could ensure the application of water-nitrogen, which increased leaf photosynthetic efficiency and leaf gas change parameters led to greater dry matter accumulation [22]. An adequate water-nitrogen in soil may decrease root distribution [15,20] and root dry matter at the fast accumulation period before 40 DAE. These phenomenon in turn decreased root dry matter accumulation and increased dry matter accumulation above ground parts at the boll setting stage (within 69–84 DAE).
Water use efficiency in terms of physiology is defined as the ratio transpiration and photosynthesis [38]. Lower dry mass accumulation in the aerial part can lead to a higher water-nitrogen use efficiency, but reducing water-nitrogen productive ability [10,32]. Interestingly, we observed that increasing root distribution and physiological activity in the surface soil layer and root physiological activity in deep soil layer at the boll setting stage can directly or indirectly promote dry mass accumulation and water-nitrogen productivity of the reproductive organs. More root distribution can boost water use efficiency and drought resistance and consequently greater crop yield [33,39]. Higher root distribution led to a lower biomass accumulation in the aerial parts of crop plants [10,32]. We speculated that increasing root distribution and physiological activity can drive reproductive organs dry mass accumulation which results in higher water-nitrogen productivity of cotton crop.

5. Conclusions

Pre-sowing irrigation and surface basal fertilization could significantly promote reproductive organ biomass accumulation and productive ability of water-nitrogen. Pre-sowing irrigation combined with basal surface fertilization favored root morphological and physiological performance i.e., greater root biomass, longer root length in the surface soil profile (0–30 cm), higher root nitrate reductase activity in the surface or deep soil profile (60–80 cm) at the boll setting stage. Improvements in these root traits led to a higher water-nitrogen consumption, accumulation and allocation of reproductive structures of cotton plant. This in turn contributed to a higher water-nitrogen productive ability of the reproductive organ at the boll setting stage. These data highlighted that pre-sowing irrigation combined with basal surface fertilization is a promising option in terms of higher root morphological and physiological activity and water-nitrogen productivity of cotton crop in the arid region.

Author Contributions

Writing & conceptualization, Z.C.; data curation, H.G.; investigation, F.H.; writing—review & editing, A.K. and H.L.

Funding

This research was funded by the National Natural Science Foundation of China (31760355) and Program of Youth Science and Technology Innovation Leader of The Xinjiang Production and Construction Corps (2017CB005).

Acknowledgments

Shihezi University and the National Natural Science Foundation of China are acknowledged for their financial support to the study.

Conflicts of Interest

All the authors have approved the manuscript and agree with submission to your esteemed journal. There are no conflicts of interest to declare.

References

  1. Constable, G.A.; Bange, M.P. The yield potential of cotton (Gossypium hirsutum L.). Field Crops Res. 2015, 182, 98–106. [Google Scholar] [CrossRef]
  2. Khan, A.; Tan, D.K.Y.; Afridi, M.Z.; Luo, H.; Tung, S.A.; Ajab, M.; Fahad, S. Nitrogen fertility and abiotic stresses management in cotton crop: A review. Environ. Sci. Pollut. R 2017, 24, 14551–14566. [Google Scholar] [CrossRef] [PubMed]
  3. Khan, A.; Pan, X.D.; Najeeb, U.; Tan, D.K.Y.; Fahad, S.; Zahoor, R.; Luo, H.H. Coping with drought: Stress and adaptive mechanisms, and management through cultural and molecular alternatives in cotton as vital constituents for plant stress resilience and fitness. Biol. Res. 2018, 51, 47. [Google Scholar] [CrossRef] [PubMed]
  4. Berry, P.; Ramirezvillegas, J.; Bramley, H.; Mgonja, M.A.; Mohanty, S.; Jackson, M.; Fordlloyd, B.; Parry, M. Regional impacts of climate change on agriculture and the role of adaptation. In Plant Genetic Resources and Climate Change; CABI: London, UK, 2014; Volume 2, pp. 78–97. [Google Scholar]
  5. Zhang, X.Y.; Chen, S.Y.; Sun, H.Y.; Wang, Y.M.; Shao, L.W. Root size, distribution and soil water depletion as affected by cultivars and environmental factors. Field Crops Res. 2009, 114, 75–83. [Google Scholar] [CrossRef]
  6. Bouman, B.A.M. A conceptual framework for the improvement of crop water productivity at different spatial scales. Agric. Syst. 2007, 93, 43–60. [Google Scholar] [CrossRef]
  7. Afridi, M.Z.; Jan, M.T.; Arif, M.; Jan, A. Wheat yielding components response to different levels of fertilizer-N application time and decapitation stress. Sarhad J. Agric. 2010, 26, 499–506. [Google Scholar]
  8. Liao, N.; Hou, Z.; Qi, L.I.; Ru, S.; Huijuan, B.O. Increase effect of biochar on cotton yield and nitrogen use efficiency under different nitrogen application levels. Plant Nutr. Fertil. Sci. 2015, 21, 782–791. [Google Scholar]
  9. Dai, J.L.; Li, W.J.; Tang, W.; Zhang, D.M.; Li, Z.H.; Lu, H.Q.; Eneji, A.E.; Dong, H.Z. Manipulation of dry matter accumulation and partitioning with plant density in relation to yield stability of cotton under intensive management. Field Crops Res. 2015, 180, 207–215. [Google Scholar] [CrossRef]
  10. Rao, S.S.; Tanwar, S.P.S.; Regar, P.L. Effect of deficit irrigation, phosphorous inoculation and cycocel spray on root growth, seed cotton yield and water productivity of drip irrigated cotton in arid environment. Agric. Water Manag. 2016, 169, 14–25. [Google Scholar] [CrossRef]
  11. Han, H.M.; Tian, Z.W.; Fan, Y.H.; Cui, Y.K.; Cai, J.; Jiang, D.; Cao, W.X.; Dai, T.B. Water-deficit treatment followed by re-watering stimulates seminal root growth associated with hormone balance and photosynthesis in wheat (Triticum aestivum L.) seedlings. Plant Growth Regul. 2015, 77, 201–210. [Google Scholar] [CrossRef]
  12. Song, H.; Feng, B.L.; Gao, X.L.; Dai, H.P.; Zhang, P.P. Relationship between root activity and leaf Senescence in different adzuki bean cultivars (lines). Acta Bot. Boreali-Occident. Sin. 2011, 31, 2270–2275. [Google Scholar]
  13. Amanullah. Effects of NPK source on the dry matter partitioning in cool season C3-cereals (wheat, rye, barley, and oats) at various growth stages. J. Plant Nutr. 2017, 40, 352–364. [Google Scholar] [CrossRef]
  14. Flexas, J.; Bota, J.; Galmes, J.; Medrano, H.; Ribas-Carbo, M. Keeping a positive carbon balance under adverse conditions: Responses of photosynthesis and respiration to water stress. Physiol. Plant. 2006, 127, 343–352. [Google Scholar] [CrossRef]
  15. Li, K.F.; Zhang, F.C.; Qi, Y.L. Effects of water and fertility spatial coupling in root zone soil of winter wheat on root growth and activity. Agric. Res. Arid Areas 2009, 27, 48–52. [Google Scholar]
  16. Wasson, A.P.; Richards, R.A.; Chatrath, R.; Misra, S.C.; Prasad, S.V.; Rebetzke, G.J.; Kirkegaard, J.A.; Christopher, J.; Watt, M. Traits and selection strategies to improve root systems and water uptake in water-limited wheat crops. J. Exp. Bot. 2012, 63, 3485–3498. [Google Scholar] [CrossRef]
  17. Liu, R.X.; Zhou, Z.G.; Guo, W.Q. Effects of N fertilization on root development and activity of water-stressed cotton (Gossypium hirsutum L.) plants. Agric. Water Manag. 2008, 95, 1261–1270. [Google Scholar] [CrossRef]
  18. Chen, Y.L.; Zhang, J.; Li, Q.; He, X.L.; Su, X.P.; Chen, F.J.; Yuan, L.X.; Mi, G.H. Effects of nitrogen application on post-silking root senescence and yield of maize. Agron. J. 2015, 107, 835–842. [Google Scholar] [CrossRef]
  19. Klimesova, J.; Nobis, M.P.; Herben, T. Senescence, ageing and death of the whole plant: Morphological prerequisites and constraints of plant immortality. New Phytol. 2015, 206, 14–18. [Google Scholar] [CrossRef]
  20. Luo, H.; Zhang, H.; Han, H.; Hu, Y.; Zhang, Y.; Zhang, W. Effects of water storage in deeper soil layers on growth, yield, and water productivity of cotton (Gossypium Hirsutum L.) in arid areas of northwestern China. Irrig. Drain. 2014, 63, 59–70. [Google Scholar] [CrossRef]
  21. Lu, X.R.; Jia, X.Y.; Niu, J.H. The present situation and prospects of cotton industry development in China. Sci. Agric. Sin. 2018, 51, 26–36. [Google Scholar]
  22. Chen, Z.K.; Niu, Y.P.; Ma, H.; Hafeez, A.; Luo, H.H.; Zhang, W.F. Photosynthesis and biomass allocation of cotton as affected by deep-layer water and fertilizer application depth. Photosynthetica 2017, 55, 638–647. [Google Scholar] [CrossRef]
  23. Shen, Y.F.; Li, S.Q. Effects of the spatial coupling of water and fertilizer on the chlorophyll fluorescence parameters of winter wheat leaves. Agric. Sci. Chin. 2011, 10, 1923–1931. [Google Scholar] [CrossRef]
  24. Garrido-Lestache, E.; Lopez-Bellido, R.J.; Lopez-Bellido, L. Effect of N rate, timing and splitting and N type on bread-making quality in hard red spring wheat under rainfed Mediterranean conditions. Field Crops Res. 2004, 85, 213–236. [Google Scholar] [CrossRef]
  25. Baethgen, W.E.; Alley, M.M. Optimizing soil and fertilizer nitrogen use by intensively managed winter wheat. I. crop nitrogen uptake. Agron. J. 1989, 81, 120–125. [Google Scholar] [CrossRef]
  26. Gwenzi, W.; Veneklaas, E.J.; Holmes, K.W.; Bleby, T.M.; Phillips, I.R.; Hinz, C. Spatial analysis of fine root distribution on a recently constructed ecosystem in a water-limited environment. Plant Soil 2011, 344, 255–272. [Google Scholar] [CrossRef]
  27. Zhou, Z.; He, H.; Ma, L.; Yu, X.; Mi, Q.; Pang, J.; Tang, G.; Liu, B. Overexpression of a GmCnx1 gene enhanced activity of nitrate reductase and aldehyde oxidase, and boosted mosaic virus resistance in soybean. PLoS ONE 2015, 10, e0124273. [Google Scholar] [CrossRef]
  28. Yang, G.Z.; Tang, H.Y.; Nie, Y.C.; Zhang, X.L. Responses of cotton growth, yield, and biomass to nitrogen split application ratio. Eur. J. Agron. 2011, 35, 164–170. [Google Scholar] [CrossRef]
  29. Wang, Z.S.; Min, X.U.; Liu, R.X.; Xiao-Dong, W.U.; Zhu, H.; Chen, B.L.; Zhou, Z.G. Effects of nitrogen rates on biomass and nitrogen accumulation of cotton with different varieties in growth duration. Cotton Sci. 2011, 23, 537–544. [Google Scholar]
  30. Xu, G.H.; Fan, X.R.; Miller, A.J. Plant nitrogen assimilation and use efficiency. Annu. Rev. Plant Biol. 2012, 63, 153–182. [Google Scholar] [CrossRef]
  31. Hu, X.T.; Chen, H.; Wang, J.; Meng, X.B.; Chen, F.H. Effects of soil water content on cotton root growth and distribution under mulched drip irrigation. Agric. Sci. Chin. 2009, 8, 709–716. [Google Scholar] [CrossRef]
  32. Palta, J.A.; Chen, X.; Milroy, S.P.; Rebetzke, G.J.; Dreccer, M.F.; Watt, M. Large root systems: Are they useful in adapting wheat to dry environments? Funct. Plant Biol. 2011, 38, 347–354. [Google Scholar] [CrossRef]
  33. Lynch, J.P. Steep, cheap and deep: An ideotype to optimize water and N acquisition by maize root systems. Ann. Bot. 2013, 112, 347–357. [Google Scholar] [CrossRef] [PubMed]
  34. Zwart, S.J.; Bastiaanssen, W.G.M. Review of measured crop water productivity values for irrigated wheat, rice, cotton and maize. Agric. Water Manag. 2004, 69, 115–133. [Google Scholar] [CrossRef]
  35. Osaki, M.; Shinano, T.; Matsumoto, M.; Zheng, T.; Tadano, T. A root-shoot interaction hypothesis for high productivity of field crops. Soil Sci. Plant Nutr. 1997, 43, 445–454. [Google Scholar] [CrossRef]
  36. Yang, L.; Zheng, B.; Mao, C.; Qi, X.; Liu, F.; Wu, P. Analysis of transcripts that are differentially expressed in three sectors of the rice root system under water deficit. Mol. Genet. Genom. 2004, 272, 433–442. [Google Scholar] [CrossRef]
  37. Wu, H.X.; Ma, Y.Z.; Xiao, J.P.; Zhang, Z.H.; Shi, Z.H. Photosynthesis and root characteristics of rice (Oryza sativa L.) in floating culture. Photosynthetica 2013, 51, 231–237. [Google Scholar] [CrossRef]
  38. Blum, A. Drought resistance, water-use efficiency, and yield potential—Are they compatible, dissonant, or mutually exclusive? Aust. J. Agric. Res. 2005, 56, 1159–1168. [Google Scholar] [CrossRef]
  39. Lilley, J.M.; Kirkegaard, J.A. Benefits of increased soil exploration by wheat roots. Field Crops Res. 2011, 122, 118–130. [Google Scholar] [CrossRef]
Figure 1. The daily total solar radiation (MJ m−2), total precipitation (mm), maximum and minimum air temperature (°C) during cotton growing season in Shihezi (2015–2016).
Agronomy 09 00772 g001
Figure 2. Changes in the soil moisture and the available nitrogen in different vertical soil layer (from 0 to 120 cm soil layer) at pre-sowing irrigation (W80) or no pre-sowing irrigation (W0) and base fertilizer surface (F10) or deep (F30) application with the days after emergence in 2016. Bars indicate SD (n = 3).
Agronomy 09 00772 g002
Figure 3. Changes in the root length in different vertical soil layer (from 0 to 120 cm soil layer) at pre-sowing irrigation (W80) or no pre-sowing irrigation (W0) and basal surface fertilization (F10) or deep (F30) application with the days after emergence (DAE).
Agronomy 09 00772 g003
Figure 4. Changes in the nitrate reductase activity (μg g−1FW h−1) in different vertical soil layer (from 0 to 120 cm soil layer) at pre-sowing irrigation (W80) or no pre-sowing irrigation (W0) and basal surface fertilization (F10) or deep (F30) application with the days after emergence (DAE) in 2015 and 2016. Bars indicate SD (n = 3).
Agronomy 09 00772 g004
Figure 5. Dynamic change of root (A), stem and leaf (B), bud and boll (C) and total dry matter (D) water productivity and root (E), stem and leaf (F), bud and boll (G) and total dry matter (H) nitrogen productivity plant-1 at pre-sowing irrigation (W80) or no pre-sowing irrigation and basal surface fertilization (F10) or deep (F30) application with the days after emergence (DAE) in 2016. Bars indicate SD (n = 3).
Agronomy 09 00772 g005
Figure 6. Correlation analysis (n = 30) of soil water content (SM), available nitrogen (AN, mg kg−1), the root length (RL, cm), nitrate reductase (NR, μg g−1FW h−1), root dry matter (RDM, g plant−1), stem and leaf dry matter (SDM, g plant−1), bud and boll dry matter (BDM, g plant−1) and total dry matter (TDM, g plant−1) with nitrogen productivity and water productivity at pre-sowing irrigation (W80) or no pre-sowing irrigation and base fertilizer surface (F10) or deep (F30) application with 2016. RWP, root water productivity (g DM cm−3); SWP, stem and leaf water productivity (g DM cm−3); BWP, bud and boll water productivity (g DM cm−3); TWP, total water productivity (g DM cm−3); RNP, root nitrogen productivity (g DM mg−1); SNP, stem and leaf nitrogen productivity (g DM mg−1); BNP, bud and boll nitrogen productivity (g DM mg−1); TWP, total nitrogen productivity (g DM mg−1).
Agronomy 09 00772 g006
Table 1. Changes in vegetative and reproductive and total organ biomass accumulation under different irrigation and fertilization during 2015 and 2016.
YearsTreatmentsRoot Dry Matter
(g plant−1)
Stem and Leaf Dry Matter
(g plant−1)
Bud and Boll Dry Matter
(g plant−1)
The Total Dry Matter
(g plant−1)
2015W0F1019.8 ± 0.42 c19.6 ± 0.05 c17.4 ± 0.59 c62.06 ± 0.48 b
W0F3019.9 ± 0.29 c16.2 ± 0.27 d13.1 ± 0.9 d53.47 ± 1.53 c
W80F1023.2 ± 0.19 a22.1 ± 0.10 a23.9 ± 0.01 a70.02 ± 0.82 a
W80F3021.1 ± 0.31 b24.6 ± 0.04 b21.3 ± 1.37 b71.4 ± 1.49 a
2016W0F1021.5 ± 0.79 c12.2 ± 0.09 c12.2 ± 0.04 c45.87 ± 0.92 c
W0F3021.0 ± 0.61 c10.0 ± 0.07 d9.0 ± 0.04 d40.106 ± 0.83 d
W80F1026.5 ± 0.95 a16.9 ± 0.02 a16.2 ± 0.04 a59.54 ± 1.90 a
W80F3024.1 ± 0.82 b15.2 ± 0.06 b13.0 ± 0.04 b52.28 ± 0.716 b
Note: pre-sowing irrigation (W80) or no pre-sowing irrigation (W80) and surface (F10) or deep (F30) fertilization. Data are the means of three replicates with standard errors and bars. Different letters indicate a significant difference at p = 0.05 according to Duncan’s range test.
Table 2. Equation of cotton plant biomass accumulation under different irrigation and fertilization during 2015 and 2016.
TreatmentsR2t1 (DAE)t2 (DAE)T (DAE)tm (DAE)Vm (g plant−1 d−1)Vt (g plant−1 d−1)W0 (g plant−1)
Total Biomass of Cotton Plant W0F100.97532.3262.1129.7946.620.970.8545.47
W0F300.96630.1858.6428.4543.840.870.7739.31
W80F100.9934.2065.4631.2649.211.231.0860.54
W80F300.99834.0464.5530.5148.691.080.9652.25
Aerial Part Biomass of Cotton PlantW0F100.98635.9275.4939.5754.910.420.3726.4
W0F300.96232.2568.9436.7049.860.410.3623.9
W80F100.98742.3486.0043.6663.300.510.4635.50
W80F300.99640.7582.2641.5160.680.460.4030.00
Cotton Bud and Boll BiomassW0F100.95430.1973.8543.6651.140.350.3124.09
W0F300.98430.4374.8644.4351.760.290.2520.17
W80F100.99728.4669.340.8448.070.470.4130.22
W80F300.99728.8470.3541.5148.760.400.3626.33
Cotton Stem and Leaf BiomassW0F100.99928.9666.2037.2446.840.520.4630.63
W0F300.98834.1770.8736.7051.790.360.3220.70
W80F100.99727.3766.9439.5746.360.590.5236.84
W80F300.99625.8554.9629.1139.830.590.5226.90
Cotton Root BiomassW0F100.99730.8643.2412.3858.700.290.2122.03
W0F300.99929.5838.969.3861.300.280.1720.80
W80F100.9926.5734.427.8662.880.330.1825.56
W80F300.99923.9730.696.7263.920.300.1423.81
Note: pre-sowing irrigation (W80) or no pre-sowing irrigation (W80) and base fertilization (F10) or deep (F30) application. DAE, indicates days after emergence (d). T1 and t2 are the beginning and termination days of the fast accumulation period, respectively. T indicates the duration of fast accumulation period. T = t2 − t1. tm is the after-emergence days of the maximum biomass accumulation speeds. Vm and Vt are the maximum and average biomass accumulation speeds during the fast accumulation period, respectively. W0 is the maximum biomass accumulation.
Table 3. Change of total moisture consumption rate, total moisture consumption ratio, water productivity of root, water productivity of stem, leaf, water productivity of bud plus boll and water productivity of total dry matter under different irrigation and fertilization during 2015 and 2016.
YearTreatmentsTotal Moisture Consumption Rate (cm3)Total Moisture Consumption RatioWater Productivity of Root (g DM cm−3)Water Productivity of Stem and Leaf
(g DM cm−3)
Water Productivity of Bud and Boll
(g DM cm−3)
Water Productivity of Total Dry Matter
(g DM cm−3)
2015W0F10799.2 ± 14.62 b0.62 ± 0.01 b0.33 ± 0.02 a0.26 ± 0.00 c0.23 ± 0.01 b0.60 ± 0.03 c
W0F30867.5 ± 13.98 a0.69 ± 0.01 a0.29 ± 0.01 b0.19 ± 0.01 d0.15 ± 0.01 c0.42 ± 0.03 b
W80F10846.1 ± 16.39 a0.46 ± 0.01 d0.33 ± 0.01 a0.31 ± 0.02 a0.33 ± 0.01 a0.76 ± 0.03 a
W80F30859.1 ± 19.91 a0.55 ± 0.01 c0.34 ± 0.01 a0.28 ± 0.01 b0.25 ± 0.02 b0.66 ± 0.032 b
2016W0F10762.1 ± 13.42 b0.65 ± 0.01 b0.27 ± 0.01 bc0.15 ± 0.00 c0.15 ± 0.00 b0.57 ± 0.01 c
W0F30849.1 ± 28.84 a0.71 ± 0.02 a0.24 ± 0.00 c0.12 ± 0.00 d0.11 ± 0.00 c0.46 ± 0.02 d
W80F10822.7 ± 37.77 a0.54 ± 0.00 c0.31 ± 0.00 a0.20 ± 0.00 a0.19 ± 0.01 a0.69 ± 0.02 a
W80F30872.2 ± 36.93 a0.54 ± 0.02 c0.29 ± 0.00 ab0.18 ± 0.01 b0.16 ± 0.01 b0.62 ± 0.03 b
Note: pre-sowing irrigation (W80) or no pre-sowing irrigation (W80) and surface (F10) or deep (F30) fertilization. Data are the means of three replicates with standard errors and bars. Different letters indicate a significant difference at p = 0.05 according to Duncan’s range test.
Table 4. Changes in root nitrogen, stem plus leaf, nitrogen bud plus boll and total dry matter nitrogen productivity under different irrigation and fertilization during2015 and 2016.
YearTreatmentsNitrogen Productivity of Root
(g DM mg−1)
Nitrogen Productivity of Stem and Leaf
(g DM mg−1)
Nitrogen Productivity of Bud and Boll
(g DM mg−1)
Nitrogen Productivity of Total Dry Matter
(g DM mg−1)
2015W0F100.11 ± 0.004 b0.09 ± 0.000 b0.08 ± 0.003 c0.28 ± 0.007 c
W0F300.11 ± 0.002 b0.07 ± 0.001 c0.06 ± 0.004 d0.24 ± 0.007 d
W80F100.13 ± 0.000 a0.10 ± 0.005 a0.11 ± 0.001 a0.33 ± 0.005 a
W80F300.11 ± 0.001 b0.11 ± 0.001 a0.09 ± 0.006 b0.31 ± 0.009 b
2016W0F100.10 ± 0.003 b0.06 ± 0.000 c0.06 ± 0.000 c0.21 ± 0.004 c
W0F300.09 ± 0.003 b0.05 ± 0.000 d0.04 ± 0.000 d0.18 ± 0.004 d
W80F100.12 ± 0.00 a0.07 ± 0.000 a0.07 ± 0.000 a0.26 ± 0.008 a
W80F300.10 ± 0.003 b0.07 ± 0.000 b0.07 ± 0.000 b0.23± 0.004 b
Note: pre-sowing irrigation (W80) or no pre-sowing irrigation (W80) and surface (F10) or deep (F30) fertilization. Data are the means of three replicates with standard errors and bars. Different letters indicate a significant difference at p = 0.05 according to Duncan’s range test.
Table 5. Path analysis (n = 60) for the direct or indirect effect on square and boll water-nitrogen productivity by soil moisture content, available nitrogen (mg kg−1), the root length (cm), nitrate reductase (μg g−1FW h−1), root dry matter (g plant−1), stem and leaf dry matter (g plant−1) and bud and boll organ dry matter (g plant−1) at pre-sowing irrigation or no pre-sowing irrigation and basal surface or deep fertilization in 2015 and 2016.
Square and Boll Water ProductivitySquare and Boll Nitrogen Productivity
x1-1x2x3x4x5x6x1-2x2x3x4x5x6
Soil moisture content (x1-1)0.0580.410.455−0.1830.9430.121------
Available nitrogen (x1-2)------−0.0270.2110.375−0.947−1.221−0.062
Root length (x2)−0.1770.382−0.1280.7351.5480.031−0.0130.312−0.1170.6160.6380.274
Nitrate reductase (x3)0.370.0310.3390.251.18−0.037−0.069−0.0730.5720.7320.791−0.007
Root dry matter (x4)−0.277−0.056−0.1650.5641.6330.2260.1430.130.1790.2011.7650.055
Stem and leaf dry matter (x5)−0.259−0.047−0.1490.5122.6880.0330.1540.111−0.1510.4711.8010.152
Bud and boll dry matter (x6)−0.254−0.017−0.20.1830.270.5850.1770.039−0.1380.1610.2210.364
Note: “-” means no value.

