Comparison of the Effect of Perennial Energy Crops and Agricultural Crops on Weed Flora Diversity


1
Department of Systems and Economics of Crop Production, Institute of Soil Science and Plant Cultivation – State Research Institute, 24-100 Puławy, Poland
2
Department of Forage Crop Production, Institute of Soil Science and Plant Cultivation – State Research Institute, 24-100 Puławy, Poland
*
Author to whom correspondence should be addressed.
Agronomy 2019, 9(11), 695; https://doi.org/10.3390/agronomy9110695
Submission received: 24 September 2019
/
Revised: 25 October 2019
/
Accepted: 28 October 2019
/
Published: 30 October 2019
(This article belongs to the Special Issue Bioenergy Crops: Current Status and Future Prospects)
Abstract
:The cultivation of perennial energy crops is a new agricultural system and so there is limited information available on its effects on biodiversity. The aim of this study was to assess the impact of the cultivation of energy crops on the diversity of weed flora and to compare this diversity with that found in crop production systems on arable land. The best habitats for weed flora were created by willow (Salix viminalis), poplar (Populus sp.), false acacia (Robinia pseudoacacia), and perennial grasses (25–30 species), with the exception of reed canary grass (Phalaris arundinacea) (20 species). The lowest diversity and abundance of weed flora were observed on plantations of Virginia mallow (Sida hermaphrodita) and Jerusalem artichoke (Helianthus tuberosus). Weed communities in energy crops included more perennial species (by 11%), ruderal species (by 10%), and those typical for grassland (by 7%) and forests (by 4%), in comparison to arable land. The plantations of energy plants promoted an increase in the density of the invasive species Solidago gigantea (from 1.9 to 6.3 plants m−2 over six years). The introduction of perennial energy crops into an agricultural landscape causes quantitative and qualitative changes in weed flora communities and, therefore, control of the spread of some non-native and invasive species is needed.
1. Introduction
Perennial energy crops include plant species cultivated on arable land and processed for biofuels, biocomponents, heat, or electrical power generation. The cultivation of these crops is still a relatively new agricultural practice and so little scientific evidence is available on the effects of these types of crops on the environment, including biodiversity [1]. Areas to be considered regarding the risks and opportunities of energy crop cultivation in relation to biodiversity include: variations in soil management, requirements for fertilization and plant protection, invasiveness, crop diversity, water footprint, climate change mitigation potential, and distortion of species interactions [2,3]. The influence of these plantations on flora diversity depends on the species cultivated, previous land use, agricultural practices, the age and size of the fields, and their spatial distribution in the landscape [4,5,6]. According to Börjesson [7], the replacement of annual crops by perennial crops affects biodiversity at the genetic, species, and habitat levels.
The most common perennial lignocellulosic species cultivated for energy purposes are willow (Salix viminalis L.), poplar (Populus sp.), and false acacia (Robinia pseudoacacia L.). In addition, there is growing interest in the cultivation of perennial grasses, mainly miscanthus (Miscanthus sp.), but also other species: prairie cordgrass (Spartina pectinata Bosc ex Link), reed canary grass (Phalaris arundinacea L.), big bluestem (Andropogon gerardii Vitman), and switchgrass (Panicum virgatum L.). Another group of plants that can be used for energy purposes is the perennial dicotyledons, such as Virginia mallow (Sida hermaphrodita (L.) Rusby) and Jerusalem artichoke (Helianthus tuberosus L.). Energy crops differ in terms of their morphological, physiological, and agronomic characteristics, and create adverse habitats for associated flora species [8]. The plantation management system has a significant impact on weed flora diversity, in particular the frequency and timing of energy plants’ harvesting [9].
The introduction of new perennial plants into agricultural areas for energy purposes creates habitats for various species of flora, including those threatened with extinction, and can be an alternative way of increasing biodiversity [4,10]. Landscape heterogeneity is maximized by altered harvest rotations, no-till farming, and mixed crop species composition. The positive effect of energy crops on biodiversity is connected with the lower agrochemical input used as compared to the intensive production used in annual crops [1,11,12].
The findings of most research concern willow as a widespread perennial energy crop. Research conducted in Great Britain and Sweden showed that willow cultivation contributed to an increase of flora richness as compared to arable land [7,12,13,14]. According to some authors, miscanthus and other perennial grasses may be a poorer habitat for flora than willow [8,14,15].
However, some authors suggest that the physical structure of the canopy, rapid growth rate, high density, chemical crop protection, and mineral fertilization caused energy crops to be not conducive to weed flora diversity [16]. The intensity of plantation management also has a high impact on biodiversity, which in turn has an effect on plant yields, the diversification of farm crops, rural economies, the role as vegetation filters, water and soil quality, and CO2 emissions [17]. Energy crop plantations have a greater demand for water in comparison to traditional crops, which may cause changes in habitat conditions that affect biodiversity [5,6,18]. Biomass crops are likely to increase the biodiversity in regions with low diversity, but they could potentially have adverse effects in landscapes of high conservation value [3,11]. Some of the most promising biomass crops, e.g., miscanthus, switchgrass, Reynoutria sp., are not native to Europe and North America and so pose a risk of potential future invasions, so their spread will need to be monitored [3,19,20,21,22]. Another problem associated with the cultivation of willow on a large scale is the possibility of the hybridization of wild Salix clones with those introduced during cultivation [7].
Due to the unknown impact of many plant species used for energy purposes on the environment and biodiversity, there should be wide-ranging and long-term ecological monitoring conducted on these crops [6,12]. According to Verdade et al. [23], biodiversity monitoring programs are needed to aid the decision-making process concerning the conflict between the expansion of energy crops and the conservation of biodiversity. These programs should take into account comparisons with neighboring agricultural crops [5,24]. Such a comparison has been done in this current study.
Our hypothesis was that the cultivation of perennial plants for energy purposes would promote weed flora diversity and abundance more than crop production systems on arable land.
Therefore, the aims of this research were: (1) to analyze the changes in the flora community after the introduction of perennial energy crops from different botanical groups onto arable land, and (2) to compare the structure of weed flora communities accompanying perennial energy crops with those in typical agricultural crops grown on arable land under different farming systems (organic, integrated, conventional, monoculture).
2. Materials and Methods
2.1. Characteristics of Experimental Plots with Perennial Energy Crops
The assessment of weed flora diversity accompanying perennial crops cultivated for energy purposes was carried out on experimental plantations located in the Experimental Station of the Institute of Soil Science and Plant Cultivation–State Research Institute in Osiny, near Puławy (N: 51°28′, E: 22°4′), Lublin province, Poland (Figure 1a,b). The experimental site is located in a moderate continental climatic zone. The average annual total precipitation is 586 mm, with a mean air temperature of 7.5 °C (data for 1950–2010). The average maximum temperature of the winter season was +8.5 °C and the minimum −15.2 °C. The average maximum temperature of the summer season was 30.7 °C and the minimum was 6.5 °C. The average total amount of precipitation during the period of plant vegetation (April–October) was 450 mm.
The experiment was located on Haplic Luvisol soil [25], loamy sand characterized by a slightly acid reaction (pHKCl = 5.6), an average phosphorus content (43.6 mg P kg−1 soil), and a low potassium level (63.1 mg K kg−1 soil).The average humus content in the soil was 1.6%, the organic carbon content was 0.93%, and the C:N ratio was 9.3:1.
The study included 11 plant species from three groups: trees and bushes, perennial dicotyledonous plants, and perennial grasses (Table 1). Experimental plots with an area of 200 m2 (dicotyledonous plants and grasses) and 500 m2 (trees and bushes) were established in 2004 and 2008.
The precrop plant for energy crops was winter wheat cultivated under a conventional system whereby the soil was plowed in September before sowing and weeds were controlled using herbicides (Mustang Forte 195SE – 1.0 L ha−1, Dow AgroSciences Poland, post-emergence herbicide, active ingredients: florasulam 5 g L−1 + aminopyralid 10 g L−1 + 2.4 D 180 g L−1). The agricultural practices used in the cultivation of energy crops were consistent with the current state of knowledge [26]. No chemical weed control measures were used on the energy crops. Weeds were controlled by mechanical means, using a hoe for the first year after the establishment of each plantation. Mineral fertilization (80 kg N + 60 kg P2O5 + 80 kg K2O per ha) was spread on all of the plantations in the pre-planting period and each spring after the harvest of the energy crops. Plants were harvested in the winter months after the end of the growing season, from the beginning of December to the end of February (depending on the year). The biomass was collected using mechanical mowers and stored until further analysis.
2.2. Characteristics of the Experimental Plots with Annual Crops Cultivated under Different Farming Systems
A comparison of flora diversity in annual agricultural crops was done on fields located 70–100 m from the experimental fields with energy crops (Table 2). These fields are long-term experimental plots (each 1 ha in area) with different farming systems: organic, integrated, conventional, and monoculture of winter wheat. All the fields were established in 1994. The systems are characterized by different crop rotations and agricultural practices. In the organic system, no mineral fertilizers or chemical weed controls are used. Compost from green waste was applied once at 30 t ha−1 before potatoes were planted during the complete crop rotation cycle. In the integrated system, a balanced mineral and organic fertilization rate, adapted to the needs of plants and soil fertility, was used. Plant protection consisted of mechanical measures, a limited number of herbicides suitable against weed infestation, and the application of other plant protection products, based on harmfulness thresholds [27]. The conventional systems were: (1) three-year crop rotation (winter oilseed rape, winter wheat, spring wheat), and (2) winter wheat monoculture. In both of these systems, plants were cultivated according to intensive agricultural production based on high mineral fertilization (cover the crop requirements and a little surplus, about 20–30% higher than in the integrated system) and chemical protection of plants (Table 2). Soil was plowed in all crop production systems.
2.3. Methodology Used for Flora Diversity Assessments
An evaluation of the qualitative and quantitative changes in flora communities on the plantations of perennial energy crops was carried out in two three-year cycles (2010–2012 and 2013–2015). Their comparison with the accompanying flora on the arable land, in terms of durability and habitat, was carried out in 2010–2012. All crops in the rotations were sampled for weed assessments. Weed species composition and abundance were determined every year in the first week of June, using the weed-picking frame method. The weeds were collected from a frame, with dimensions of 0.5 × 1 m, with four replications in each crop field. To avoid the edge effect, the frames were placed a few meters from the edges of plots. The data represent the average of the results from the weed assessments for the field crop and agricultural system. Plant species were identified according to the method of Rutkowski [28]. Abbreviations of species names used in the paper are explained in Table S1.
2.4. Statistical Analyses
2.4.1. Diversity Indicators
The structure of weed communities was analyzed using diversity indices: Shannon’s diversity index: H′ =−∑Pi ln Pi [29] and Simpson’s dominance index: SI = ∑Pi2 [30], where Pi is the probability of species occurrence in the sample. The values of the indicators were calculated using the Multi-Variate Statistical Package (MVSP) 3.1 program, Kovach Computing Services, Anglesey, UK [31].
2.4.2. Hierarchical Classification
In order to group the weed flora communities found within different agricultural systems and crop types, a cumulative (agglomerative) hierarchical classification, as described by Jongman et al. [32] and Kent and Coker [33], was used. The qualitative Sorensen’s similarity index was used to classify similarities between weed flora in different farming systems and types of energy crops [34]. The average linkage method (UPGMA), common in taxonomy, was used as a criterion for cluster formation [32,35]. The cumulative hierarchical classification was performed using the MVSP 3.1 program [31].
2.4.3. Ordination Method
Ordination techniques were used to classify the samples based on the weed species composition and species based on their share in the samples [36]. First, detrended correspondence analysis (DCA) was applied, as is recommended for preliminary ordering of vegetation data [36,37]. Due to the fact that the length of the first axis gradient in the DCA analysis was less than two standard deviations, showing that the distribution of species was not compatible with the Gaussian curve, the linear method redundancy analysis (RDA) was used to perform direct ordination [38]. During the analysis, a stepwise selection of variables was carried out in combination with the Monte Carlo permutation test to indicate those variables that significantly (p ≤ 0.05) affect the species diversity of the weed flora communities. The analyses were performed in the Canoco 4.5 program, Microcomputer Power, Ithaca, NY, USA [37].
2.4.4. Assessment of the Significance of Differences
In order to check the normality of the distributions, the Shapiro‒Wilk test was used. The data on weed species richness and abundance did not meet the requirements for parametric tests. Therefore, the nonparametric Kruskal‒Wallis test was used for identifying significant differences between samples at p ≤ 0.05 using Statistica 10 software (StatSoft, Kraków, Poland). Calculations were performed using the PAST computer program, ver. 3.14 [39].
3. Results
In the first three years of the research (2010–2012), the greatest diversity of weed flora was noticed on the plantations of poplar (28 species), false acacia (27 species), and willow harvested every year (26 species), as well as on the perennial grasses with C4 photosynthesis: switchgrass (30 species), big bluestem (26 species), and miscanthus (25 species) (Figure 2). The flora associated with reed canary grass plantations as well as with the perennial dicotyledonous plants, Virginia mallow and Jerusalem artichoke, was poorer in terms of the number of species and species density (Figure 2 and Figure 3).
The biodiversity of flora accompanying energy crops showed a decline in species richness on most plantations in 2013–2015 when compared to 2010–2012, with the exception of willow harvested every three years, miscanthus, and reed canary grass (Figure 2). The reduction of species diversity was accompanied by an increase in weed density, except for the plantations of poplar, switchgrass, and prairie cordgrass (Figure 3). The values of these changes depended on the species of energy crop.
The weed flora communities in the plantations of trees and bushes and in perennial grasses, in terms of species richness, were similar to the weed flora associated with the crops cultivated in the organic system (Figure 4 and Figure 5) (48–52 species vs. 55–105 plants m−2), which was confirmed by a cluster dendrogram (Figure 6). Simplification of crop rotation from the integrated system to a monoculture of winter wheat, associated with an increased use of herbicides, resulted in a depletion of weed species number and a decrease in their density (Figure 4 and Figure 5). There were 2.2-fold more weed species and a 4.7-fold higher weed density in the integrated system than in the wheat monoculture. Flora accompanying crops for energy purposes showed the lowest qualitative and quantitative similarities to weed communities in winter wheat monoculture (Figure 4, Figure 5 and Figure 6). Weed flora density was the highest in perennial grasses and lowest in winter wheat monoculture (Figure 5).
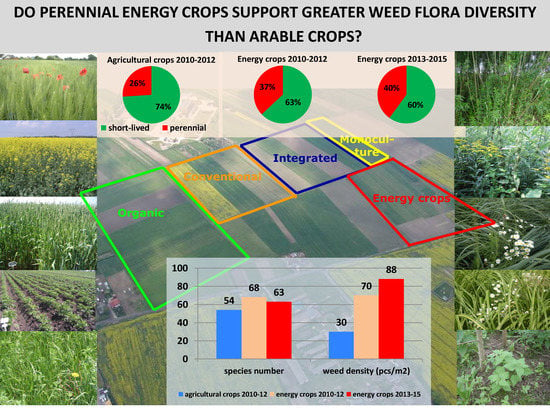
During the first three-year research period (2010–2012) agricultural crops on arable land in the four tested farming systems (organic, integrated, conventional, monoculture) were accompanied by a total of 54 weed flora species, and energy plants by 68 species (Table 3). During the next three years, a decrease in the flora biodiversity among the energy crops to 63 species was observed. Weed communities accompanying the energy crops differed from those on arable lands. Forty-seven species with a total of 88 taxa (53%) were common for both types of land use. Thirty-four species (39%) occurred only in energy crops, and seven species (8%) were characteristic of arable land. The average weed flora density was 30 plants m−2 among crops on arable lands and more than twice that number in energy crops: 70 plants m−2 in 2010–2012 and 88 plants m−2 in 2013–2015 (Table 3).
Classification of the samples using hierarchical cumulative analysis based on qualitative similarity confirmed the weed communities in perennial energy crops and annual agricultural crops on arable land (Figure 6). The weed flora in the organic system was more similar to the integrated system than to the conventional one. The analysis showed the distinctness of weed flora communities in the monoculture of winter wheat, both in relation to energy plants and to other farming systems.
Weed flora accompanying trees and bushes in 2010–2012 was characterized by the highest value of Shannon’s diversity index (3.02) (Figure 7a) and the smallest Simpson’s dominance index (0.7) (Figure 7b). Similar values of both indicators were found for perennial grasses (2.85 and 0.9, respectively) and crops cultivated in the organic system (2.75; 0.10). Perennial dicotyledons and crops in the integrated system had indicator values comparable to each other (2.33–2.34; 0.15–0.17). Vegetation in the conventional system was characterized by the smallest value of the Shannon’s diversity index and the largest value of Simpson’s dominance index (1.75; 0.38) (Figure 7a,b).
After the introduction of perennial energy crops, an analysis of the changes in weed communities showed an increase in the density of the invasive perennial species Solidago gigantea Aiton (Table 3). The average abundance of this species among the typical agricultural crops in 2010–2012 amounted to 0.003 plants m−2. During the same time period, among the energy crops there were 1.9 plants m−2 and over the next three-year period (2013–2015) this value increased more than 3-foldto 6.3 plants m−2. It was observed that other expansive ruderal and forest species (e.g., Urtica dioica L., Conyza canadensis L. Cronquist, Geum urbanum L.) also increased in the soil cover, competing with other plant species for their ecological niche.
An analysis of changes in the structure of flora as a result of the cultivation of perennial energy crops on arable land showed an increase in the share of perennial weed species in the communities (Figure 8). In annual agricultural crops, perennial species accounted for 26% of species composition of the community; in crops for energy purposes, in the first three years of research (2010–2012) they accounted for 37% of all the taxa, while in the next three years (2013–2015) they accounted for 40% of the taxa. Perennial species constituted only 8% of the total weed density in crops on arable land, but along with the cultivation of perennial plants for energy purposes their density increased in the first three years by 9%, and in the next three years by 19%.
In annual crops, segetal weed flora species dominated, accounting for half of all registered taxa (Figure 9a), while on plantations of crops cultivated for energy purposes this group of flora accounting for 38–39% of registered taxa and species typical for ruderal, meadow, and forest habitats had a greater share than in the annual crops (Figure 9b,c).
In order to assess the relationship between land use and the occurrence of weed species, ordination methods were used. DCA showed a distinction between the weed flora communities associated with energy crops and those occurring in organic, integrated, and conventional systems and in wheat monoculture (Figure 10a,b; Table S2). In Figure 10a, points representing weed flora in energy crops are on the right side of the graph and samples corresponding to species on arable land are on the left side of the diagram.
In order to find out how the tested systems of land use changed the species composition of weed communities, a direct analysis was carried out using a linear redundancy analysis (RDA) (Figure 11, Tables S3 and S4).
Gradients of the variables and the species distribution confirmed the dissimilarity of the communities in the organic system (upper-right quadrant of Figure 11) and other crop production systems (lower-right quadrant of Figure 11) from the flora accompanying energy crops (left side of Figure 11). Along the gradient of axis 1, the highest positive correlation between the tested variables and the location of species occurred for the integrated system (INT), while it was negative for the perennial grasses (G1) (Table S4). Along the gradient of axis 2, the organic system was the most positively correlated and trees and bushes (T2) the most negatively correlated (Figure 11, Table S4). Among the variables studied, the lowest correlation with canonical axes was recorded for perennial dicotyledons cultivated for energy purposes (D1 and D2).
Along the gradients of the axes of individual variables, the species most closely associated with a given type of farming system or energy crop were grouped together. Vicia hirsuta (L.) Gray, Lamium purpureum L., Lapsana communis L., Papaver rhoeas L., Myosotis arvensis (L.) Hill, Fallopia convolvulus (L.) Á. Löve, and Cirsium arvense (L.) Scop. were the most closely related to the crops cultivated in the organic system (Figure 10). A small group of species located in the lower-right quadrant of the diagram was associated with more intensive farming systems (probably species more tolerant or resistant to herbicides). For perennial grasses: G 1—Stellaria media (L.) Vill., Poa annua L., Cerastium arvense L., Juncus bufonicus L., Festuca ovina L., Descurainia sophia (L) Webb ex Prantl, Sisymbrium loeseli L., G 2—Bromus inermis Leyss, and Senecio vulgaris L. were characteristic. For trees and bushes: T1—Crepis tectorum, Viola tricolor L. and T2—Rumex acetosa L. and Geum urbanum L. were representative. Many species are found between vectors representing perennial grasses (G2), perennial dicotyledons (D1 and D2), and trees and bushes (T1, T2), such as Lactuca serriola L., Taraxacum officinale F.H. Wigg, Conyza canadensis L. Cronquist, Solidago gigantea Aiton, Urica dioica L., Epilobium parviflorum Schreb., Artemisia vulgaris L., Elymus repens (L.) Gould, Galium aparine L., Sonchus arvensis L., Galinsoga parviflora Cav., and Erigeron annuus L. Pers., which means that they occur in all three communities. Similarly, a large group of species was located between the organic system and the perennial grasses vectors, including Capsella bursa-pastoris (L.) Medik, Chenopodium album L., Plantago maior L., Polygonum aviculare L., Tripleurospermum inodorum (L.) Sch. Bip., and Veronica persica Poir. These are short-lived species, sensitive to herbicides, that were abundant both in the organic system and in energy plant communities as they also did not use herbicides.
The perennial dicotyledonous vectors (D1 and D2) were much shorter and were responsible to a smaller extent for the diversity of the community.
The results of a stepwise selection of variables showed that in the independent testing of each agrotechnical variable included in the model, the largest share of the variability was explained by perennial grasses (G1) and the organic system (9% each) (Table 4).
In the dependent testing (conditional effects), the perennial grasses (G1) variable explained 9% of the variability, the organic system explained an additional 8% of the variability, the integrated system explained 7%, the wheat monoculture explained 6%, the perennial grasses (G2) and conventional system explained 5% each, and trees and bushes (T1) explained 4% (Table 4). The variables included in the analysis diversified the community in a statistically significant way, with the exception of perennial dicotyledons (D1 and D2). The results of the significance tests of the canonical axes showed that there was a strong, statistically significant relationship between species occurrence and the gradients of both the first and all four canonical axes of the RDA (Table 4).
4. Discussion
The effects of energy crop production on biodiversity depend on the respective crop and its management [3]. As a consequence, the impact of energy crops on biodiversity can encompass a wide range of spatial scales. The results of our own study show high levels of biodiversity of weed flora in the plantations of trees and bushes and in perennial grasses (except for reed canary grass), whereas the lowest levels of weed diversity and abundance were in the group of perennial dicotyledons, especially in the Jerusalem artichoke. Other authors have also shown a greater diversity of weed flora species in short-rotation coppices (SRC) and perennial grasses in comparison to perennial dicotyledons [40,41]. High biodiversity is often observed on willow plantations [13,14,42,43]. In the studies of Kościk and Ziemińska-Smyk [44], the richest flora communities were found in willow, medium levels were recorded in miscanthus, and the poorest were in prairie cordgrass. Bourke et al. [45], who assessed the impact of replacing agricultural crops with miscanthus, found that this crop’s cultivation had positive effects on farmland vascular plant biodiversity on a field scale. Semere and Slater [40] indicate that miscanthus fields were richer in weed vegetation than reed canary grass or arable fields. Some other authors paid attention to the low biodiversity and volume of weed flora in reed canary grass and Jerusalem artichoke. In the studies by Rowe et al. [14], in a plantation of reed canary grass the weed cover decreased from 48% in the first year of cultivation to 1% after several years. The high competitive ability of reed canary grass against weeds may be a result of its allelopathic potential [46]. It should also be noted that the rate of early growth of reed canary grass is very fast in the spring, which limits the growth of weeds in comparison to grasses with C4 photosynthesis: miscanthus, switchgrass, big bluestem, and prairie cordgrass, which start growing later in the spring due to their high thermal requirements. Sobisz and Ratuszniak [47] found a 30% lower species diversity of weeds in Jerusalem artichoke compared to willow plantations, which is similar to the results presented in this paper.
In this study, the weed communities accompanying energy crops differed from the weed flora on arable lands, although 53% of the species were common for both types of land use and included: Viola arvensis Murray, Galium aparine L., Capsella bursa-pastoris (L.) Medik, Stellaria media (L.) Vill., Elymus repens (L.) Gould, Apera spica-venti (L.) P. Beauv., and Echinochloa crus-galli (L.) P. Beauv. In the ordination diagrams organizing weed species, prepared by the DCA method, many taxa were grouped in the middle of the graph near the beginning of the canonical axes, which, according to Zanin et al. [48], means that their occurrence was not associated with a particular type of farming. In the studies of Hyvönen et al. [49] and Armengot et al. [50], several of the same species dominated in cereal crops cultivated in both organic and conventional systems. Similar results were provided by Baessler and Klotz [51], who found that on arable land in Germany the same taxa dominated before and after the period of intensification of agriculture, i.e., Stellaria media (L.) Vill., Chenopodium album L., Fallopia convolvulus (L.) A. Löve, Polygonum aviculare L., and Galium aparine L., although their quantitative share had changed.
Organic management increased the number of weed flora accompanying arable crops. The large variety of species in the organic system may result from the diversity of crop rotation and the elimination of herbicides, while in energy plants it may be a result of a lack of soil tillage and chemical protection. An increase in the density of taxa more sensitive to herbicides, Stellaria media (L.) Vill., Capsella-bursa pastoris (L.) Medik, Fallopia convolvulus (L.) A. Löve. and species of the leguminous genus Vicia, was recorded in the organic system in comparison with the other farming systems.
Conventional agriculture, due to the use of herbicides as the primary tool for weed control, leads to a decrease in the number of weed species, while increasing the density of species tolerant to anthropopressure, such as: Galium aparine L., Viola arvensis Murray, Alopecurus myosuroides Huds., Echinochloa crus- galli (L.) P. Beauv., and Setaria sp. [52]
Plantations of energy plants, in comparison to agricultural crops, were characterized by a smaller share of short-lived (annual and biennial) species, both in terms of the species composition and the total density of the community. A shift towards replacing short-lived species with perennial species with greater shade tolerance occurred. The moderate level of mineral fertilization used in energy crops and the nutrients released from fallen leaves, in the absence of weed regulation, increased the share of nitrophilous species, such as Galinsoga parviflora Cav., Stellaria media (L.) Vill, Galium aparine L., Urtica dioica L., and Senecio vulgaris L. Research by Cunningham et al. [12] showed the dissimilarity of flora composition on arable land in comparison to plantations of trees and bushes, where perennial, shade-loving, and ruderal species were found with greater frequency.
In our research there was not an area with no crop cultivation at all, so a comparison to natural occurring weeds is not possible. Weed flora communities in the plantations of trees and bushes and in perennial grasses, in terms of species richness and their density, were most similar to weed flora in the organic system. This may be due to the elimination of herbicides under both types of cultivation. The flora accompanying energy crops was the least similar to the weed communities in winter wheat monoculture. The results of a four-year monitoring carried out by Cunningham et al. [12] on willow plantations in the UK confirmed a 27% greater species richness in willow (133 species) when compared to the neighboring arable land (97 species), as well as greater weed cover. According to these authors, conventional and integrated fields created worse conditions for the diversity of flora than did willow due to the number of agricultural measures performed on them. They found that only the organic system could match the richness of the flora in willow. Other studies have confirmed the positive impact of willow and poplar on the diversity of wild flora in comparison to arable fields [4,7,13,14]. Börjesson [7] reported over 50% more plant species, including rare species, in willow plantations than in fields of cereals. A comparative study by Dauber et al. [3] indicated that the tested energy crops (willow, poplar, miscanthus, switchgrass) showed a positive effect on species richness for almost all taxa studied, including plants, in comparison with arable land.
Plantations of all tested perennial grasses, with the exception of reed canary grass, were characterized by a richer species composition and a higher coverage by weeds than conventional crops on arable land. The impacts of energy crops on biodiversity are generally favorable compared to conventional crops, but the location of the plantation as well as the size and harvesting regime of the plantation are important variables [53]. Weih et al. [54] reported a similar number of plant species across poplar stands and arable fields, but only a small number of species were shared between the two types of land use.
A significant result of the present long-term study is the decline in species richness and the increase in weed density over time in most energy crop plantations. Similar results were obtained by Archaux et al. [55], who noted a decrease in weed species richness in poplar in line with the age of the plantation. Many authors have confirmed the changes in species composition of flora communities associated with energy crops in subsequent years of their growth. Young willow plantations (1–2 years old), are dominated by segetal species, typical for arable lands, mainly dicotyledonous annuals: Galium aparine L., Viola arvensis Murray, Equisetum arvense L., Elymus repens (L.) Gould, and ruderal species, and this is followed by succession and colonization by species characteristic for meadow and forest communities: Conyza canadensis (L.) Cronquist, Solidago sp., Epilobium sp., Urtica dioica L., Taraxacum officinale F.H. Wigg, and Achillea millefolium L. [12,14,16,43,57,58]. With aging the photophilous species in willow plantation disappear and their place is occupied by plants with lower light requirements, which was also observed in the present study. However, according to Anioł-Kwiatkowska et al. [56], it is not possible to create a typical forest community on willow plantations that are regularly harvested.
With the aging of willow and poplar plantations, a succession towards a decreasing number of annual species occurs and an increase in the number and coverage of perennial species: e.g., Urtica dioica L., Ranunculus repens L., Epilobium sp., and Poa pratensis L. [12,16,43,57,58]. According to Cunningham et al. [12], this is largely due to the abandonment of tillage. In our own study, the shift in flora composition from short-lived to perennial species was proven by DCA and RDA analyses. Changes in the species composition that result from a switch from arable crop cultivation to increased SRC cultivation may have wider repercussions for ecosystem processes and the provision of ecosystem services [59].
The introduction of perennial crops for energy purposes on arable land favors an increase in density of the invasive perennial species Solidago gigantea Aiton, which belongs to the highest class of invasiveness [22], as well as other expansive ruderal and forest species (e.g., Urtica dioica L., Conyza canadensis (L.) Cronquist, Geum urbanum L.). These results have been confirmed by other authors who state that monocultures of bioenergy crops increase the potential for an invasion of non-native species [10,20,22]. Invasive species such as Solidago gigantea Aiton, Solidago canadensis L., and Conyza canadensis (L.) Cronquist often form compact phytocoenoses, in which native plants are replaced by jamming or by allelopathic effects [19]. In connection with these threats, further changes taking place in plantations of energy crops should be monitored to prevent the spread of highly competitive and expansive species.
According to Dauber and Bolte [18], energy crops should not be viewed as a phenomenon outside the scope of conventional agriculture. Whether they positively or negatively affect farmland biodiversity depends on the proportion of their area within a landscape. Two main strategies for managing bioenergy crops that could reduce their impact on the environment have been proposed: (1) manage them to facilitate biodiversity and support ecosystem service providers using well-designed agri-environment schemes and wildlife-friendly farming practices [60]; (2) planning the spatial arrangement of bioenergy plantations so that they interact positively with other landscape units [61].
5. Conclusions
The introduction of energy crops into the agricultural landscape can increase biodiversity if their production is carried out with low chemical input. Among the tested energy crops, the best conditions for the diversity of weed flora were created by trees and bushes and by perennial grasses, with the exception of reed canary grass. The lowest diversity and abundance of weed flora were noted on the plantations of perennial dicotyledons Virginia mallow and Jerusalem artichoke. The weed flora communities accompanying energy crops differed qualitatively and quantitatively from the communities on arable land. A long-term analysis showed a decline in species richness and an increase in weed abundance on most plantations. Energy crops enable more perennial weed species, including ruderal and those typical for grassland and forests, in comparison to arable land. Plantations of some energy plants favor an increase in the density of the invasive alien perennial species Solidago gigantea Aiton. In connection with these threats, further changes taking place in the environment should be monitored to prevent the increasing density of highly competitive, problematic, and expansive species in relation to native, especially rare, flora species.
Supplementary Materials
The following are available online at https://www.mdpi.com/2073-4395/9/11/695/s1. Table S1: List of latin names and abbreviations of plant species that occurred in trials with energy crops and agricultural crops according to Rutkowski [28]. Table S2: Variability explained by the first 4 axes in ordination analysis DCA of weed communities in agricultural crops and plants cultivated for energy purposes. Table S3: Variability explained by the first 4 axes in canonical analysis RDA of weed communities in agricultural crops and plants cultivated for energy purposes. Table S4: Inter set correlations of agrotechnical variables with RDA axes in analysis of weed communities in different agricultural systems and energy crops.
Author Contributions
Conceptualization, M.M, B.F.-S.; methodology, B.F.-S., M.M.; validation, M.S., M.M.; investigation, B.F.-S., M.S.; data curation, B.F.-S., M.S.; writing—original draft preparation, B.F.-S.; writing—review and editing, M.M., M.S.; visualization, B. F.-S.; supervision, M.M.; project administration, B.F.-S., M.M.; funding acquisition, B.F.-S, M.M.
Funding
The research was funded by the statutory project of IUNG-PIB No 3.09 (2013–2015) and the multi-annual program of IUNG-PIB, Task No 1.8. (2016–2020). This work was co-financed by the National (Polish) Centre for Research and Development (NCBiR), entitled “Environment, agriculture and forestry”, project: BIOproducts from lignocellulosic biomass derived from MArginal land to fill the Gap in Current national bioeconomy, No. BIOSTRATEG3/344253/2/NCBR/2017.
Acknowledgments
The authors thank Adam Berbeć, Paweł Radzikowski, Paweł Wolszczak, Ewa Markowska-Strzemska, Andrzej Górnik and Marek Woźniak for their technical support while conducting the experiments and assessments.
Conflicts of Interest
The authors declare no conflict of interest. The funders had no role in the design of the study; in the collection, analyses, or interpretation of data; in the writing of the manuscript, or in the decision to publish the results.
References
- Pedroli, B.; Elbersen, B.; Frederiksen, P.; Grandin, U.; Heikkila, R.; Krogh, P.H.; Izakovicova’, Z.; Johansen, A.; Meiresonne, L.; Spijker, J. Is energy cropping in Europe compatible with biodiversity? Opportunities and threats to biodiversity from land-based production of biomass for bioenergy purposes. Biomass Bioenergy 2013, 55, 73–86. [Google Scholar] [CrossRef]
- Fletcher, R.J., Jr.; Robertson, B.A.; Evans, L.; Doran, P.J.; Alavalapati, J.R.R.; Schemske, D.W. Biodiversity conservation in the era of biofuels, risks and opportunities. Front. Ecol. Environ. 2011, 3, 161–168. [Google Scholar] [CrossRef]
- Dauber, J.; Jones, M.B.; Stout, J.C. The impact of biomass crop cultivation on temperate biodiversity. GCB Bioenergy 2010, 2, 289–309. [Google Scholar] [CrossRef]
- Perttu, K.L. Ecological, biological balances and conservation. Biomass Bioenergy 1995, 9, 107–116. [Google Scholar] [CrossRef]
- Britt, C. Methodologies for Ecological Monitoring in Bioenergy Crops; A review and recommendations, Defra Project NF0408; ADAS Contract Report for the Department for Environment, Food and Rural Affairs: Oxford, UK, 2003; p. 63. [Google Scholar]
- European Environmental Agency. How much Bioenergy Can Europe Produce without Harming the Environment; EEA Report 7/2006; European Environmental Agency: Copenhagen, Denmark, 2006; p. 67. [Google Scholar]
- Börjesson, P. Environmental effects of energy crop cultivation in Sweden—I: Identification and quantification. Biomass Bioenergy 1999, 16, 137–154. [Google Scholar] [CrossRef]
- Lewandowski, I.; Clifton-Brown, J.C.; Scurlock, J.M.O.; Huisman, W. Miscanthus: European experience with a novel energy crop. Biomass Bioenergy 2000, 19, 209–227. [Google Scholar] [CrossRef]
- Buhler, D.D.; Netzer, D.A.; Riemenschneider, D.E.; Hartzler, R.G. Weed management in short rotation poplar and herbaceous perennial crops grown for biofuel production. Biomass Bioenergy 1998, 14, 385–394. [Google Scholar] [CrossRef]
- Hartman, J.C.; Nippert, J.B.; Orozco, R.A.; Springer, C.J. Potential ecological impacts of switchgrass (Panicum virgatum L.) biofuel cultivation in the Central Great Plains, USA. Biomass Bioenergy 2011, 35, 3415–3421. [Google Scholar] [CrossRef]
- Sage, R.B. Short rotation coppice for energy: Towards ecological guidelines. Biomass Bioenergy 1998, 15, 39–47. [Google Scholar] [CrossRef]
- Cunningham, M.D.; Bishop, J.D.; McKay, H.V.; Sage, R.B. ARBRE Monitoring-Ecology of Short Rotation Coppice; URN 04/961; DTI: London, UK, 2004; p. 157. [Google Scholar]
- Fry, D.A.; Slater, F.M.; Reboud, X. The effect on plant communities and associated taxa of planting short rotation willow coppice in Wales. Asp. Appl. Biol. 2008, 90, 287–293. [Google Scholar]
- Rowe, R.L.; Street, N.R.; Taylor, G. Identifying potential environmental impacts of large-scale deployment of dedicated bioenergy crops in the UK. Renew. Sustain. Energy Rev. 2009, 13, 271–290. [Google Scholar] [CrossRef]
- Tuomisto, H.L.; Hodge, I.D.; Riordan, P.; Macdonald, D.W. Comparing energy balances, greenhouse gas balances and biodiversity impacts of contrasting farming systems with alternative land uses. Agric. Syst. 2012, 108, 42–49. [Google Scholar] [CrossRef]
- Sage, R.B.; Robertson, P.A.; Poulson, J.G. Enhancing the Conservation Value of Short Rotation Biomass Coppice: Phase 1 the Identification of Wildlife Conservation Potential; ETSU B/W5/0027/REP; DTI: London, UK, 1994; p. 119. [Google Scholar]
- Mola-Yudego, B.; Díaz-Yáñez, O.; Dimitriou, I. How Much Yield Should We Expect from Fast-Growing Plantations for Energy? Divergences Between Experiments and Commercial Willow Plantations. Bioenergy Res. 2015, 8, 1769–1777. [Google Scholar] [CrossRef]
- Dauber, J.; Bolte, A. Bioenergy: Challenge or support for the conservation of biodiversity? GCB Bioenergy 2014, 6, 180–182. [Google Scholar] [CrossRef] [Green Version]
- Tokarska-Guzik, B. The Establishment and Spread of Alien Plant Species (Kenophytes) in the Flora of Poland; University of Silesia: Katowice, Poland, 2005; Volume 2372, p. 192. [Google Scholar]
- Anioł-Kwiatkowska, J.; Śliwiński, M. Energy plants of alien origin-threat to the native flora of Poland. Pam. Puł. 2009, 150, 35–44. (In Polish) [Google Scholar]
- Buddenhagen, C.E.; Chimera, C.; Clifford, P. Assessing biofuel crop invasiveness: A case study. PLoS ONE 2009, 4, e5261. [Google Scholar] [CrossRef]
- Tokarska-Guzik, B.; Dajdok, Z.; Zając, M.; Zając, A.; Urbisz, A.; Danielewicz, W.; Hołdyński, C. The Plants of Foreign Origin in Poland, with Particular Regard to Invasive Species; Generalna Dyrekcja Ochrony Środowiska: Warsaw, Poland, 2012; p. 197. [Google Scholar]
- Verdade, L.M.; Piña, C.I.; Rosalino, L.M. Biofuels and biodiversity: Challenges and opportunities. Environ. Dev. 2015, 15, 64–78. [Google Scholar] [CrossRef]
- Kovacs-Lang, E.; Simpson, I.C. Biodiversity Measurements and Indicators for Long-Term Integrated Monitoring; No LIMITS, Report No. 6; Institute of Ecology and Botany of the Hungarian Academy of Sciences, Vácrátót & Centre for Ecology and Hydrology: Grange-over-Sands, UK, 2000; p. 24. [Google Scholar]
- IUSS Working Group WRB. World Reference Base for Soil Resources, 2nd ed.; World Soil Resources Reports No. 103; FAO: Rome, Italy, 2006; p. 132. [Google Scholar]
- Kuś, J.; Faber, A.; Stasiak, M.; Kawalec, A. Productivity of Selected Plant Species Cultivated for Energy Purposes in Different Habitats; Studia i Raporty IUNG-PIB: Puławy, Poland, 2008; Volume 11, pp. 67–80. (In Polish) [Google Scholar]
- Available online: https://www.agrofagi.com.pl/352,programmes-for-integrated-pest-management.html (accessed on 11 October 2019).
- Rutkowski, L. Key to Identification of Vascular Plants in Lowland Poland; PWN: Warsaw, Poland, 2007; p. 822. [Google Scholar]
- Shannon, C.E. A mathematical theory of communications. Bell Syst. Tech. J. 1948, 27, 379–423. [Google Scholar] [CrossRef]
- Simpson, E.H. Measurement of diversity. Nature 1949, 168, 668. [Google Scholar] [CrossRef]
- Kovach, W.L. MVSP version 3; Kovach Computing Services: Anglesey, UK, 2011; p. 112. [Google Scholar]
- Jongman, R.H.G.; ter Braak, C.J.H.; Van Tongeren, D.F.R. Data Analysis in Community and Landscape Ecology; Pudoc.: Wageningen, The Netherlands, 1987; p. 295. [Google Scholar]
- Kent, M.; Coker, P. Vegetation Description and Analysis: A Practical Approach; Belhaven Press: London, UK, 1992; p. 363. [Google Scholar]
- Magurran, A.E. Ecological Diversity and Its Measurement; Princeton University Press: Princeton, NJ, USA, 1988; p. 179. [Google Scholar]
- Piernik, A. The Use of Numerical Methods in Ecology; Nicolaus Copernicus University: Toruń, Poland, 2012; p. 113. [Google Scholar]
- Lepš, J.; Šmilauer, P. Multivariate Analysis of Ecological Data Using CANOCO; Cambridge University Press: Cambridge, UK, 2003; p. 269. [Google Scholar]
- Ter Braak, C.J.F.; Smilauer, P. CANOCO Reference Manual and CanoDraw for Windows User’s Guide: Software for Canonical Community Ordination, version 4.5; Microcomputer Power: Ithaca, NY, USA, 2002; p. 55. [Google Scholar]
- Van der Maarel, E. Multivariate analysis in plant ecology. In Numerical Methods in Studying the Structure and Functioning of Vegetation; Kaźmierczak, E., Ed.; V School and XLVI Geobotanical Seminar of the Polish Botanical Society; University Nicholas Copernicus in Torun: Torun, Poland, 1998; pp. 65–108. [Google Scholar]
- Hammer, Ø.; Harper, D.A.T.; Ryan, P.D. PAST Paleontological Statistics Version 3.14: Reference Manual; University of Oslo: Oslo, Norway, 2016; p. 259. [Google Scholar]
- Semere, T.; Slater, F.M. Ground flora, small mammal and bird species diversity in miscanthus (Miscanthus×giganteus) and reed canary grass (Phalaris arundinacea) fields. Biomass Bioenergy 2007, 31, 20–29. [Google Scholar] [CrossRef]
- Rola, J.; Sekutowski, T.; Rola, H.; Badowski, M. Weed problems on the new Miscanthus gigantheus plantations. Pam. Puł. 2009, 150, 233–246. [Google Scholar]
- Rola, J.; Sekutowski, T.; Rola, H.; Badowski, M. Biodiversity of weed communities on willow (Salix viminalis L.) plantation in the dolnoslaskie and opolskie voivodeship. Pam. Puł. 2007, 145, 165–175. [Google Scholar]
- Trąba, C.; Majda, J.; Wolański, P. Plant communities accompanying plantations of Salix cordata „Americana” Hort. and Salix viminalis L. in Podkarpackie voivodeship. Pam. Puł. 2007, 145, 221–231. [Google Scholar]
- Kościk, B.; Ziemińska-Smyk, M. Weed communities in perennial energy plants. Pam. Puł. 2009, 150, 171–180. [Google Scholar]
- Bourke, D.; Stanley, D.; O’Rourke, E.; Thompson, R.; Carnus, T.; Dauber, J.; Emmerson, M.; Whelan, P.; Heco, F.; Flynn, E.; et al. Response of farmland biodiversity to the introduction of bioenergy crops: Effects of local factors and surrounding landscape context. GCB Bioenergy 2014, 6, 275–289. [Google Scholar] [CrossRef]
- Sekutowski, T.; Bortniak, M. Usage of microbiotest Phytotoxkit™ in detecting of allelopathic potential of Phalaris arundinacea. J. Res. Appl. Agric. Eng. 2009, 54, 88–93. [Google Scholar]
- Sobisz, Z.; Ratuszniak, I. Vascular flora of Salix viminalis L., Helianthus tuberosus L. and Rosa multiflora Thunb. crops on Central Pomerania. Pam. Puł. 2009, 150, 307–322. [Google Scholar]
- Zanin, G.; Otto, S.; Riello, L.; Borin, M. Ecological interpretation of weed flora dynamics under different tillage systems. Agric. Ecosyst. Environ. 1997, 66, 177–188. [Google Scholar] [CrossRef]
- Hyvönen, T.; Ketoja, E.; Salonen, J.; Jalli, H.; Tiainen, J. Weed species diversity and community composition in organic and conventional cropping of spring cereals. Agric. Ecosyst. Environ. 2003, 97, 131–149. [Google Scholar] [CrossRef]
- Armengot, L.; José-María, L.; Chamorro, L.; Sans, F.X. Weed harrowing in organically grown cereal crops avoids yield losses without reducing weed diversity. Agron. Sustain. Dev. 2013, 33, 405–411. [Google Scholar] [CrossRef]
- Baessler, C.; Klotz, S. Effects of changes in agricultural land-use on landscape structure and arable weed vegetation over the last 50 years. Agric. Ecosyst. Environ. 2006, 115, 43–50. [Google Scholar] [CrossRef]
- Krawczyk, R. Trends in changes of weed infestation-hope and risk. Prog. Plant Prot. 2005, 45, 233–241. [Google Scholar]
- Smeets, E.M.W.; Lewandowski, I.; Andre, M.; Faaij, P.C. The economical and environmental performance of miscanthus and switchgrass production and supply chains in a European setting. Renew. Sustain. Energy Rev. 2009, 13, 1230–1245. [Google Scholar] [CrossRef]
- Weih, M.; Karacic, A.; Munkert, H.; Verwijst, T.; Diekmann, M. Influence of young poplar stands on floristic diversity in agricultural landscapes (Sweden). Basic Appl Ecol. 2003, 4, 149–156. [Google Scholar] [CrossRef]
- Archaux, F.; Chevaliera, R.; Berthelot, A. Towards practices favourable to plant diversity in hybrid poplar plantations. For. Ecol. Manag. 2010, 259, 2410–2417. [Google Scholar] [CrossRef]
- Anioł-Kwiatkowska, J.; Kącki, Z.; Śliwiński, M. A comparison of species composition of three energy willow crops. Pam. Puł. 2009, 150, 19–34. [Google Scholar]
- Korniak, T.; Hołdyński, C.; Wąsowicz, K. Changes in the weed flora of willow plantations in north-eastern Poland. Pam. Puł. 2009, 150, 159–170. [Google Scholar]
- Wojciechowski, W.; Sowinski, J.; Zawieja, J. The effect of age of willow plantation on weed infestation in the Sudety Mountains. Pam. Puł. 2009, 150, 351–358. [Google Scholar]
- Rowe, R.L.; Goulson, D.; Doncaster, C.P.; Clarke, D.J.; Taylor, G.; Hanley, M.E. Evaluating ecosystem processes in willow short rotation coppice bioenergy plantations. GCB Bioenergy 2013, 5, 257–266. [Google Scholar] [CrossRef]
- Whittingham, M.J. The future of agri-environment schemes: Biodiversity gains and ecosystem service delivery? J. Appl. Ecol. 2011, 48, 509–513. [Google Scholar] [CrossRef]
- Manning, P.; Taylor, G.; Hanley, M.E. Bioenergy, Food Production and Biodiversity—An Unlikely Alliance? GCB Bioenergy 2015, 7, 570–576. [Google Scholar] [CrossRef]
Figure 1.
Location (a) and scheme (b) of experimental fields with energy crops and agricultural crops under different production systems.
Figure 1.
Location (a) and scheme (b) of experimental fields with energy crops and agricultural crops under different production systems.

Figure 2.
Weed species richness on energy crop plantations in 2010–2012 and 2013–2015. Means for the three years are presented in each column (n = 3). Within each dataset, different letters represent significantly different values according to the Kruskal‒Wallis test (p ≤ 0.05). Explanation of symbols: w_3—willow harvested every three years, w_1—willow harvested every year, po—poplar, a—false acacia, j—Jerusalem artichoke, v—Virginia mallow cultivated from seedlings, v—Virginia mallow cultivated from seeds, m—miscanthus, r—reed canary grass, s—switchgrass, b—big bluestem, pr—prairie cordgrass.

Figure 3.
Weed flora density on energy crops plantations in 2010–2012 and 2013–2015. Means for three years are presented in each column (n = 3 years × 4 replications = 12). Within each dataset, different letters represent significantly different values according to the Kruskal‒Wallis test (p ≤ 0.05). Explanation of symbols: w_3—willow harvested every three years, w_1—willow harvested every year, po—poplar, a—false acacia, j—Jerusalem artichoke, v—Virginia mallow cultivated from seedlings, v—Virginia mallow cultivated from seeds, m—miscanthus, r—reed canary grass, s—switchgrass, b—big bluestem, pr—prairie cordgrass.

Figure 4.
Total number of weed species in different farming systems and in groups of plants cultivated for energy purposes. Values are the three-year mean ± SD (n = 3). Values with the same letter are not significantly different according to the nonparametric Kruskal‒Wallis test (p ≤ 0.05). Explanations of symbols: O—Organic, I—Integrated, C—Conventional, M—Monoculture of winter wheat, T—Trees and bushes, D—Dicotyledonous, G—Grasses; 1—2010–2012, 2—2013–2015.

Figure 5.
Weed flora density in crops cultivated in different farming systems and in groups of plants cultivated for energy purposes. Means and standard deviations are presented [n = 12–60; n = 3 years × number of crops in rotation (from 1 to 5, Table 2) × 4 replications]. Values with the same letter are not significantly different according to the nonparametric Kruskal‒Wallis test (p ≤ 0.05). Explanations of symbols: O—Organic, I—Integrated, C—Conventional, M—Monoculture of winter wheat, T—Trees and bushes, D—Dicotyledonous, G—Grasses; 1—2010–2012, 2—2013–2015.

Figure 6.
The results of the hierarchical cumulative classification using the average linkage method (UPGMA) of weed flora samples representing different types of land use due to the qualitative Sorensen’s coefficient of similarity. Explanations of symbols: O—Organic, I—Integrated, C—Conventional, M—Monoculture of winter wheat, T—Trees and bushes, D—Dicotyledonous, G—Grasses, 1—2010–2012, 2—2013–2015.

Figure 7.
Shannon’s diversity index (a) and Simpson’s dominance index (b) (±SD) for weed communities under different farming systems and in groups of plants cultivated for energy purposes. The letters give the results of the nonparametric Kruskal‒Wallis test (p ≤ 0.05). The same letters indicate that the objects are not significantly different. Explanations of symbols: O—Organic, I—Integrated, C—Conventional, M—Monoculture of winter wheat, T—Trees and bushes, D—Dicotyledonous, G—Grasses, 1—2010–2012, 2—2013–2015.

Figure 8.
Percentage share of short-lived and perennial species in plant communities accompanying typical agricultural crops and energy crops. (a) agricultural crops in the years 2010–2012, (b) energy crops in the years 2010–2012, (c) energy crops in the years 2013–2015.
Figure 8.
Percentage share of short-lived and perennial species in plant communities accompanying typical agricultural crops and energy crops. (a) agricultural crops in the years 2010–2012, (b) energy crops in the years 2010–2012, (c) energy crops in the years 2013–2015.

Figure 9.
Percentage share of species from different habitats in plant communities accompanying annual agricultural crops and energy crops. (a) agricultural crops in the years 2010–2012, (b) energy crops in the years 2010–2012, (c) energy crops in the years 2013–2015.
Figure 9.
Percentage share of species from different habitats in plant communities accompanying annual agricultural crops and energy crops. (a) agricultural crops in the years 2010–2012, (b) energy crops in the years 2010–2012, (c) energy crops in the years 2013–2015.

Figure 10.
Ordination diagram of objects (a) and species (b) in relation to the first and second axis of DCA.
Figure 10.
Ordination diagram of objects (a) and species (b) in relation to the first and second axis of DCA.

Figure 11.
Ordination diagram of species and agrotechnical variables in relation to the first and second axis of RDA (RDA diplot) using CANOCO. Explanations of symbols: ORG—Organic, INT—Integrated, CONW—Conventional, MONO—Monoculture of winter wheat, T—Trees and bushes, D—Dicotyledonous, G—Grasses, 1—2010–2012, 2—2013–2015.


Table 1.
Selected elements of the agricultural practices of crops cultivated for energy purposes.
| Type of Crop for Energy Purposes | Crop Species | Type of Management Adopted | Year of Plantation Establishment | Plant Density (pl. ha −1)/Sowing Rate (Seeds ha−1) | Yield (t DM* ha−1 Year−1) |
|---|---|---|---|---|---|
| Trees and bushes (T) | willow (w_1) | harvested every year | 2004 | 40,000 cuttings ha−1 | 16.3 |
| willow (w_3) | harvested every 3 years | 2004 | 40,000 cuttings ha−1 | 26.4 | |
| poplar (po) | harvested every year | 2008 | 8,000 cuttings ha−1 | 13.4 | |
| false acacia (a) | harvested every year | 2008 | 17,000 cuttings ha−1 | 9.0 | |
| Perennial dicotyledonous plants (D) | Virginia mallow cultivated from seedlings (v) | harvested every year | 2004 | 20,000 plants ha−1 | 17.7 |
| Virginia mallow cultivated from seeds (v_s) | harvested every year | 2004 | 1.5 kg seeds ha−1 | 14.5 | |
| Jerusalem artichoke (j) | harvested every year | 2004 | 20,000 tubers ha−1 | 12.7 | |
| Perennial grasses (G) | miscanthus (m) | harvested every year, usually before winter | 2004 | 15,000 cuttings ha−1 | 18.9 |
| reed canary grass (r) | harvested every year | 2004 | 20 kg seeds ha−1 | 9.6 | |
| switchgrass (s) | harvested every year | 2008 | 22,000 plants ha−1 | 14.6 | |
| big bluestem (b) | harvested every year | 2008 | 22,000 plants ha−1 | 12.8 | |
| prairie cordgrass (pr) | harvested every year | 2008 | 11,000 plants ha−1 | 23.2 |
* DM—dry matter.
Table 2.
Characteristics of different crop production systems on arable land and major elements of the agricultural practices in winter wheat fields.
Table 2.
Characteristics of different crop production systems on arable land and major elements of the agricultural practices in winter wheat fields.
| Items | Organic (O) | Integrated (I) | Conventional (C) | Monoculture (M) |
|---|---|---|---|---|
| Crop rotation | potato spring wheat + undersown crop clovers and grasses (1st year) clovers and grasses (2nd year) winter wheat + catch crop | potato spring wheat + catch crop fava bean or blue lupine winter wheat + catch crop | winter rape winter wheat spring wheat | winter wheat |
| Organic fertilization | compost (30 t ha−1) under potato + catch crop | compost (30 t ha−1) under potato + 2× catch crop | rape straw, winter wheat straw | wheat straw (every two years) |
| Mineral fertilization (kg ha−1) | according to the results of soil analysis, use of P and K fertilizers in the form of natural rock | NPK (85 + 55 + 65) | NPK (140 + 60 + 80) | |
| Retardants | - | 1–2× | 2× | |
| Fungicides | - | 2× | 2–3× | |
| Weed control | weeder harrow 2–3× | weeder harrow 1× herbicides 1–2× | herbicides 2–3× | |
Table 3.
List of species and mean density of weed flora accompanying annual agricultural crops and crops for energy purposes.
Table 3.
List of species and mean density of weed flora accompanying annual agricultural crops and crops for energy purposes.
| Agricultural Crops 2010–2012 | Energy Crops 2010–2012 | Energy Crops 2013–2015 | |||||||
|---|---|---|---|---|---|---|---|---|---|
| No | Species | Density (plants m−2) | Dr* | Species | Density (plants m−2) | Dr* | Species | Density (plants m−2) | Dr* |
| 1. | Vio.arv | 5.818 | S | Con.can | 11.429 | S | Gal.apa | 10.324 | S |
| 2. | Chen.alb | 5.456 | S | Vio.arv | 8.827 | S | Vio.arv | 9.059 | S |
| 3. | Ste.med | 2.496 | S | Ste.med | 5.763 | S | Cap.bur | 8.199 | S |
| 4. | Gal.apa | 1.558 | S | Chen.alb | 4.859 | S | Ste.med | 7.875 | S |
| 5. | Ech.cru | 1.512 | S | Sen.vul (2) | 4.782 | S | Ech.cru | 6.743 | S |
| 6. | Cap.bur | 1.373 | S | Lac.ser | 4.500 | S | Sol.gig | 6.294 | P |
| 7. | Fal.con | 1.353 | S | Tar.off | 3.795 | P | Gal.par | 5.706 | S |
| 8. | Tri.ino | 1.205 | S | Poa.ann | 2.821 | S | Ely.rep | 4.941 | P |
| 9. | Lam.pur | 1.004 | S | Gal.apa | 2.513 | S | Che.alb | 4.037 | S |
| 10. | Fum.off | 0.927 | S | Cap.bur | 2.147 | S | Tar.off | 3.603 | P |
| 11. | Ape.spi | 0.903 | S | Sol.gig | 1.859 | P | Poa.pra (3) | 2.596 | P |
| 12. | Lap.com | 0.772 | S | Tri.ino | 1.808 | S | Ara.tha (2) | 1.779 | S |
| 13. | Equ.arv | 0.747 | P | Ely.rep | 1.603 | P | Con.can | 1.765 | S |
| 14. | Cir.arv | 0.713 | P | Jun.buf (2) | 1.359 | S | Son.arv | 1.750 | P |
| 15. | Pap.rho | 0.577 | S | Cer.arv | 1.141 | P | Sen.vul (2) | 1.662 | S |
| 16. | Vic.hir (1) | 0.548 | S | Ech.cru | 1.064 | S | Tri.ino | 1.544 | S |
| 17. | Ely.rep | 0.412 | P | Ape.spi | 0.910 | S | Lac.ser | 1.250 | S |
| 18. | Tar.off | 0.292 | P | Epi.par (2) | 0.859 | P | Art.vul (2) | 1.074 | P |
| 19. | Ger.pus (1) | 0.269 | S | Equ.arv | 0.667 | P | Geu.urb (2) | 1.015 | P |
| 20. | Ver.per | 0.255 | S | Arr.ela (2) | 0.538 | P | Pol.per | 0.735 | S |
| 21. | Lyc.arv | 0.155 | S | Urt.dio (2) | 0.474 | P | Cer.arv | 0.662 | P |
| 22. | Myo.arv | 0.151 | S | Fal.con | 0.436 | S | Equ.arv | 0.618 | P |
| 23. | Mel.alb | 0.118 | S | Ara.tha (2) | 0.397 | S | Urt.dio (2) | 0.559 | P |
| 24. | Pla.mai | 0.113 | P | Gal.par | 0.385 | S | Lap.com | 0.515 | S |
| 25. | Pol.avi | 0.103 | S | Cre.tec (2) | 0.385 | S | Ape.spi | 0.456 | S |
| 26. | Pol.per | 0.094 | S | Son.arv | 0.346 | P | Ger.dis | 0.441 | S |
| 27. | Cen.cya | 0.077 | S | Ger.dis | 0.333 | S | Sis.loe (2) | 0.309 | S |
| 28. | Ero.cic | 0.064 | S | Fum.off | 0.308 | S | Pol.avi | 0.250 | S |
| 29. | Gal.par | 0.062 | S | Mel.alb | 0.295 | S | Eri.ann (2) | 0.235 | S |
| 30. | Con.can | 0.056 | S | Myo.min | 0.269 | S | Cir.arv | 0.176 | P |
| 31. | Ama.ret | 0.054 | S | Pol.avi | 0.269 | S | Con.arv | 0.176 | S |
| 32. | Son.arv | 0.046 | P | Agr.cap (2) | 0.256 | P | Rum.ace | 0.176 | P |
| 33. | Bra.nap | 0.044 | S | Cir.arv | 0.256 | P | Epi.par (2) | 0.176 | P |
| 34. | Tri.rep | 0.038 | S | Pla.mai (2) | 0.250 | P | Che.pol (3) | 0.132 | S |
| 35. | Myo.min | 0.035 | S | Ant.arv | 0.218 | S | Spe.arv (2) | 0.132 | S |
| 36. | Ger.dis | 0.032 | S | Spe.arv (2) | 0.179 | S | Myo.min | 0.118 | S |
| 37. | Lam.amp (1) | 0.031 | S | Art.vul (2) | 0.173 | P | Mel.alb | 0.103 | S |
| 38. | Poa.ann | 0.031 | S | Geu.urb (2) | 0.154 | P | Pap.rho | 0.103 | S |
| 39. | Cer.arv | 0.023 | P | Rum.ace | 0.154 | P | Poa.ann | 0.103 | S |
| 40. | Gal.tet | 0.021 | S | Ver.per | 0.115 | S | Cre.tec (2) | 0.074 | S |
| 41. | Pla.lan | 0.019 | P | Ero.cic | 0.103 | S | Lol.per (3) | 0.067 | P |
| 42. | Rap.rap (1) | 0.018 | S | Eri.ann (2) | 0.090 | S | Pla.mai | 0.059 | P |
| 43. | Ant.arv | 0.017 | S | Pol.per | 0.077 | S | Lam.pur | 0.059 | S |
| 44. | Vic.cra | 0.015 | P | Ver.hed (2) | 0.077 | S | Myo.arv | 0.059 | S |
| 45. | Con.arv | 0.009 | P | Vic.cra | 0.051 | P | Rum. acetosa (3) | 0.059 | P |
| 46. | Ach.mil | 0.009 | P | Lam.pur | 0.038 | S | Dau.car | 0.044 | P |
| 47. | Con.reg (1) | 0.009 | S | Lyc.arv | 0.038 | S | Arr.ela (2) | 0.044 | P |
| 48. | Eup.hel | 0.008 | P | Eup.hel | 0.038 | P | Bro.ine (2) | 0.044 | P |
| 49. | Rum.ace | 0.008 | P | Fes.ovi (2) | 0.038 | P | Ama.ret | 0.044 | S |
| 50. | Lac.ser | 0.008 | S | Cen.cya | 0.038 | S | Thl.arv | 0.044 | S |
| 51. | Sin.arv (1) | 0.003 | S | Hie.pil (2) | 0.038 | P | Son.ole | 0.037 | P |
| 52. | Sol.gig | 0.003 | P | Sam.nig (2) | 0.026 | S | Pla.lan | 0.029 | P |
| 53. | Pot.ans (1) | 0.003 | P | Tri.rep | 0.026 | S | Tri.rep | 0.029 | P |
| 54. | Thl.arv | 0.003 | S | Ach.mil | 0.026 | P | Ach.mil | 0.029 | P |
| 55. | Des.sop (2) | 0.026 | S | Sid.her (2) | 0.029 | P | |||
| 56. | Gal.tet | 0.026 | S | Vic.cra | 0.029 | P | |||
| 57. | Sis.loe (2) | 0.019 | S | Gal.tet | 0.022 | S | |||
| 58. | Leo.his (2) | 0.019 | P | Bra.nap | 0.016 | S | |||
| 59. | Cam.pat (2) | 0.019 | P | Ero.cic | 0.015 | S | |||
| 60. | Aeg.pod (2) | 0.019 | P | Con.arv | 0.015 | P | |||
| 61. | Con.arv | 0.013 | P | Pol.lap (3) | 0.015 | S | |||
| 62. | Bro.ine (2) | 0.013 | P | Ant.arv | 0.015 | S | |||
| 63. | Vio.tri (2) | 0.013 | S | Gna.uli (2) | 0.015 | S | |||
| 64. | Myo.arv | 0.013 | S | ||||||
| 65. | Sol.nig (2) | 0.013 | S | ||||||
| 66. | Gna.uli (2) | 0.013 | S | ||||||
| 67. | Gna.sil (2) | 0.013 | S | ||||||
| 68. | Sid.her (2) | 0.013 | P | ||||||
| Total | 29.667 | Total | 69.833 | Total | 88.272 | ||||
*Durability (Dr): S—short-lived (annual and/or biennial), P—perennial; Occurrence of weed species: (1) species that occurred only in agricultural crops, (2) species that occurred only in energy crops, (3) species that occurred only in energy crops in 2013–2015.
Table 4.
The results of forward selection of variables and the Monte Carlo permutation test using CANOCO.
Table 4.
The results of forward selection of variables and the Monte Carlo permutation test using CANOCO.
| Variable | Marginal Effects | Conditional Effects | ||
|---|---|---|---|---|
| Lambda | Lambda | P-level of Significance | F-Ratio | |
| Grasses 2010–2012 (G1) | 0.09 | 0.09 | 0.002 | 3.55 |
| Organic system (ORG) | 0.09 | 0.08 | 0.002 | 3.58 |
| Integrated system (INT) | 0.07 | 0.07 | 0.002 | 3.19 |
| Trees and bushes 2013–2015 (T2) | 0.06 | 0.04 | 0.004 | 2.20 |
| Wheat monoculture (MONO) | 0.06 | 0.06 | 0.002 | 2.83 |
| Grasses 2013–2015 (G2) | 0.05 | 0.05 | 0.002 | 2.66 |
| Trees and bushes 2010–2012 (T1) | 0.05 | 0.04 | 0.004 | 2.10 |
| Conventional system (CONW) | 0.04 | 0.05 | 0.002 | 2.83 |
| Dicotyledons 2013–2015 (D2) | 0.04 | - | - | - |
| Dicotyledons 2010–2012 (D1) | 0.02 | 0.02 | 0.358 | 1.10 |
| Test of RDA canonical axes significance: | first canonical axis | 0.002 | 6.881 | |
| all canonical axes | 0.002 | 3.197 | ||
© 2019 by the authors. Licensee MDPI, Basel, Switzerland. This article is an open access article distributed under the terms and conditions of the Creative Commons Attribution (CC BY) license (http://creativecommons.org/licenses/by/4.0/).
Share and Cite
MDPI and ACS Style
Feledyn-Szewczyk, B.; Matyka, M.; Staniak, M. Comparison of the Effect of Perennial Energy Crops and Agricultural Crops on Weed Flora Diversity. Agronomy 2019, 9, 695. https://doi.org/10.3390/agronomy9110695
AMA Style
Feledyn-Szewczyk B, Matyka M, Staniak M. Comparison of the Effect of Perennial Energy Crops and Agricultural Crops on Weed Flora Diversity. Agronomy. 2019; 9(11):695. https://doi.org/10.3390/agronomy9110695
Chicago/Turabian StyleFeledyn-Szewczyk, Beata, Mariusz Matyka, and Mariola Staniak. 2019. "Comparison of the Effect of Perennial Energy Crops and Agricultural Crops on Weed Flora Diversity" Agronomy 9, no. 11: 695. https://doi.org/10.3390/agronomy9110695
Note that from the first issue of 2016, this journal uses article numbers instead of page numbers. See further details here.