Evaluating Soybean Cultivars for Low- and High-Temperature Tolerance During the Seedling Growth Stage


Abstract
:1. Introduction
2. Materials and Methods
2.1. Measurements
2.2. Cumulative Stress Response Indices
2.3. Data Analysis
2.4. Principal Component Analysis (PCA)
3. Results
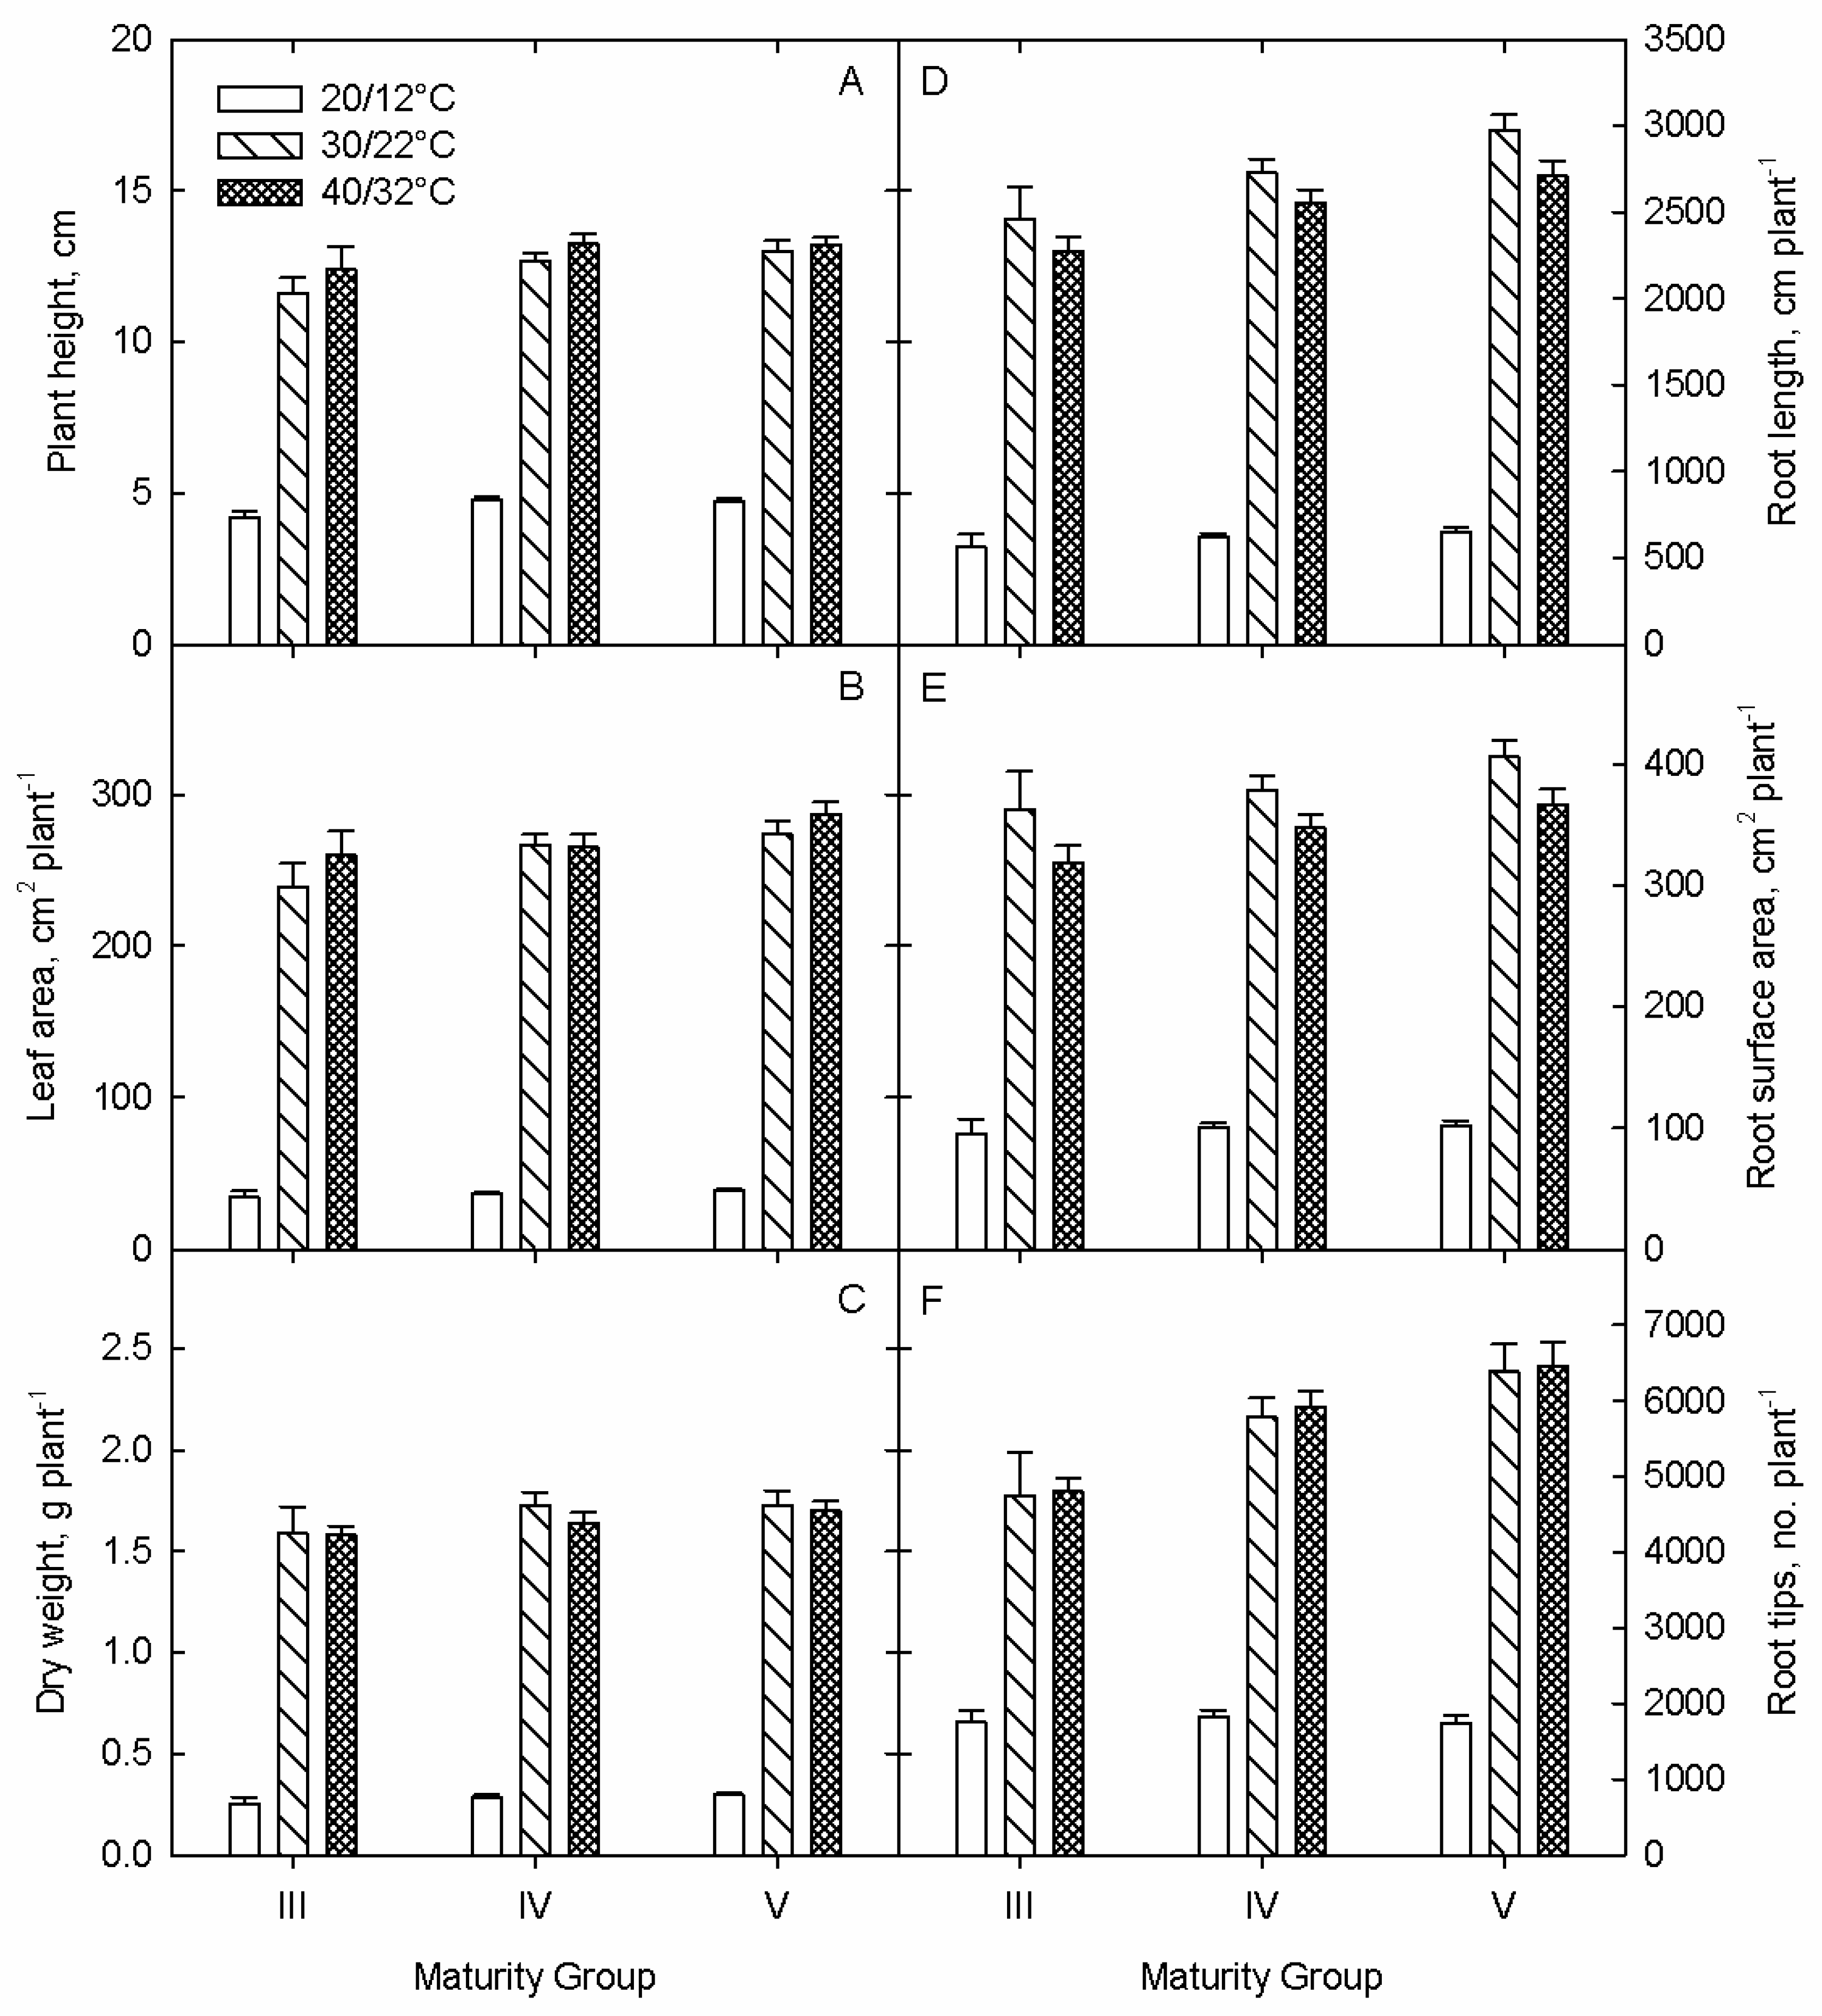
3.1. Growth and Development
3.1.1. Shoot Parameters
3.1.2. Root Parameters
Root Growth
Root Development
3.1.3. Plant-Component Dry Weights
3.1.4. Physiological Parameters
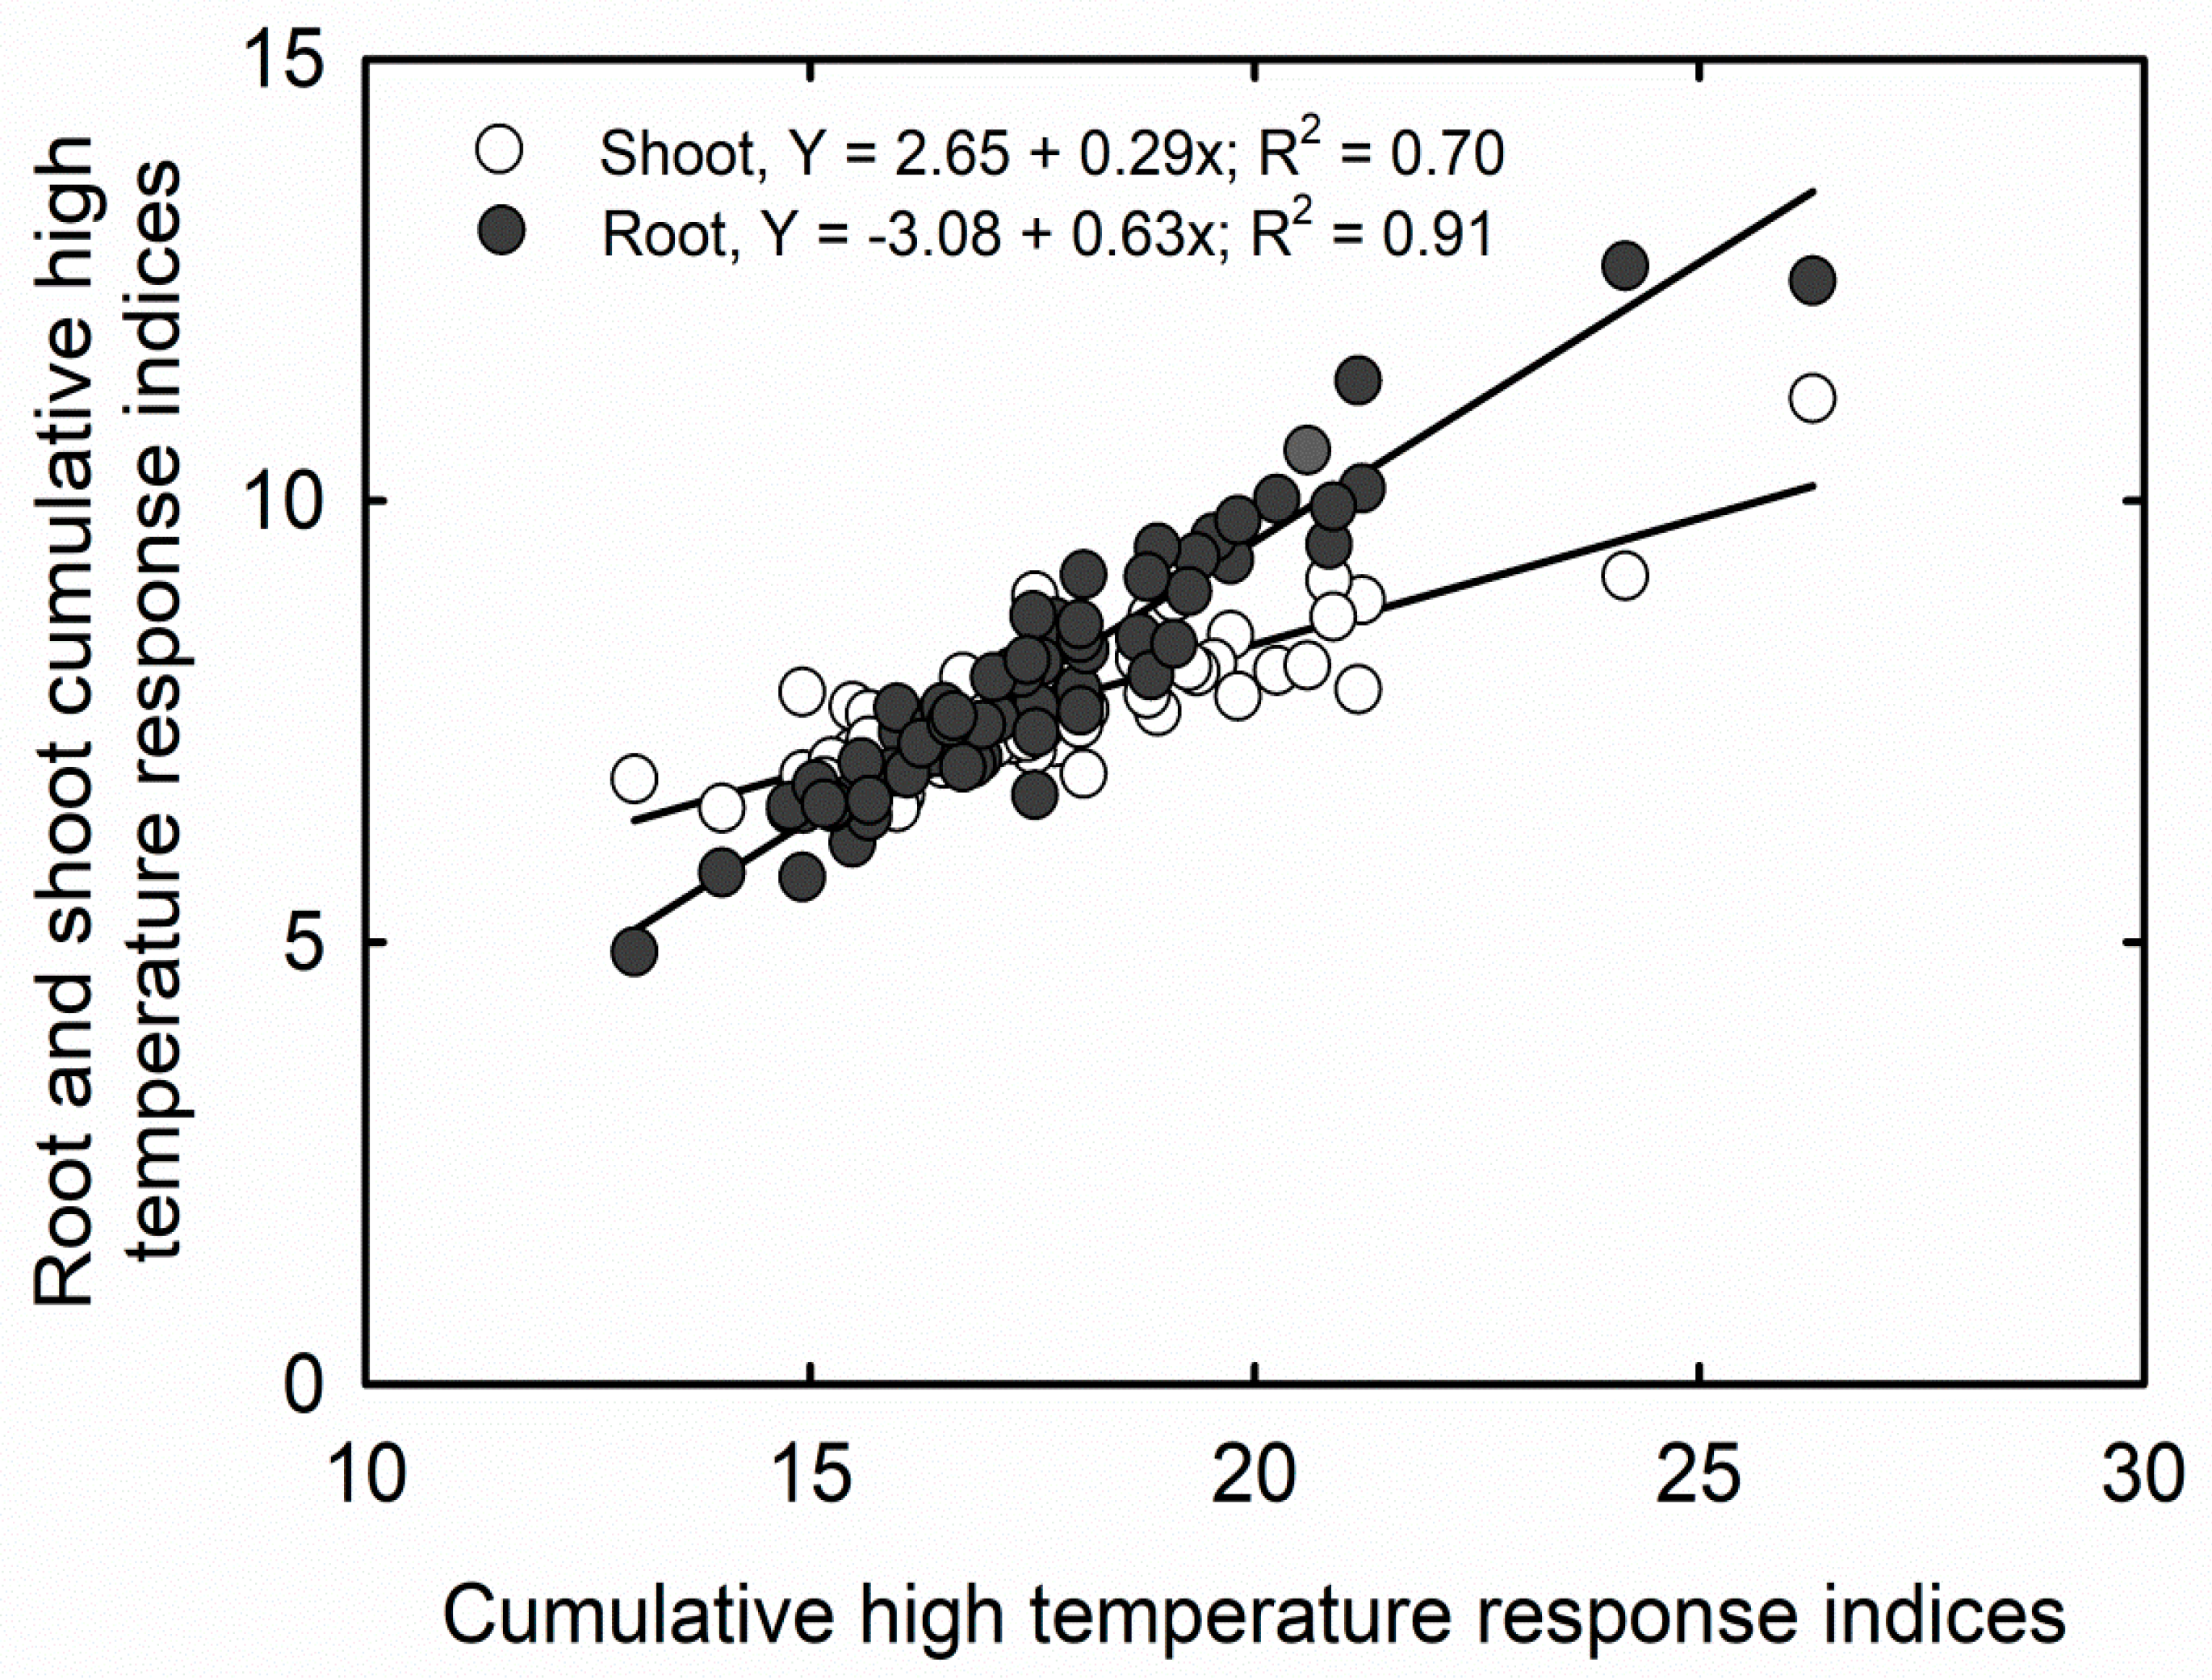
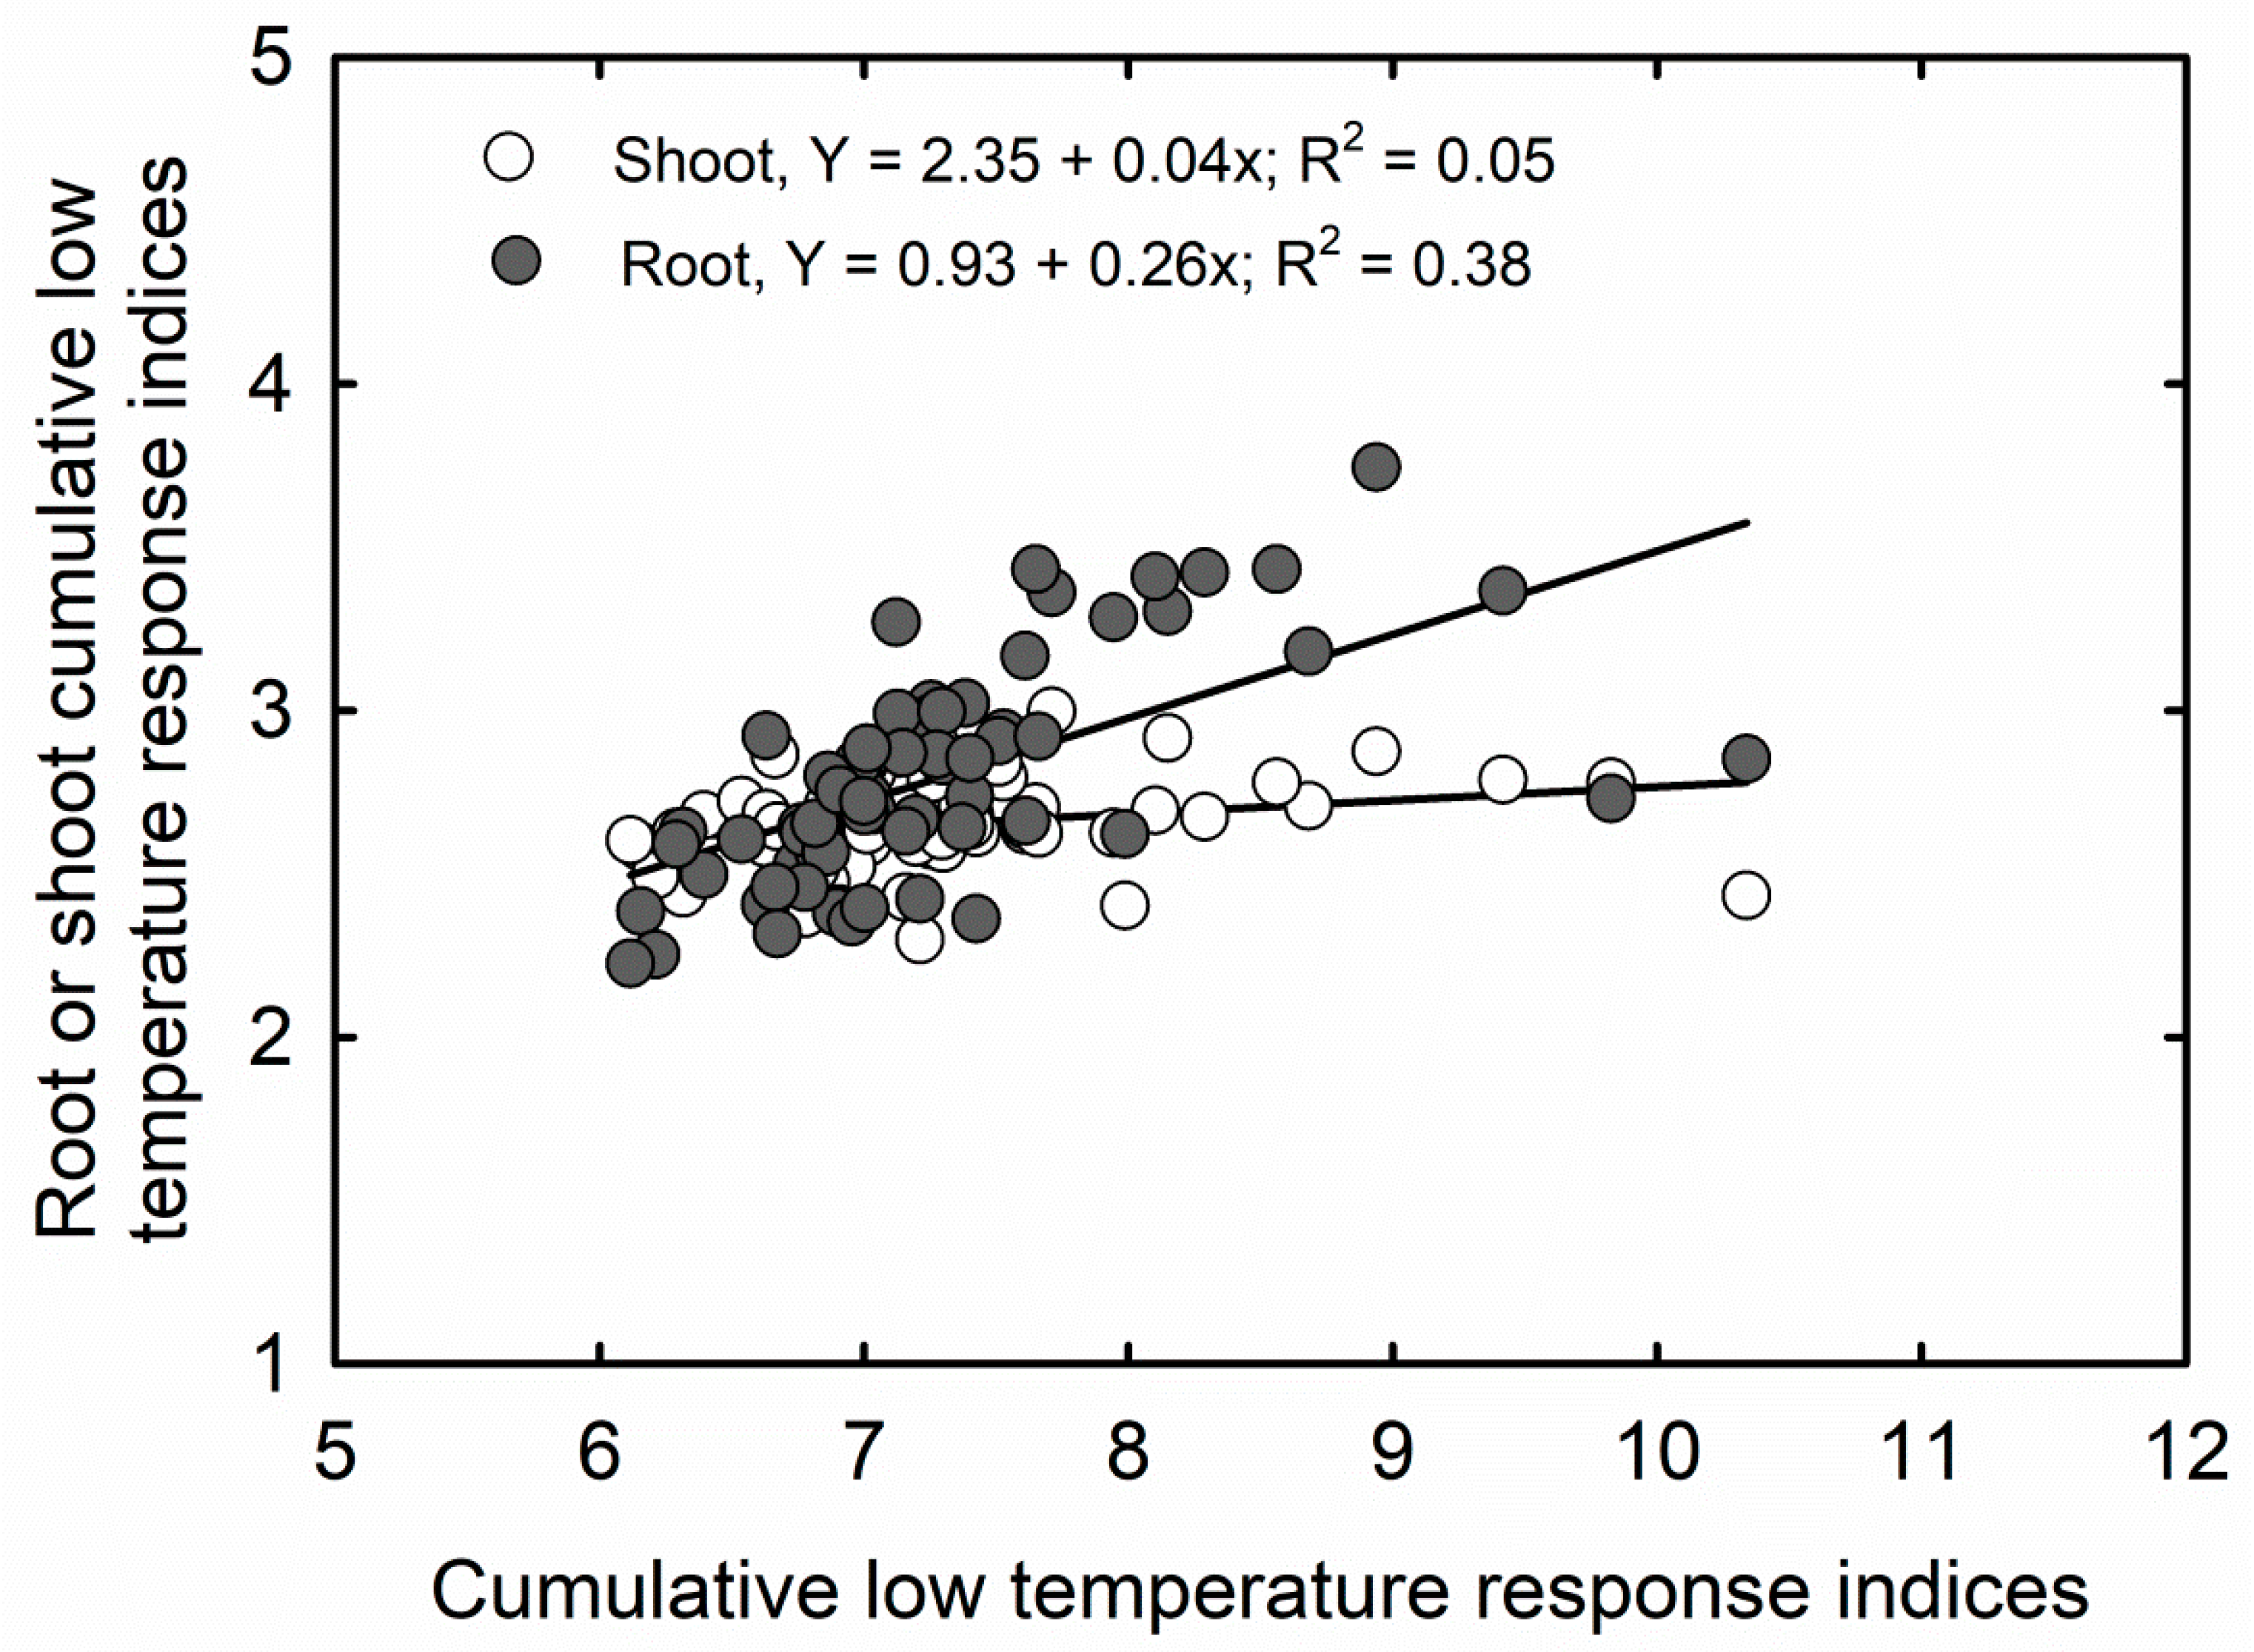
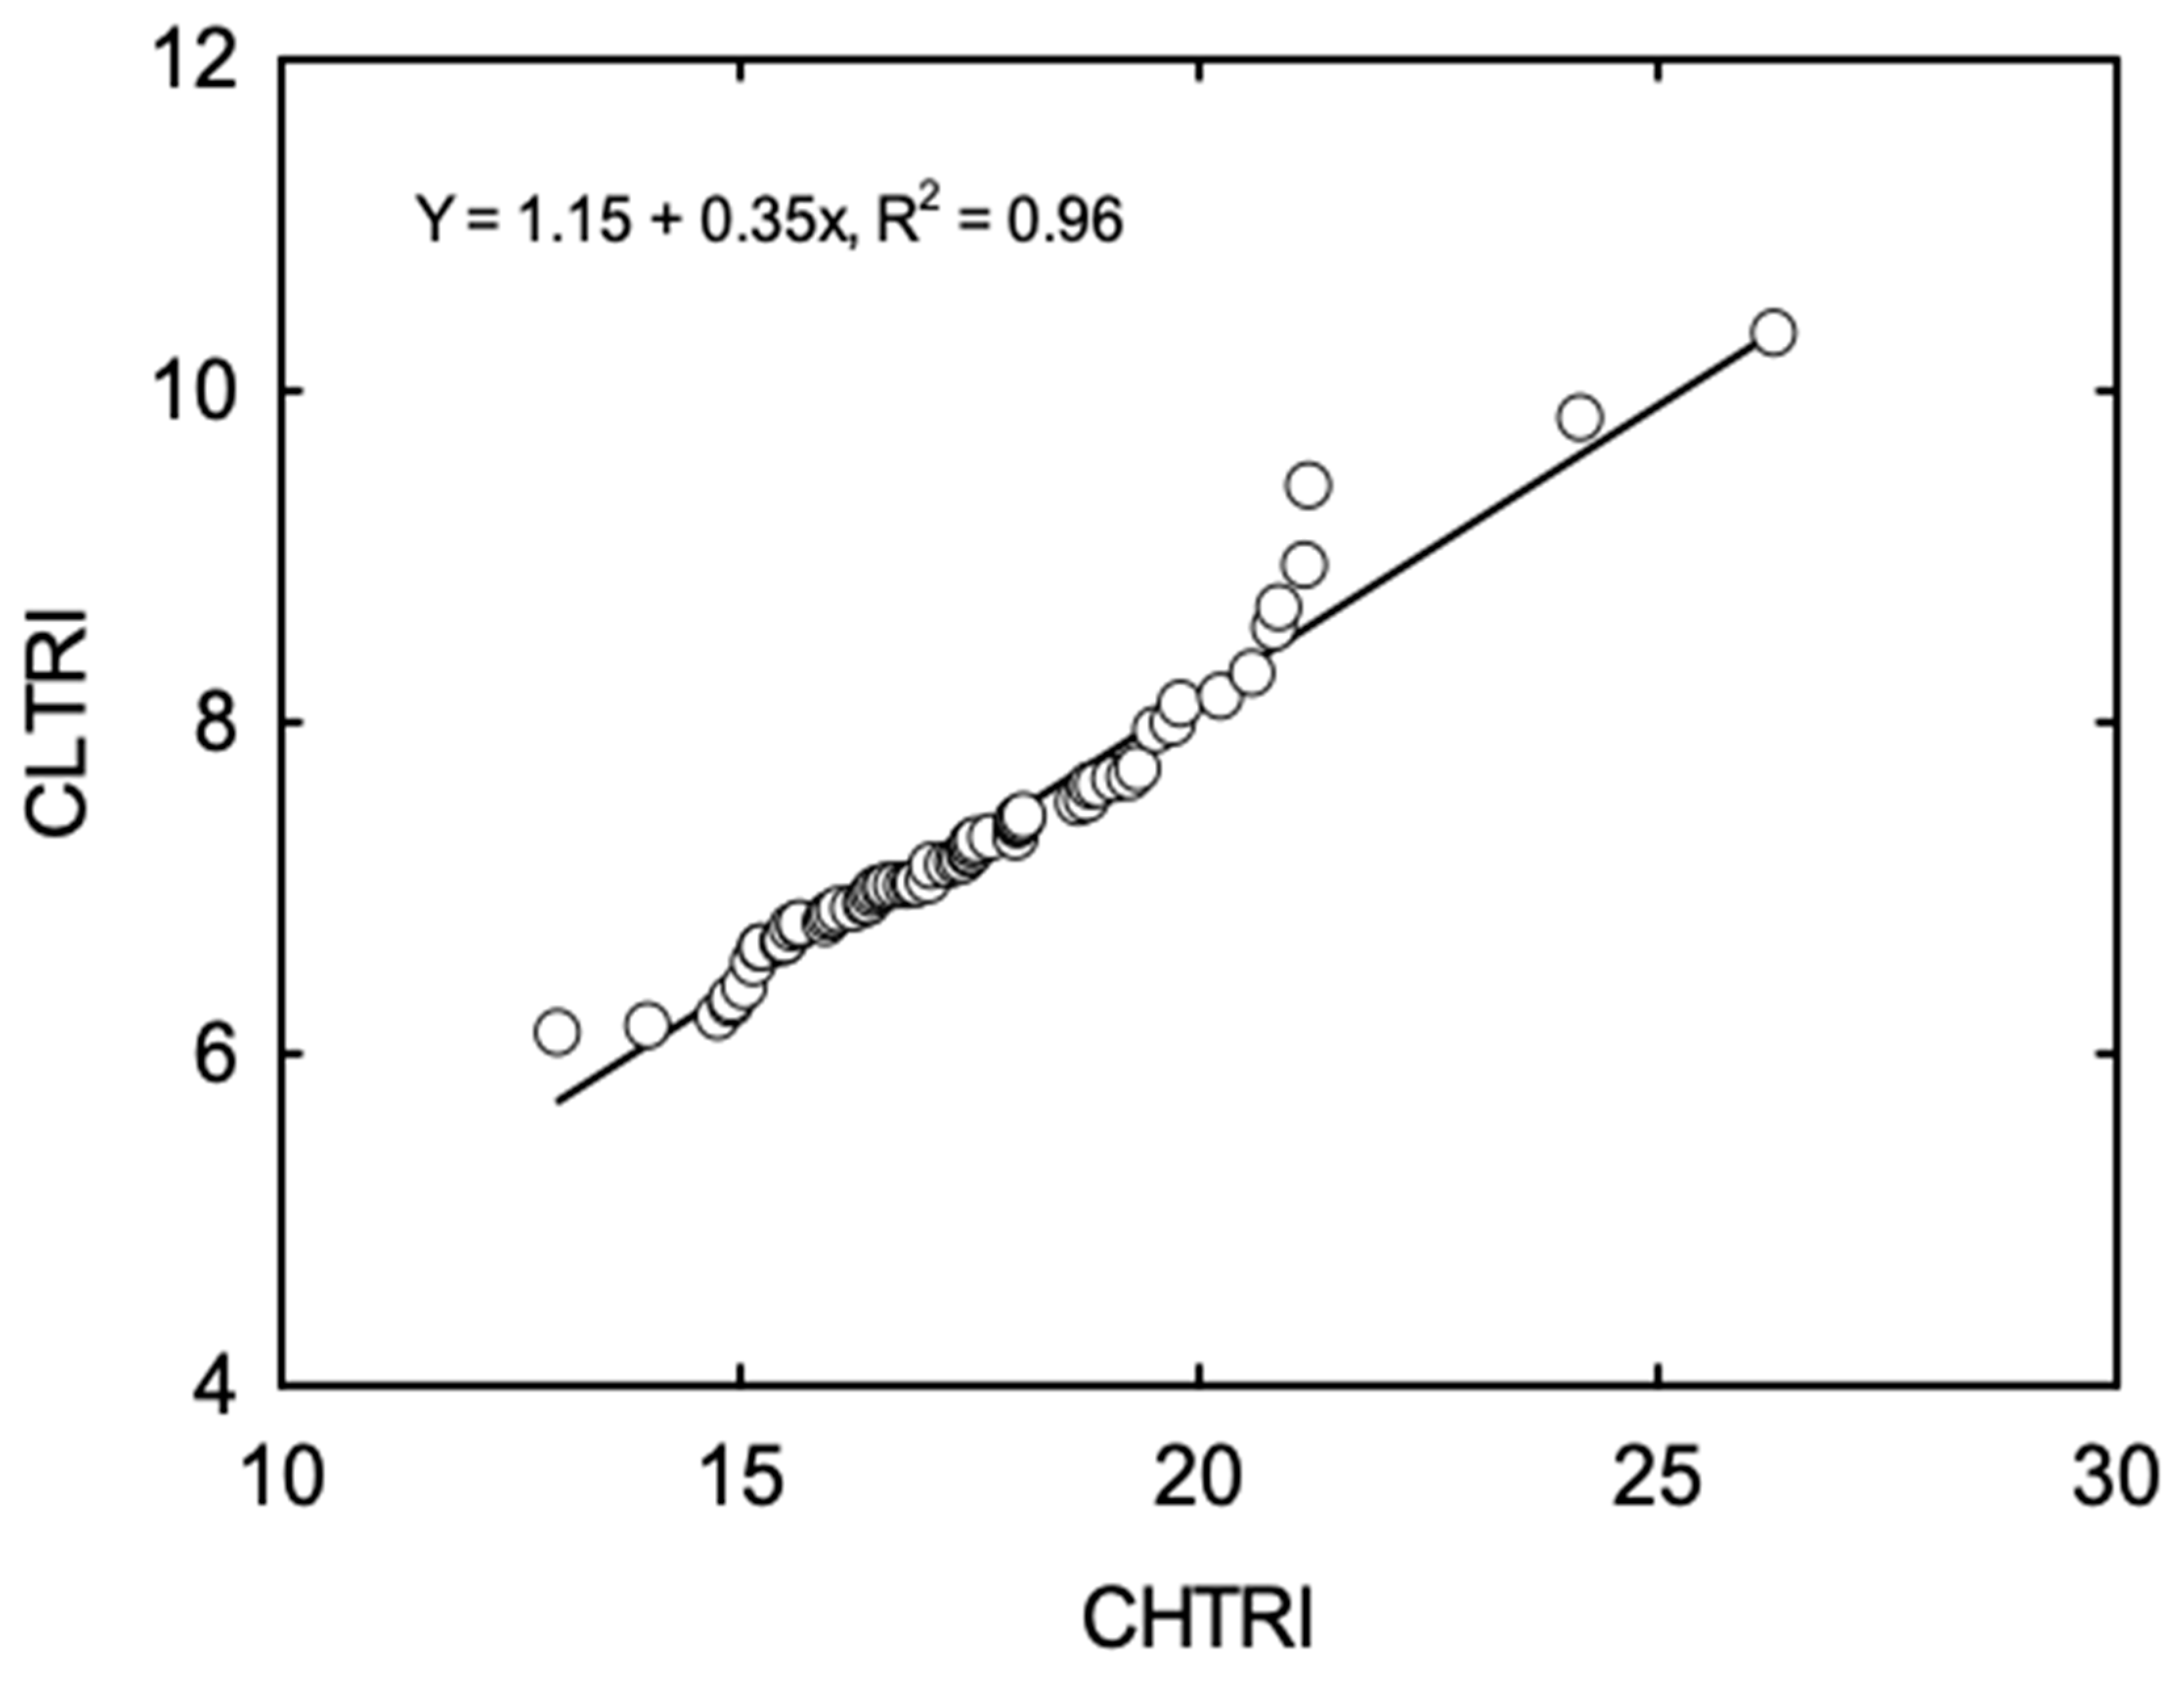
3.2. Cumulative Stress Response Indices
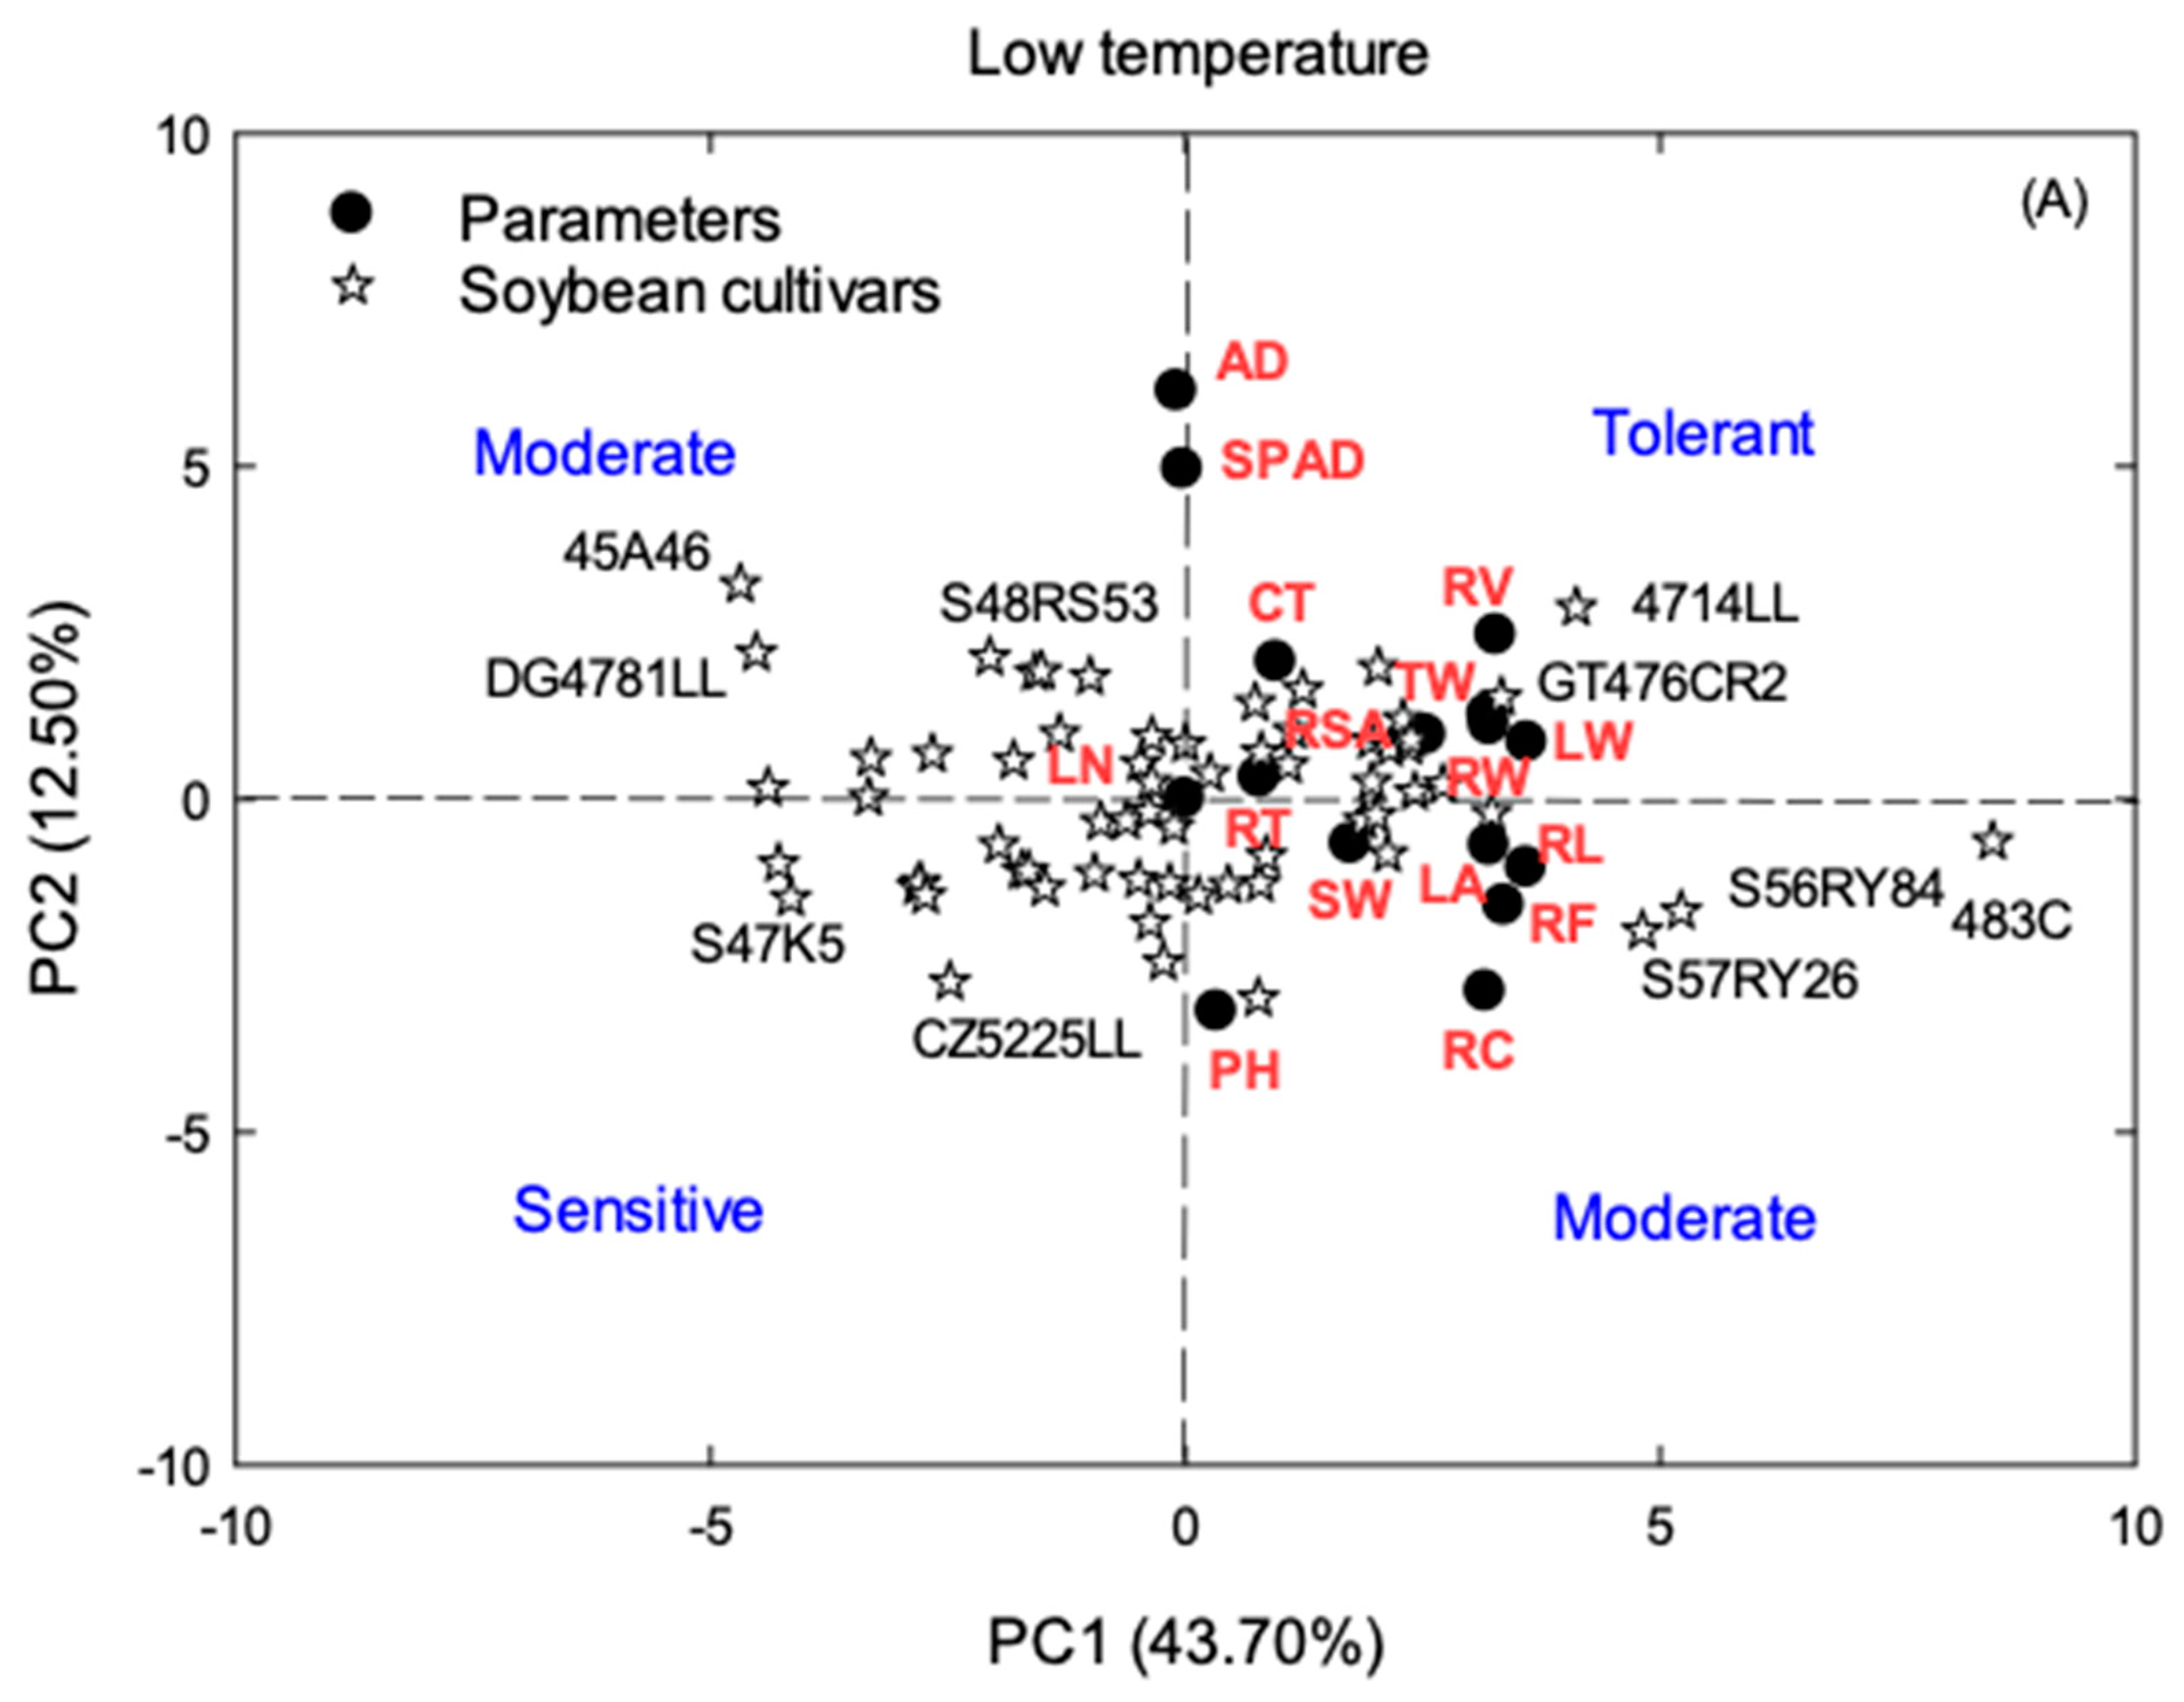
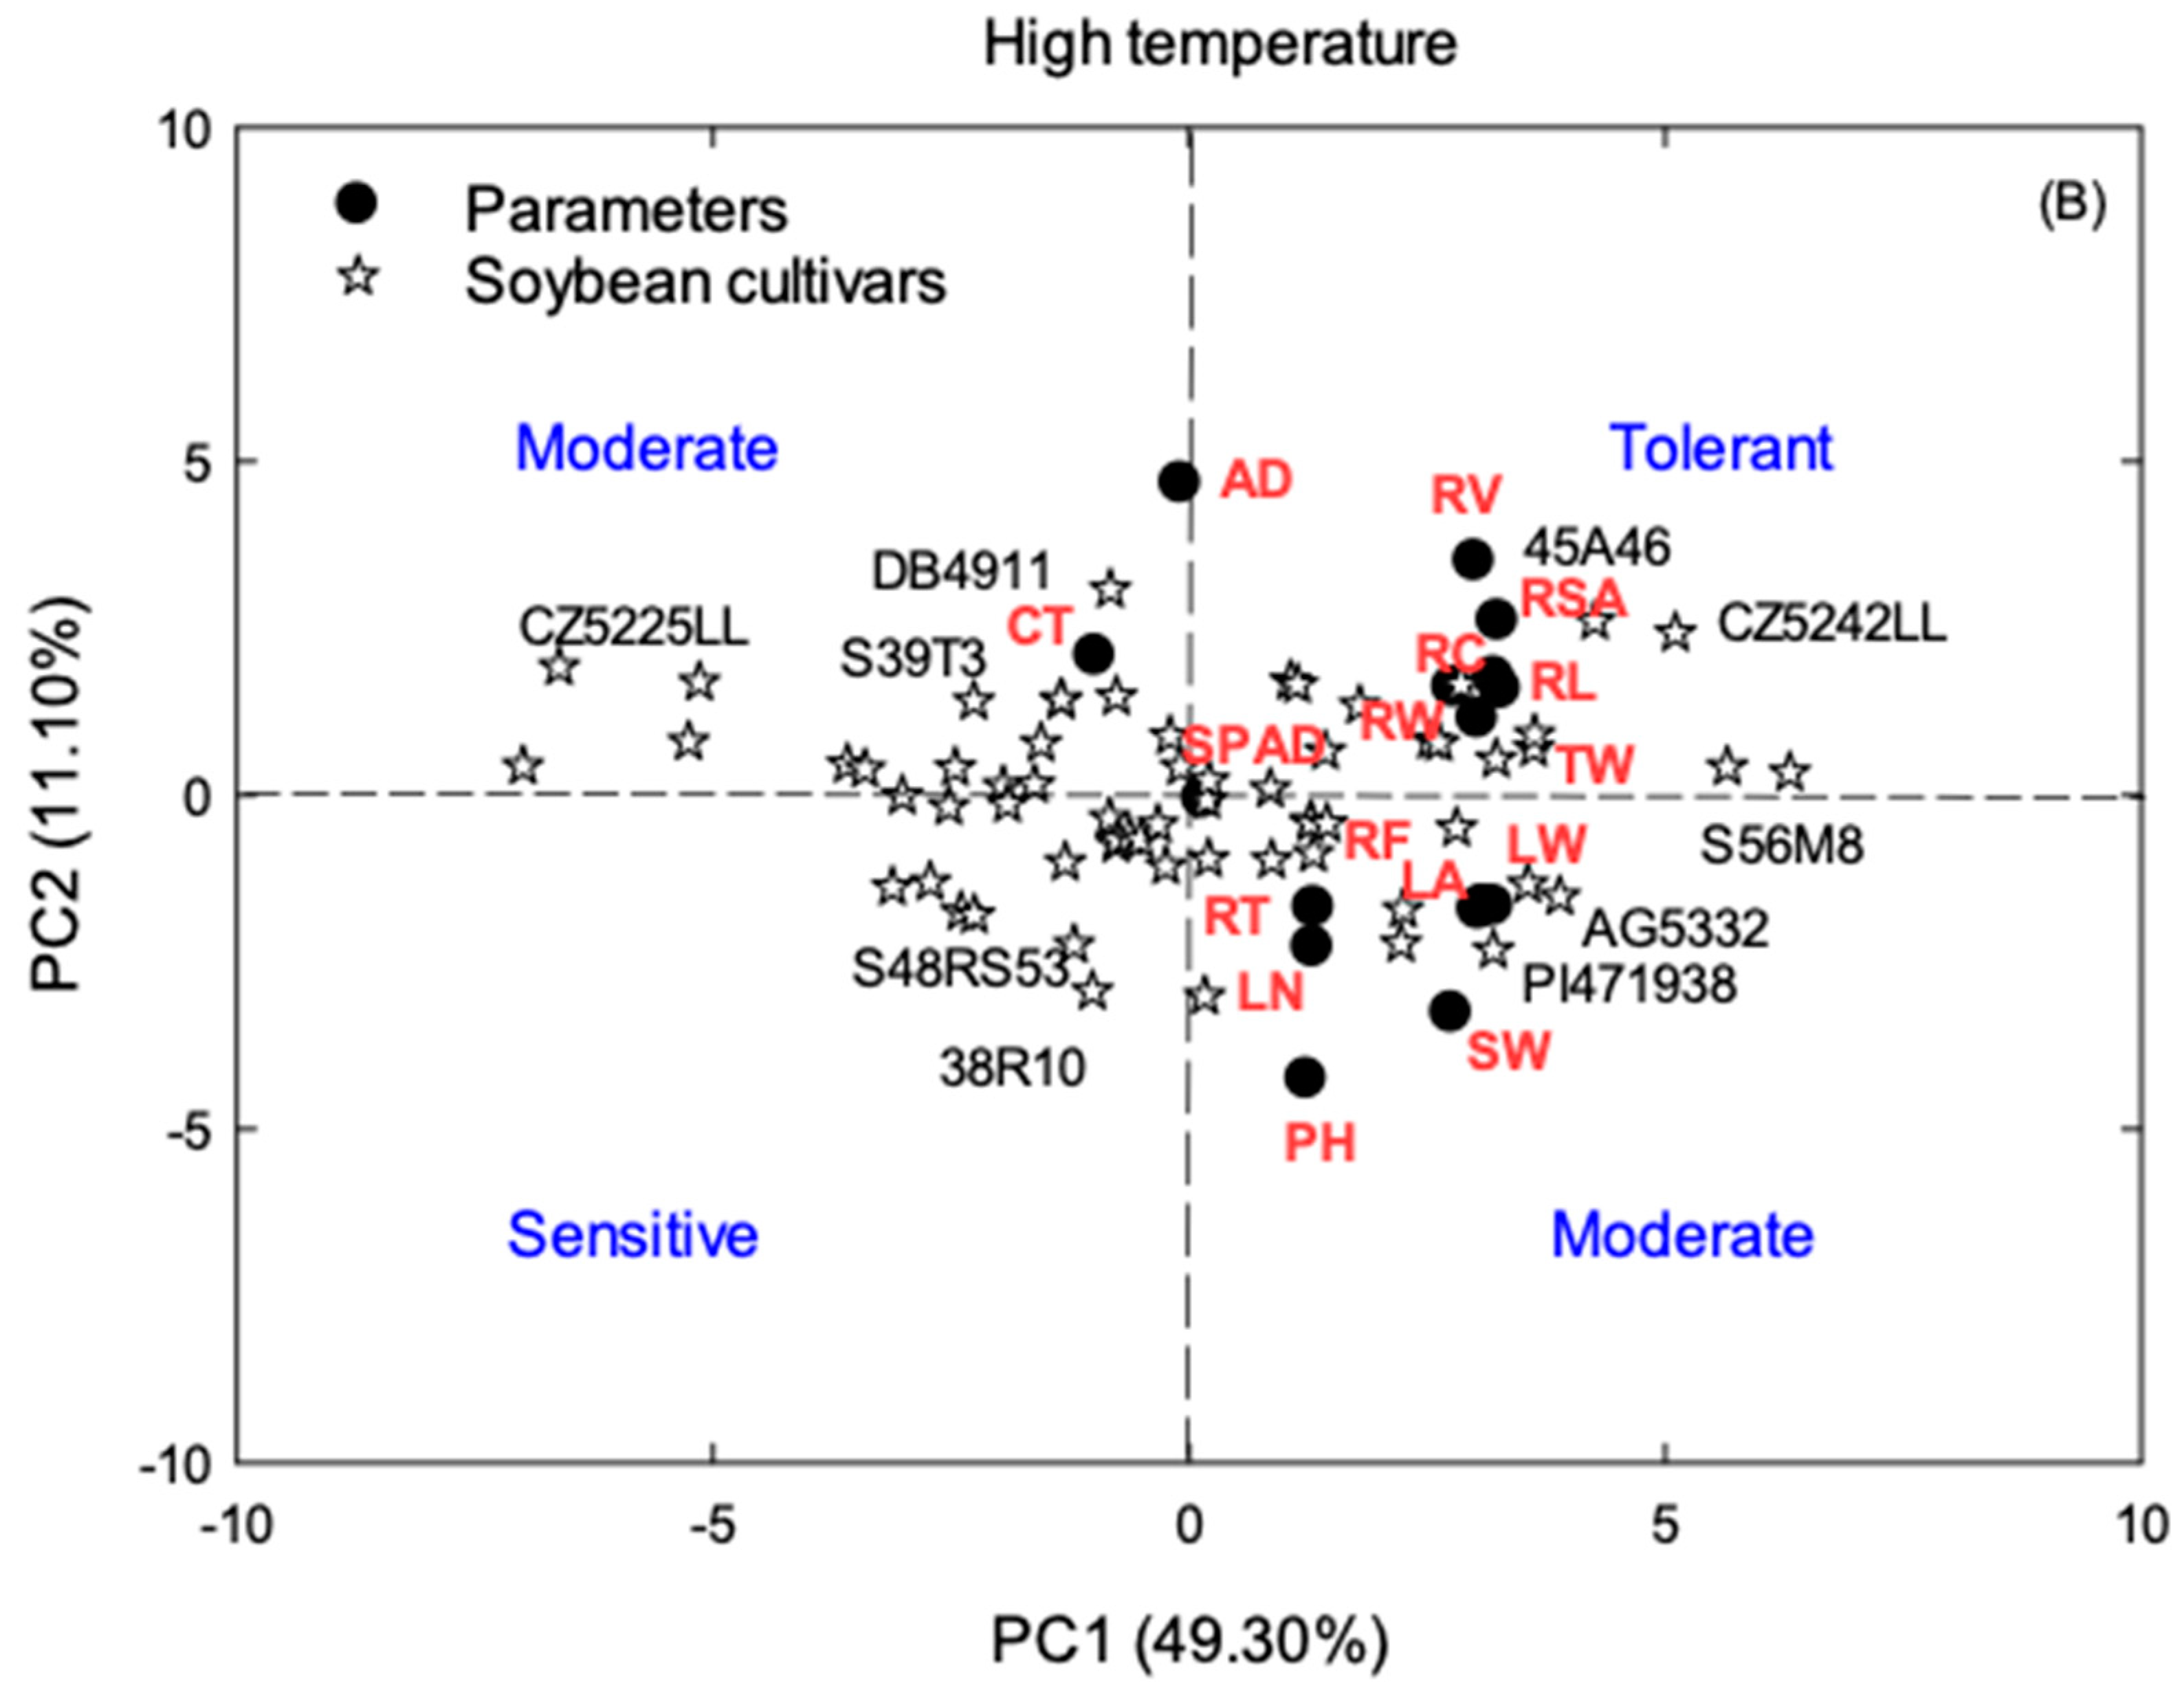
3.3. Principal Component Analysis (PCA)
4. Discussion
5. Conclusions
Supplementary Materials
Author Contributions
Funding
Acknowledgments
Conflicts of Interest
Abbreviations
| CSPS | conventional soybean production system |
| CLTRI | cumulative stress response indices for low temperature |
| CHTRI | cumulative stress response indices for high temperature |
| CT | canopy temperatures |
| CRL | cumulative root length |
| DAS | days after sowing |
| ESPS | early soybean production system |
| HT | high temperature |
| ILTRI | individual stress response index for low temperature |
| IHTRI | individual stress response index for high temperature |
| LA | leaf area |
| LW | leaf weight |
| NN | mainstem node number |
| LT | low temperature |
| MG | maturity group |
| PH | plant height |
| RAD | root average diameter |
| RNC | number of root crossings |
| RF | number of root forks |
| RSA | root surface area |
| CT | canopy temperature |
| RNT | number of root tips |
| R/S | root and shoot ratio |
| RV | root volume |
| RW | root weight |
| SW | stem weight |
| RNT | number of root tips |
| TW | total weights |
| TT | temperature treatments |
References
- Hoeft, R.G.; Aldrich, S.R.; Nafziger, E.D.; Johnson, R.R. Modern Corn and Soybean Production, 1st ed.; MCSP Publications: Champaign, IL, USA, 2000. [Google Scholar]
- Heatherly, L.G. Midsouthern USA soybean yield affected by maturity group and planting date. Crop Manag. 2005, 4. [Google Scholar] [CrossRef]
- Khaled, O.; Washington, E.; Lage, P.; Kantartzi, S.K.; Lightfoot, D.A.; Kassem, M.A. Comparison of early and conventional soybean production systems for yield and other agronomic traits. Atlas J. Plant Biol. 2011, 1, 1–5. [Google Scholar]
- Ashlock, L.O.; Klerk, R.; Huitink, G.; Keisling, T.; Vories, E.D. Planting Practices. Arkansas Soybean Handbook MPV 197; University Arkansas Cooperative Extension Service: Little Rock, AR, USA, 2000; pp. 35–49. [Google Scholar]
- Heatherly, L.G.; Hodges, H.F. Early soybean production system (ESPS). In Soybean Production in the Midsouth; Heatherly, L.G., Hodges, H., Eds.; CRC Press: Boca Raton, FL, USA, 1999; pp. 103–118. [Google Scholar]
- Vertucci, C.W.; Leopold, A.C. Dynamics of imbibition by soybean embryos. Plant Physiol. 1983, 72, 190–193. [Google Scholar] [CrossRef] [PubMed]
- Duke, S.H.; Schrader, L.E.; Miller, M.G. Low temperature effects on soybean (Glycine max L. Merr. cv. Wells) mitochondrial respiration and several dehydrogenases during imbibition and germination. Plant Physiol. 1977, 60, 716–722. [Google Scholar] [CrossRef] [PubMed]
- Hatfield, J.L.; Egli, D.B. Effect of temperature on the rate of soybean hypocotyl elongation and field emergence. Crop Sci. 1974, 14, 423–426. [Google Scholar] [CrossRef]
- Skrudlik, G.; Kościelniak, J. Effects of low temperature treatment at seedling stage on soybean growth, development and final yield. J. Agron. Crop Sci. 1996, 176, 111–117. [Google Scholar] [CrossRef]
- Tacarindua, C.R.P.; Shiraiwa, T.; Homma, K.; Kumagai, E.; Sameshima, R. The effects of increased temperature on crop growth and yield of soybean grown in a temperature gradient chamber. Field Crops Res. 2013, 154, 74–81. [Google Scholar] [CrossRef]
- Hatfield, J.L.; Prueger, J.H. Temperature extremes: Effect on plant growth and development. Weather Clim. Extrem. 2015, 10, 4–10. [Google Scholar] [CrossRef] [Green Version]
- Egli, D.B.; Cornelius, P.L. A regional analysis of the response of soybean yield to planting date. Agron. J. 2009, 101, 330–335. [Google Scholar] [CrossRef]
- Thuzar, M.; Puteh, A.B.; Abdullah, N.A.P.; Lassim, M.B.M.; Jusoff, K. The effects of temperature stress on the quality and yield of soya bean (Glycine max L.) Merrill. J. Agric. Sci. 2010, 2, 172–179. [Google Scholar]
- Heatherly, L.G.; Blaine, A.; Hodges, H.F.; Wesley, R.A.; Buehring, N.; Heatherly, L.G. Variety selection, planting date, row spacing, and seeding rate. In Soybean Production in the Midsouth; Heatherly, L.G., Hodges, H., Eds.; CRC Press: Boca Raton, FL, USA, 1999; pp. 41–47. [Google Scholar]
- Setiyono, T.D.; Weiss, A.; Specht, J.; Bastidas, A.M.; Cassman, K.G.; Dobermann, A. Understanding and modeling the effect of temperature and daylength on soybean phenology under high-yield conditions. Field Crops Res. 2007, 100, 257–271. [Google Scholar] [CrossRef] [Green Version]
- George, T.; Bartholomew, D.P.; Singleton, P.W. Effect of temperature and maturity group on phenology of field grown nodulating and nonnodulating soybean isolines. Biotronics 1990, 19, 49–59. [Google Scholar]
- Heatherly, L.G.; Elmore, R.W. Managing inputs for peak production. In Soybeans: Improvement, Production, and Uses, Agronomy Monograph; Boerma, H.R., Specht, J.E., Eds.; American Society of Agronomy, Crop Science Society of America and Soil Science Society of America: Madison, WI, USA, 2004; pp. 451–536. [Google Scholar]
- Salmerón, M.; Gbur, E.E.; Bourland, F.M.; Earnest, L.; Golden, B.R.; Purcell, L.C. Soybean maturity group choices for maximizing radiation interception across planting dates in the Midsouth United States. Agron. J. 2015, 107, 2132–2142. [Google Scholar] [CrossRef]
- Salmeron, M.; Gbur, E.E.; Bourland, F.M.; Buehring, N.W.; Earnest, L.; Fritschi, F.B.; Golden, B.R.; Hathcoat, D.; Lofton, J.; Miller, T.D. Soybean maturity group choices for early and late plantings in the Midsouth. Agron. J. 2014, 106, 1893–1901. [Google Scholar] [CrossRef]
- Bruns, H.A. Planting date, rate, and twin-row vs. single-row soybean in the Mid-South. Agron. J. 2011, 103, 1308–1313. [Google Scholar] [CrossRef]
- Grichar, W.J.; Biles, S.P. Response of soybean to early-season planting dates along the upper Texas Gulf Coast. Int. J. Agron. 2014, 4, 190–195. [Google Scholar] [CrossRef]
- Singh, B.; Reddy, K.R.; Redoña, E.D.; Walker, T. Developing a screening tool for osmotic stress tolerance classification of rice cultivars based on in vitro seed germination. Crop Sci. 2017, 57, 387–394. [Google Scholar] [CrossRef]
- Singh, B.; Reddy, K.R.; Redoña, E.D.; Walker, T. Screening of rice cultivars for morpho-physiological responses to early-season soil moisture stress. Rice Sci. 2017, 24, 322–335. [Google Scholar] [CrossRef]
- Cober, E.R.; Curtis, D.F.; Stewart, D.W.; Morrison, M.J. Quantifying the effects of photoperiod, temperature and daily irradiance on flowering time of soybean isolines. Plants 2014, 3, 476–497. [Google Scholar] [CrossRef]
- Kurosaki, H.; Yumoto, S. Effects of low temperature and shading during flowering on the yield components in soybeans. Plant Prod. Sci. 2003, 6, 17–23. [Google Scholar] [CrossRef]
- EWuebker, F.; Mullen, R.E.; Koehler, K. Flooding and temperature effects on soybean germination. Crop Sci. 2001, 41, 1857–1861. [Google Scholar] [CrossRef]
- Singh, B.; Norvell, E.; Wijewardana, C.; Wallace, T.; Chastain, D.; Reddy, K.R. Assessing morphological characteristics of elite cotton lines from different breeding programmes for low temperature and drought tolerance. J. Agron. Crop Sci. 2018, 204, 467–476. [Google Scholar] [CrossRef]
- Wijewardana, C.; Hock, M.; Henry, B.; Reddy, K.R. Screening corn hybrids for cold tolerance using morphological traits for early-season seeding. Crop Sci. 2015, 55, 851–867. [Google Scholar] [CrossRef]
- Khan, M.A.; Gemenet, D.C.; Villordon, A. Root system architecture and abiotic stress tolerance: Current knowledge in root and tuber crops. Front. Plant Sci. 2016, 7, 1584. [Google Scholar] [CrossRef] [PubMed]
- Reddy, K.R.; Brand, D.; Wijewardana, C.; Gao, W. Temperature effects on cotton seedling emergence, growth, and development. Agron. J. 2017, 109, 1287–1379. [Google Scholar] [CrossRef]
- Brand, D.; Wijewardana, C.; Gao, W.; Reddy, K.R. Interactive effects of carbon dioxide, low temperature, and ultraviolet-B radiation on cotton seedling root and shoot morphology and growth. Front. Earth Sci. 2016, 10, 607–620. [Google Scholar] [CrossRef]
- Reddy, K.R.; Read, J.J.; Baker, J.T.; McKinion, J.M.; Tarpley, L.; Hodges, H.F.; Reddy, V.R. Soil-Plant-Atmosphere-Research (SPAR) facility: A tool for plant research and modeling. Biotronics 2001, 30, 27–50. [Google Scholar]
- Koti, S.; Reddy, K.R.; Reddy, V.R.; Kakani, V.G.; Zhao, D. Interactive effects of carbon dioxide, temperature, and ultraviolet-B radiation on soybean (Glycine max L.) flower and pollen morphology, pollen production, germination, and tube lengths. J. Exp. Bot. 2004, 56, 725–736. [Google Scholar] [CrossRef]
- Edwards, J.T.; Purcell, L.C. Soybean yield and biomass responses to increasing plant population among diverse maturity groups. Crop Sci. 2005, 45, 1770–1777. [Google Scholar] [CrossRef]
- Wegerer, R.; Popp, M.; Hu, X.; Purcell, L. Soybean maturity group selection: Irrigation and nitrogen fixation effects on returns. Field Crops Res. 2015, 180, 1–9. [Google Scholar] [CrossRef]
- Salmerón, M.; Gbur, E.E.; Bourland, F.M.; Buehring, N.W.; Earnest, L.; Fritschi, F.B.; Golden, B.R.; Hathcoat, D.; Lofton, J.; McClure, A.T. Yield response to planting date among soybean maturity groups for irrigated production in the US Midsouth. Crop Sci. 2016, 56, 747–759. [Google Scholar] [CrossRef]
- Anderson, J.M.; Chow, W.S.; Park, Y.-I. The grand design of photosynthesis: Acclimation of the photosynthetic apparatus to environmental cues. Photosynth. Res. 1995, 46, 129–139. [Google Scholar] [CrossRef] [PubMed]
- Fuchs, M. Infrared measurement of canopy temperature and detection of plant water stress. Theor. Appl. Climatol. 1990, 42, 253–261. [Google Scholar] [CrossRef]
- Bolger, T.P.; Upchurch, D.R.; McMichael, B.L. Temperature effects on cotton root hydraulic conductance. Environ. Exp. Bot. 1992, 32, 49–54. [Google Scholar] [CrossRef]

| Company | Cultivar | MG | Plant Height, cm | Mainstem Nodes, no. plant−1 | Leaf Area, cm2 | Leaf Weight, g | Stem Weight, g | Total Plant Weight, g | Chlorophyll Content as SPAD Units | Canopy Temperature, °C | ||||||||||||||||
|---|---|---|---|---|---|---|---|---|---|---|---|---|---|---|---|---|---|---|---|---|---|---|---|---|---|---|
| LT | OT | HT | LT | OT | HT | LT | OT | HT | LT | OT | HT | LT | OT | HT | LT | OT | HT | LT | OT | HT | LT | OT | HT | |||
| Dyna-Gro Seed | 32y39 | III | 5 | 13 | 15 | 1 | 3 | 4 | 26 | 206 | 232 | 0.13 | 0.82 | 0.81 | 0.04 | 0.37 | 0.44 | 0.22 | 1.44 | 1.48 | 25 | 37 | 41 | 25 | 30 | 34 |
| Mycogen Seeds | 5N393R2 | III | 4 | 12 | 12 | 1 | 3 | 5 | 46 | 227 | 316 | 0.19 | 0.81 | 1.04 | 0.04 | 0.28 | 0.38 | 0.34 | 1.32 | 1.72 | 29 | 37 | 43 | 25 | 30 | 36 |
| Syngenta United States | S39-T3 | III | 4 | 10 | 11 | 1 | 3 | 5 | 26 | 215 | 260 | 0.11 | 0.83 | 0.89 | 0.03 | 0.31 | 0.36 | 0.18 | 1.41 | 1.53 | 31 | 40 | 45 | 25 | 29 | 35 |
| Syngenta United States | S39-C4 | III | 4 | 11 | 11 | 1 | 3 | 4 | 29 | 257 | 263 | 0.11 | 1.00 | 0.97 | 0.02 | 0.36 | 0.35 | 0.19 | 1.73 | 1.65 | 29 | 40 | 47 | 26 | 31 | 36 |
| REV Brand Seeds | 38 R10 | III | 4 | 12 | 13 | 1 | 4 | 4 | 43 | 290 | 230 | 0.19 | 1.19 | 0.89 | 0.05 | 0.43 | 0.36 | 0.33 | 2.04 | 1.53 | 28 | 37 | 43 | 25 | 31 | 35 |
| Mean | III | 4 | 11 | 12 | 1 | 3 | 4 | 34 | 239 | 26 | 0.15 | 0.93 | 0.92 | 0.04 | 0.35 | 0.38 | 0.25 | 1.59 | 1.58 | 28 | 38 | 44 | 25 | 30 | 35 | |
| Go Soy Genetics Optimized | IREANE | IV | 5 | 15 | 14 | 1 | 4 | 5 | 40 | 265 | 302 | 0.18 | 0.88 | 1.04 | 0.03 | 0.37 | 0.44 | 0.29 | 1.54 | 1.86 | 24 | 34 | 40 | 24 | 30 | 35 |
| Go Soy Genetics Optimized | 483.C | IV | 5 | 17 | 18 | 1 | 4 | 5 | 60 | 286 | 266 | 0.32 | 0.96 | 1.16 | 0.06 | 0.43 | 0.48 | 0.49 | 1.78 | 1.90 | 26 | 33 | 42 | 25 | 32 | 35 |
| UniSouth Genetics Inc. | ELLIS | IV | 5 | 13 | 15 | 1 | 4 | 4 | 33 | 237 | 277 | 0.15 | 0.91 | 0.96 | 0.04 | 0.35 | 0.40 | 0.25 | 1.54 | 1.65 | 26 | 36 | 39 | 25 | 31 | 34 |
| REV Brand Seeds | 48L63 | IV | 4 | 12 | 14 | 1 | 3 | 5 | 29 | 209 | 231 | 0.11 | 0.85 | 0.88 | 0.04 | 0.35 | 0.43 | 0.21 | 1.46 | 1.59 | 27 | 35 | 44 | 26 | 30 | 34 |
| Delta Grow Seeds Com. Inc. | DG 4781LL | IV | 5 | 14 | 16 | 1 | 4 | 4 | 38 | 265 | 228 | 0.18 | 0.93 | 0.70 | 0.05 | 0.40 | 0.38 | 0.31 | 1.60 | 1.35 | 26 | 34 | 40 | 25 | 29 | 38 |
| Go Soy Genetics Optimized | 4714LL | IV | 5 | 13 | 16 | 1 | 4 | 4 | 43 | 273 | 251 | 0.15 | 1.04 | 0.86 | 0.04 | 0.43 | 0.41 | 0.29 | 1.79 | 1.61 | 26 | 33 | 39 | 25 | 28 | 34 |
| Progeny Ag Products | P 4247LL | IV | 5 | 11 | 12 | 1 | 3 | 5 | 44 | 284 | 327 | 0.16 | 0.98 | 1.15 | 0.03 | 0.40 | 0.46 | 0.28 | 1.79 | 2.07 | 27 | 37 | 41 | 25 | 30 | 35 |
| Bayer Credenz | CZ 4044 LL | IV | 5 | 13 | 15 | 1 | 4 | 5 | 30 | 257 | 360 | 0.16 | 0.96 | 1.15 | 0.03 | 0.39 | 0.51 | 0.23 | 1.63 | 2.01 | 27 | 38 | 43 | 25 | 29 | 35 |
| Dyna-Gro Seeds | S49LL34 | IV | 4 | 14 | 16 | 1 | 3 | 5 | 42 | 245 | 259 | 0.34 | 0.79 | 0.85 | 0.04 | 0.34 | 0.36 | 0.47 | 1.41 | 1.48 | 26 | 35 | 40 | 25 | 28 | 35 |
| DuPont Pioneer | P41T33R | IV | 5 | 11 | 10 | 1 | 4 | 4 | 40 | 278 | 218 | 0.15 | 1.10 | 0.80 | 0.02 | 0.40 | 0.33 | 0.24 | 1.84 | 1.46 | 28 | 37 | 40 | 26 | 31 | 35 |
| Delta Grow Seeds Com. Inc. | DG 4680RR2 | IV | 5 | 12 | 13 | 1 | 3 | 4 | 40 | 258 | 235 | 0.22 | 1.05 | 0.93 | 0.03 | 0.42 | 0.39 | 0.32 | 1.82 | 1.62 | 27 | 36 | 42 | 26 | 31 | 35 |
| REV Brand Seeds | 45A46 | IV | 6 | 12 | 15 | 1 | 3 | 5 | 29 | 174 | 340 | 0.14 | 0.63 | 1.23 | 0.04 | 0.24 | 0.49 | 0.25 | 1.09 | 2.05 | 24 | 35 | 43 | 25 | 29 | 33 |
| Mycogen Seeds | 5N424R2 | IV | 5 | 11 | 11 | 1 | 4 | 4 | 28 | 274 | 281 | 0.13 | 0.94 | 0.89 | 0.04 | 0.37 | 0.37 | 0.24 | 1.70 | 1.58 | 28 | 37 | 41 | 25 | 31 | 35 |
| Dyna-Gro Seed | 31RY45 | IV | 4 | 11 | 12 | 1 | 4 | 4 | 27 | 282 | 285 | 0.15 | 1.18 | 1.03 | 0.04 | 0.48 | 0.48 | 0.27 | 2.10 | 1.85 | 28 | 36 | 44 | 24 | 30 | 34 |
| AGSouth Genetics | GS45R216 | IV | 5 | 13 | 14 | 1 | 4 | 4 | 41 | 242 | 248 | 0.24 | 0.85 | 0.79 | 0.02 | 0.36 | 0.40 | 0.35 | 1.53 | 1.49 | 28 | 36 | 42 | 25 | 30 | 36 |
| Asgrow | AG4632 | IV | 4 | 12 | 13 | 1 | 4 | 4 | 37 | 279 | 287 | 0.13 | 1.14 | 1.01 | 0.03 | 0.43 | 0.47 | 0.23 | 1.97 | 1.80 | 28 | 38 | 44 | 26 | 29 | 34 |
| Progeny Ag Products | P 4588RY | IV | 5 | 14 | 13 | 1 | 4 | 4 | 28 | 340 | 237 | 0.15 | 0.92 | 0.68 | 0.03 | 0.36 | 0.26 | 0.23 | 1.55 | 1.19 | 28 | 35 | 40 | 24 | 30 | 36 |
| Syngenta United States | S45-W9 | IV | 4 | 10 | 11 | 1 | 3 | 4 | 28 | 303 | 157 | 0.08 | 0.71 | 0.62 | 0.03 | 0.28 | 0.20 | 0.15 | 1.26 | 1.03 | 29 | 39 | 39 | 25 | 30 | 33 |
| Bayer Credenz | CZ 4181 RY | IV | 5 | 11 | 12 | 1 | 3 | 4 | 40 | 238 | 350 | 0.21 | 0.80 | 1.32 | 0.04 | 0.36 | 0.53 | 0.31 | 1.42 | 2.27 | 26 | 36 | 42 | 26 | 31 | 34 |
| Delta Grow Seed Com. Inc. | DG 825RR2/STS | IV | 5 | 12 | 12 | 1 | 4 | 4 | 46 | 278 | 225 | 0.26 | 1.10 | 0.88 | 0.06 | 0.48 | 0.37 | 0.41 | 1.93 | 1.54 | 29 | 40 | 45 | 24 | 27 | 36 |
| DuPont Pioneer | P47T36R | IV | 5 | 12 | 11 | 1 | 3 | 4 | 37 | 192 | 187 | 0.10 | 0.80 | 0.69 | 0.04 | 0.32 | 0.31 | 0.21 | 1.39 | 1.24 | 28 | 36 | 41 | 25 | 29 | 36 |
| Syngenta United States | S47-K5 | IV | 5 | 11 | 10 | 1 | 3 | 4 | 31 | 234 | 158 | 0.08 | 0.88 | 0.57 | 0.03 | 0.33 | 0.25 | 0.15 | 1.51 | 1.05 | 26 | 39 | 44 | 24 | 29 | 35 |
| AGSouth Genetics | GS47R216 | IV | 6 | 15 | 15 | 1 | 4 | 5 | 36 | 310 | 313 | 0.06 | 1.08 | 0.93 | 0.04 | 0.48 | 0.44 | 0.20 | 1.92 | 1.73 | 26 | 38 | 40 | 25 | 30 | 34 |
| Armor Seeds | 47-R70 (AR4705) | IV | 4 | 13 | 12 | 1 | 3 | 4 | 42 | 268 | 308 | 0.22 | 0.98 | 1.01 | 0.03 | 0.41 | 0.48 | 0.34 | 1.72 | 1.84 | 27 | 38 | 43 | 25 | 30 | 34 |
| Mycogen Seed | 5N490R2 | IV | 4 | 13 | 13 | 1 | 3 | 5 | 37 | 230 | 263 | 0.17 | 0.80 | 0.88 | 0.04 | 0.40 | 0.43 | 0.28 | 1.48 | 1.61 | 29 | 37 | 42 | 25 | 30 | 35 |
| REV Brand Seeds | 48A26 | IV | 5 | 13 | 15 | 1 | 4 | 5 | 37 | 217 | 311 | 0.20 | 0.86 | 1.14 | 0.04 | 0.38 | 0.50 | 0.32 | 1.58 | 1.98 | 26 | 36 | 44 | 25 | 30 | 36 |
| Progeny Ag Products | P 4757RY | IV | 6 | 12 | 13 | 1 | 3 | 4 | 29 | 249 | 254 | 0.15 | 2.69 | 0.79 | 0.03 | 0.38 | 0.38 | 0.23 | 3.44 | 1.48 | 28 | 37 | 40 | 24 | 29 | 36 |
| Dyna-Gro seeds | S48RS53 | IV | 5 | 15 | 13 | 1 | 4 | 4 | 41 | 285 | 259 | 0.24 | 1.10 | 0.91 | 0.04 | 0.47 | 0.43 | 0.39 | 1.92 | 1.62 | 31 | 40 | 46 | 26 | 30 | 35 |
| Go Soy Genetics Optimized | 4814GTS | IV | 4 | 11 | 11 | 1 | 4 | 4 | 35 | 331 | 247 | 0.21 | 0.81 | 0.80 | 0.03 | 0.34 | 0.31 | 0.31 | 1.44 | 1.35 | 27 | 37 | 42 | 25 | 30 | 35 |
| Croplan WinField United | R2C4775 | IV | 4 | 11 | 12 | 1 | 3 | 4 | 30 | 239 | 251 | 0.19 | 1.04 | 1.00 | 0.02 | 0.40 | 0.39 | 0.28 | 1.77 | 1.78 | 28 | 35 | 41 | 25 | 30 | 35 |
| Bayer Credenz | CZ 4898 RY | IV | 5 | 12 | 13 | 1 | 3 | 4 | 33 | 240 | 266 | 0.19 | 0.78 | 0.91 | 0.03 | 0.37 | 0.39 | 0.27 | 1.43 | 1.60 | 23 | 34 | 40 | 25 | 30 | 36 |
| Dixie Belle | DB 4911 | IV | 5 | 15 | 14 | 1 | 4 | 4 | 30 | 294 | 271 | 0.10 | 1.16 | 1.00 | 0.02 | 0.36 | 0.33 | 0.18 | 1.83 | 1.64 | 26 | 39 | 44 | 25 | 30 | 35 |
| Great Heart Seed Co. | GT-476CR2 | IV | 4 | 12 | 12 | 1 | 4 | 4 | 40 | 321 | 246 | 0.14 | 1.18 | 0.96 | 0.03 | 0.52 | 0.36 | 0.26 | 2.11 | 1.57 | 29 | 28 | 41 | 25 | 31 | 37 |
| NC State University | PI 471938 | IV | 4 | 15 | 15 | 1 | 4 | 5 | 38 | 364 | 330 | 0.24 | 1.25 | 1.10 | 0.04 | 0.55 | 0.53 | 0.34 | 2.14 | 1.96 | 29 | 40 | 42 | 25 | 30 | 32 |
| University of Missouri | R01-416F | IV | 5 | 12 | 12 | 1 | 4 | 4 | 47 | 287 | 254 | 0.19 | 1.17 | 0.96 | 0.05 | 0.47 | 0.38 | 0.30 | 2.01 | 1.60 | 26 | 41 | 45 | 24 | 31 | 35 |
| Mean | IV | 5 | 13 | 13 | 1 | 4 | 4 | 37 | 266 | 265 | 0.17 | 1.01 | 0.93 | 0.04 | 0.39 | 0.40 | 0.28 | 1.73 | 1.64 | 27 | 36 | 42 | 25 | 30 | 35 | |
| Asgrow | AG5332 | V | 5 | 11 | 11 | 1 | 3 | 4 | 39 | 254 | 271 | 0.16 | 0.87 | 0.89 | 0.04 | 0.35 | 0.33 | 0.33 | 1.50 | 1.53 | 30 | 40 | 43 | 25 | 31 | 35 |
| Progeny | P5333 RY | V | 4 | 14 | 14 | 1 | 4 | 4 | 37 | 305 | 317 | 0.16 | 1.20 | 1.16 | 0.04 | 0.48 | 0.56 | 0.27 | 2.08 | 2.06 | 24 | 36 | 38 | 26 | 31 | 34 |
| USDA-ARS | JTN-5110 | V | 4 | 12 | 12 | 1 | 4 | 4 | 35 | 352 | 337 | 0.17 | 1.57 | 1.26 | 0.05 | 0.66 | 0.43 | 0.30 | 2.69 | 2.09 | 27 | 38 | 42 | 25 | 29 | 34 |
| Go Soy Genetics Optimized | LELAND | V | 5 | 14 | 14 | 1 | 4 | 4 | 32 | 283 | 258 | 0.17 | 1.02 | 0.88 | 0.02 | 0.39 | 0.38 | 0.26 | 1.69 | 1.53 | 24 | 38 | 44 | 25 | 30 | 34 |
| Delta Grow Seeds Co Inc | DG5067LL | V | 4 | 11 | 13 | 1 | 3 | 5 | 40 | 225 | 311 | 0.20 | 0.96 | 1.09 | 0.05 | 0.31 | 0.44 | 0.35 | 1.57 | 1.84 | 28 | 38 | 45 | 25 | 30 | 35 |
| Go Soy Genetics Optimized | 5115LL | V | 5 | 11 | 12 | 1 | 3 | 4 | 49 | 276 | 209 | 0.26 | 1.01 | 0.70 | 0.05 | 0.37 | 0.30 | 0.40 | 1.77 | 1.19 | 26 | 35 | 39 | 25 | 29 | 36 |
| Dyna-Gro Seed | S55LS75 | V | 5 | 14 | 15 | 1 | 3 | 5 | 34 | 248 | 282 | 0.16 | 1.03 | 0.87 | 0.03 | 0.47 | 0.48 | 0.25 | 1.78 | 1.71 | 25 | 35 | 39 | 24 | 29 | 35 |
| Bayer Credenz | CZ 5242 LL | V | 5 | 11 | 12 | 1 | 3 | 4 | 34 | 200 | 287 | 0.15 | 0.65 | 0.89 | 0.03 | 0.28 | 0.40 | 0.24 | 1.13 | 1.57 | 26 | 35 | 41 | 25 | 30 | 36 |
| Bayer Credenz | CZ 5225 LL | V | 5 | 15 | 15 | 1 | 4 | 4 | 27 | 218 | 269 | 0.15 | 0.78 | 0.82 | 0.03 | 0.39 | 0.42 | 0.22 | 1.41 | 1.50 | 28 | 36 | 40 | 26 | 30 | 35 |
| Delta Grow Seeds Com. Inc. | DG 5170RR2/STS | V | 5 | 11 | 13 | 1 | 4 | 4 | 38 | 339 | 299 | 0.19 | 1.33 | 1.09 | 0.04 | 0.46 | 0.44 | 0.30 | 2.14 | 1.87 | 29 | 38 | 43 | 25 | 29 | 34 |
| REV Brand Seeds | 51A56 | V | 5 | 12 | 13 | 1 | 4 | 4 | 47 | 239 | 280 | 0.20 | 0.96 | 0.97 | 0.05 | 0.35 | 0.46 | 0.32 | 1.60 | 1.69 | 27 | 35 | 38 | 25 | 29 | 34 |
| DuPont Pioneer | P52T50R | V | 4 | 13 | 13 | 1 | 4 | 4 | 39 | 290 | 276 | 0.12 | 1.12 | 1.03 | 0.03 | 0.41 | 0.44 | 0.23 | 1.84 | 1.78 | 24 | 37 | 43 | 25 | 30 | 35 |
| Syngenta United States | S55-Q3 | V | 5 | 14 | 15 | 1 | 4 | 4 | 47 | 231 | 273 | 0.18 | 0.77 | 0.89 | 0.07 | 0.30 | 0.36 | 0.32 | 1.30 | 1.54 | 26 | 37 | 44 | 25 | 30 | 37 |
| Syngenta United States | S56-M8 | V | 5 | 14 | 13 | 1 | 3 | 4 | 39 | 198 | 201 | 0.10 | 0.66 | 0.66 | 0.03 | 0.19 | 0.26 | 0.17 | 1.05 | 1.15 | 24 | 36 | 44 | 25 | 29 | 36 |
| Go Soy Genetics Optimized | 5214GTS | V | 5 | 17 | 15 | 1 | 4 | 5 | 37 | 315 | 365 | 0.15 | 1.18 | 1.14 | 0.03 | 0.54 | 0.52 | 0.24 | 2.04 | 1.98 | 27 | 36 | 45 | 23 | 28 | 35 |
| Armor | 55-R68 | V | 4 | 14 | 13 | 1 | 4 | 4 | 36 | 307 | 330 | 0.17 | 1.18 | 0.95 | 0.05 | 0.47 | 0.44 | 0.28 | 1.99 | 1.70 | 24 | 33 | 39 | 24 | 31 | 36 |
| Progeny Ag Products | P 5226RYS | V | 4 | 12 | 13 | 1 | 4 | 5 | 45 | 322 | 280 | 0.25 | 1.07 | 0.98 | 0.03 | 0.42 | 0.40 | 0.37 | 1.84 | 1.63 | 26 | 36 | 42 | 25 | 30 | 35 |
| Mycogen Seeds | 5N523R2 | V | 4 | 12 | 12 | 1 | 3 | 4 | 32 | 277 | 231 | 0.17 | 1.03 | 0.92 | 0.02 | 0.39 | 0.36 | 0.28 | 1.77 | 1.59 | 29 | 38 | 42 | 25 | 29 | 35 |
| Dyna-Gro seed | S56RY84 | V | 5 | 16 | 15 | 1 | 4 | 5 | 51 | 306 | 322 | 0.25 | 1.04 | 1.02 | 0.05 | 0.51 | 0.48 | 0.41 | 1.89 | 1.87 | 24 | 35 | 38 | 25 | 29 | 35 |
| Croplan WinField United | R2C5225S | V | 4 | 12 | 12 | 1 | 3 | 5 | 41 | 335 | 282 | 0.26 | 1.16 | 1.03 | 0.03 | 0.51 | 0.46 | 0.38 | 2.04 | 1.84 | 27 | 37 | 40 | 25 | 29 | 33 |
| Bayer Credenz | CZ 5375 RY | V | 5 | 11 | 12 | 1 | 3 | 4 | 34 | 244 | 330 | 0.18 | 0.87 | 1.07 | 0.04 | 0.30 | 0.43 | 0.28 | 1.45 | 1.87 | 26 | 35 | 42 | 25 | 31 | 36 |
| REV Brand Seeds | 57R21 | V | 5 | 15 | 13 | 1 | 4 | 4 | 46 | 293 | 278 | 0.21 | 1.03 | 1.08 | 0.04 | 0.46 | 0.36 | 0.30 | 1.80 | 1.77 | 26 | 34 | 46 | 25 | 30 | 35 |
| Syngenta United States | S58-Z4 | V | 5 | 12 | 12 | 1 | 3 | 4 | 28 | 203 | 247 | 0.17 | 0.70 | 0.81 | 0.03 | 0.28 | 0.36 | 0.24 | 1.19 | 1.45 | 28 | 34 | 40 | 25 | 28 | 35 |
| Dyna-Gro Seed | S57RY26 | V | 6 | 14 | 15 | 1 | 4 | 4 | 43 | 303 | 350 | 0.22 | 1.12 | 1.20 | 0.03 | 0.47 | 0.47 | 0.35 | 1.94 | 2.02 | 27 | 36 | 45 | 25 | 31 | 34 |
| Mean | V | 13 | 13 | 1 | 4 | 4 | 39 | 274 | 287 | 0.18 | 1.01 | 0.98 | 0.04 | 0.41 | 0.42 | 0.30 | 1.73 | 1.70 | 26 | 36 | 42 | 25 | 30 | 35 | ||
| Mean | 5 | 13 | 13 | 1 | 4 | 4 | 37 | 267 | 273 | 0.18 | 1.00 | 0.95 | 0.04 | 0.40 | 0.41 | 0.29 | 1.72 | 1.66 | 27 | 36 | 42 | 25 | 30 | 35 | ||
| † ANOVA | ||||||||||||||||||||||||||
| MG | † *** | ns | *** | ns | ns | ns | *** | ns | ||||||||||||||||||
| CUL | † ns | *** | *** | ns | ns | ns | *** | *** | *** | *** | *** | ns | ns | *** | ns | *** | *** | ns | *** | *** | *** | ns | ns | ns | ||
| TT | *** | *** | *** | *** | *** | *** | *** | *** | ||||||||||||||||||
| LT | *** | *** | ns | *** | ns | ns | *** | *** | ||||||||||||||||||
| HT | *** | *** | *** | *** | *** | *** | *** | *** | ||||||||||||||||||
| MG × TT | ns | ns | *** | ns | ns | ns | *** | ns | ||||||||||||||||||
| CUL × TT | *** | ns | *** | *** | † * | *** | ns | ns | ||||||||||||||||||
| Company | Cultivar | MG | CRL, cm plant−1 | RSA, cm2 plant−1 | RAD, cm | RV, cm3 plant−1 | RNT, no. plant−1 | RNF, no. plant−1 | RNC, no. plant−1 | R/S | RW, g plant−1 | ||||||||||||||||||||
|---|---|---|---|---|---|---|---|---|---|---|---|---|---|---|---|---|---|---|---|---|---|---|---|---|---|---|---|---|---|---|---|
| LT | OT | HT | LT | OT | HT | LT | OT | HT | LT | OT | HT | LT | OT | HT | LT | OT | HT | LT | OT | HT | LT | OT | HT | LT | OT | HT | |||||
| Dyna-Gro Seed | 32y39 | III | 414 | 2251 | 1987 | 72 | 312 | 274 | 0.5 | 0.4 | 0.4 | 1.0 | 3.4 | 3.0 | 2189 | 3703 | 4220 | 1141 | 6706 | 6570 | 80 | 830 | 781 | 1.23 | 0.66 | 0.54 | 0.1 | 0.2 | 0.2 | ||
| Mycogen Seeds | 5N393R2 | III | 717 | 2026 | 2389 | 125 | 296 | 346 | 0.6 | 0.5 | 0.5 | 1.8 | 3.5 | 4.0 | 1371 | 4021 | 4998 | 1332 | 5871 | 8860 | 165 | 688 | 1082 | 2.58 | 0.84 | 0.80 | 0.1 | 0.2 | 0.3 | ||
| Syngenta United States | S39-T3 | III | 372 | 2340 | 2213 | 67 | 337 | 302 | 0.6 | 0.5 | 0.4 | 1.0 | 3.9 | 3.3 | 2028 | 6284 | 4782 | 659 | 7544 | 8507 | 65 | 801 | 1049 | 1.10 | 0.90 | 0.79 | 0.0 | 0.3 | 0.3 | ||
| Syngenta United States | S39-C4 | III | 560 | 2609 | 2407 | 98 | 403 | 341 | 0.6 | 0.5 | 0.5 | 1.4 | 5.0 | 3.8 | 1571 | 5994 | 5323 | 1108 | 9101 | 9813 | 126 | 966 | 1154 | 2.43 | 1.02 | 0.97 | 0.1 | 0.4 | 0.3 | ||
| REV Brand Seeds | 38 R10 | III | 743 | 3092 | 2384 | 117 | 465 | 333 | 0.5 | 0.5 | 0.4 | 1.5 | 5.6 | 3.7 | 1621 | 3768 | 4687 | 1485 | 11,861 | 9018 | 200 | 1373 | 1070 | 1.80 | 0.95 | 0.79 | 0.1 | 0.4 | 0.3 | ||
| Mean | III | 561 | 2464 | 2276 | 96 | 363 | 319 | 0.6 | 0.5 | 0.4 | 1.3 | 4.3 | 3.6 | 1756 | 4754 | 4802 | 1145 | 8217 | 8554 | 127 | 932 | 1027 | 1.8 | 0.9 | 0.8 | 0.1 | 0.3 | 0.3 | |||
| Go Soy Genetics Optimized | IREANE | IV | 644 | 2752 | 3090 | 102 | 356 | 435 | 0.5 | 0.4 | 0.4 | 1.3 | 3.7 | 4.9 | 1367 | 7271 | 7120 | 1414 | 9787 | 15,723 | 162 | 1189 | 1659 | 2.78 | 0.80 | 0.86 | 0.1 | 0.3 | 0.4 | ||
| Go Soy Genetics Optimized | 483.C | IV | 998 | 3558 | 2359 | 156 | 488 | 320 | 0.5 | 0.4 | 0.4 | 2.0 | 5.3 | 3.5 | 2756 | 5599 | 5694 | 2717 | 15,255 | 9192 | 290 | 1908 | 961 | 2.00 | 0.91 | 0.53 | 0.1 | 0.4 | 0.3 | ||
| UniSouth Genetics Inc. | ELLIS | IV | 679 | 2115 | 2938 | 100 | 277 | 382 | 0.5 | 0.4 | 0.4 | 1.2 | 3.0 | 4.0 | 1320 | 4358 | 5918 | 1229 | 7234 | 13,986 | 215 | 861 | 1641 | 1.64 | 0.78 | 0.73 | 0.1 | 0.3 | 0.3 | ||
| REV Brand Seeds | 48L63 | IV | 502 | 2188 | 2475 | 82 | 324 | 350 | 0.5 | 0.5 | 0.4 | 1.1 | 3.8 | 3.9 | 1405 | 3446 | 5861 | 918 | 7742 | 8929 | 107 | 846 | 1005 | 1.55 | 0.74 | 0.66 | 0.1 | 0.3 | 0.3 | ||
| Delta Grow Seeds Com. Inc. | DG 4781LL | IV | 754 | 2393 | 2606 | 133 | 331 | 360 | 0.6 | 0.4 | 0.4 | 1.9 | 3.6 | 4.0 | 1871 | 9450 | 6631 | 1379 | 7623 | 9744 | 180 | 814 | 1123 | 1.86 | 0.68 | 0.70 | 0.1 | 0.3 | 0.3 | ||
| Go Soy Genetics Optimized | 4714LL | IV | 742 | 2691 | 2565 | 122 | 390 | 362 | 0.5 | 0.5 | 0.5 | 1.7 | 4.5 | 4.1 | 2458 | 5725 | 5700 | 1667 | 9090 | 11,462 | 165 | 1010 | 1116 | 2.33 | 0.74 | 0.82 | 0.1 | 0.3 | 0.3 | ||
| Progeny Ag Products | P 4247LL | IV | 714 | 3333 | 3337 | 120 | 491 | 486 | 0.5 | 0.5 | 0.5 | 1.7 | 5.8 | 6.0 | 1346 | 5959 | 6628 | 1748 | 12,758 | 14,741 | 222 | 1406 | 1459 | 3.11 | 1.01 | 1.01 | 0.1 | 0.4 | 0.5 | ||
| Bayer Credenz | CZ 4044 LL | IV | 510 | 2873 | 2629 | 78 | 394 | 346 | 0.5 | 0.4 | 0.4 | 1.0 | 4.3 | 3.6 | 1481 | 4804 | 5072 | 1048 | 9815 | 10,136 | 135 | 1205 | 1321 | 1.33 | 0.73 | 0.69 | 0.0 | 0.3 | 0.4 | ||
| Dyna-Gro Seeds | S49LL34 | IV | 555 | 2238 | 2553 | 94 | 330 | 355 | 0.5 | 0.5 | 0.4 | 1.3 | 3.9 | 3.9 | 2240 | 3097 | 6125 | 1083 | 7387 | 9296 | 121 | 868 | 1053 | 2.55 | 0.82 | 0.74 | 0.1 | 0.3 | 0.3 | ||
| DuPont Pioneer | P41T33R | IV | 659 | 3186 | 2751 | 106 | 417 | 391 | 0.5 | 0.4 | 0.5 | 1.4 | 4.4 | 4.4 | 1407 | 5592 | 4015 | 1220 | 11,865 | 11,868 | 142 | 1598 | 1288 | 3.14 | 0.85 | 0.99 | 0.1 | 0.3 | 0.3 | ||
| Delta Grow Seeds Co Inc | DG 4680RR2 | IV | 639 | 2659 | 2361 | 102 | 380 | 306 | 0.5 | 0.5 | 0.4 | 1.3 | 4.3 | 3.2 | 1939 | 6207 | 5670 | 1586 | 9585 | 9512 | 188 | 1069 | 1150 | 2.63 | 0.86 | 0.77 | 0.1 | 0.4 | 0.3 | ||
| REV Brand Seeds | 45A46 | IV | 492 | 1887 | 2951 | 82 | 275 | 406 | 0.5 | 0.5 | 0.4 | 1.1 | 3.2 | 4.4 | 2478 | 4987 | 6708 | 1472 | 6456 | 12,079 | 113 | 593 | 1408 | 1.83 | 0.92 | 0.66 | 0.1 | 0.2 | 0.3 | ||
| Mycogen Seeds | 5N424R2 | IV | 642 | 3141 | 2335 | 99 | 420 | 327 | 0.5 | 0.4 | 0.4 | 1.2 | 4.5 | 3.6 | 1558 | 6653 | 5363 | 1282 | 10,741 | 9416 | 183 | 1396 | 1057 | 1.83 | 1.07 | 0.89 | 0.1 | 0.4 | 0.3 | ||
| Dyna-Gro Seed | 31RY45 | IV | 597 | 3474 | 3067 | 105 | 509 | 423 | 0.6 | 0.5 | 0.4 | 1.5 | 5.9 | 4.7 | 1553 | 7162 | 8533 | 1036 | 13,543 | 13,046 | 115 | 1541 | 1454 | 2.00 | 0.89 | 0.73 | 0.1 | 0.4 | 0.4 | ||
| AGSouth Genetics | GS45R216 | IV | 753 | 2895 | 2007 | 124 | 409 | 261 | 0.5 | 0.5 | 0.4 | 1.6 | 4.6 | 2.7 | 1483 | 6759 | 4221 | 2023 | 9841 | 8267 | 209 | 1126 | 1024 | 4.00 | 0.90 | 0.74 | 0.1 | 0.3 | 0.3 | ||
| Asgrow | AG4632 | IV | 564 | 2936 | 2264 | 95 | 440 | 314 | 0.5 | 0.5 | 0.4 | 1.3 | 5.3 | 3.5 | 1546 | 5053 | 4335 | 923 | 11,514 | 9375 | 107 | 1158 | 1044 | 1.90 | 0.95 | 0.66 | 0.1 | 0.4 | 0.3 | ||
| Progeny Ag Products | P 4588RY | IV | 480 | 2493 | 2273 | 81 | 317 | 309 | 0.5 | 0.4 | 0.4 | 1.1 | 3.2 | 3.3 | 1263 | 9315 | 7881 | 918 | 8437 | 8340 | 100 | 1026 | 930 | 2.00 | 0.73 | 0.92 | 0.1 | 0.3 | 0.2 | ||
| Syngenta United States | S45-W9 | IV | 393 | 2011 | 1561 | 72 | 281 | 216 | 0.6 | 0.4 | 0.4 | 1.0 | 3.1 | 2.4 | 1191 | 8656 | 4932 | 790 | 5721 | 5300 | 80 | 626 | 592 | 1.63 | 0.95 | 1.05 | 0.0 | 0.3 | 0.2 | ||
| Bayer Credenz | CZ 4181 RY | IV | 660 | 2221 | 3362 | 99 | 305 | 449 | 0.5 | 0.4 | 0.4 | 1.2 | 3.3 | 4.8 | 1696 | 5495 | 6228 | 1192 | 6991 | 16,099 | 204 | 881 | 1996 | 1.42 | 0.72 | 0.78 | 0.1 | 0.3 | 0.4 | ||
| Delta Grow Seed Com. Inc. | DG 4825RR2/STS | IV | 710 | 3250 | 2499 | 121 | 447 | 346 | 0.5 | 0.4 | 0.4 | 1.6 | 4.9 | 3.8 | 2894 | 6166 | 4988 | 1613 | 12,772 | 10,034 | 172 | 1513 | 1184 | 1.44 | 0.74 | 0.77 | 0.1 | 0.4 | 0.3 | ||
| DuPont Pioneer | P47T36R | IV | 631 | 2222 | 1859 | 109 | 311 | 257 | 0.6 | 0.4 | 0.4 | 1.5 | 3.5 | 2.8 | 2377 | 5081 | 4612 | 1530 | 7189 | 6342 | 139 | 845 | 678 | 1.92 | 0.86 | 0.76 | 0.1 | 0.3 | 0.2 | ||
| Syngenta United States | S47-K5 | IV | 444 | 2700 | 1716 | 69 | 371 | 245 | 0.5 | 0.4 | 0.5 | 0.9 | 4.1 | 2.8 | 1549 | 5477 | 4102 | 949 | 8912 | 5749 | 111 | 1144 | 659 | 1.75 | 0.94 | 0.96 | 0.0 | 0.3 | 0.2 | ||
| AGSouth Genetics | GS47R216 | IV | 748 | 2836 | 2521 | 122 | 417 | 352 | 0.5 | 0.5 | 0.4 | 1.6 | 4.9 | 3.9 | 1591 | 5252 | 5759 | 1380 | 10,628 | 9321 | 191 | 1182 | 1170 | 2.23 | 0.76 | 0.81 | 0.1 | 0.4 | 0.4 | ||
| Armor Seeds | 47-R70 (AR4705) | IV | 672 | 2689 | 2199 | 112 | 348 | 305 | 0.5 | 0.4 | 0.4 | 1.5 | 3.9 | 3.4 | 1640 | 7078 | 5881 | 1141 | 9556 | 8432 | 159 | 1263 | 826 | 2.60 | 0.79 | 0.73 | 0.1 | 0.3 | 0.4 | ||
| Mycogen Seed | 5N490R2 | IV | 651 | 2207 | 2348 | 101 | 296 | 288 | 0.5 | 0.4 | 0.4 | 1.3 | 3.2 | 2.8 | 2495 | 3797 | 6651 | 1157 | 6614 | 9039 | 137 | 861 | 1157 | 1.62 | 0.70 | 0.68 | 0.1 | 0.3 | 0.3 | ||
| REV Brand Seeds | 48A26 | IV | 591 | 2974 | 2869 | 94 | 424 | 399 | 0.5 | 0.5 | 0.4 | 1.2 | 4.8 | 4.4 | 1790 | 5246 | 6305 | 1259 | 10,112 | 12,486 | 149 | 1232 | 1385 | 1.77 | 0.88 | 0.69 | 0.1 | 0.3 | 0.3 | ||
| Progeny Ag Products | P 4757RY | IV | 512 | 2676 | 2384 | 77 | 361 | 312 | 0.5 | 0.4 | 0.4 | 0.9 | 3.9 | 3.3 | 2115 | 7402 | 5672 | 1073 | 9354 | 8884 | 112 | 1087 | 1048 | 1.50 | 0.99 | 0.79 | 0.1 | 0.4 | 0.3 | ||
| Dyna-Gro seeds | S48RS53 | IV | 762 | 2808 | 2013 | 131 | 381 | 289 | 0.6 | 0.4 | 0.4 | 1.8 | 4.1 | 2.6 | 1353 | 3518 | 4320 | 2169 | 10,220 | 7872 | 214 | 1335 | 970 | 2.54 | 0.74 | 0.65 | 0.1 | 0.3 | 0.3 | ||
| Go Soy Genetics Optimized | 4814GTS | IV | 482 | 2155 | 2413 | 86 | 313 | 306 | 0.6 | 0.5 | 0.4 | 1.2 | 3.6 | 3.1 | 1219 | 5046 | 6238 | 974 | 6611 | 8911 | 98 | 817 | 1194 | 2.44 | 0.85 | 0.77 | 0.1 | 0.3 | 0.2 | ||
| Croplan WinField United | R2C4775 | IV | 508 | 2769 | 2771 | 82 | 408 | 390 | 0.5 | 0.5 | 0.4 | 1.0 | 4.8 | 4.4 | 3047 | 4911 | 5292 | 1301 | 10,823 | 11,150 | 123 | 1143 | 1339 | 2.57 | 0.82 | 1.03 | 0.1 | 0.3 | 0.4 | ||
| Bayer Credenz | CZ 4898 RY | IV | 538 | 2256 | 2785 | 88 | 305 | 369 | 0.5 | 0.4 | 0.4 | 1.2 | 3.3 | 3.9 | 2052 | 4975 | 8320 | 1019 | 6800 | 11,555 | 107 | 863 | 1324 | 1.30 | 0.74 | 0.74 | 0.0 | 0.3 | 0.3 | ||
| Dixie Belle | DB 4911 | IV | 600 | 2828 | 3209 | 83 | 372 | 418 | 0.4 | 0.4 | 0.4 | 0.9 | 3.9 | 4.3 | 1387 | 6270 | 6249 | 1299 | 10,877 | 15,688 | 213 | 1404 | 1868 | 2.83 | 0.85 | 0.95 | 0.1 | 0.3 | 0.3 | ||
| Great Heart Seed Com. | GT-476CR2 | IV | 631 | 2637 | 2310 | 98 | 370 | 265 | 0.5 | 0.4 | 0.4 | 1.2 | 4.2 | 2.4 | 1362 | 4816 | 7214 | 1513 | 10,388 | 9250 | 179 | 1179 | 1156 | 3.22 | 0.77 | 0.73 | 0.1 | 0.4 | 0.3 | ||
| NC State University | PI 471938 | IV | 657 | 3505 | 2933 | 104 | 482 | 406 | 0.5 | 0.4 | 0.4 | 1.3 | 5.3 | 4.5 | 2756 | 6232 | 8144 | 1615 | 14,331 | 14,341 | 179 | 1714 | 1512 | 1.50 | 0.64 | 0.62 | 0.1 | 0.4 | 0.3 | ||
| University of Missouri | R01-416F | IV | 635 | 3828 | 3110 | 88 | 515 | 422 | 0.4 | 0.4 | 0.4 | 1.0 | 5.5 | 4.6 | 1879 | 5635 | 5029 | 1869 | 16,496 | 14,412 | 199 | 1952 | 1660 | 1.43 | 0.79 | 0.70 | 0.1 | 0.4 | 0.3 | ||
| Mean | IV | 621 | 2725 | 2555 | 100 | 379 | 348 | 0.5 | 0.4 | 0.4 | 1.3 | 4.2 | 3.8 | 1825 | 5785 | 5926 | 1357 | 9802 | 10,571 | 158 | 1162 | 1212 | 2.1 | 0.8 | 0.8 | 0.1 | 0.3 | 0.3 | |||
| Asgrow | AG5332 | V | 771 | 2660 | 2245 | 125 | 355 | 313 | 0.5 | 0.4 | 0.4 | 1.6 | 3.8 | 3.5 | 2007 | 6025 | 4339 | 1402 | 8549 | 8272 | 164 | 1052 | 975 | 2.77 | 0.77 | 0.96 | 0.1 | 0.3 | 0.3 | ||
| Progeny | PR 5333 | V | 675 | 3501 | 2683 | 100 | 480 | 345 | 0.5 | 0.4 | 0.4 | 1.2 | 5.2 | 3.5 | 2589 | 5115 | 6602 | 1714 | 14,145 | 11,916 | 199 | 1823 | 1456 | 1.92 | 0.82 | 0.61 | 0.1 | 0.4 | 0.3 | ||
| USDA-ARS | JTN-5110 | V | 792 | 3676 | 2936 | 117 | 514 | 405 | 0.5 | 0.4 | 0.4 | 1.4 | 5.8 | 4.5 | 2800 | 6792 | 6115 | 1900 | 17,403 | 13,616 | 231 | 1853 | 1227 | 1.64 | 0.69 | 0.92 | 0.1 | 0.5 | 0.4 | ||
| Go Soy Genetics Optimized | LELAND | V | 681 | 3814 | 3105 | 111 | 522 | 398 | 0.5 | 0.4 | 0.4 | 1.4 | 5.7 | 4.1 | 1747 | 7842 | 9836 | 1192 | 16,821 | 13,978 | 140 | 1816 | 1704 | 2.86 | 0.71 | 0.73 | 0.1 | 0.3 | 0.3 | ||
| Delta Grow Seeds Com. Inc. | DG5067LL | V | 802 | 3313 | 2232 | 122 | 436 | 317 | 0.5 | 0.4 | 0.4 | 1.5 | 4.6 | 3.6 | 2005 | 6564 | 7167 | 1892 | 12,744 | 9638 | 247 | 1635 | 941 | 2.14 | 1.01 | 0.70 | 0.1 | 0.3 | 0.3 | ||
| Go Soy Genetics Optimized | 5115LL | V | 615 | 3417 | 1848 | 117 | 484 | 277 | 0.5 | 0.5 | 0.5 | 1.4 | 5.5 | 3.3 | 1143 | 8448 | 5117 | 1166 | 11,630 | 6408 | 142 | 1408 | 647 | 2.00 | 1.04 | 0.63 | 0.1 | 0.4 | 0.2 | ||
| Dyna-Gro Seed | S55LS75 | V | 589 | 2689 | 3081 | 93 | 373 | 438 | 0.5 | 0.4 | 0.5 | 1.2 | 4.1 | 5.0 | 1303 | 4594 | 6105 | 1206 | 9725 | 12,816 | 174 | 1158 | 1437 | 1.60 | 0.59 | 0.78 | 0.1 | 0.3 | 0.4 | ||
| Bayer Credenz | CZ 5242 LL | V | 612 | 2388 | 2676 | 92 | 310 | 367 | 0.5 | 0.4 | 0.4 | 1.1 | 3.2 | 4.0 | 1617 | 6525 | 5050 | 1230 | 8460 | 10,822 | 148 | 923 | 1320 | 1.89 | 0.72 | 0.71 | 0.1 | 0.2 | 0.3 | ||
| Bayer Credenz | CZ 5225 LL | V | 424 | 2426 | 2552 | 61 | 317 | 351 | 0.5 | 0.4 | 0.4 | 0.7 | 3.3 | 3.9 | 1303 | 6817 | 5478 | 909 | 9166 | 9809 | 100 | 960 | 1085 | 1.50 | 0.62 | 0.61 | 0.0 | 0.2 | 0.3 | ||
| Delta Grow Seeds Com. Inc. | .DG 5170RR2/STS | V | 530 | 3219 | 2985 | 87 | 456 | 441 | 0.5 | 0.4 | 0.5 | 1.1 | 5.1 | 5.2 | 1544 | 6606 | 6300 | 877 | 11,589 | 13,906 | 103 | 1313 | 1333 | 1.62 | 0.79 | 0.77 | 0.1 | 0.4 | 0.3 | ||
| REV Brand Seeds | 51A56 | V | 677 | 2747 | 2386 | 109 | 368 | 296 | 0.5 | 0.4 | 0.4 | 1.4 | 3.9 | 2.9 | 1405 | 8443 | 10,390 | 1771 | 9838 | 7798 | 190 | 1230 | 873 | 1.57 | 0.81 | 0.55 | 0.1 | 0.3 | 0.3 | ||
| DuPont Pioneer | P52T50R | V | 625 | 2963 | 2928 | 98 | 391 | 372 | 0.5 | 0.4 | 0.4 | 1.2 | 4.1 | 3.8 | 1211 | 6504 | 7084 | 1276 | 11,012 | 12,055 | 158 | 1391 | 1481 | 2.88 | 0.76 | 0.69 | 0.1 | 0.3 | 0.3 | ||
| Syngenta United States | S55-Q3 | V | 445 | 2347 | 2562 | 70 | 298 | 328 | 0.5 | 0.4 | 0.4 | 0.9 | 3.0 | 3.4 | 1742 | 7492 | 7220 | 1155 | 8729 | 10,726 | 115 | 1011 | 1247 | 0.86 | 0.80 | 0.81 | 0.1 | 0.2 | 0.3 | ||
| Syngenta United States | S56-M8 | V | 761 | 2736 | 2298 | 113 | 349 | 301 | 0.5 | 0.4 | 0.4 | 1.3 | 3.6 | 3.2 | 1534 | 10,121 | 8450 | 1770 | 10,547 | 9242 | 235 | 1222 | 1049 | 1.10 | 1.05 | 0.90 | 0.0 | 0.2 | 0.2 | ||
| Go Soy Genetics Optimized | 5214GTS | V | 491 | 2581 | 2986 | 76 | 353 | 379 | 0.5 | 0.4 | 0.4 | 0.9 | 3.9 | 3.8 | 1864 | 3850 | 5892 | 877 | 9461 | 12,930 | 116 | 1129 | 1610 | 1.80 | 0.59 | 0.61 | 0.1 | 0.3 | 0.3 | ||
| Armor | 55-R68 | V | 659 | 3108 | 2961 | 99 | 399 | 388 | 0.5 | 0.4 | 0.4 | 1.2 | 4.1 | 4.1 | 2160 | 5362 | 4301 | 1193 | 10,938 | 13,484 | 164 | 1486 | 1671 | 1.43 | 0.72 | 0.69 | 0.1 | 0.3 | 0.3 | ||
| Progeny Ag Products | P 5226RYS | V | 717 | 3336 | 2889 | 112 | 469 | 395 | 0.5 | 0.4 | 0.4 | 1.4 | 5.3 | 4.3 | 1441 | 4898 | 6982 | 1660 | 11,885 | 11,445 | 217 | 1505 | 1274 | 3.00 | 0.82 | 0.66 | 0.1 | 0.3 | 0.3 | ||
| Mycogen Seeds | 5N523R2 | V | 692 | 2981 | 2039 | 115 | 441 | 293 | 0.5 | 0.5 | 0.5 | 1.5 | 5.2 | 3.4 | 3097 | 3801 | 5335 | 1791 | 9946 | 7093 | 164 | 1257 | 780 | 3.43 | 0.88 | 0.87 | 0.1 | 0.3 | 0.3 | ||
| Dyna-Gro seed | S56RY84 | V | 864 | 3195 | 3028 | 132 | 457 | 433 | 0.5 | 0.5 | 0.5 | 1.6 | 5.2 | 5.0 | 1292 | 4672 | 6125 | 1973 | 12,079 | 15,097 | 293 | 1440 | 1553 | 2.33 | 0.65 | 0.77 | 0.1 | 0.3 | 0.4 | ||
| Croplan WinField United | R2C5225S | V | 737 | 3008 | 2750 | 120 | 430 | 379 | 0.5 | 0.5 | 0.4 | 1.6 | 4.9 | 4.2 | 1729 | 5019 | 5144 | 1654 | 10434 | 10,673 | 186 | 1266 | 1190 | 2.78 | 0.72 | 0.76 | 0.1 | 0.4 | 0.4 | ||
| Bayer Credenz | CZ 5375 RY | V | 594 | 3017 | 3530 | 104 | 428 | 486 | 0.5 | 0.5 | 0.4 | 1.5 | 4.8 | 5.3 | 1782 | 5153 | 7038 | 1214 | 11,698 | 16,497 | 130 | 1312 | 1861 | 1.46 | 0.90 | 0.87 | 0.1 | 0.3 | 0.4 | ||
| REV Brand Seeds | 57R21 | V | 553 | 2342 | 2450 | 83 | 310 | 333 | 0.5 | 0.4 | 0.4 | 1.0 | 3.3 | 3.6 | 1815 | 10,931 | 6604 | 1303 | 8993 | 9743 | 166 | 907 | 1103 | 1.25 | 0.70 | 0.93 | 0.1 | 0.3 | 0.3 | ||
| Syngenta United States | S58-Z4 | V | 395 | 2424 | 2092 | 63 | 323 | 282 | 0.5 | 0.4 | 0.4 | 0.8 | 3.4 | 3.0 | 1345 | 6649 | 4403 | 684 | 7774 | 7873 | 81 | 933 | 934 | 1.63 | 0.77 | 0.79 | 0.0 | 0.2 | 0.3 | ||
| Dyna-Gro Seed | S57RY26 | V | 914 | 3488 | 3736 | 134 | 485 | 493 | 0.5 | 0.4 | 0.4 | 1.6 | 5.4 | 5.2 | 1487 | 4933 | 7876 | 2420 | 15,177 | 20,092 | 359 | 1740 | 2150 | 3.00 | 0.76 | 0.73 | 0.1 | 0.4 | 0.3 | ||
| Mean | V | 651 | 2974 | 2707 | 102 | 406 | 367 | 0.5 | 0.4 | 0.4 | 1.3 | 4.4 | 4.0 | 1748 | 6382 | 6456 | 1426 | 11,198 | 11,497 | 176 | 1324 | 1288 | 2.0 | 0.8 | 0.8 | 0.1 | 0.3 | 0.3 | |||
| Mean | 628 | 2798 | 2590 | 101 | 388 | 353 | 0.5 | 0.4 | 0.4 | 1.3 | 4.3 | 3.8 | 1791 | 5928 | 6037 | 1367 | 10,202 | 10,761 | 162 | 1204 | 1226 | 2.06 | 0.81 | 0.77 | 0.1 | 0.3 | 0.3 | ||||
| † ANOVA | |||||||||||||||||||||||||||||||
| MG | *** | *** | *** | ns | *** | *** | *** | ns | ns | ||||||||||||||||||||||
| CUL | *** | *** | *** | *** | *** | *** | * | ** | ** | ns | *** | *** | *** | *** | *** | *** | *** | *** | *** | *** | *** | *** | *** | *** | ** | ns | ns | ||||
| TT | *** | *** | *** | *** | *** | *** | *** | *** | *** | ||||||||||||||||||||||
| LT | *** | *** | *** | *** | *** | *** | *** | *** | *** | ||||||||||||||||||||||
| HT | *** | *** | *** | *** | *** | *** | *** | *** | ns | ||||||||||||||||||||||
| MG x TT | ns | ns | ns | ns | *** | *** | ** | ns | ns | ||||||||||||||||||||||
| CUL x TT | *** | *** | ns | *** | *** | *** | *** | * | ns | ||||||||||||||||||||||
| Heat Sensitive (CHTRI = 13.20 to 15.32) | Moderately Heat-Sensitive (CHTRI = 15.33 to 17.62) | Moderately Heat-Tolerant (CHTRI = 17.63 to 19.91) | Heat Tolerant (CHTRI > 19.92) |
|---|---|---|---|
| 5115LL (13.02) | GS45R216 (15.47) | DG4781LL (17.75) | IREANE (20.25) |
| S47-K5 (14.00) | 5N424R2 (15.05) | S39-T3 (18.01) | CZ 4898 RY (20.59) |
| S45-W9 (14.77) | GT-476CR2 (15.58) | S56RY84 (18.03) | CZ 5242 LL (20.84) |
| 483C (14.91) | AG4632 (15.66) | CZ 5225 LL (18.03) | CZ 5375 RY (20.88) |
| 38 R10 (14.92) | 5N523R2 (15.66) | S58-Z4 (18.04) | ELLIS (21.16) |
| R01-416F (15.06) | P47T36R (15.94) | DB 4911 (18.07) | 5N393R2 (21.21) |
| JTN-5110 (15.16) | P 4588RY (15.97) | R2C4775 (18.10) | CZ 4181 RY (24.17) |
| S48RS53 (15.24) | P41T33R (16.03) | P 4247 LL (18.69) | 45A46 (26.28) |
| DG 4825RR2/STS (15.25) | P 5333 RY (16.09) | S57RY26 (18.79) | |
| LELAND (16.25) | CZ 4044 LL (18.83) | ||
| GS47R216 (16.38) | 5214GTS (18.91) | ||
| DG 4680RR2 (16.41) | 48A26 (19.09) | ||
| 31RY45 (16.46) | S55-Q3 (19.25) | ||
| PI 471938 (16.50) | 5N490R2 (19.35) | ||
| P 5226 RYS (16.57) | S49LL34 (19.54) | ||
| R2C5225S (16.61) | 48L63 (19.73) | ||
| 51A56 (16.71) | S55LS75 (19.81) | ||
| P 4757 RY (16.38) | |||
| AR4705 (16.90) | |||
| AG5332 (16.93) | |||
| 55-R68 (17.06) | |||
| S39-C4 (17.10) | |||
| DG 5170 RR2/STS (17.27) | |||
| P52T50R (17.38) | |||
| 57R21 (17.44) | |||
| 4814GTS (17.51) | |||
| DG 5067 LL (17.52) | |||
| S56-M8 (17.54) | |||
| 32y39 (17.54) | |||
| 4714LL (17.59) |
| Cold-Sensitive | Moderate Cold Sensitive | Moderate Cold Tolerant | Cold Tolerant |
|---|---|---|---|
| (CLTRI = 6.12 to 6.94) | (CLTRI = 6.95 to 7.76) | (CLTRI = 7.77 to 8.58) | (CLTRI > 8.59) |
| CZ 5225 LL (6.12) | S47-K5 (6.95) | 5N523R2 (7.94) | 4714LL (8.68) |
| CZ 4044 LL (6.16) | DG 4680RR2 (6.98) | P52T50R (7.99) | 5N393R2 (8.94) |
| R01-416F (6.21) | R2C4775 (6.99) | S48RS53 (8.10) | AG5332 (9.42) |
| 57R21 (6.29) | CZ 5375 RY (7.00) | 45A46 (8.15) | GT-476CR2 (9.83) |
| PI 471938 (6.32) | P 5226 RYS (7.00) | DG4781LL (8.29) | GS47R216 (10.34) |
| S39-T3 (6.39) | S58-Z4 (7.00) | P47T36R (8.56) | |
| 48A26 (6.54) | R2C5225S (7.01) | ||
| AG4632 (6.63) | 38 R10 (7.02) | ||
| CZ 4898 RY (6.63) | S55-Q3 (7.03) | ||
| 5115LL (6.66) | 483C (7.12) | ||
| DG 5170 RR2/STS (6.67) | CZ 4181 RY (7.13) | ||
| S39-C4 (6.75) | S56-M8 (7.15) | ||
| P 4588RY (6.76) | 5214GTS (7.16) | ||
| P 5333 RY (6.77) | S45-W9 (7.20) | ||
| LELAND (6.78) | DB 4911 (7.21) | ||
| S55LS75 (6.81) | 32y39 (7.25) | ||
| 5N424R2 (6.83) | GS45R216 (7.25) | ||
| JTN-5110 (6.86) | 51A56 (7.28) | ||
| 4814GTS (6.86) | AR4705 (7.29) | ||
| 31RY45 (6.90) | IREANE (7.30) | ||
| 55-R68 (6.91) | P 4247 LL (7.37) | ||
| DG 4825RR2/STS (7.38) | |||
| 48L63 (7.40) | |||
| S57RY26 (7.40) | |||
| P 4757 RY (7.42) | |||
| CZ 5242 LL (7.51) | |||
| DG 5067 LL (7.53) | |||
| ELLIS (7.61) | |||
| P41T33R (7.61) | |||
| 5N490R2 (7.65) | |||
| S56RY84 (7.66) | |||
| S49LL34 (7.71) |
© 2019 by the authors. Licensee MDPI, Basel, Switzerland. This article is an open access article distributed under the terms and conditions of the Creative Commons Attribution (CC BY) license (http://creativecommons.org/licenses/by/4.0/).
Share and Cite
Alsajri, F.A.; Singh, B.; Wijewardana, C.; Irby, J.T.; Gao, W.; Reddy, K.R. Evaluating Soybean Cultivars for Low- and High-Temperature Tolerance During the Seedling Growth Stage. Agronomy 2019, 9, 13. https://doi.org/10.3390/agronomy9010013
Alsajri FA, Singh B, Wijewardana C, Irby JT, Gao W, Reddy KR. Evaluating Soybean Cultivars for Low- and High-Temperature Tolerance During the Seedling Growth Stage. Agronomy. 2019; 9(1):13. https://doi.org/10.3390/agronomy9010013
Chicago/Turabian StyleAlsajri, Firas Ahmed, Bhupinder Singh, Chathurika Wijewardana, J. Trenton Irby, Wei Gao, and Kambham Raja Reddy. 2019. "Evaluating Soybean Cultivars for Low- and High-Temperature Tolerance During the Seedling Growth Stage" Agronomy 9, no. 1: 13. https://doi.org/10.3390/agronomy9010013