How Does Sowing Rate Affect Plant and Stem Density, Forage Yield, and Nutritive Value in Glyphosate-Tolerant Alfalfa?


Department of Plant Sciences, North Dakota State University, Fargo, ND 58105, USA
*
Author to whom correspondence should be addressed.
Agronomy 2018, 8(9), 169; https://doi.org/10.3390/agronomy8090169
Submission received: 31 July 2018
/
Revised: 21 August 2018
/
Accepted: 28 August 2018
/
Published: 30 August 2018
(This article belongs to the Special Issue Forage and Bioenergy Crops)
Abstract
:The recommended sowing rate of alfalfa (Medicago sativa L.) is about 10 kg pure live seed ha−1, but it is debated if increasing the sowing rate enhances forage yield and quality in the sowing year. This study was conducted to: (i) determine the optimal sowing rate to maximize forage yield; and (ii) determine the relationship between plant and stem density with forage yield and nutritive value. Experiments were conducted at three sites in North Dakota between 2013 and 2016. Six sowing rates [1, 5, 10, 15, 20, and 25 kg ha−1 pure live seed (PLS)] were evaluated. Results indicated that total forage yield in the sowing year was lower only with the lowest sowing rate. Maximum total forage yield in the sowing, first, second, and third production years was obtained with 73, 52, 37, and 36 plants m−2 and 575, 495, 435, and 427 stems m−2, respectively. In the sowing and first production year, both plant and stem density predicted forage yield similarly. In older stands, stem density predicted forage yield slightly better. Forage nutritive value was similar among sowing rates indicating an increase in sowing rate does not enhance forage nutritive value. In conclusion, increasing the sowing rate above the recommended rate (10 kg PLS ha−1) does not increase forage yield or quality.
1. Introduction
Alfalfa is one of the world’s most widely grown perennial forages mainly due to its high forage yield and nutritive value. In 2015, the USA had 7.2 million ha of alfalfa and alfalfa- mixtures harvested for hay [1]. The US states of North Dakota, South Dakota, and Minnesota combined had 1.8 million ha of alfalfa and alfalfa-grass mixtures in 2015 generating more than $1.27 billion dollars to the US economy [1]. The region ranked fifth on value of production for hay, generating about 7% of USA total alfalfa production.
Similar to other crops, efficient stand establishment is key to alfalfa production, where sowing rate plays a key role. The sowing rate for alfalfa can vary from 4 to 40 kg ha−1 [2,3] depending on factors such as location, climate, soil type, seedbed preparation, tillage, method of establishment, and seed cost [3]. The current recommended sowing rate for Midwest USA is between 11.2 and 13.4 kg ha−1 [4]. Typically, higher sowing rates than those recommended are used to account for failures and establishment losses. Higher sowing rates will increase stand density, but increase intra-specific competition among alfalfa plants, resulting in higher plant mortality [5,6]. A study by Hall et al. [5] reported alfalfa mortality rates were eight times greater at the highest sowing rate (20.2 kg ha−1) compared with the lowest sowing rate (6.7 kg ha−1) tested in the sowing year, and was similar for all sowing rates after the sowing year. Alfalfa plant density decreased after six months from establishment with sowing rates above 17 kg ha−1 [5]. Volenec et al. [7] reported, when plant density is increased up to 172 plants m−2, alfalfa yield per area was increased, but yield per plant decreased. Alfalfa stem diameter [8] and shoot weight [9] reduction has been associated with increased sowing rates. However, protein content does not increase with higher sowing rates [3]. In studies in the USA, during the first production year of alfalfa, optimum stand density to provide maximum yield varied from 140 to 260 plants m−2 [10]. Most studies have reported that increased sowing rates had limited effects on forage yield long term [2,6]. However, Glaspie et al. [11] reported conflicting results in which a sowing rate of 18 kg ha−1 [4], had the highest alfalfa yield both in the sowing year and in the first production year, compared with 10 kg ha−1 rate.
One reason for the observed variability between forage yield and sowing rate is the difference in plant components and their ability to compensate stand loss over time [2]. In the northern Great Plains, alfalfa stand persistence and forage yield can be reduced due to winter-kill and winter-injury. In 2013, over 90% of alfalfa growers in Minnesota and Wisconsin reported winter-kill and winter-injury [12]. Most winter-kill happens when several weather factors such as above normal rainfall, lack of snow cover, and temperatures below −15 °C are combined [13]. Berti et al. [14] also reported a significant increase in the number of dead alfalfa plants in the spring following a fall harvest in the previous year, due to winter-kill. Plant density on average declined from 100 to 25 plants m−2 in four years, while the stem density decreased in the first two years, but it was stable at about 350 stems m−2 thereafter [5]. Hakl et al. [15] reported 94% reduction in alfalfa stand density over a period of six years. Higher plant densities are associated with reductions in root weight, taproot diameter, and amount of lateral roots [15], which all can contribute to reduced stand persistence.
Predicting actual on-farm alfalfa forage yields is difficult but necessary. Very few studies have been able to predict forage yield. Existing alfalfa yield prediction models for the first harvest of the year are based on winter temperature cycles, spring growing degrees, and number of days in the hardening period [16]. Predicting yield potential at each harvest by counting plants or stems in random areas of the field, will give farmers a forage yield estimation useful to assess the availability of forage. Also, prediction is necessary for alfalfa multi-peril insurance claims. Predicting forage yield by counting plants or stems would eliminate the need for a grower or adjustor to weigh the forage yield to claim insurance. Current yield prediction models used by the Risk Management Agency (RMA) for multi-peril insurance uses a minimum number of alfalfa plants per unit area, depending on the field’s location, and other factors [17]. For example, a non-irrigated alfalfa monocrop in eastern North Dakota needs to have at least 107 plants m−2 to be considered as a productive stand [17].
Use of newer weed control tools such as glyphosate-resistant alfalfa cultivars can greatly enhance weed control, especially during the sowing year [18]. However, these new cultivars have a higher seed cost compared with conventional cultivars, and so use of increased sowing rates will greatly increase the establishment cost. Thus, it is essential to establish appropriate sowing rates. The objectives of this study were: (1) to determine the optimal sowing rate to maximize yield in the sowing year; and (2) to determine the relationship between plants and stem density, and forage yield as alfalfa stands age.
2. Material and Methods
2.1. Field Establishment and Experimental Design
Field experiments were conducted from 2013 to 2016 at three North Dakota State University (NDSU) research sites at Prosper (46°58′ N, −97°3′ W, elevation 280 m), Fargo (46°52′ N, −96°47′ W, 274 m), and Carrington (47°30′ N, 99°8′ W, elevation 489 m), ND. The soil type at Prosper is a Kindred–Bearden silty clay loam (Kindred: fine-silty, mixed, superactive Typic Endoaquoll; Bearden: fine-silty, mixed, superactive, frigid Aeric Calciaquoll). The soil type in Fargo is; Fargo silty clay soil (fine, montmorillonitic, frigid, Vertic Haplaquol with a leached and degraded nitric horizon). The soil type in Carrington is Heimdahl loam (coarse-loamy, mixed, superactive, Frigid Calcic, Hapludolls) [19]. Daily temperature and rainfall were recorded by the North Dakota Agriculture Weather Network [20] at all three sites (Figure 1).
The previous crop at all sites was soybean (Glycine max (L.) Merr.). Chisel plowing was used in the fall after soybean harvest and, in the spring a field cultivator and a roller was used to prepare the seedbed before sowing the experiments. The experimental design was a randomized complete block with four replicates. Experimental units were 6.1 m long with eight rows spaced 15.2 cm apart. Sowing rates were calculated based on the percentage of pure live seed (PLS), taking purity and germination percentage into account. Sowing rates were 1, 5, 10, 15, 20, and 25 kg PLS ha−1. There were no additional seed treatments before sowing. Sowing depth was at 12.7 mm and sowing was undertaken using an 8-cone continuous plot drill (Wintersteiger, Salt Lake City, UT, USA). The alfalfa cultivar used was ‘RR Presteez’ and each treatment was randomly assigned to plots.
In 2013, alfalfa was sown on 13, 15, and 16 May in Carrington, Fargo, and Prosper, respectively. In 2014, sowing dates were 23 and 27 May in Prosper and Fargo, respectively. The sowing at the Carrington site, in 2014, failed and was abandoned. All plots were fertilized with 30 kg P2O5 ha−1 and 50 kg K2O ha−1 before sowing and every October thereafter from 2013 to 2015. Fertilization of all treatments was made by hand broadcasting without incorporation. During the study, as required, glyphosate [N-(phosphonomethyl) glycine] was applied at 1.1 kg acid equivalent (a.e.) ha−1 to control weeds.
2.2. Sampling and Analysis
The sowing year had two harvests while the first, second, and third production years had typically four harvests during the season, except in Carrington (Table 1). The targeted harvest stage was late bud, 10% bloom, and at 25% bloom for the first, second and third harvests, respectively. The fourth harvest was taken in the fall regardless of growth stage but with a plant height greater than 40 cm. At harvest, six center rows (1 m-wide) of the plot were harvested leaving a 10-cm stubble height with a flail forage harvester with a scale incorporated (Carter MFG CO. Inc., Brookston, IN, USA). Whole plot fresh weight was recorded and a fresh sample was taken and weighed. In each plot, stems and plants were counted immediately before the last harvest of the season (fall) and immediately before the first harvest (spring) within a fixed 1-m2 quadrat, which was randomly placed in plots during the seedling stage. Only the green shoots were considered as ’live,’ and thus counted as stems. Each green shoot longer than 10 cm and arising directly from the crown was considered as a separate stem. The number of stems per crown was recorded. The sum of crowns within the quadrat was taken as the number of plants m−2, while the sum of stems was considered as the stems m−2.
Harvested biomass samples were dried (43.3 °C until constant weight), and tissue samples were then ground in a mill with a 1-mm size mesh screen. Alfalfa ground samples were analyzed for crude protein (CP), acid detergent fiber (ADF), neutral detergent fiber (NDF), neutral detergent fiber digestibility (NDFD), ash, acid detergent lignin (ADL), in vitro dry matter digestibility (IVDMD), relative forage quality (RFQ), and total digestible nutrients (TDN) content using near infrared reflectance spectroscopy (NIRS) (Foss-Sweden Model 6500, Minneapolis, MN, USA), following the method described by Abrams et al. [21].
2.3. Statistical Analysis
Statistical analysis was conducted using standard procedures for a randomized complete-block design. Each site and block was considered a random effect in the statistical analysis. The different sowing rates, plant density, stem density, year, and harvest were considered fixed effects. Trait error mean squares were compared for homogeneity among sites according to the folded F-test and if homogeneous, then a combined analysis of variance was performed across sites. Treatment mean separation was determined by F-protected least significant differences (LSD) comparisons at the p ≤ 0.05 probability level. Analysis of variance and mean comparisons were conducted using the Mixed Procedure of SAS [22]. Simple regression analysis was conducted to develop regression models for forage yield response to sowing rate, plant density, and stem density by stand age (sowing year, year-one, year-two and year-three) and harvests (1, 2, 3, and 4).
3. Results and Discussion
3.1. Total Seasonal Forage Yield
Error variance among sites was homogenous for total seasonal forage yield in the sowing and first production years. The analysis of variance combined across sites for total seasonal forage yield in the sowing and first production year was significant for sowing rate and the interaction between sowing rate and site (p ≤ 0.05). The interaction was mainly due to a magnitude effect and since site was considered a random factor in the analysis; results are presented pooled across sites.
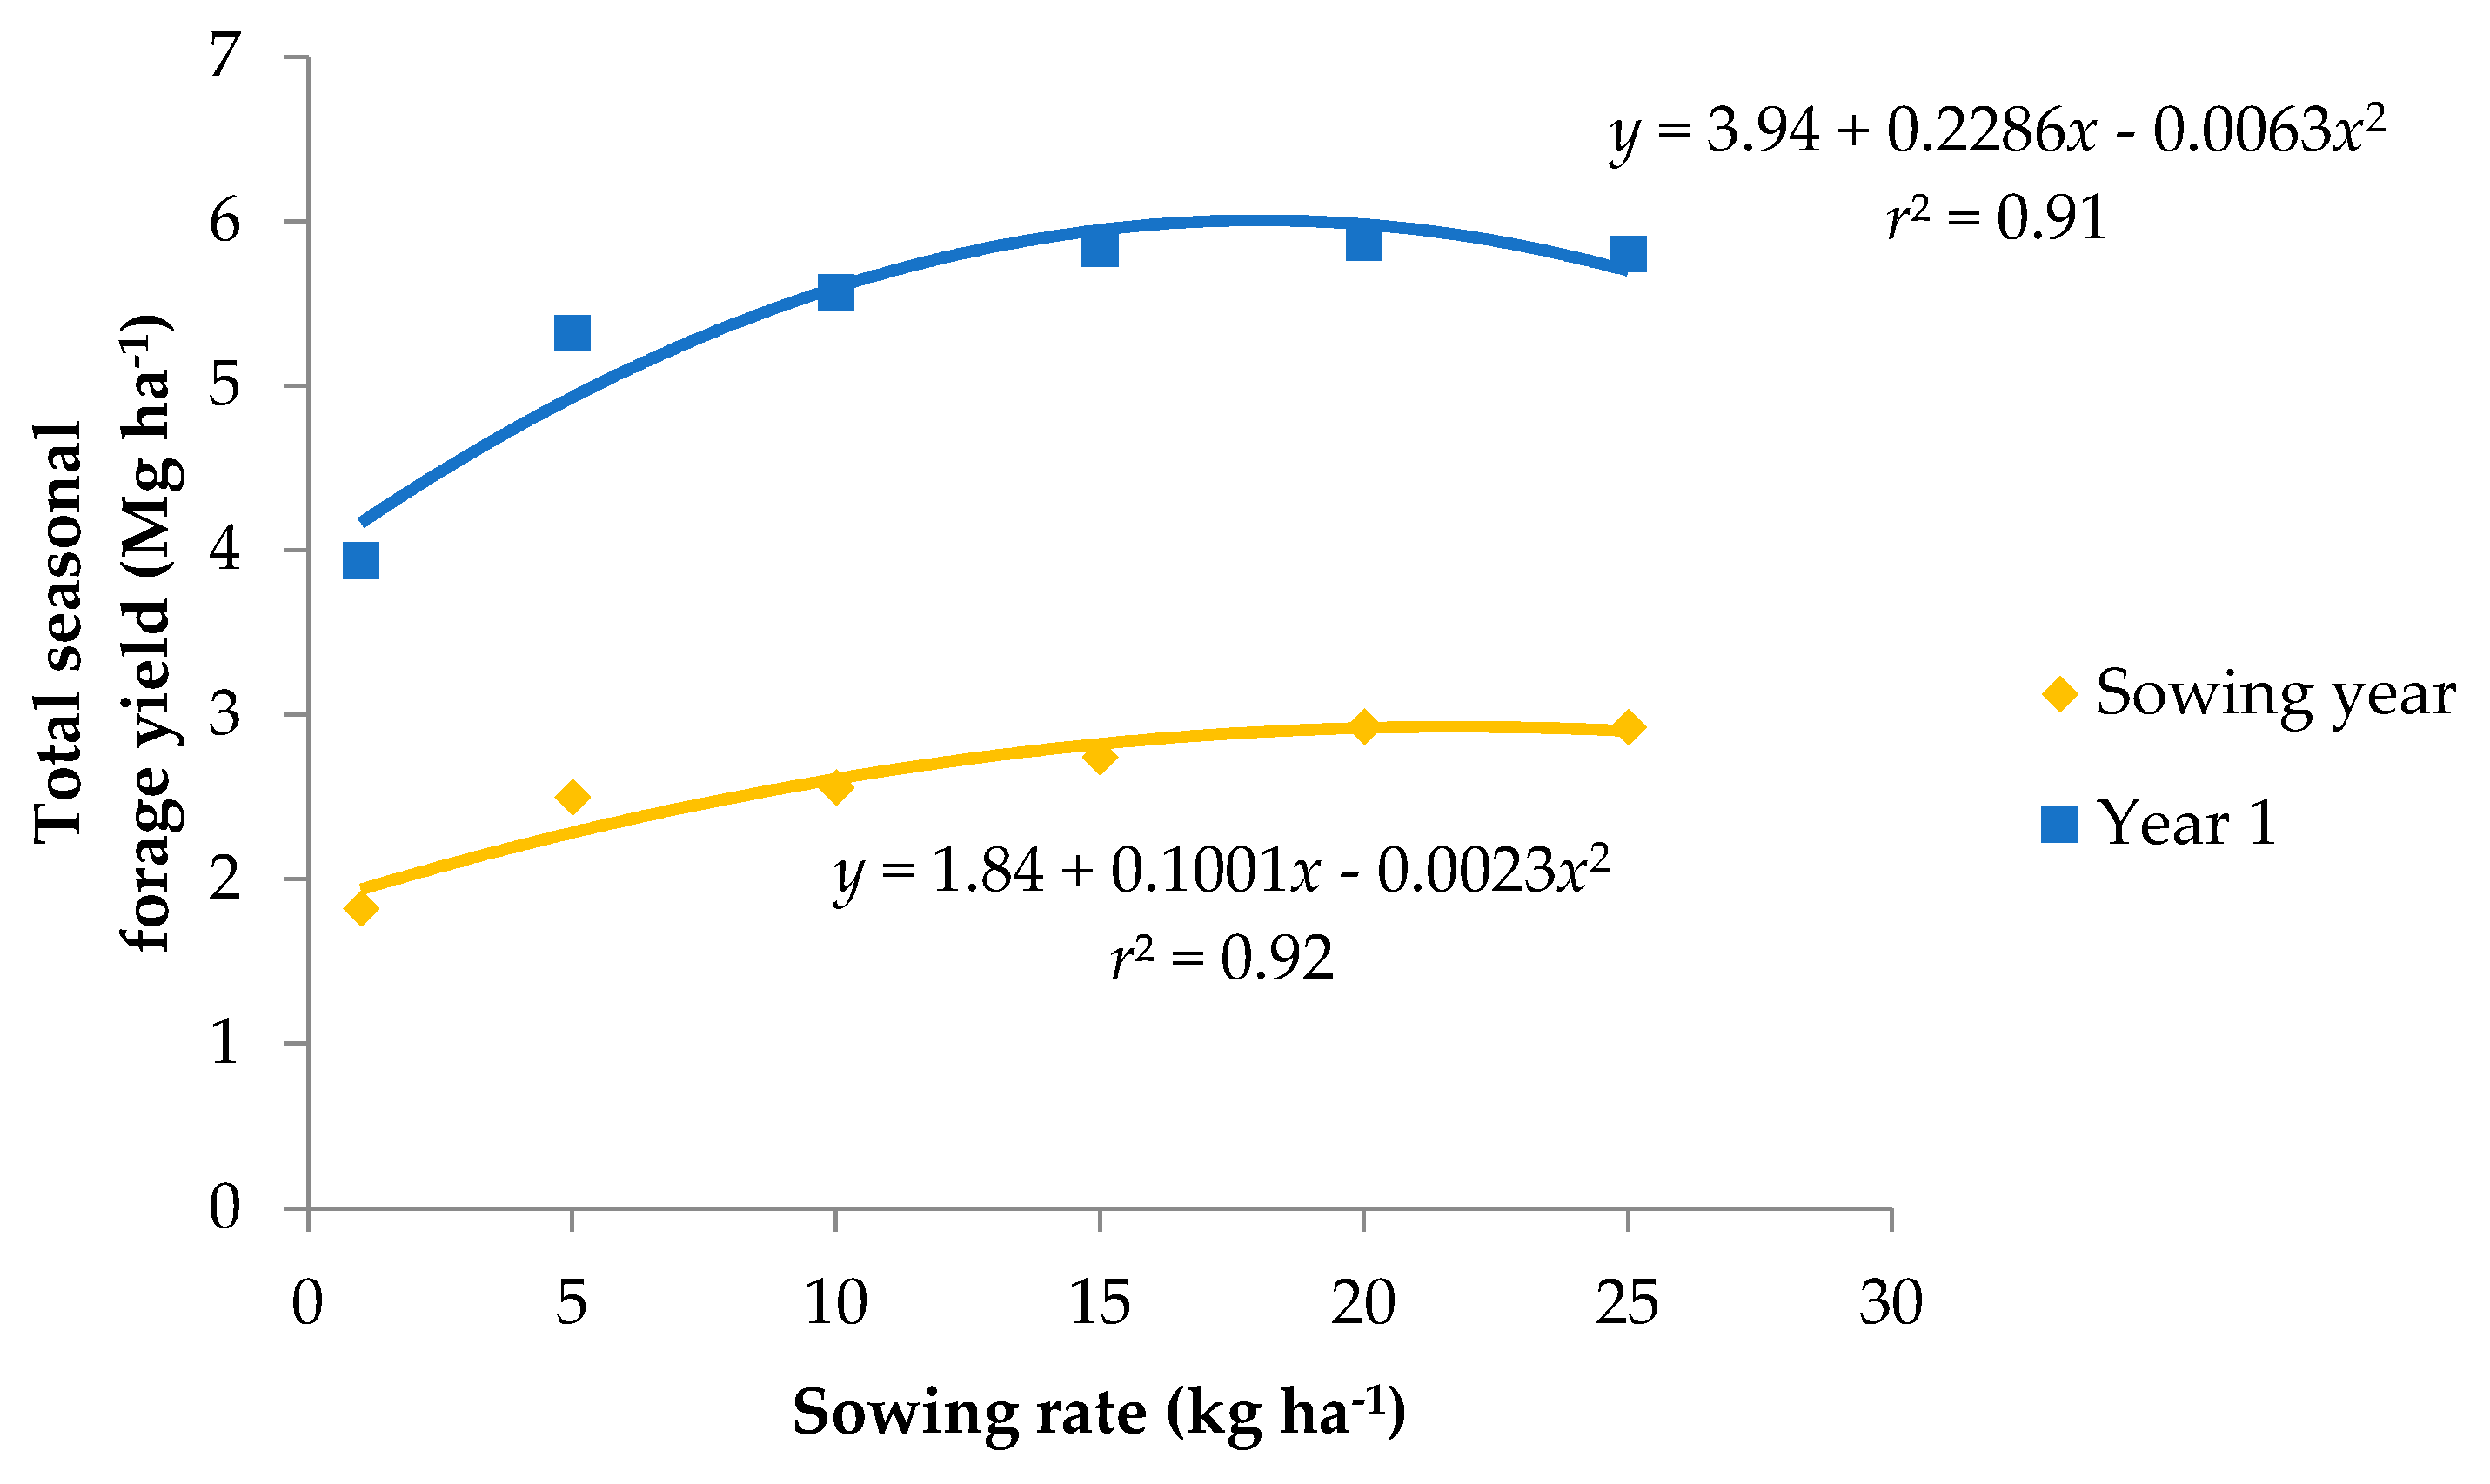
The lowest total seasonal forage yield resulted from the lowest sowing rate in both sowing year and first production year (Figure 2). However, forage yield was not significantly different among sowing rates for the three highest sowing rates (15, 20, and 25 kg ha−1) in the sowing year and for all sowing rates, except the lowest, for the first production year. Hall et al. [6] had similar results for a study undertaken with glyphosate-tolerant alfalfa at several sites in the USA with higher forage yield resulting from sowing rates above 11.2 kg ha−1 compared with 6.7 kg ha−1. Similarly, others have also reported higher forage yield for alfalfa with higher sowing rates in the sowing year, but usually not when rates are greater than 10 kg ha−1; the recommended sowing rate in the North Central US states [11,23,24].
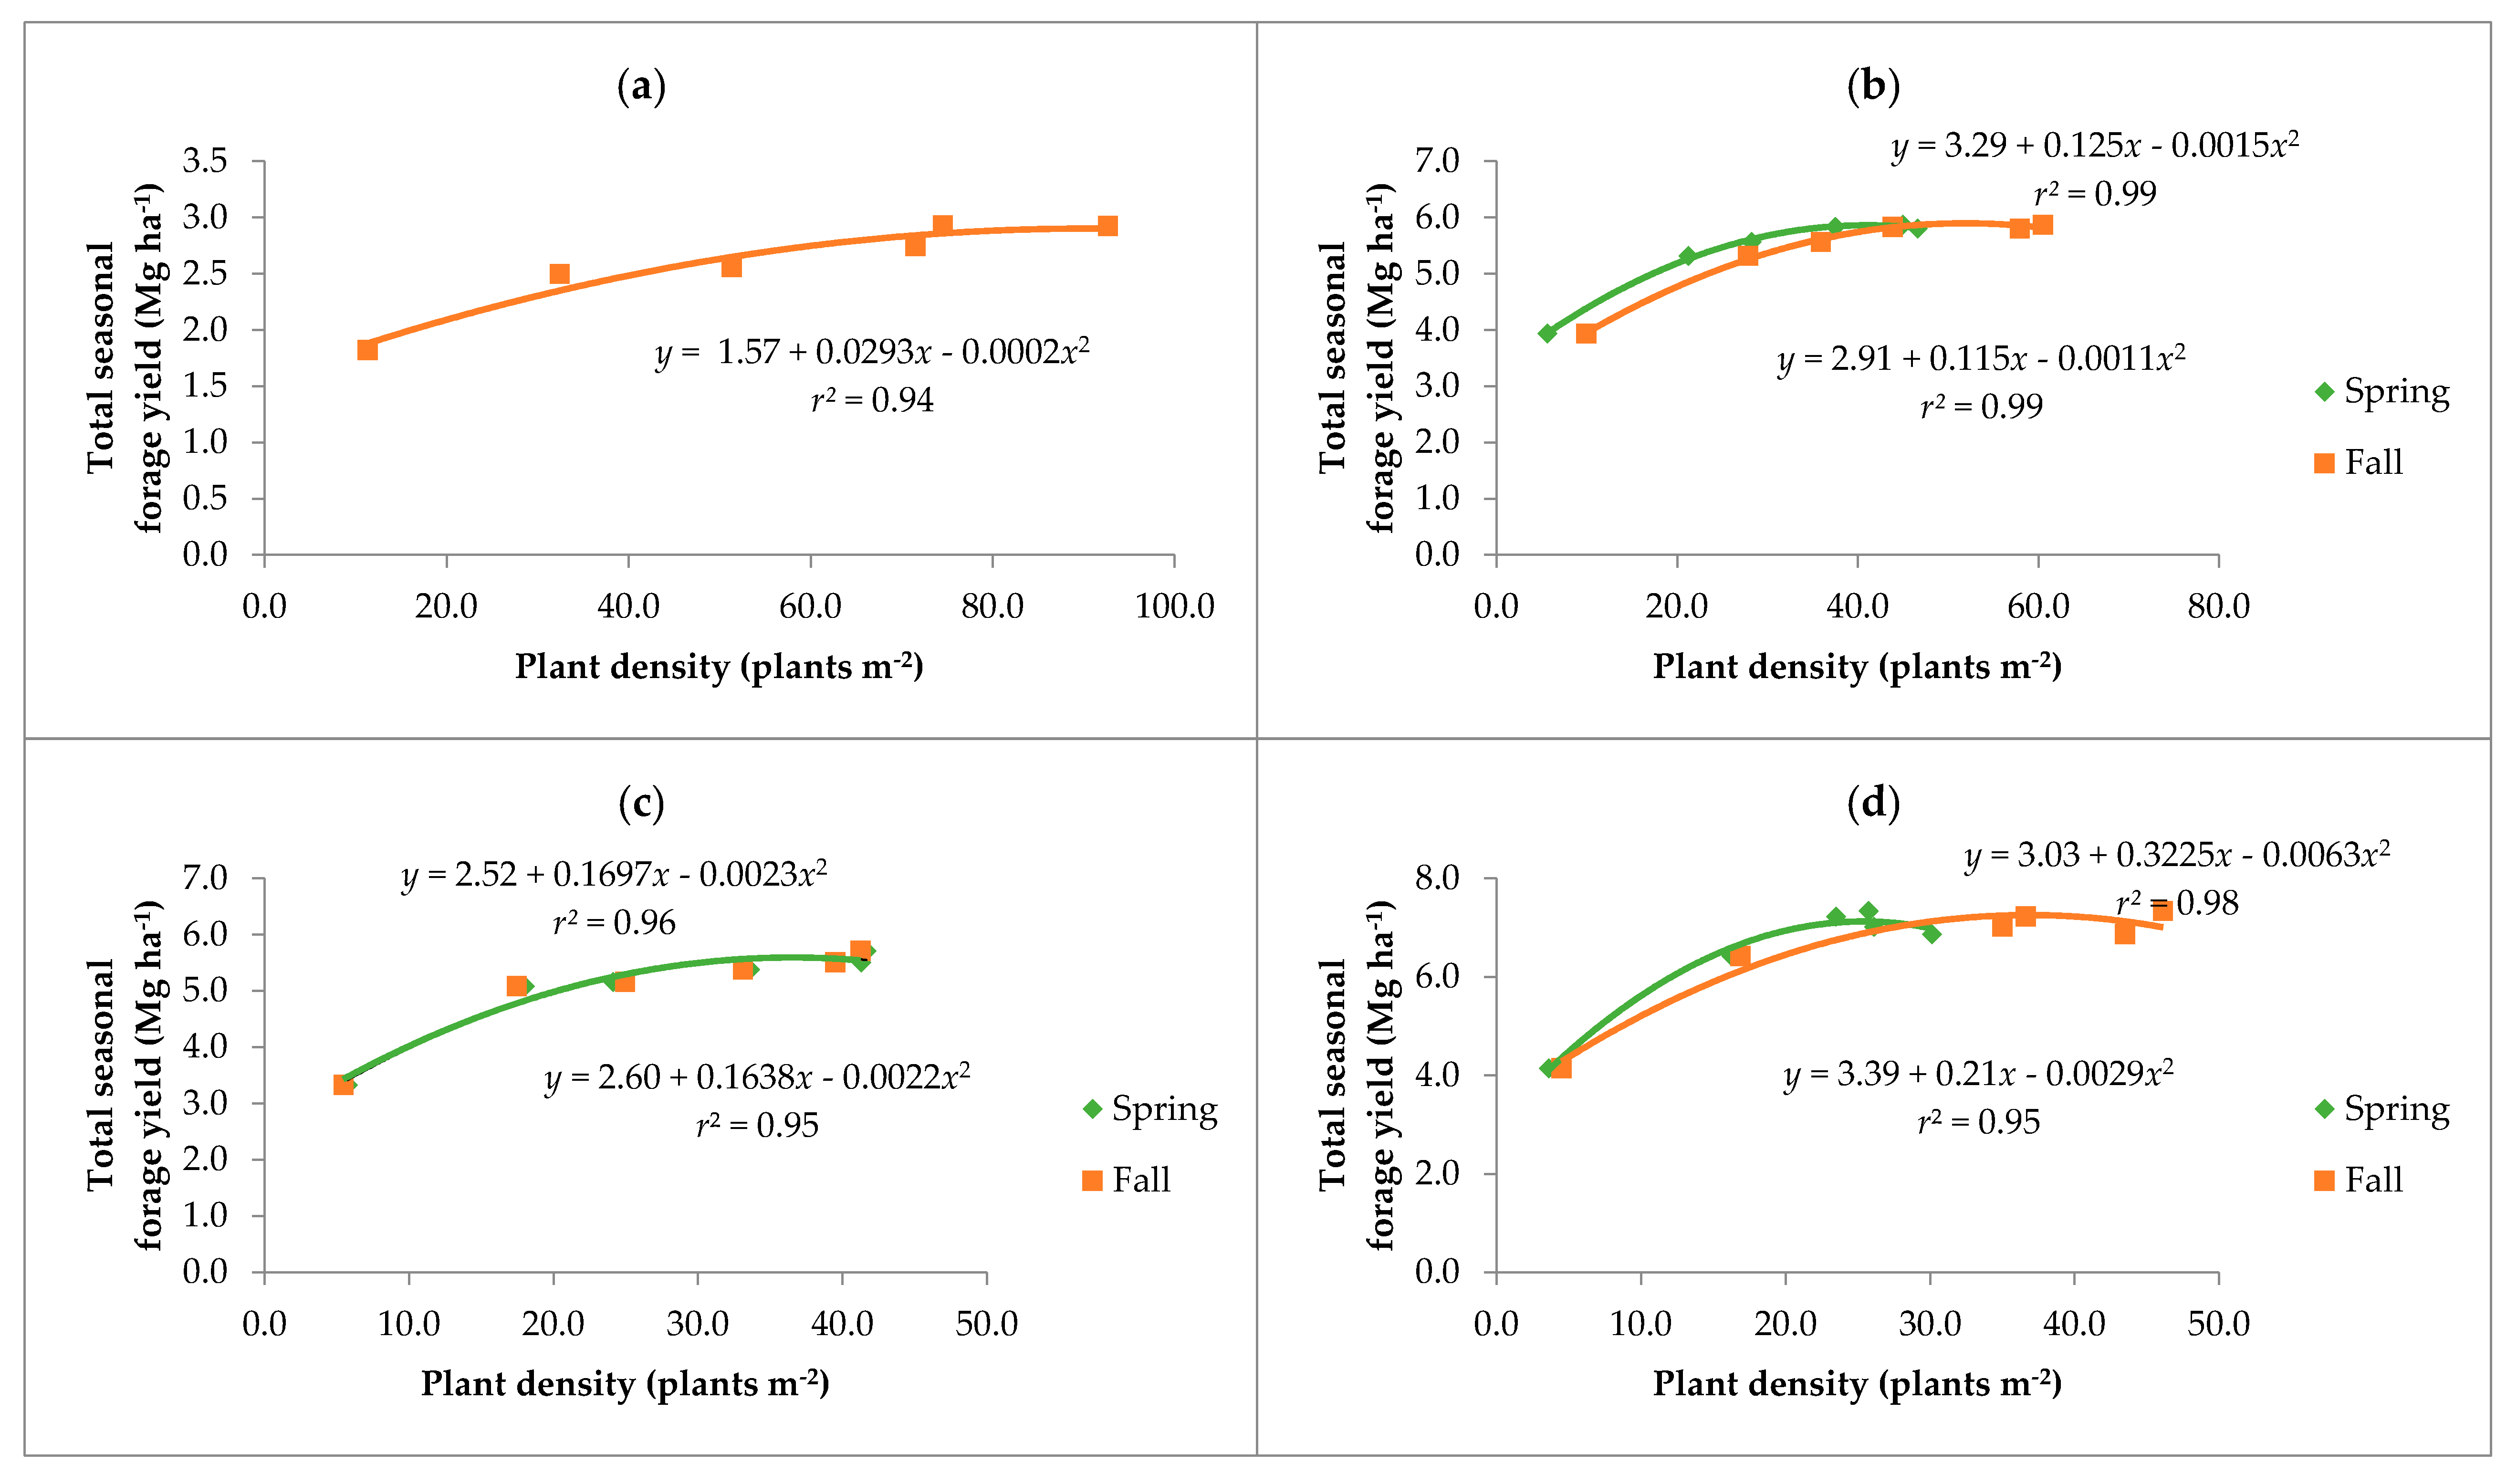
As expected, the lowest total forage yield was observed in the sowing year (Figure 3). In the first and third production years, a greater number of plants were recorded in the fall compared with the spring count. This can be explained by the method used to count plants and stems (stems greater than 10-cm in height were counted as stems). Crowns that have suffered winter-injury were likely present when the first count was conducted, but stems were not yet 10-cm in height. These plants likely recovered later in the season, which may explain the lower plant density counts in the spring compared with fall counts. The spring and fall plant densities in the second production year were somewhat similar (Figure 3c). This may have been due to favorable winter conditions such as adequate snow cover, which resulted in reduced winter-injury. Maximum yield of 2.64 Mg ha−1 in the sowing year was obtained with 73 plants m−2 (Table 2 and Figure 3a), calculated from the first derivative of the regression equation.
As the stand aged, the plant and stem density required to maximize forage yield decreased (Table 2). The risk management agency in North Dakota requires 107 plants m−2 in the sowing year to insure alfalfa in North Dakota. Our results indicate that the number of plants needed to have optimum forage yield for non-irrigated alfalfa in the sowing year is only 73 plants m−2. Our predicted plant density to optimize forage yield is much lower than that required by RMA for alfalfa in eastern North Dakota where this study was conducted. This indicates that tables used by RMA are probably overestimating the required number of plants needed for optimum yield. Alfalfa has a great capacity to compensate for lost plants. Hall et al. [6,18] reported plant density ranged between 120 to 200 plants m−2 in the sowing year, decreasing to less than 100 plants m−2 in the first production year. By the third production year, the plant density had decreased to less than 80 plants m−2 [18].
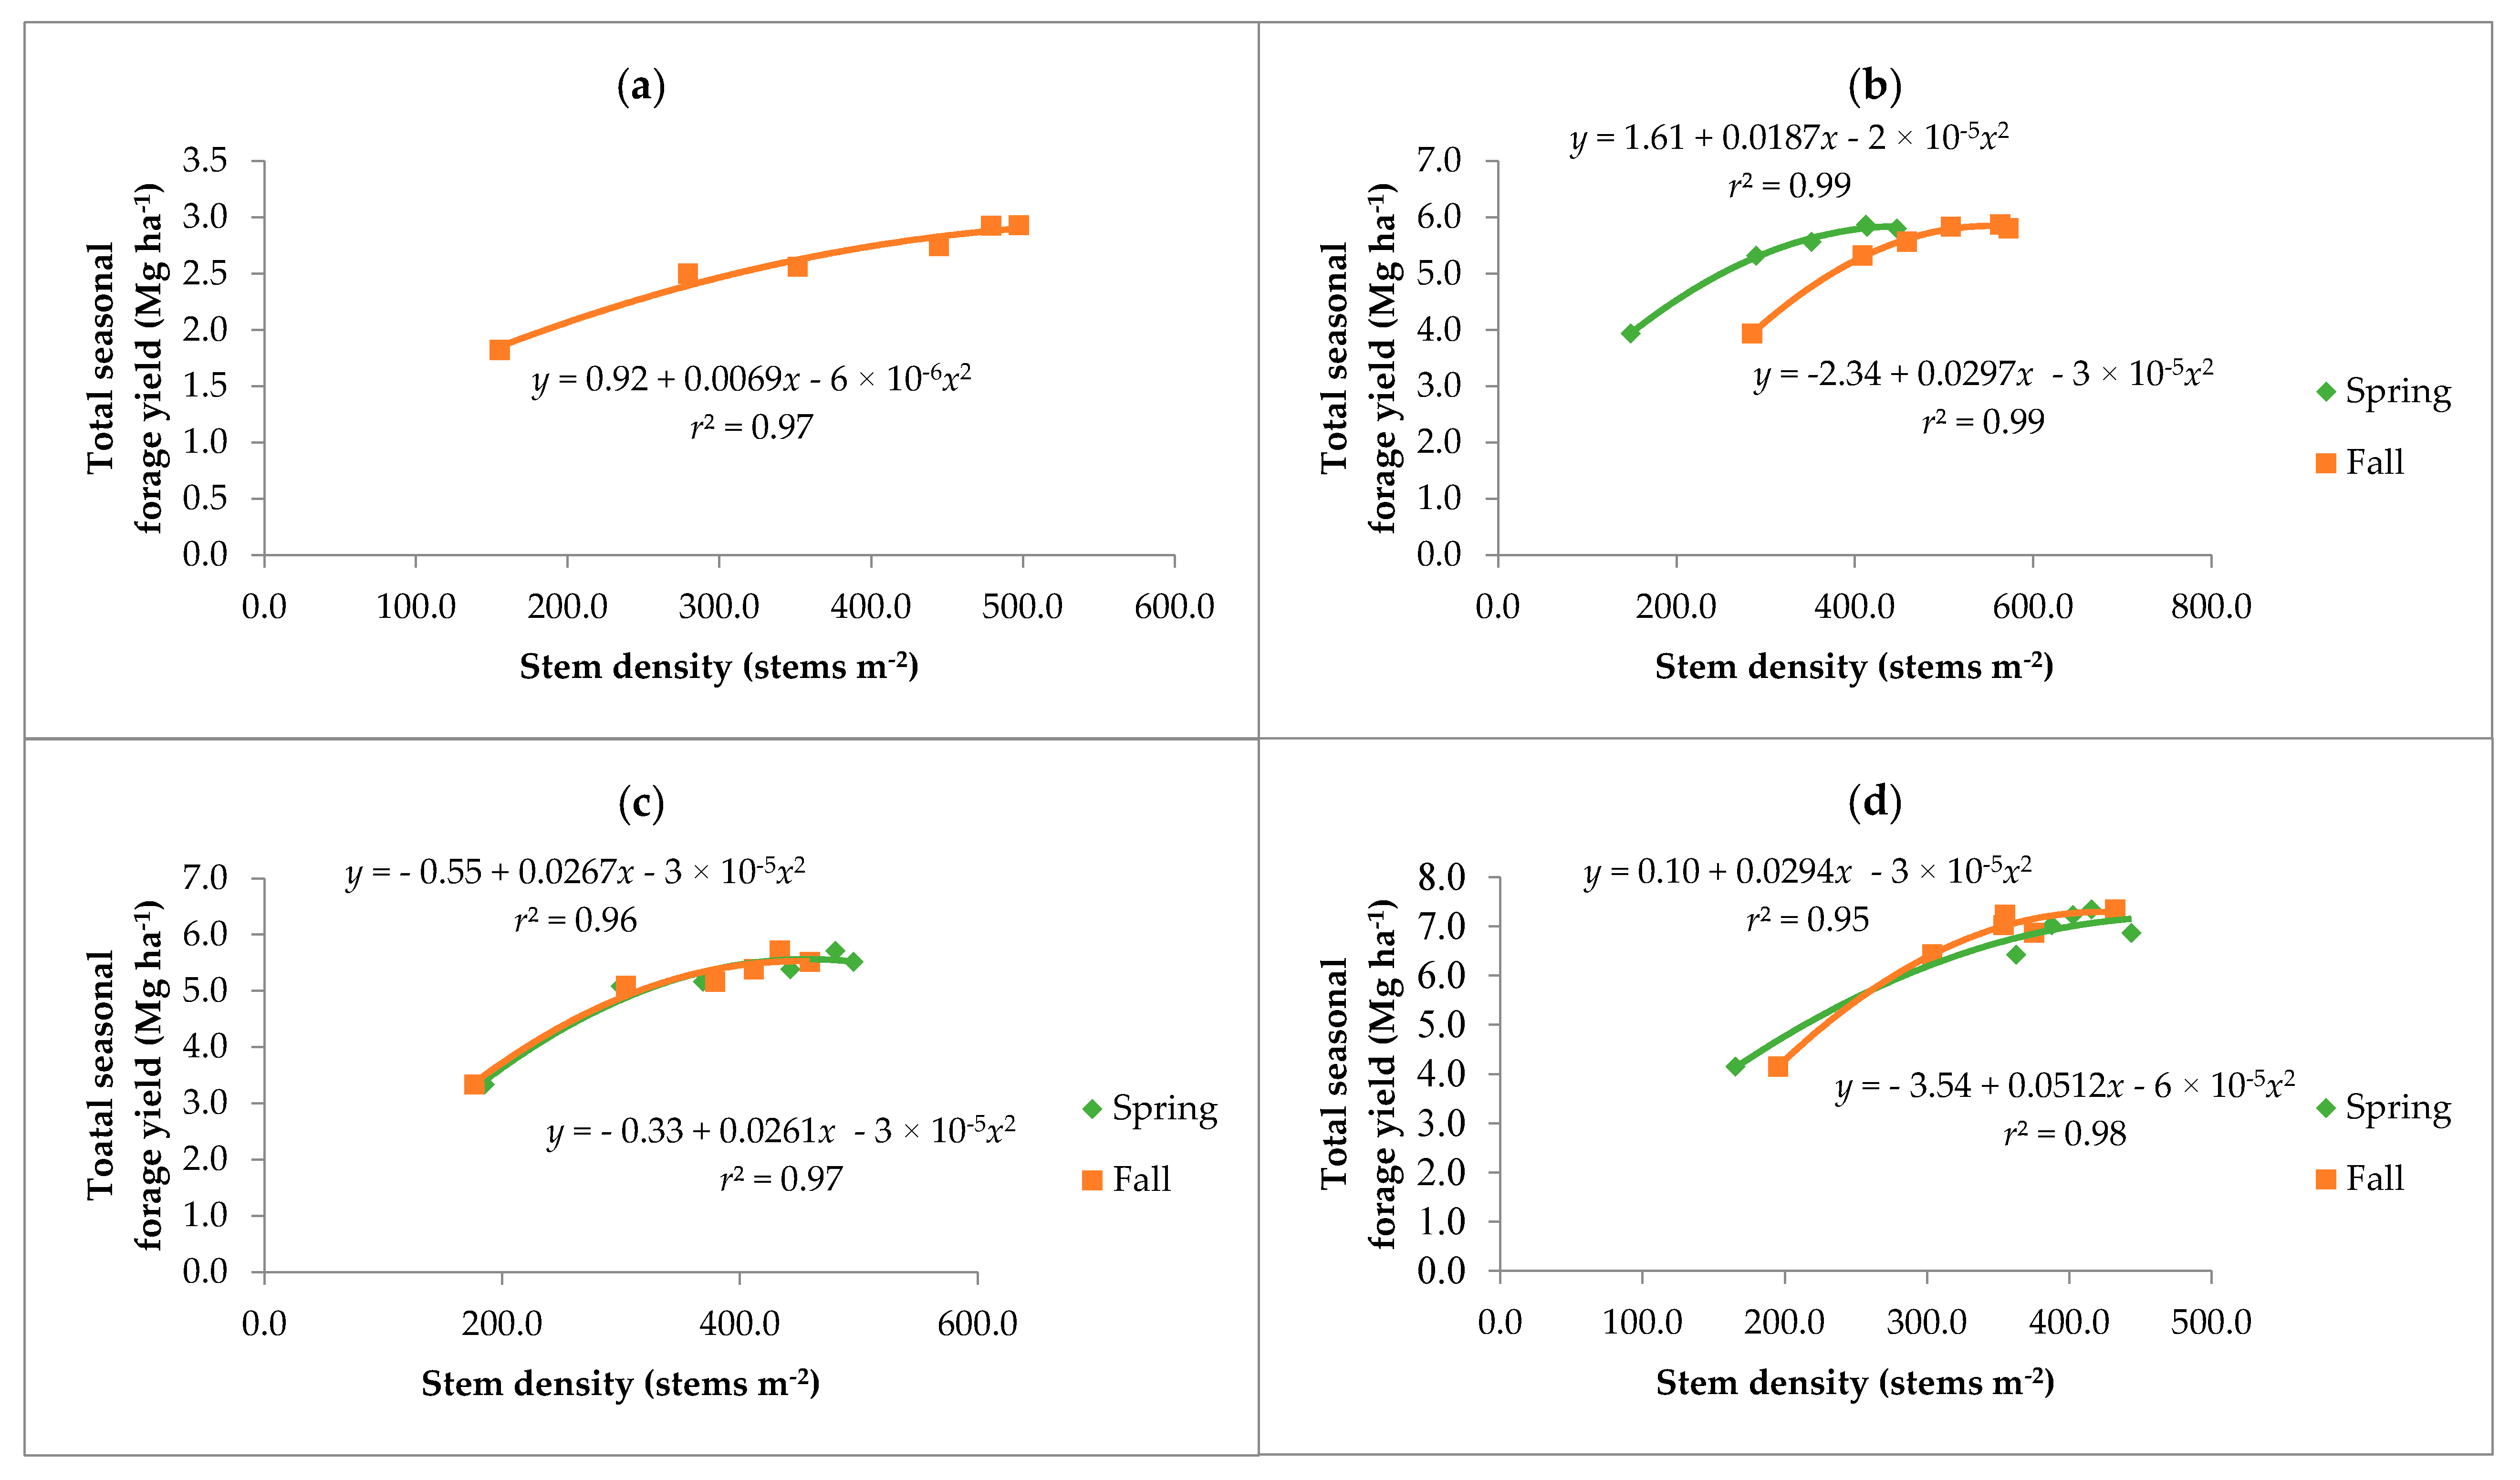
The regression models for forage yield using plant density were significant (p ≤ 0.05) and similar for all years, utilizing both spring and fall plant density counts (Figure 3). Similar to the regression models for forage yield using plant density as the independent variable, models developed with stem density as the independent variable were also significant and similar for all years with stem density as independent variable (Figure 4).
The greatest reduction in plant and stem density was observed between the plant counts in the fall of the sowing year and those counted in the spring of the first production year (Figure 3a,b). Plant density reduction was greater for the higher sowing rates when compared with the fall plant density of the sowing year with that of the third production year. Lowest (1 kg ha−1) and highest (25 kg ha−1) sowing rates showed stand reductions of 11.5% and 53.1%, respectively. These results are in line with other studies [2,3,5,6,9]. Hall et al. [5] reported 70% and 51% stand reductions at the end of the first production year compared with that of the sowing year, when sowing rates were 20.2 and 6.7 kg ha−1, respectively. At higher densities intraspecific competition is stronger, thus plants going into the winter are weakened by competition and are more susceptible to winter-kill [25].
In contrast, stem reduction was not affected by sowing rate. This may be due to the plant’s ability to compensate the loss of plants with increased production of new stems during favorable environmental conditions. Maximum yield of 2.9 Mg ha−1 in the sowing year was obtained with 575 stems m−2 (Table 2 and Figure 4a), calculated from the first derivative of the regression equation. Prediction was slightly better although not significant in the third production year. This may indicate that as stands get older stem density might give a better estimation of forage yield. This makes sense since an older plant, especially if it has some degree of crown winter-injury, will likely produce a lower number of less vigorous stems [26].
3.2. Forage Nutritive Quality Components
The combined analysis of variance across all sites showed no differences among treatments in any of the years (p ≤ 0.05) except for the first production year. Results clearly indicate and confirm previous findings, that increasing sowing rate does not increase forage nutritive quality in the sowing year (Table 3). Glaspie et al. [11] did not find significant differences in forage quality in any of the harvests conducted in the sowing year between 9 and 18 kg ha−1 sowing rates. Volenec et al. [7] reported improved forage quality in alfalfa only when stem density exceeds 1600 stems m−2. Several previous studies have concluded weeds present in the sowing year are the cause of forage nutritive quality reduction, which will not persist after the second harvest of the sowing year [27,28]. Furthermore, Brothers et al. [27] and Glaspie et al. [11] reported that forage quality in the sowing year can be improved through the application of herbicides. Since the present study used glyphosate-tolerant alfalfa, timely weed control most likely prevented weeds from getting into the final harvest, thus not affecting the nutritive quality.
During the first production year, ADF and NDF were on average 7.8% higher on the 15 kg ha−1 rate compared with the lowest sowing rate (1 kg ha−1) (Table 3). Lowest sowing rate had plants with higher number of stems per plant, compared with that of higher sowing rates. Furthermore, thinner stems were observed (not measured) in plants with the lowest sowing rate compared with that of highest sowing rates. Thicker stems have reported to have higher NDF and ADF values compared with thinner stems [29]. Higher sowing rates can cause intra-specific competition among alfalfa plants [18], which can force plants to increase stem length, increasing the stem to leaf ratio. However, Iwaasa et al. [30] found increased sowing rates had no influence on alfalfa cell wall constituents.
4. Conclusions
Increasing sowing rate above 10 kg PLS ha−1 does not increase the forage yield in the sowing year. Maximum total seasonal forage yield in the sowing year, first, second, and third production years was obtained with 73, 52, 37, and 36 plants m−2 and 575, 495, 435, and 427 stems m−2, respectively. Plant density decreased in greater percentage at a higher sowing rate compared with lower sowing rate.
Predictive regression models generated with the controlled experiments from 2013–2016 indicated that both plants m−2 and stems m−2 have the potential to be utilized to predict forage yield. In the sowing year and first production year, plant and stem density both predicted forage yield similarly. However stems m−2 may predict forage yield slightly better in the second and third production years.
Forage nutritive value was not affected by either plant or stem density in the sowing year or thereafter.
Author Contributions
Formal analysis, D.S.; Investigation, M.T.B.; Methodology, M.T.B.; Project administration, M.T.B.; Writing—review & editing, M.T.B. and D.S.
Acknowledgments
This research was possible thanks to the funding provided by the North Dakota State University Agricultural Experimental Station project ND 01557, the Midwest Forage Association Research Program, and the National Crop Insurance Services (Mark Zarnstorff). Authors also wish to thank all technical staff, visiting scientists, undergraduate, and graduate students that helped support these studies.
Conflicts of Interest
The authors declare no conflict of interest.
References
- NASS, National Agriculture Statistics Service. Published Estimate Data Base. 2016. Available online: http://www.nass.usda.gov/ (accessed on 20 April 2018).
- Lloveras, J.; Chocarro, C.; Freixes, O.; Arque, E.; Moreno, A.; Santiveri, F. Yield, yield components, and forage nutritive value of alfalfa as affected by seeding rate under irrigated conditions. Agron. J. 2008, 100, 191–197. [Google Scholar] [CrossRef]
- Bolger, T.P.; Meyer, D.W. Influence of plant density on alfalfa yield and quality. In Proceedings of the American Forage and Grassland Council, Eau Claire, WI, USA, 23–26 January 1983; pp. 37–41. [Google Scholar]
- Rankin, M. Determining the Optimum Alfalfa Seeding Rate. Available online: https://fyi.uwex.edu/forage/files/2014/01/AlfSeedingRate-FOF.pdf (accessed on 18 August 2018).
- Hall, M.H.; Nelso, C.J.; Coutts, J.H.; Stout, R.C. Effect of seeding rate on alfalfa stand longevity. Agron. J. 2004, 96, 717–722. [Google Scholar] [CrossRef]
- Hall, M.H.; Hebrock, N.S.; Pierson, P.E.; Caddel, J.L.; Owens, V.N.; Sulc, R.M.; Undersander, D.J.; Whitesides, R.E. The effects of glyphosate-tolerant technology on reduced alfalfa seeding rates. Agron. J. 2010, 102, 911–916. [Google Scholar] [CrossRef]
- Volenec, J.J.; Cherney, J.H.; Johnson, K.D. Yield components, plant morphology, and forage quality of alfalfa as influenced by plant-population. Crop Sci. 1987, 27, 321–326. [Google Scholar] [CrossRef]
- Krueger, C.R.; Hansen, L.H. Establishment method, variety and seeding rate affect quality and production of alfalfa under dryland and irrigation. SD Farm Home Res. 1974, 25, 10–13. [Google Scholar]
- Kephart, K.D.; Twidwell, E.K.; Bortnem, R.; Boe, A. Alfalfa yield component responses to seeding rate several years after establishment. Agron. J. 1992, 84, 827–831. [Google Scholar] [CrossRef]
- Tesar, M.B.; Marble, V.L. Alfalfa establishment. In Alfalfa and Alfalfa Improvement; Hanson, A.A., Barnes, D.K., Hill, J.R.R., Eds.; ASA, CSSA, and SSSA: Madison, WI, USA, 1988; pp. 303–332. [Google Scholar]
- Glaspie, C.F.; McCordick, S.A.; Dietz, T.S.; Kells, J.J.; Leep, R.H.; Everman, W.J. Effect of seeding rate and weed control on glyphosate-resistant alfalfa establishment. Weed Technol. 2011, 25, 230–238. [Google Scholar] [CrossRef]
- Wells, M.S.; Martinson, K.L.; Undersander, D.J.; Sheaffer, C.C. A survey investigating alfalfa winter injury in Minnesota and Wisconsin from the winter of 2012–2013. Forage Grazinglands. 2014. Available online: https://dl.sciencesocieties.org/publications/fg/abstracts/12/1/FG-2013-0051-RS (accessed on 18 August 2018).
- Hesterman, O.B.; Durling, J.C. Avoiding Winter Injury to Alfalfa (E2310). Available online: http://msue.anr.msu.edu/resources/avoiding_winter_injury_to_alfalfa_e2310 (accessed on 6 April 2018).
- Berti, M.; Nudell, R.; Meyer, D.W. Fall harvesting of alfalfa in North Dakota impacts planr density, yield, and nutritive value. Forage Grazinglands. 2012. Available online: https://dl.sciencesocieties.org/publications/fg/abstracts/10/1/2012-0925-01-RS (accessed on 14 April 2018).
- Hakl, J.; Fuksa, P.; Santrucek, J.; Maskova, K. The development of lucerne root morphology traits under high initial stand density within a seven year period. Plant Soil Environ. 2011, 57, 81–87. [Google Scholar] [CrossRef] [Green Version]
- Durling, J.C.; Hesterman, O.B.; Rotz, C.A. Predicting first-cut alfalfa yields from preceding winter weather. J. Prod. Agric. 1992, 8, 254–259. [Google Scholar] [CrossRef]
- Risk Management Agency, Forage seeding Montana, North Dakota, South Dakota, and Wyoming. Available online: https://www.rma.usda.gov/fields/mt_rso/2018/2018forageseeding.pdf (accessed on 14 April 2018).
- Hall, M.H.; Dillon, J.M.; Stambaugh, H.J.; Hebrock, N.S.; Caddel, J.L.; Owens, V.N.; Sulc, R.M.; Undersander, D.J.; Whitesides, R.E. The Effects of Seeding Rate on Older Stands of Glyphosate-Tolerant Alfalfa. Agron. J. 2012, 104, 1096–1099. [Google Scholar] [CrossRef]
- Web Soil Survey. National Resources Conservation Service. United States Dep. of Agric.: Washington, DC, USA, 2009. Available online: http://websoilsurvey.nrcs.usda.gov/app/WebSoilSurvey.aspx (accessed on 12 April 2018).
- NDAWN. North Dakota Agricultural Weather Network. Available online: http://ndawn.ndsu.nodak.edu (accessed on 14 April 2018).
- Abrams, S.M.; Shenk, J.; Westerhaus, F.E. Determination of forage quality by near infrared reflectance spectroscopy: Efficacy of broad-based calibration equations. J. Dairy Sci. 1987, 70, 806–813. [Google Scholar] [CrossRef]
- SAS Institute. SAS User’s Guide: Statistics; SAS Inst.: Cary, NC, USA, 2014. [Google Scholar]
- Cooper, C.S.; Ditterline, R.L.; Welty, L.E. Seed size and seeding rate effects upon stand density and yield of alfalfa. Agron. J. 1979, 71, 83–85. [Google Scholar] [CrossRef]
- Stout, D.G. Effect of high lucerne (Medicago sativa L.) sowing rates on establishment year yield, stand persistence and forage quality. J. Agron. Crop Sci. 1998, 180, 39–43. [Google Scholar] [CrossRef]
- Dhont, C.; Castonguay, Y.; Nadeau, P.; Belanger, G.; Drapeau, R.; Chalifour, F.P. Untimely fall harvest affects dry matter yield and root organic reserves in field-grown alfalfa. Crop Sci. 2004, 44, 144–157. [Google Scholar] [CrossRef]
- Berti, M.; Aponte, A.; Samarappuli, D.; Teuber, O.; Lukacheswsky, J.; Nudell, R. Seeding Rates, and Plant and Stem Density as Tools to Estimate Forage Yield in Glyphosate-Tolerant Alfalfa. Available online: http://www.midwestforage.org/pdf/1010.pdf (accessed on 12 April 2018).
- Brothers, B.A.; Schmidt, J.R.; Kells, J.J.; Hesterman, O.B. Alfalfa establishment with and without spring-applied herbicides. J. Prod. Agric. 1994, 7, 494–501. [Google Scholar] [CrossRef]
- Dillehay, B.L.; Curran, W.S. Comparison of herbicide programs for weed control in glyphosate-resistant alfalfa. Weed Technol. 2010, 24, 130–138. [Google Scholar] [CrossRef]
- Kallenbach, R.L.; Nelson, C.J.; Coutts, J.H. Yield, quality, and persistence of grazing- and hay-type alfalfa under three harvest frequencies. Agron. J. 2002, 94, 1094–1103. [Google Scholar] [CrossRef]
- Iwaasa, A.D.; Beauchemin, K.A.; Acharya, S.N.; Bowley, S.R.; Buchanan-Smith, J.G. Shearing force of alfalfa stems as affected by seeding rate. Can. J. Plant Sci. 1998, 78, 273–280. [Google Scholar] [CrossRef] [Green Version]
Figure 1.
Rainfall, 30-year total monthly average rainfall, maximum, minimum, and average temperature, and monthly 30-year average air temperature; (a) Carrington, ND, (b) Fargo, ND, (c) Prosper, ND, from May 2013 to October 2016. Jan = January, Feb = February, Mar = March, Apr = April, Jun = June, Jul = July, Aug = August, Sep = September, Oct = October, Nov = November, Dec = December.
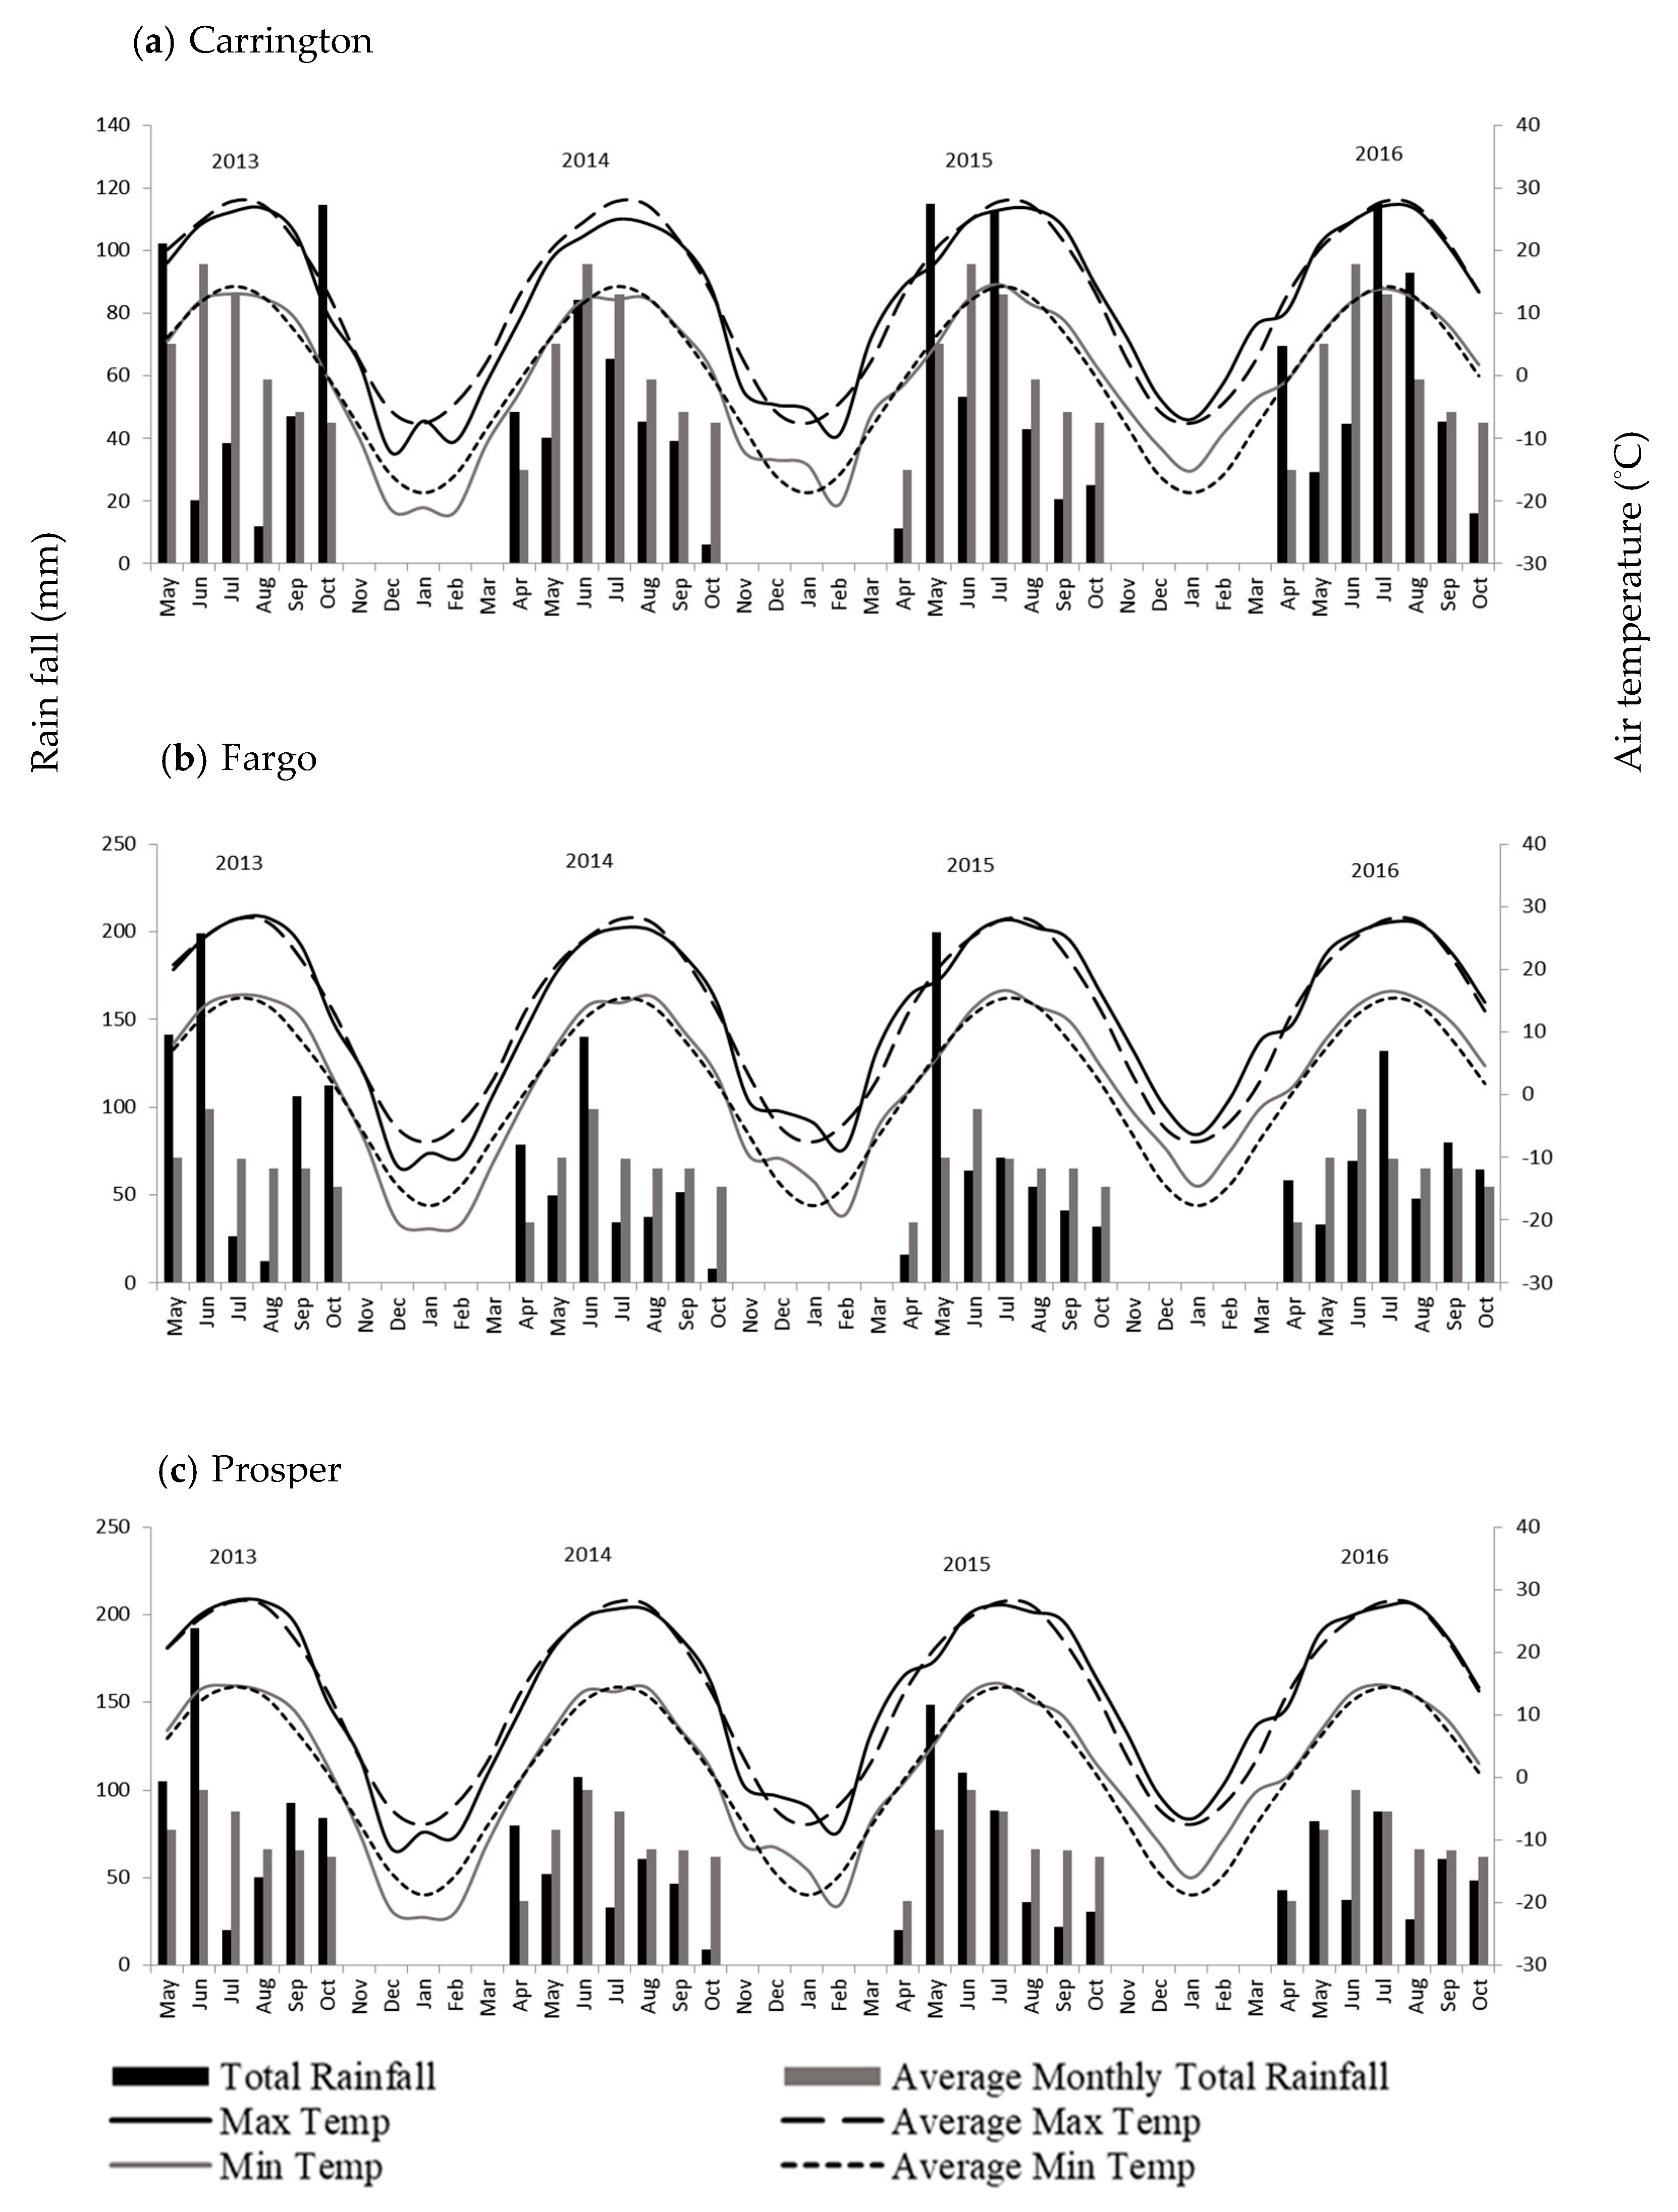
Figure 2.
Total seasonal forage yield and sowing rate in the sowing year and in the first year of production in alfalfa.
Figure 2.
Total seasonal forage yield and sowing rate in the sowing year and in the first year of production in alfalfa.

Figure 3.
Total seasonal forage yield of alfalfa affected by plant density in the (a) sowing year, (b) first production year, (c) second production year, and (d) third production year.
Figure 3.
Total seasonal forage yield of alfalfa affected by plant density in the (a) sowing year, (b) first production year, (c) second production year, and (d) third production year.

Figure 4.
Seasonal forage yield of alfalfa vs stem density in the (a) fall of sowing year, (b) first production year, (c) second production year, and (d) third production year.
Figure 4.
Seasonal forage yield of alfalfa vs stem density in the (a) fall of sowing year, (b) first production year, (c) second production year, and (d) third production year.


Table 1.
Harvest dates in all sites for each year.
| Site/Year Establishment | Sowing Year | Year 1 | Year 2 | Year 3 | ||||||||||
|---|---|---|---|---|---|---|---|---|---|---|---|---|---|---|
| H1 | H2 | H1 | H2 | H3 | H4 | H1 | H2 | H3 | H4 | H1 | H2 | H3 | H4 | |
| Fargo 2013 | 16-Jul | 30-Aug | 13-Jun | 17-Jul | 14-Aug | 8-Oct | 19-Jun | 14-Jul | 8-Aug | 16-Sep | 2-Jun | 28-Jun | 28-Jul | 26-Aug |
| Fargo 2014 | 31-Jul | 29-Aug | 19-Jun | 14-Jul | 10-Aug | 16-Sep | 2-Jun | 28-Jun | 28-Jul | 26-Aug | 2-Jun | 28-Jun | 28-Jul | 26-Aug |
| Prosper 2013 | 15-Jul | 23-Aug | 10-Jun | 16-Jul | 13-Aug | 9-Oct | 10-Jun | 7-Jul | 4-Aug | 11-Sep | 2-Jun | 28-Jun | 27-Jul | 29-Aug |
| Prosper 2014 | 21-Jul | 13-Aug | 9-Jun | 7-Jul | 4-Aug | 11-Sep | 2-Jun | 28-Jun | 28-Jul | 26-Aug | 2-Jun | 28-Jun | 27-Jul | 29-Aug |
| Carrington 2013 | 17-Jul | 15-Sep | 17-Jun | 25-Jul | 3-Sep | 18-Jun | 23-Jul | 2-Sep | 8-Jun | |||||
H = Harvest, Jun = June, Jul = July, Aug = August, Sep = September.
Table 2.
Predicted plant and stem density to maximize total seasonal forage yield in different production years and Risk Management Agency (RMA) [17] required plant density for insurance purposes in non-irrigated alfalfa for eastern North Dakota.
Table 2.
Predicted plant and stem density to maximize total seasonal forage yield in different production years and Risk Management Agency (RMA) [17] required plant density for insurance purposes in non-irrigated alfalfa for eastern North Dakota.
| Production Year | Maximum Yield † (kg ha−1) | Plant Density (plants m−2) | RMA Plant Density (plants m−2) | Maximum Yield ± (kg ha−1) | Stem Density (stems m−2) |
|---|---|---|---|---|---|
| Sowing | 2.64 | 73 | 107 | 2.90 | 575 |
| First | 5.92 | 52 | 81 | 5.01 | 495 |
| Second | 5.65 | 37 | 54 | 5.34 | 435 |
| Third | 7.19 | 36 | 41 | 7.38 | 427 |
† Maximum yield was predicted using the prediction equation with plant density as the independent variable. ± Maximum yield was predicted using the prediction equation with stem density as the independent variable.
Table 3.
Mean alfalfa forage nutritive quality components at first harvest for different sowing rates in the sowing year, first production year, second production year, and third production year, averaged across sites in Fargo, Carrington, and Prosper, ND.
Table 3.
Mean alfalfa forage nutritive quality components at first harvest for different sowing rates in the sowing year, first production year, second production year, and third production year, averaged across sites in Fargo, Carrington, and Prosper, ND.
| Sowing Rate | CP | ADF | NDF | NDFD | Ash |
|---|---|---|---|---|---|
| kg ha−1 | g kg−1 | ||||
| Sowing Year | |||||
| 1 | 251 | 287 | 317 | 352 | 144 |
| 5 | 244 | 284 | 322 | 380 | 137 |
| 10 | 240 | 290 | 327 | 395 | 132 |
| 15 | 246 | 287 | 325 | 388 | 136 |
| 20 | 240 | 283 | 322 | 403 | 131 |
| 25 | 241 | 286 | 329 | 405 | 133 |
| LSD (p = 0.05) | NS | NS | NS | NS | NS |
| First Production Year | |||||
| 1 | 248 | 294 | 358 | 386 | 108 |
| 5 | 239 | 306 | 370 | 375 | 113 |
| 10 | 238 | 311 | 380 | 383 | 108 |
| 15 | 239 | 317 | 386 | 375 | 110 |
| 20 | 240 | 308 | 375 | 387 | 109 |
| 25 | 239 | 313 | 384 | 387 | 109 |
| LSD (p = 0.05) | NS | 14 | 14 | NS | NS |
| Second Production Year | |||||
| 1 | 233 | 329 | 448 | 433 | 74 |
| 5 | 231 | 337 | 457 | 436 | 74 |
| 10 | 228 | 339 | 461 | 431 | 76 |
| 15 | 232 | 332 | 456 | 428 | 74 |
| 20 | 232 | 332 | 456 | 430 | 74 |
| 25 | 229 | 335 | 458 | 429 | 75 |
| LSD (p = 0.05) | NS | NS | NS | NS | NS |
| Third Production Year | |||||
| 1 | 225 | 339 | 463 | 449 | 74 |
| 5 | 229 | 333 | 456 | 451 | 76 |
| 10 | 221 | 347 | 470 | 440 | 79 |
| 15 | 220 | 349 | 468 | 438 | 84 |
| 20 | 223 | 340 | 461 | 442 | 82 |
| 25 | 224 | 336 | 460 | 446 | 82 |
| LSD (p = 0.05) | NS | NS | NS | NS | NS |
CP = Crude protein, NDF = Neutral detergent fiber, ADF = Acid detergent fiber, NDFD = Neutral detergent fiber digestibility.
© 2018 by the authors. Licensee MDPI, Basel, Switzerland. This article is an open access article distributed under the terms and conditions of the Creative Commons Attribution (CC BY) license (http://creativecommons.org/licenses/by/4.0/).
Share and Cite
MDPI and ACS Style
Berti, M.T.; Samarappuli, D. How Does Sowing Rate Affect Plant and Stem Density, Forage Yield, and Nutritive Value in Glyphosate-Tolerant Alfalfa? Agronomy 2018, 8, 169. https://doi.org/10.3390/agronomy8090169
AMA Style
Berti MT, Samarappuli D. How Does Sowing Rate Affect Plant and Stem Density, Forage Yield, and Nutritive Value in Glyphosate-Tolerant Alfalfa? Agronomy. 2018; 8(9):169. https://doi.org/10.3390/agronomy8090169
Chicago/Turabian StyleBerti, Marisol T., and Dulan Samarappuli. 2018. "How Does Sowing Rate Affect Plant and Stem Density, Forage Yield, and Nutritive Value in Glyphosate-Tolerant Alfalfa?" Agronomy 8, no. 9: 169. https://doi.org/10.3390/agronomy8090169
Note that from the first issue of 2016, this journal uses article numbers instead of page numbers. See further details here.