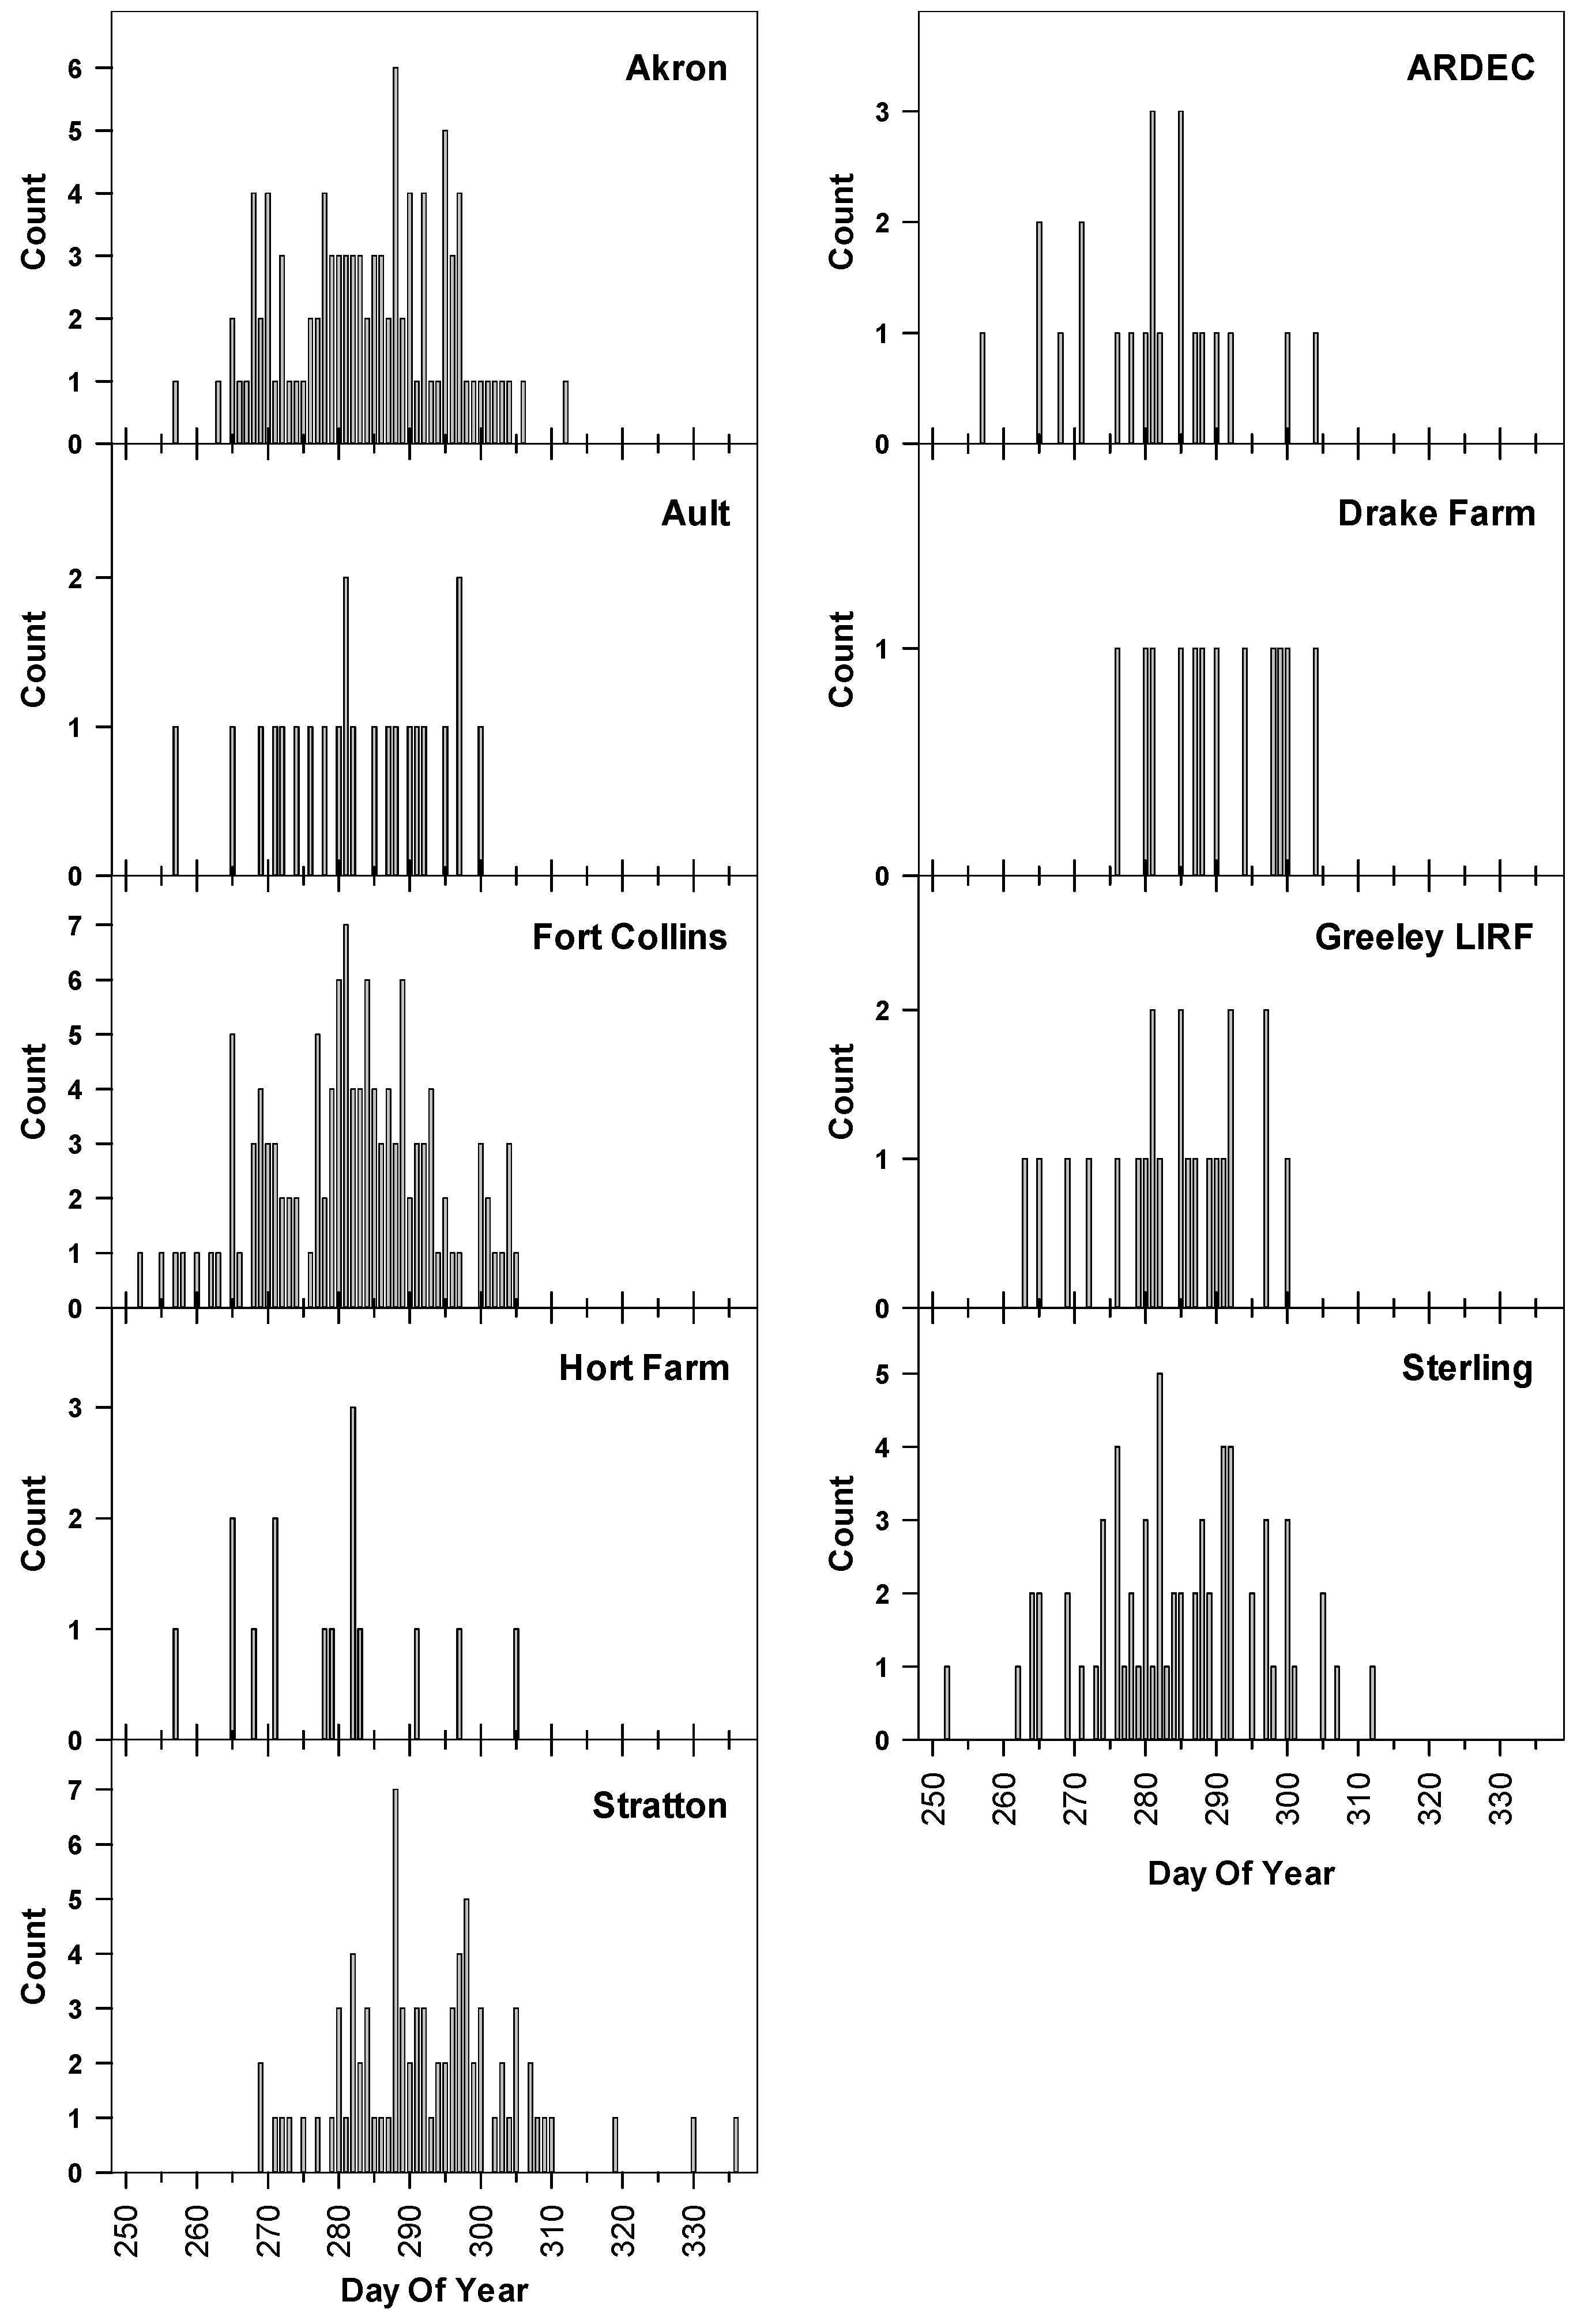
Figure 1.
Frequency distribution of first frost date in a year for nine locations.
Figure 1.
Frequency distribution of first frost date in a year for nine locations.
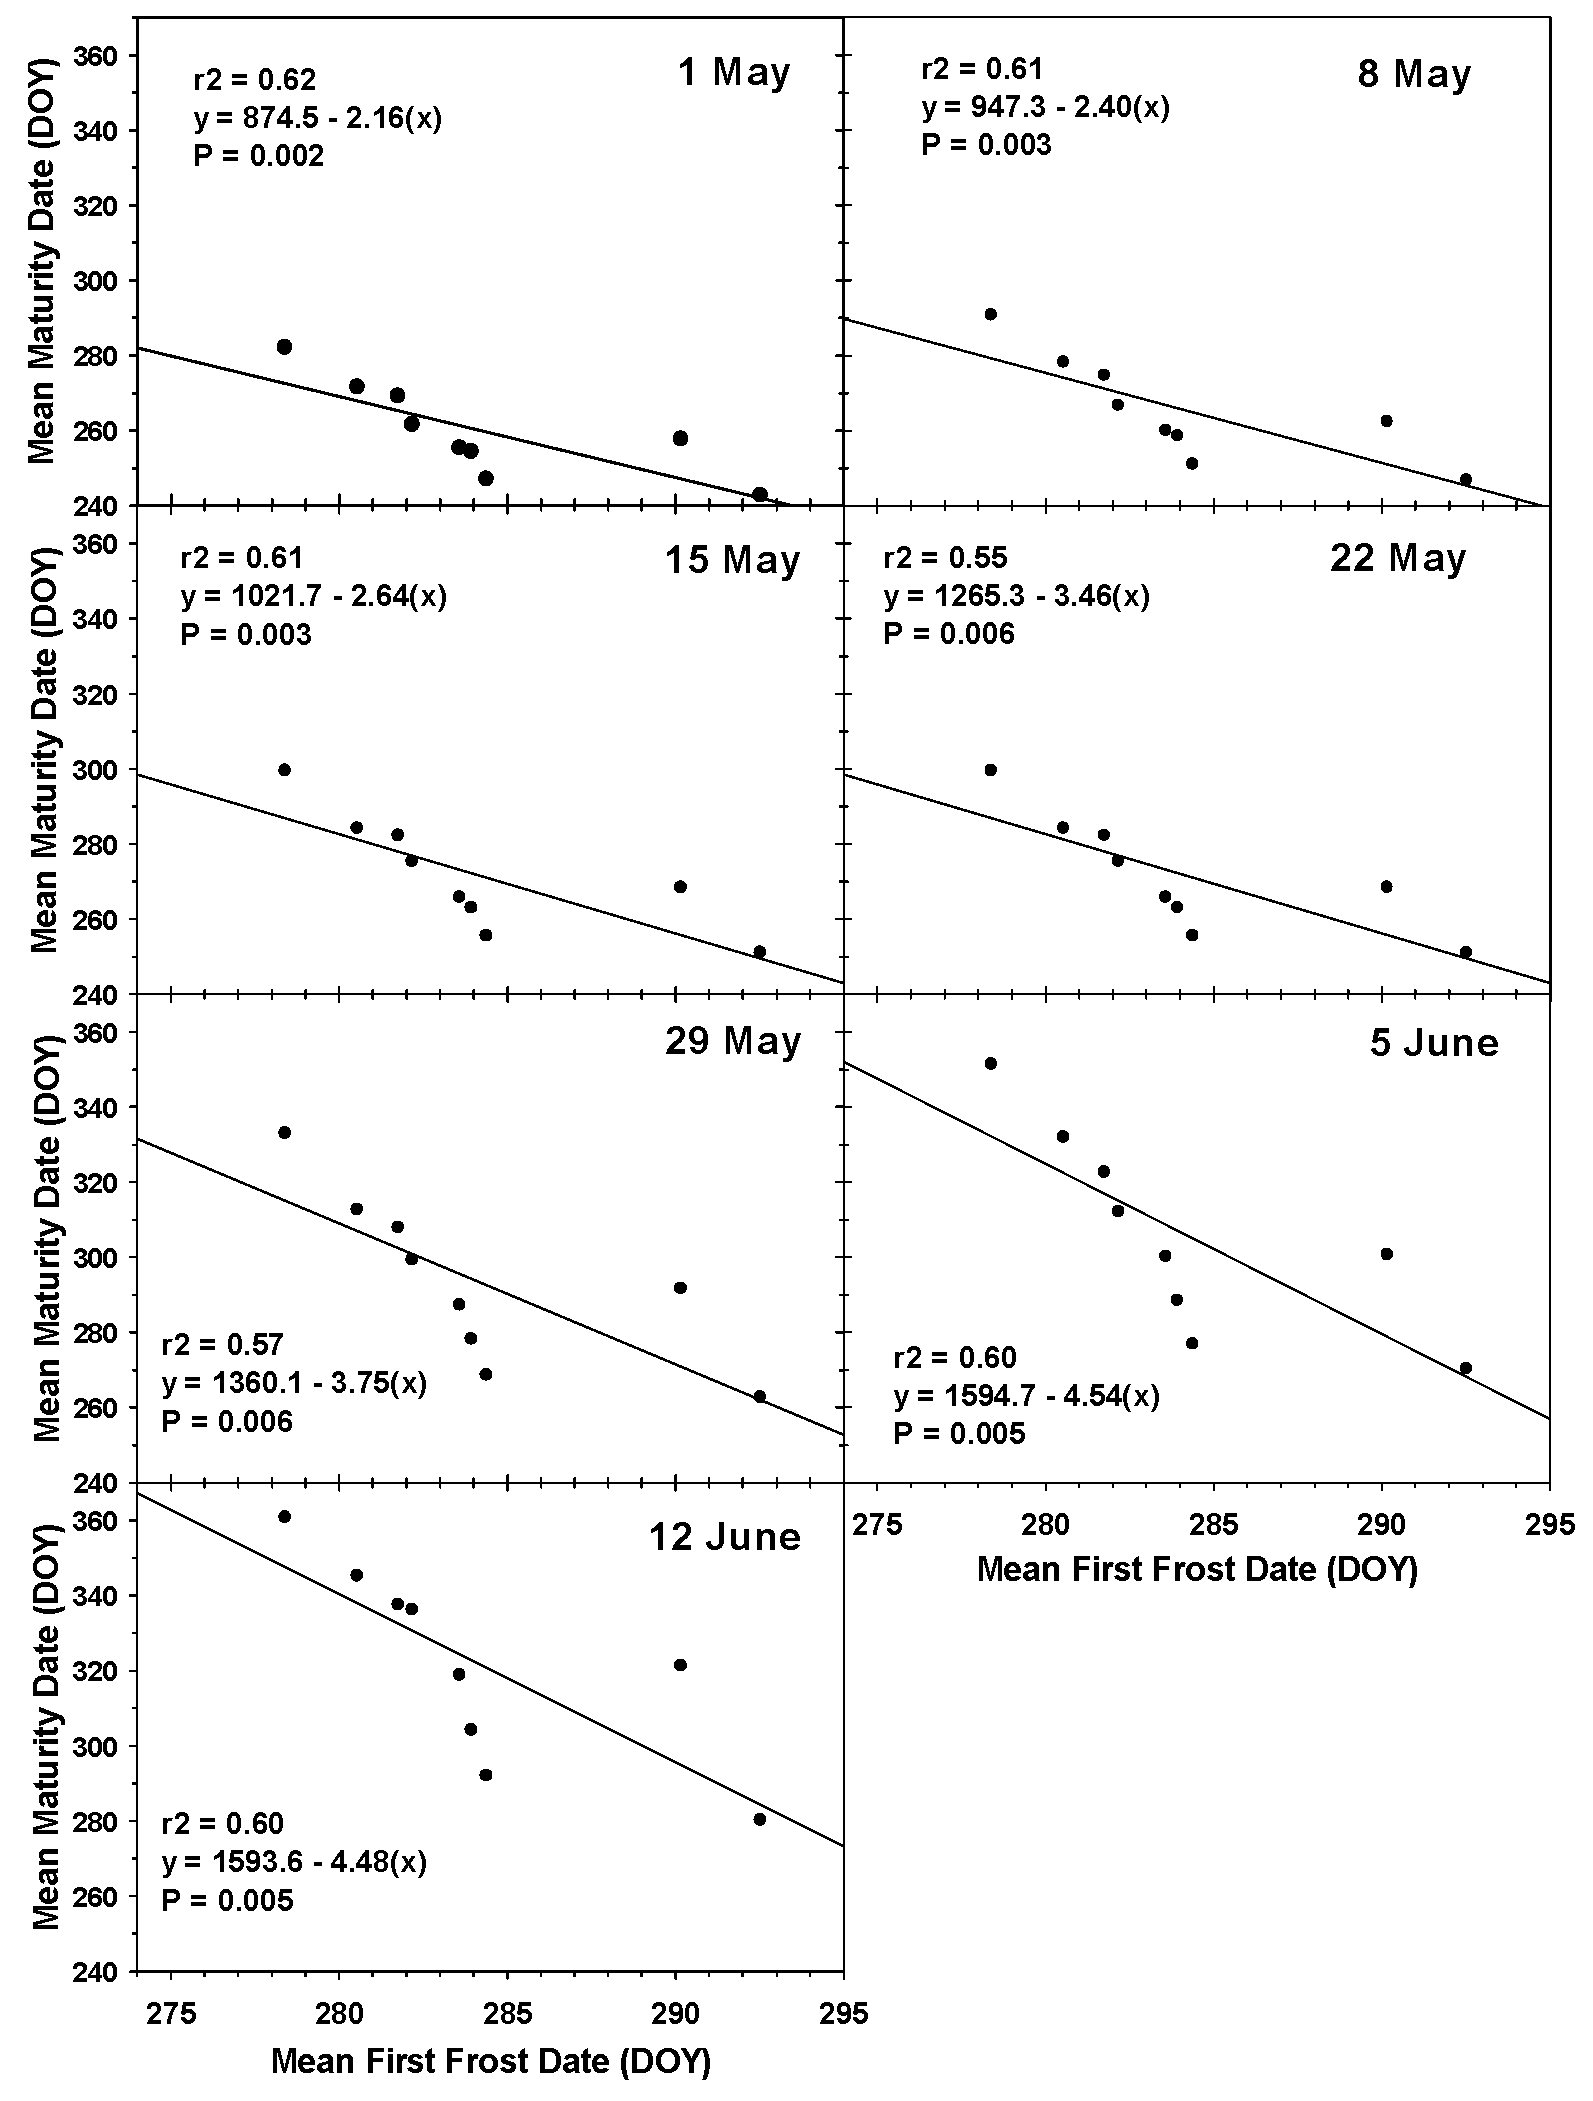
Figure 2.
Relationship between mean first frost date and mean maturity date of nine locations in northeastern Colorado for seven planting dates. Dryland (GS) phenological parameters, Early maturity class, and Optimum seedbed water conditions at planting were used for simulating maturity date. If maturity was not predicted by the end of the year, maturity date was set to 31 December. Linear regression lines are given with associated r2 and probability of significance.
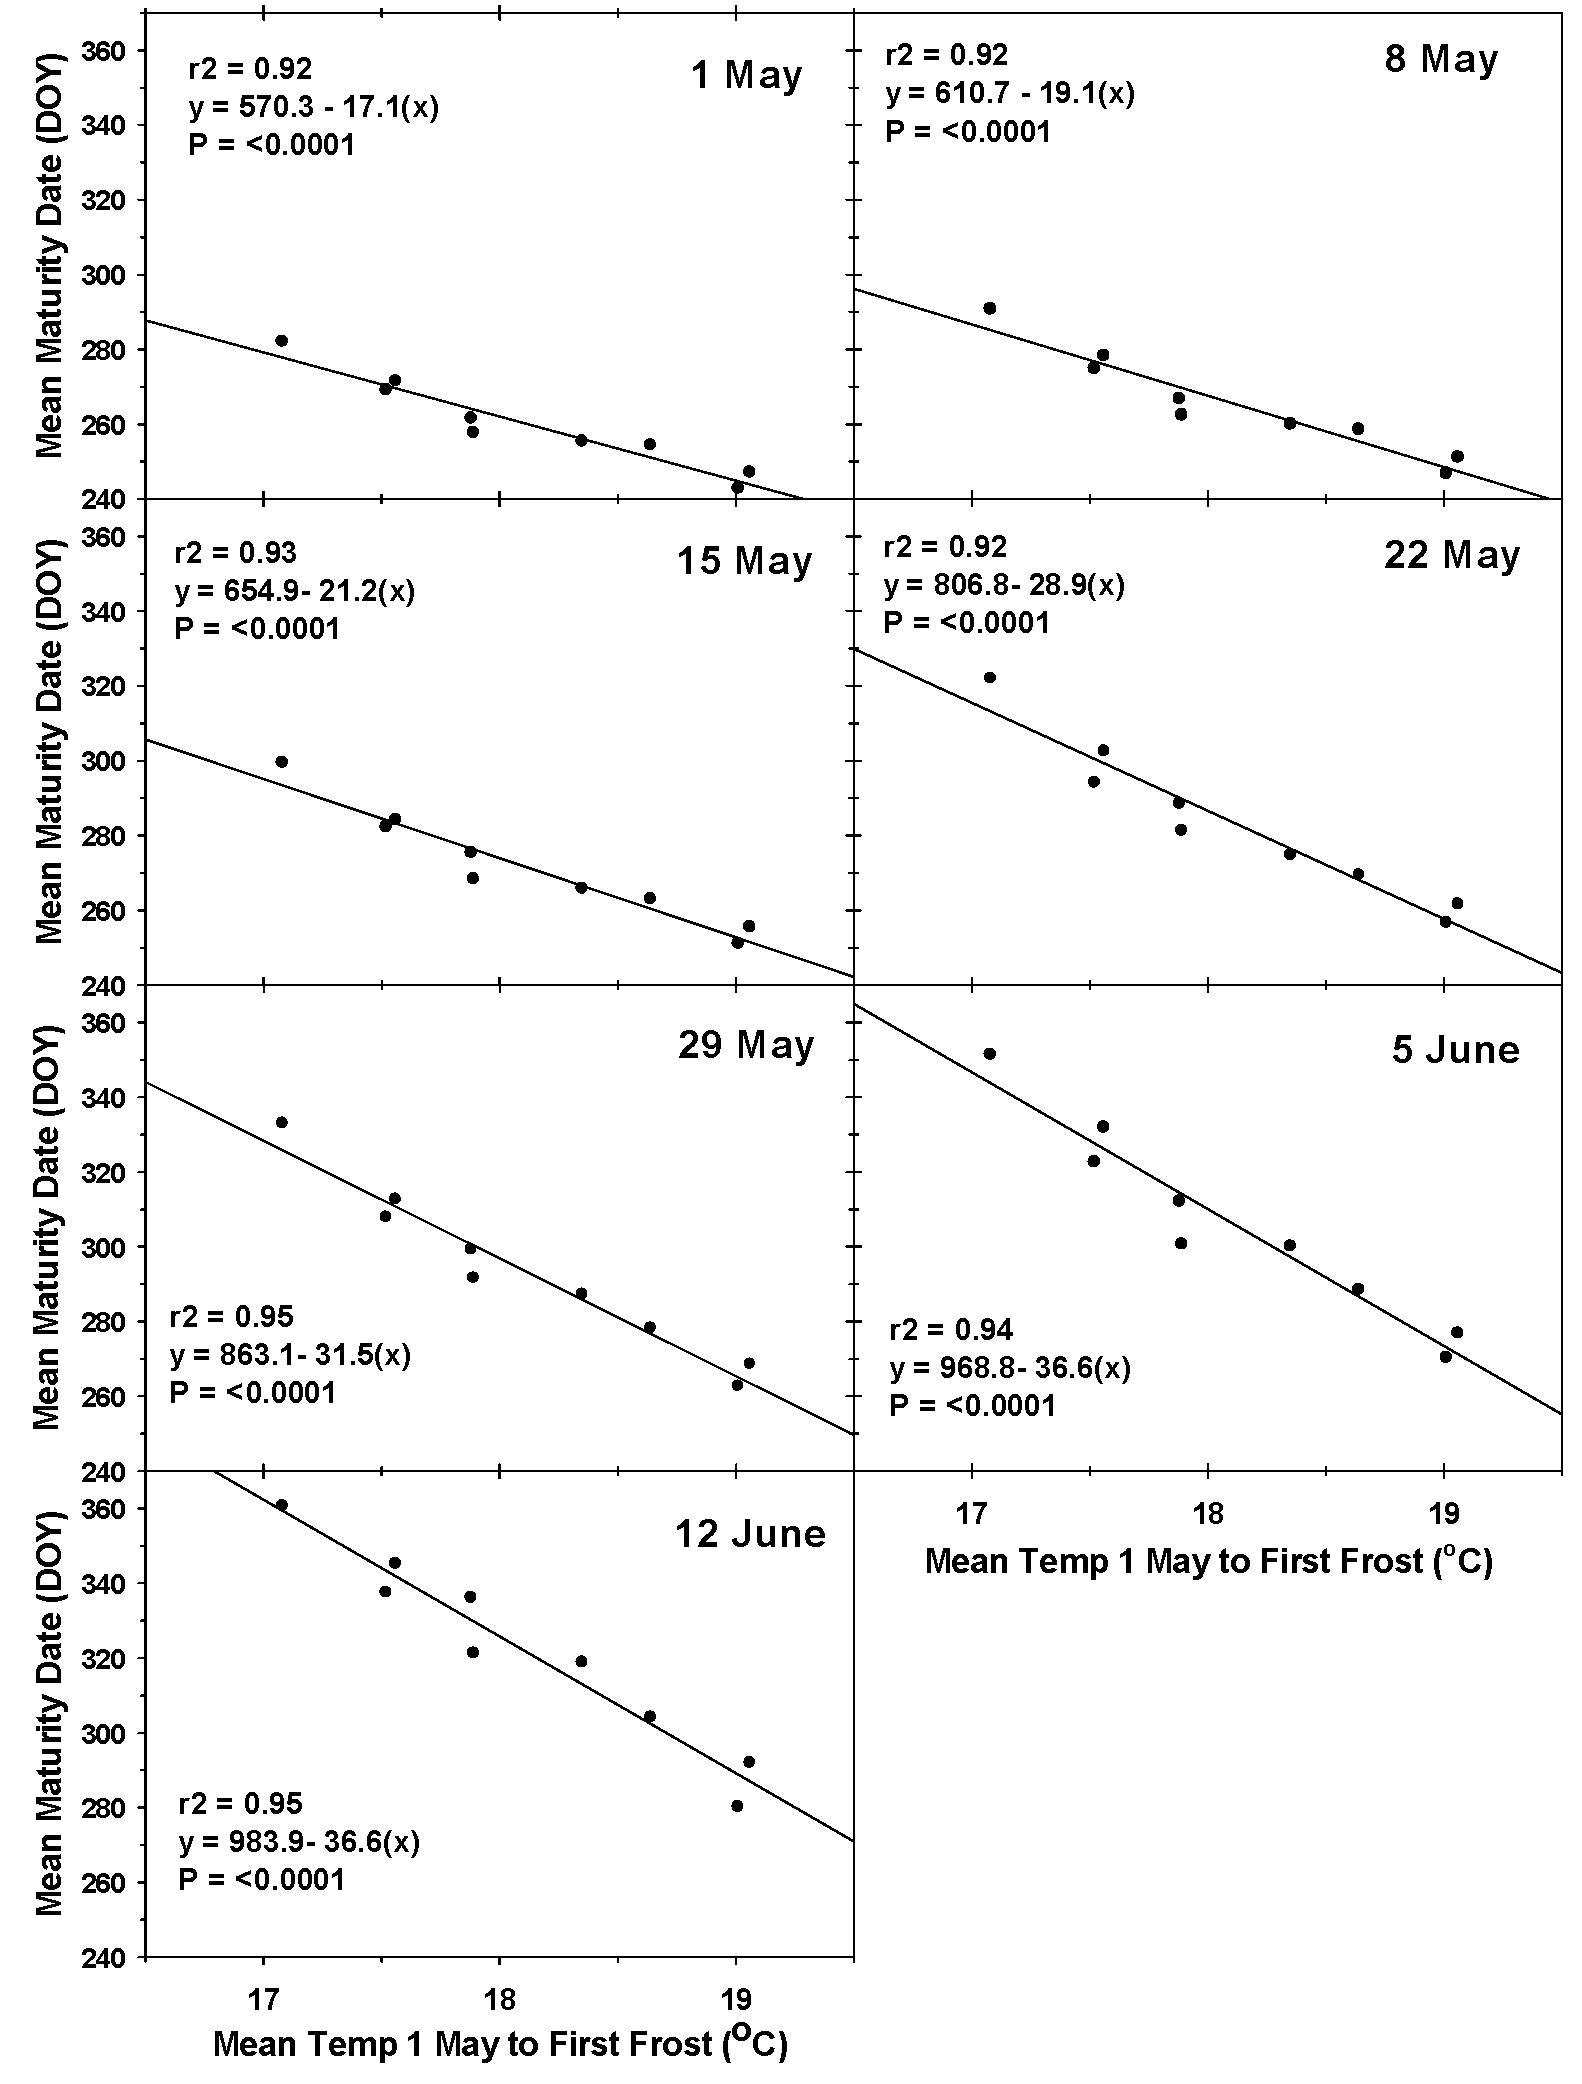
Figure 3.
Relationship between mean temperature from 1 May to the mean first frost date and mean maturity date of nine locations in northeastern Colorado for seven planting dates. Dryland (GS) phenological parameters, Early maturity class, and Optimum seedbed water conditions at planting were used for simulating maturity date. If maturity was not predicted by the end of the year, maturity date was set to 31 December. Linear regression lines are given with associated r2 and probability of significance.
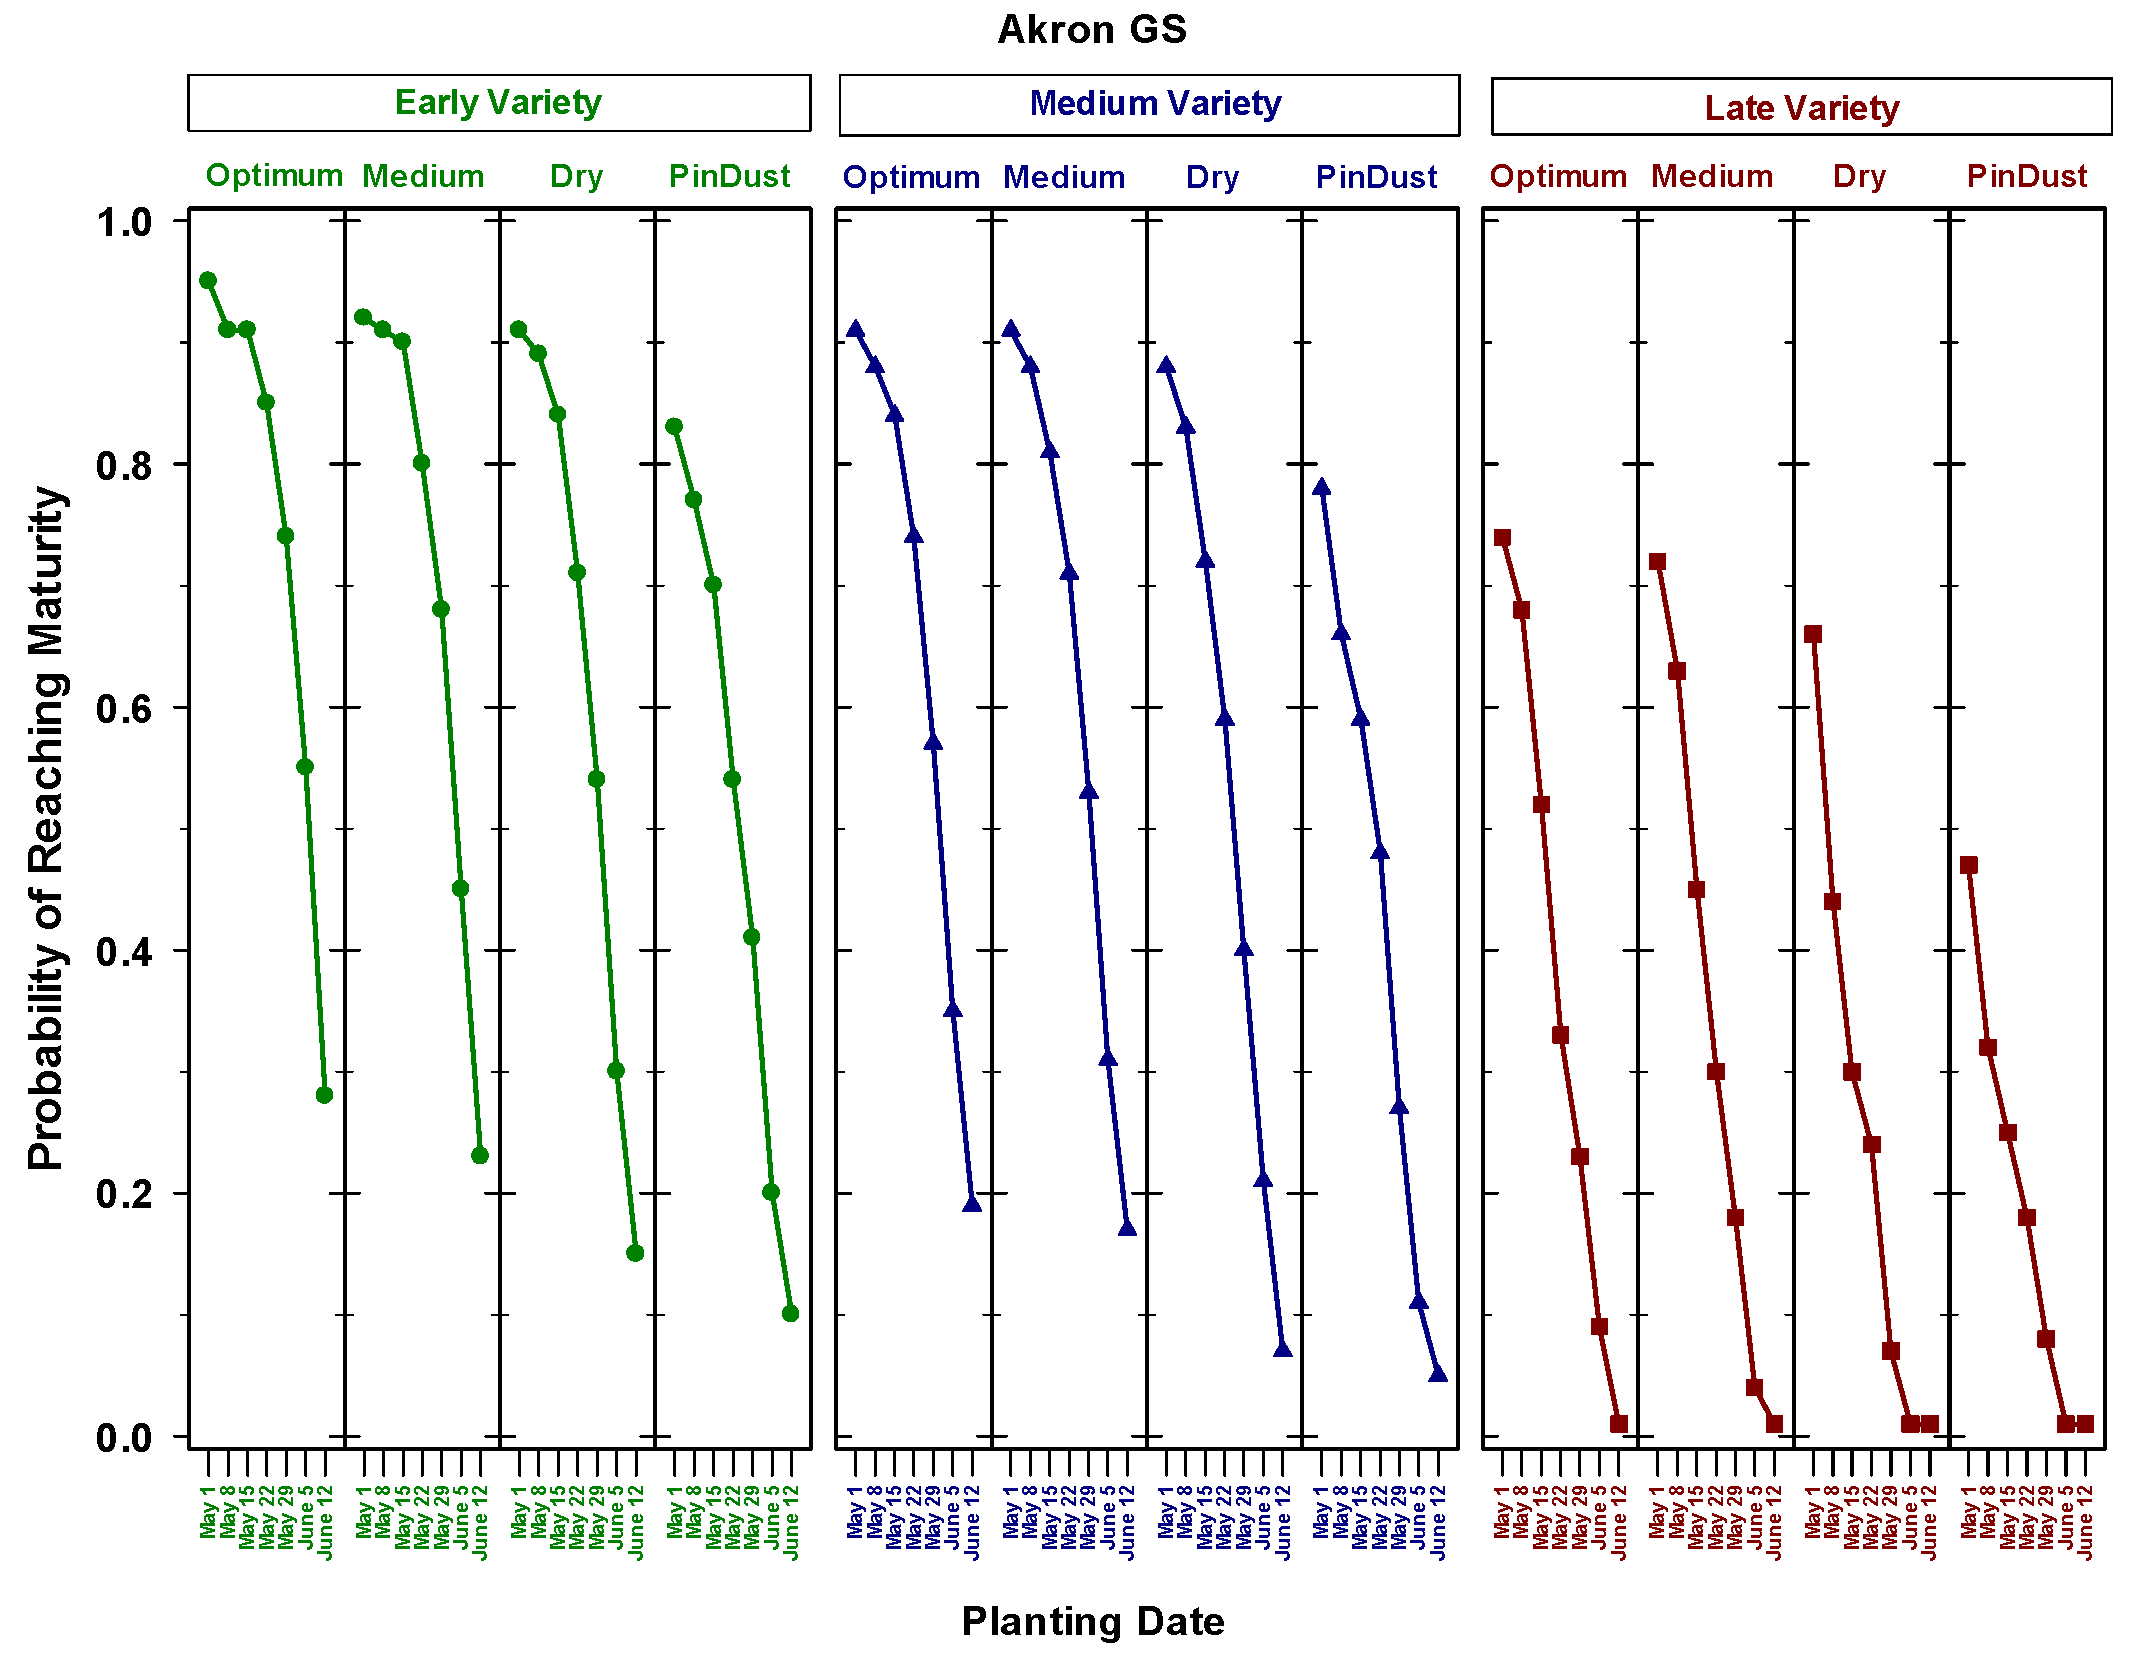
Figure 4.
Probability of sorghum reaching physiological maturity at Akron, Colorado, for seven planting dates using non-stressed (GS) phenological parameters, three maturity classes, and four seedbed water conditions at planting.
Figure 4.
Probability of sorghum reaching physiological maturity at Akron, Colorado, for seven planting dates using non-stressed (GS) phenological parameters, three maturity classes, and four seedbed water conditions at planting.
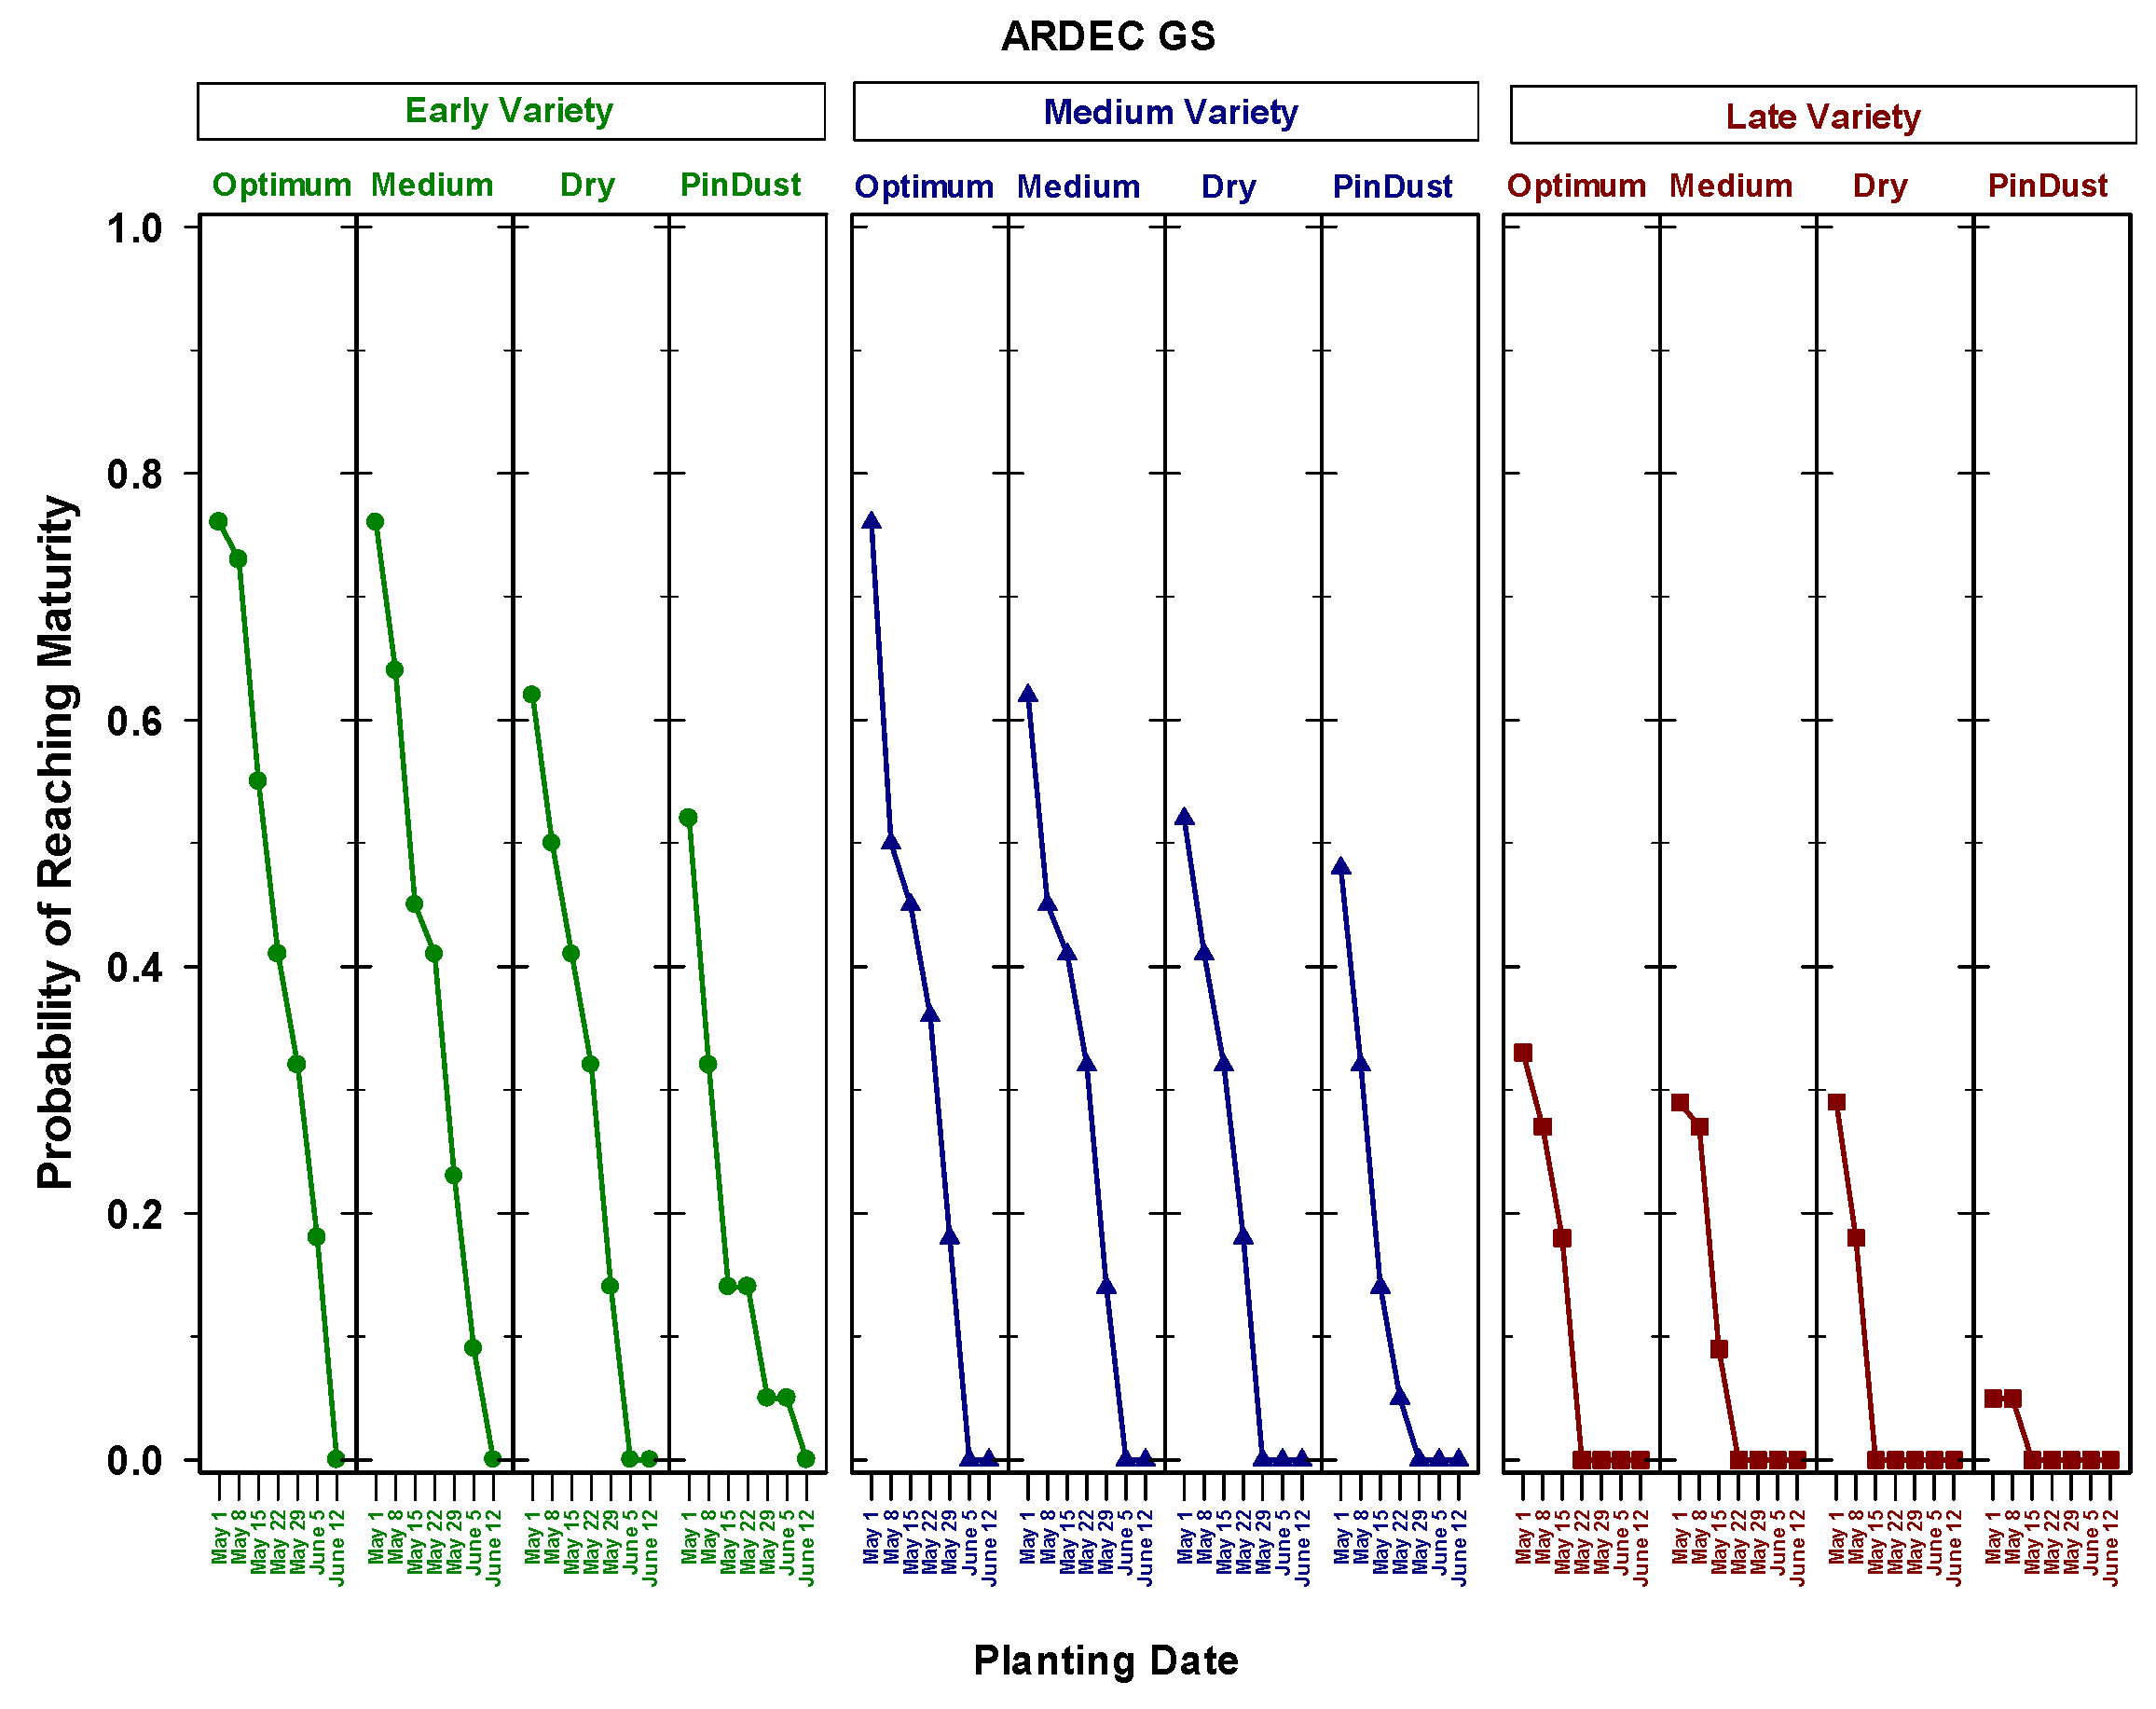
Figure 5.
Probability of sorghum reaching physiological maturity at ARDEC, Colorado, for seven planting dates using non-stressed (GS) phenological parameters, three maturity classes, and four seedbed water conditions at planting.
Figure 5.
Probability of sorghum reaching physiological maturity at ARDEC, Colorado, for seven planting dates using non-stressed (GS) phenological parameters, three maturity classes, and four seedbed water conditions at planting.
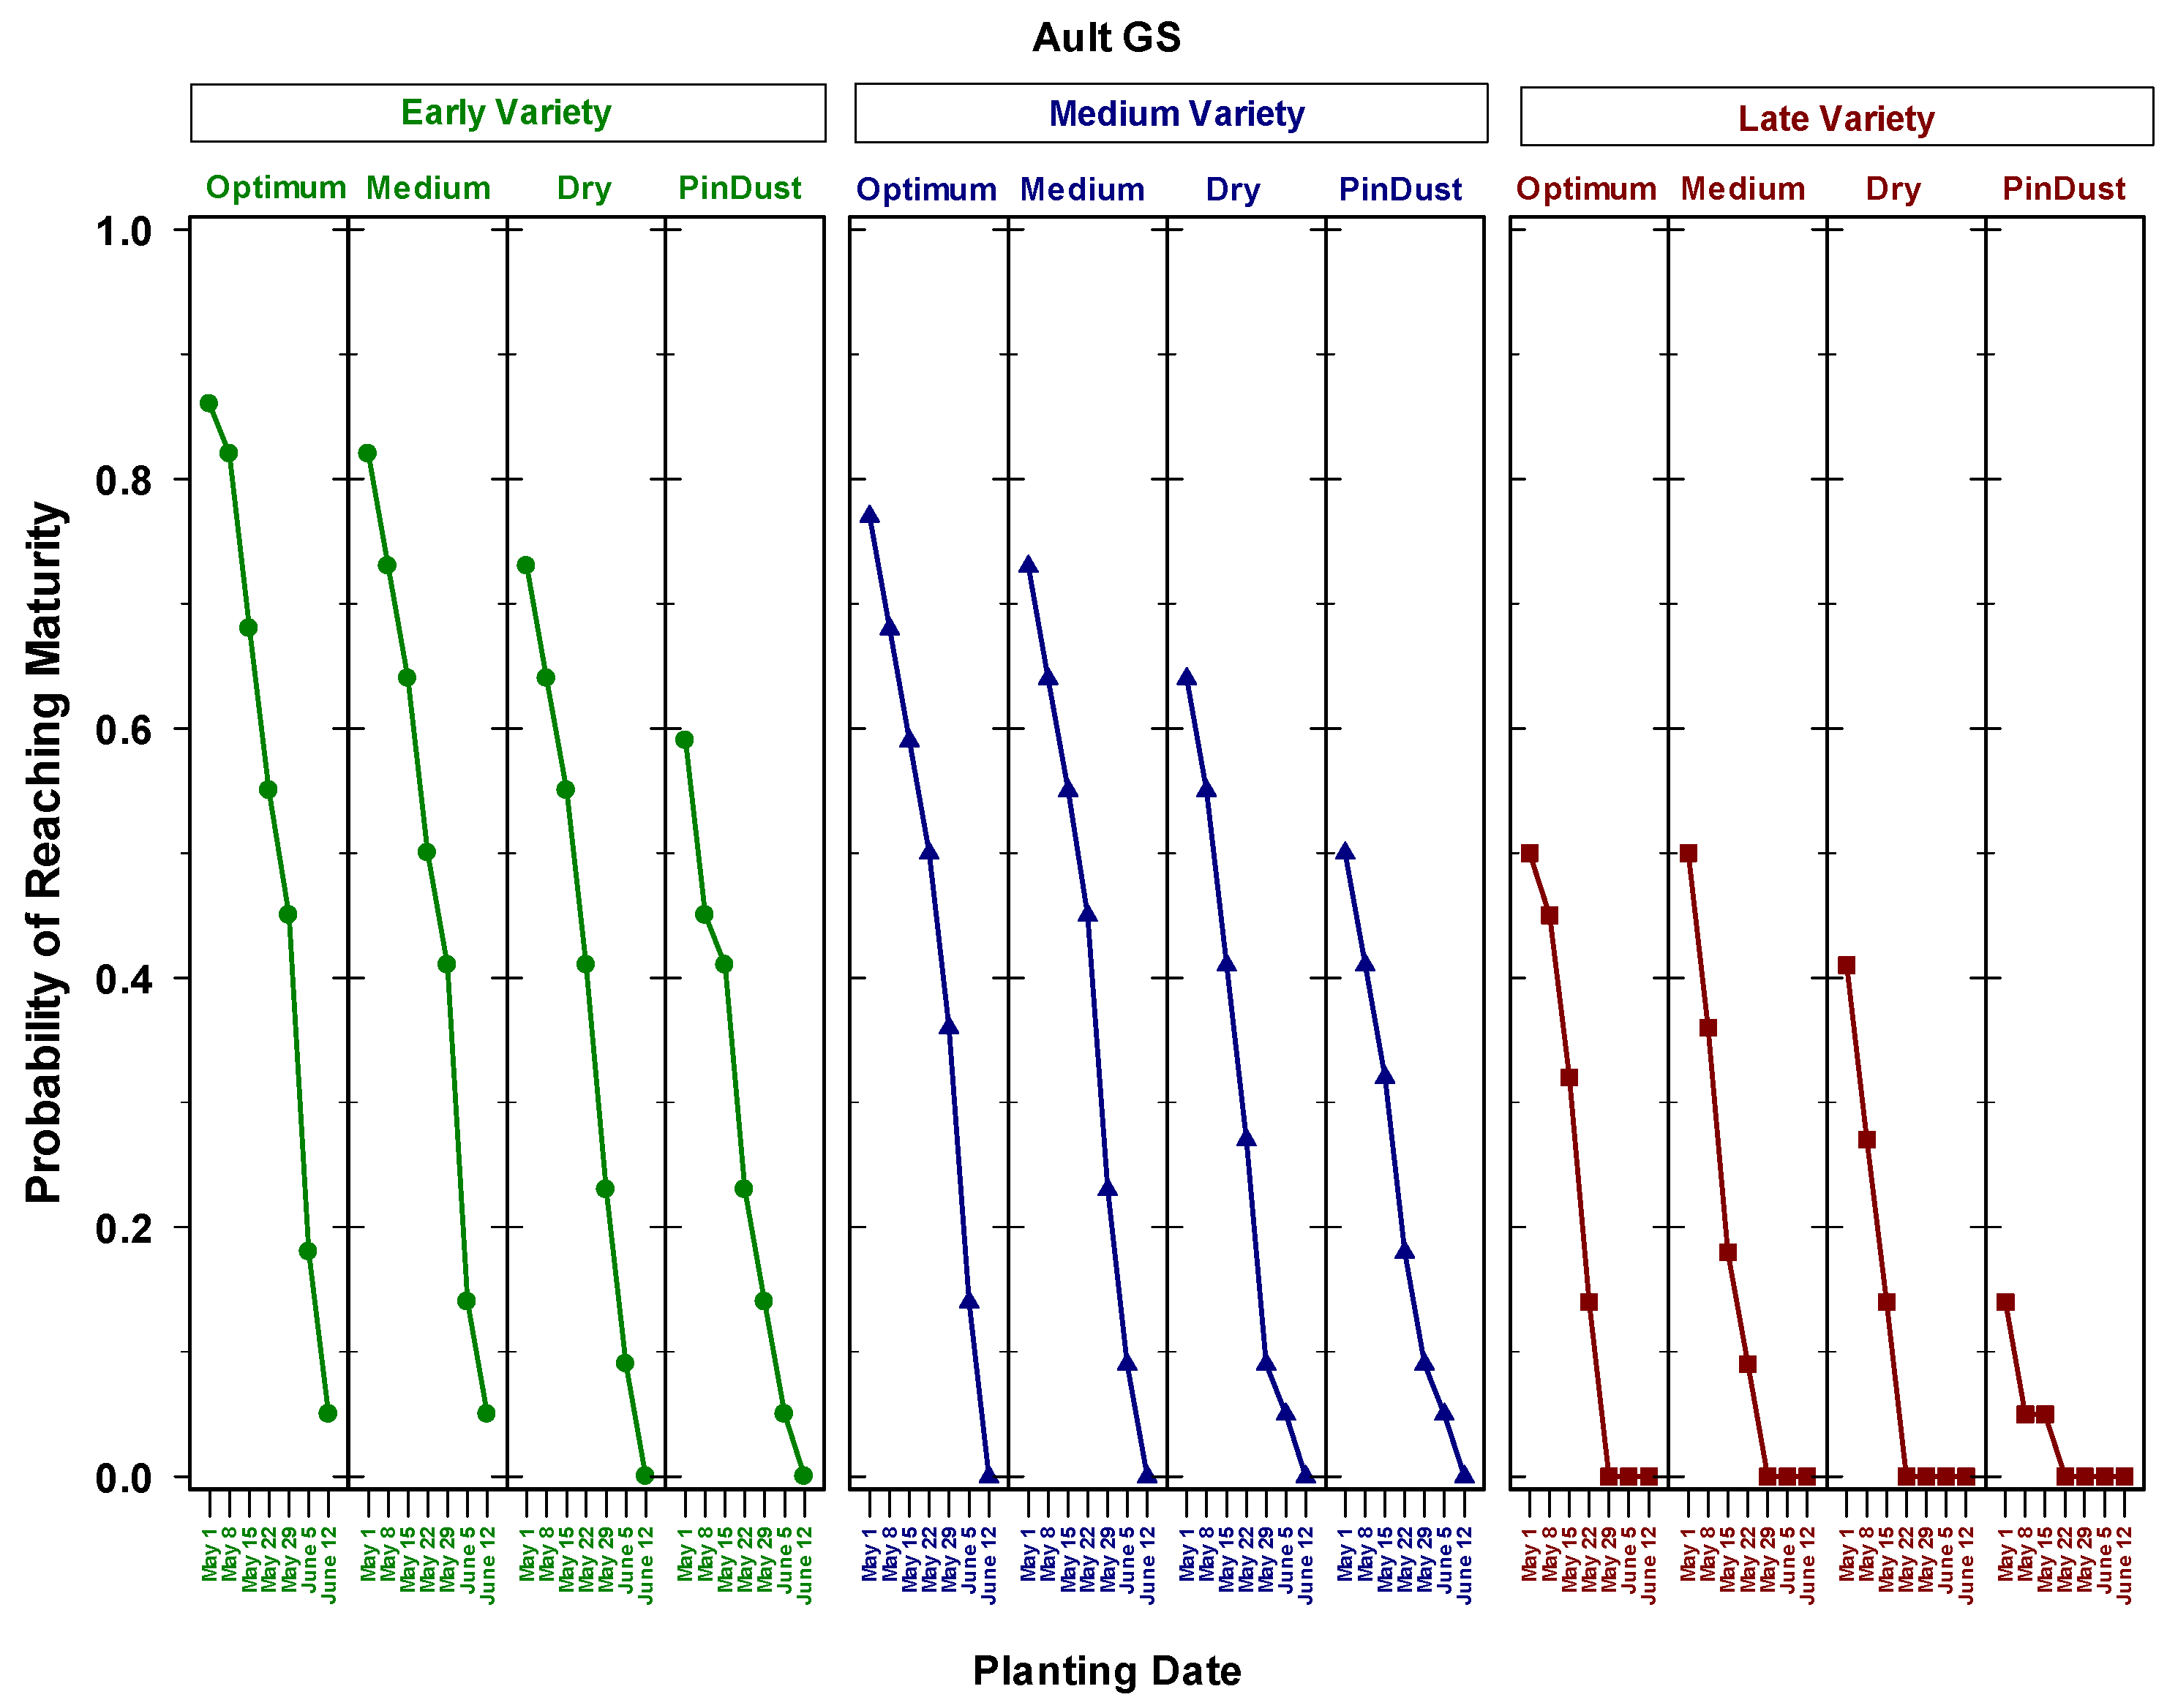
Figure 6.
Probability of sorghum reaching physiological maturity at Ault, Colorado, for seven planting dates using non-stressed (GS) phenological parameters, three maturity classes, and four seedbed water conditions at planting.
Figure 6.
Probability of sorghum reaching physiological maturity at Ault, Colorado, for seven planting dates using non-stressed (GS) phenological parameters, three maturity classes, and four seedbed water conditions at planting.
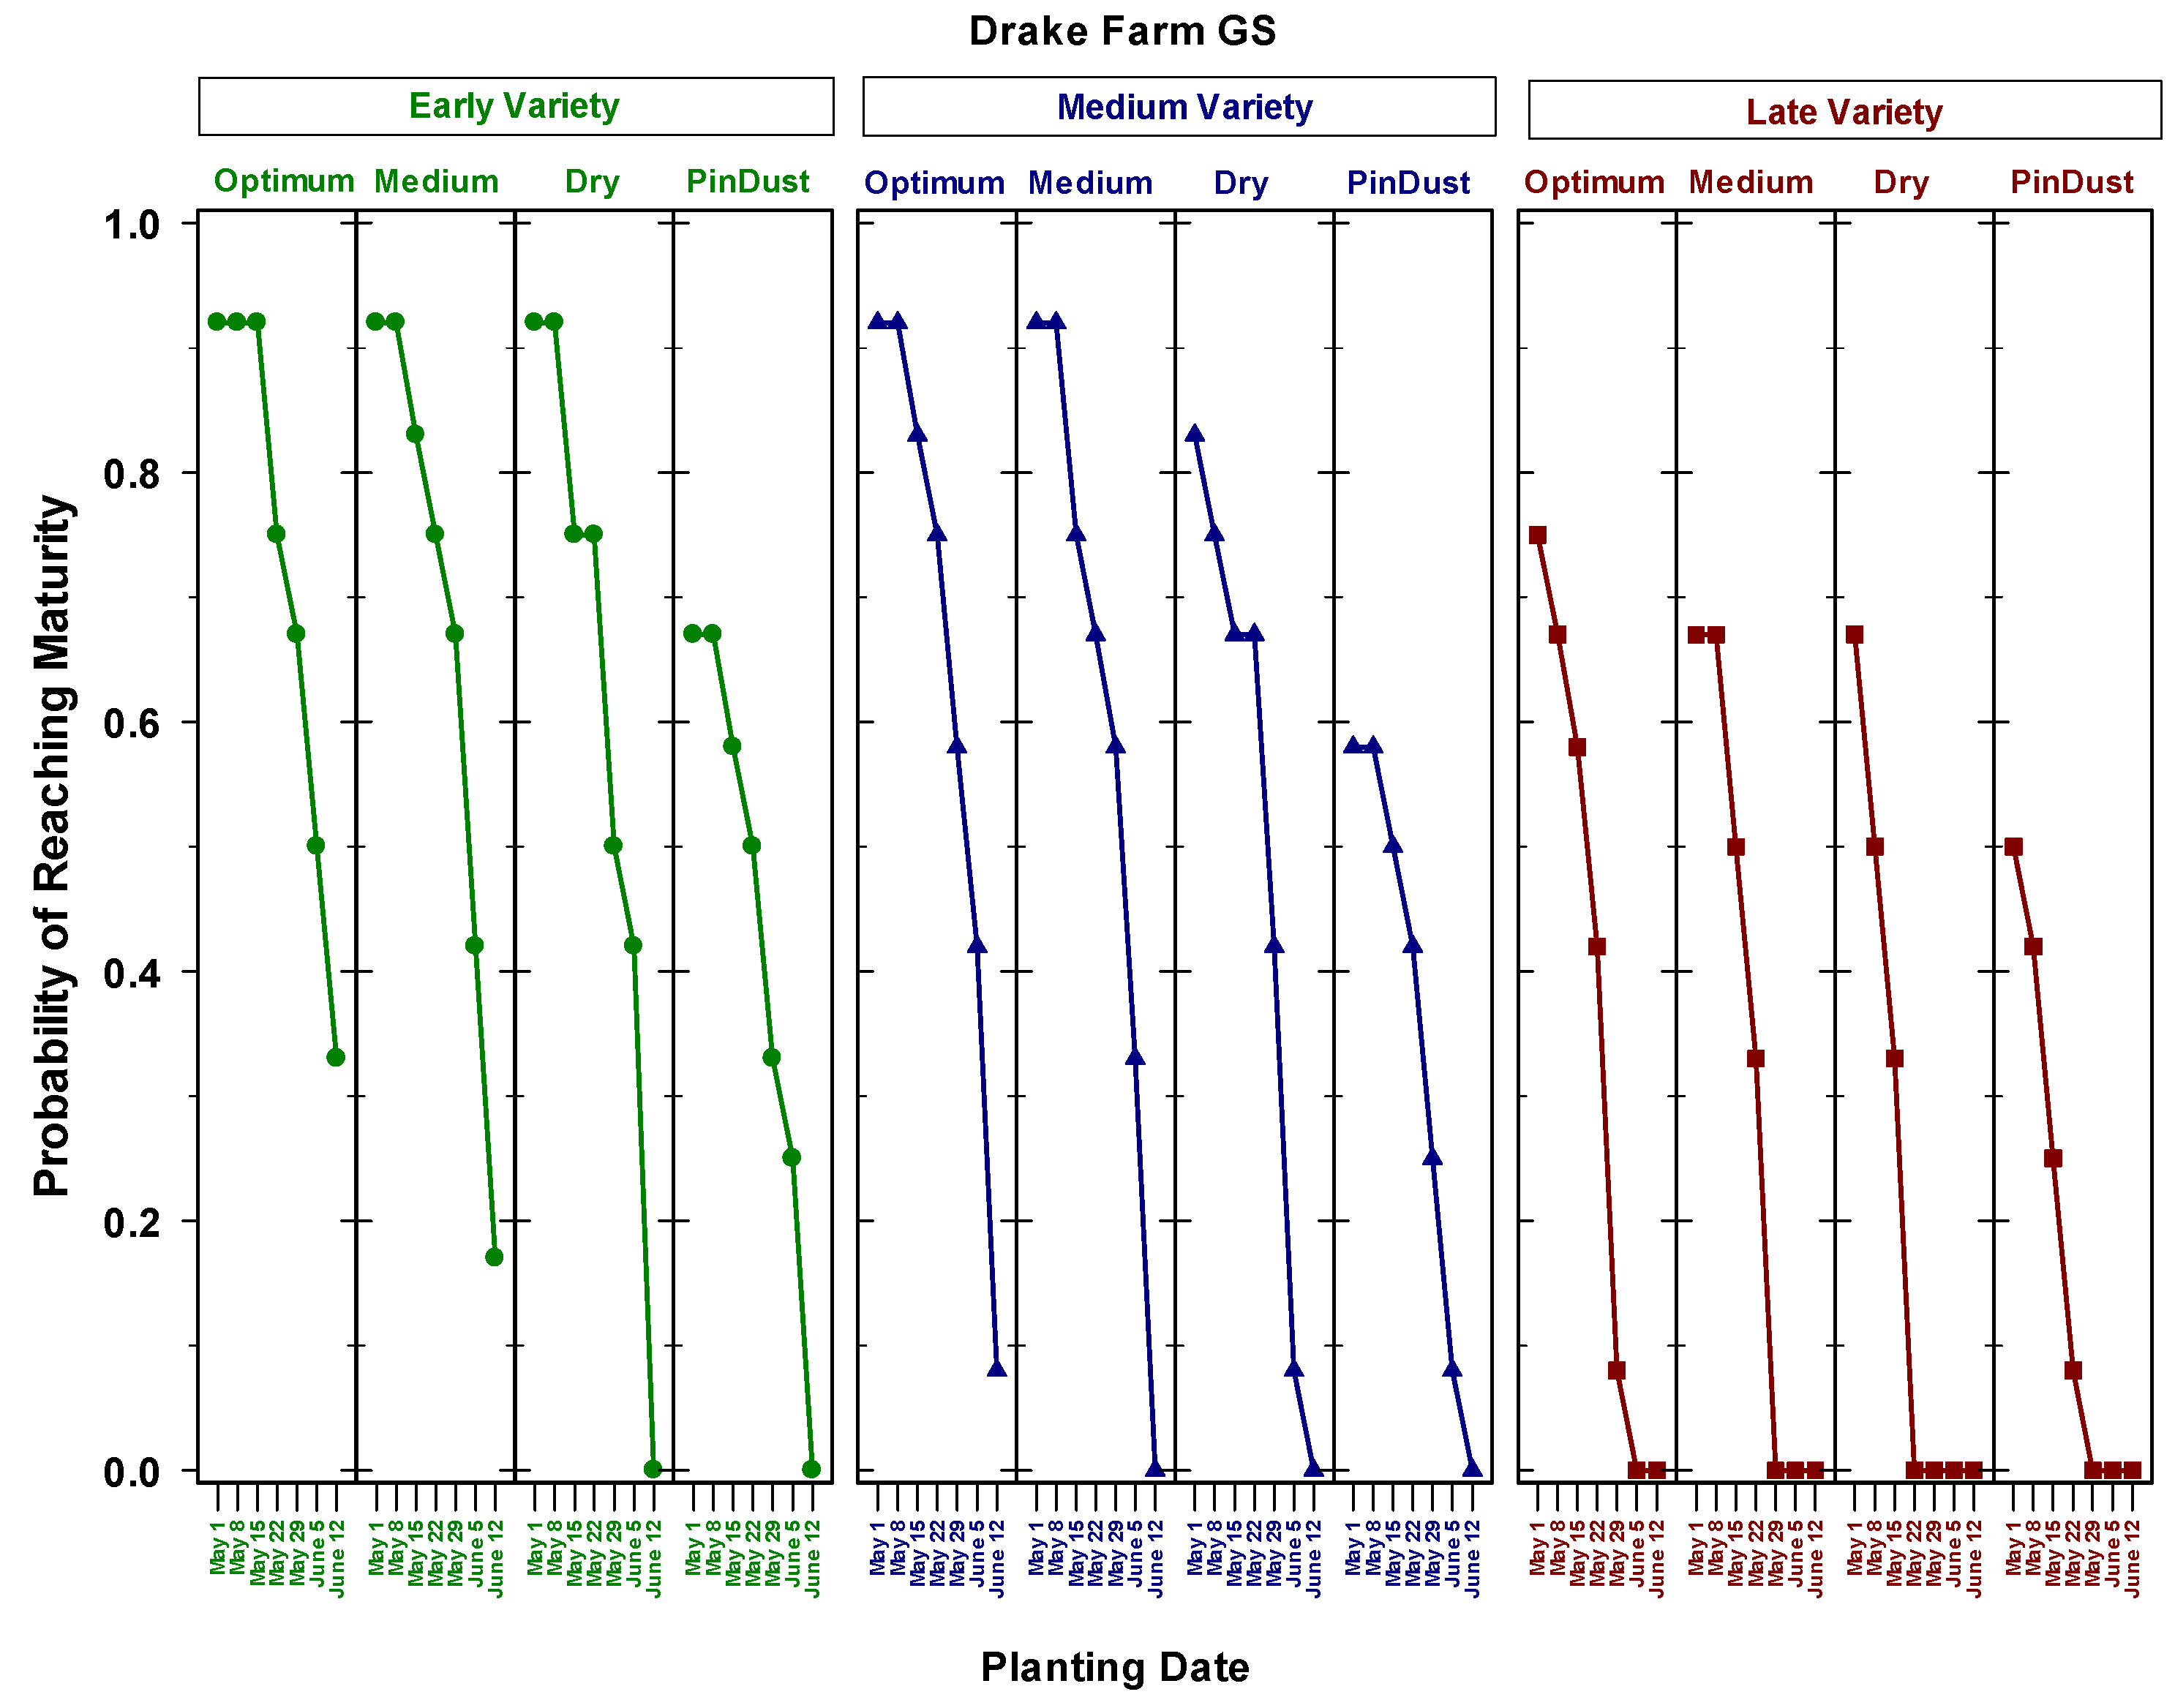
Figure 7.
Probability of sorghum reaching physiological maturity at Drake Farm, Colorado, for seven planting dates using non-stressed (GS) phenological parameters, three maturity classes, and four seedbed water conditions at planting.
Figure 7.
Probability of sorghum reaching physiological maturity at Drake Farm, Colorado, for seven planting dates using non-stressed (GS) phenological parameters, three maturity classes, and four seedbed water conditions at planting.
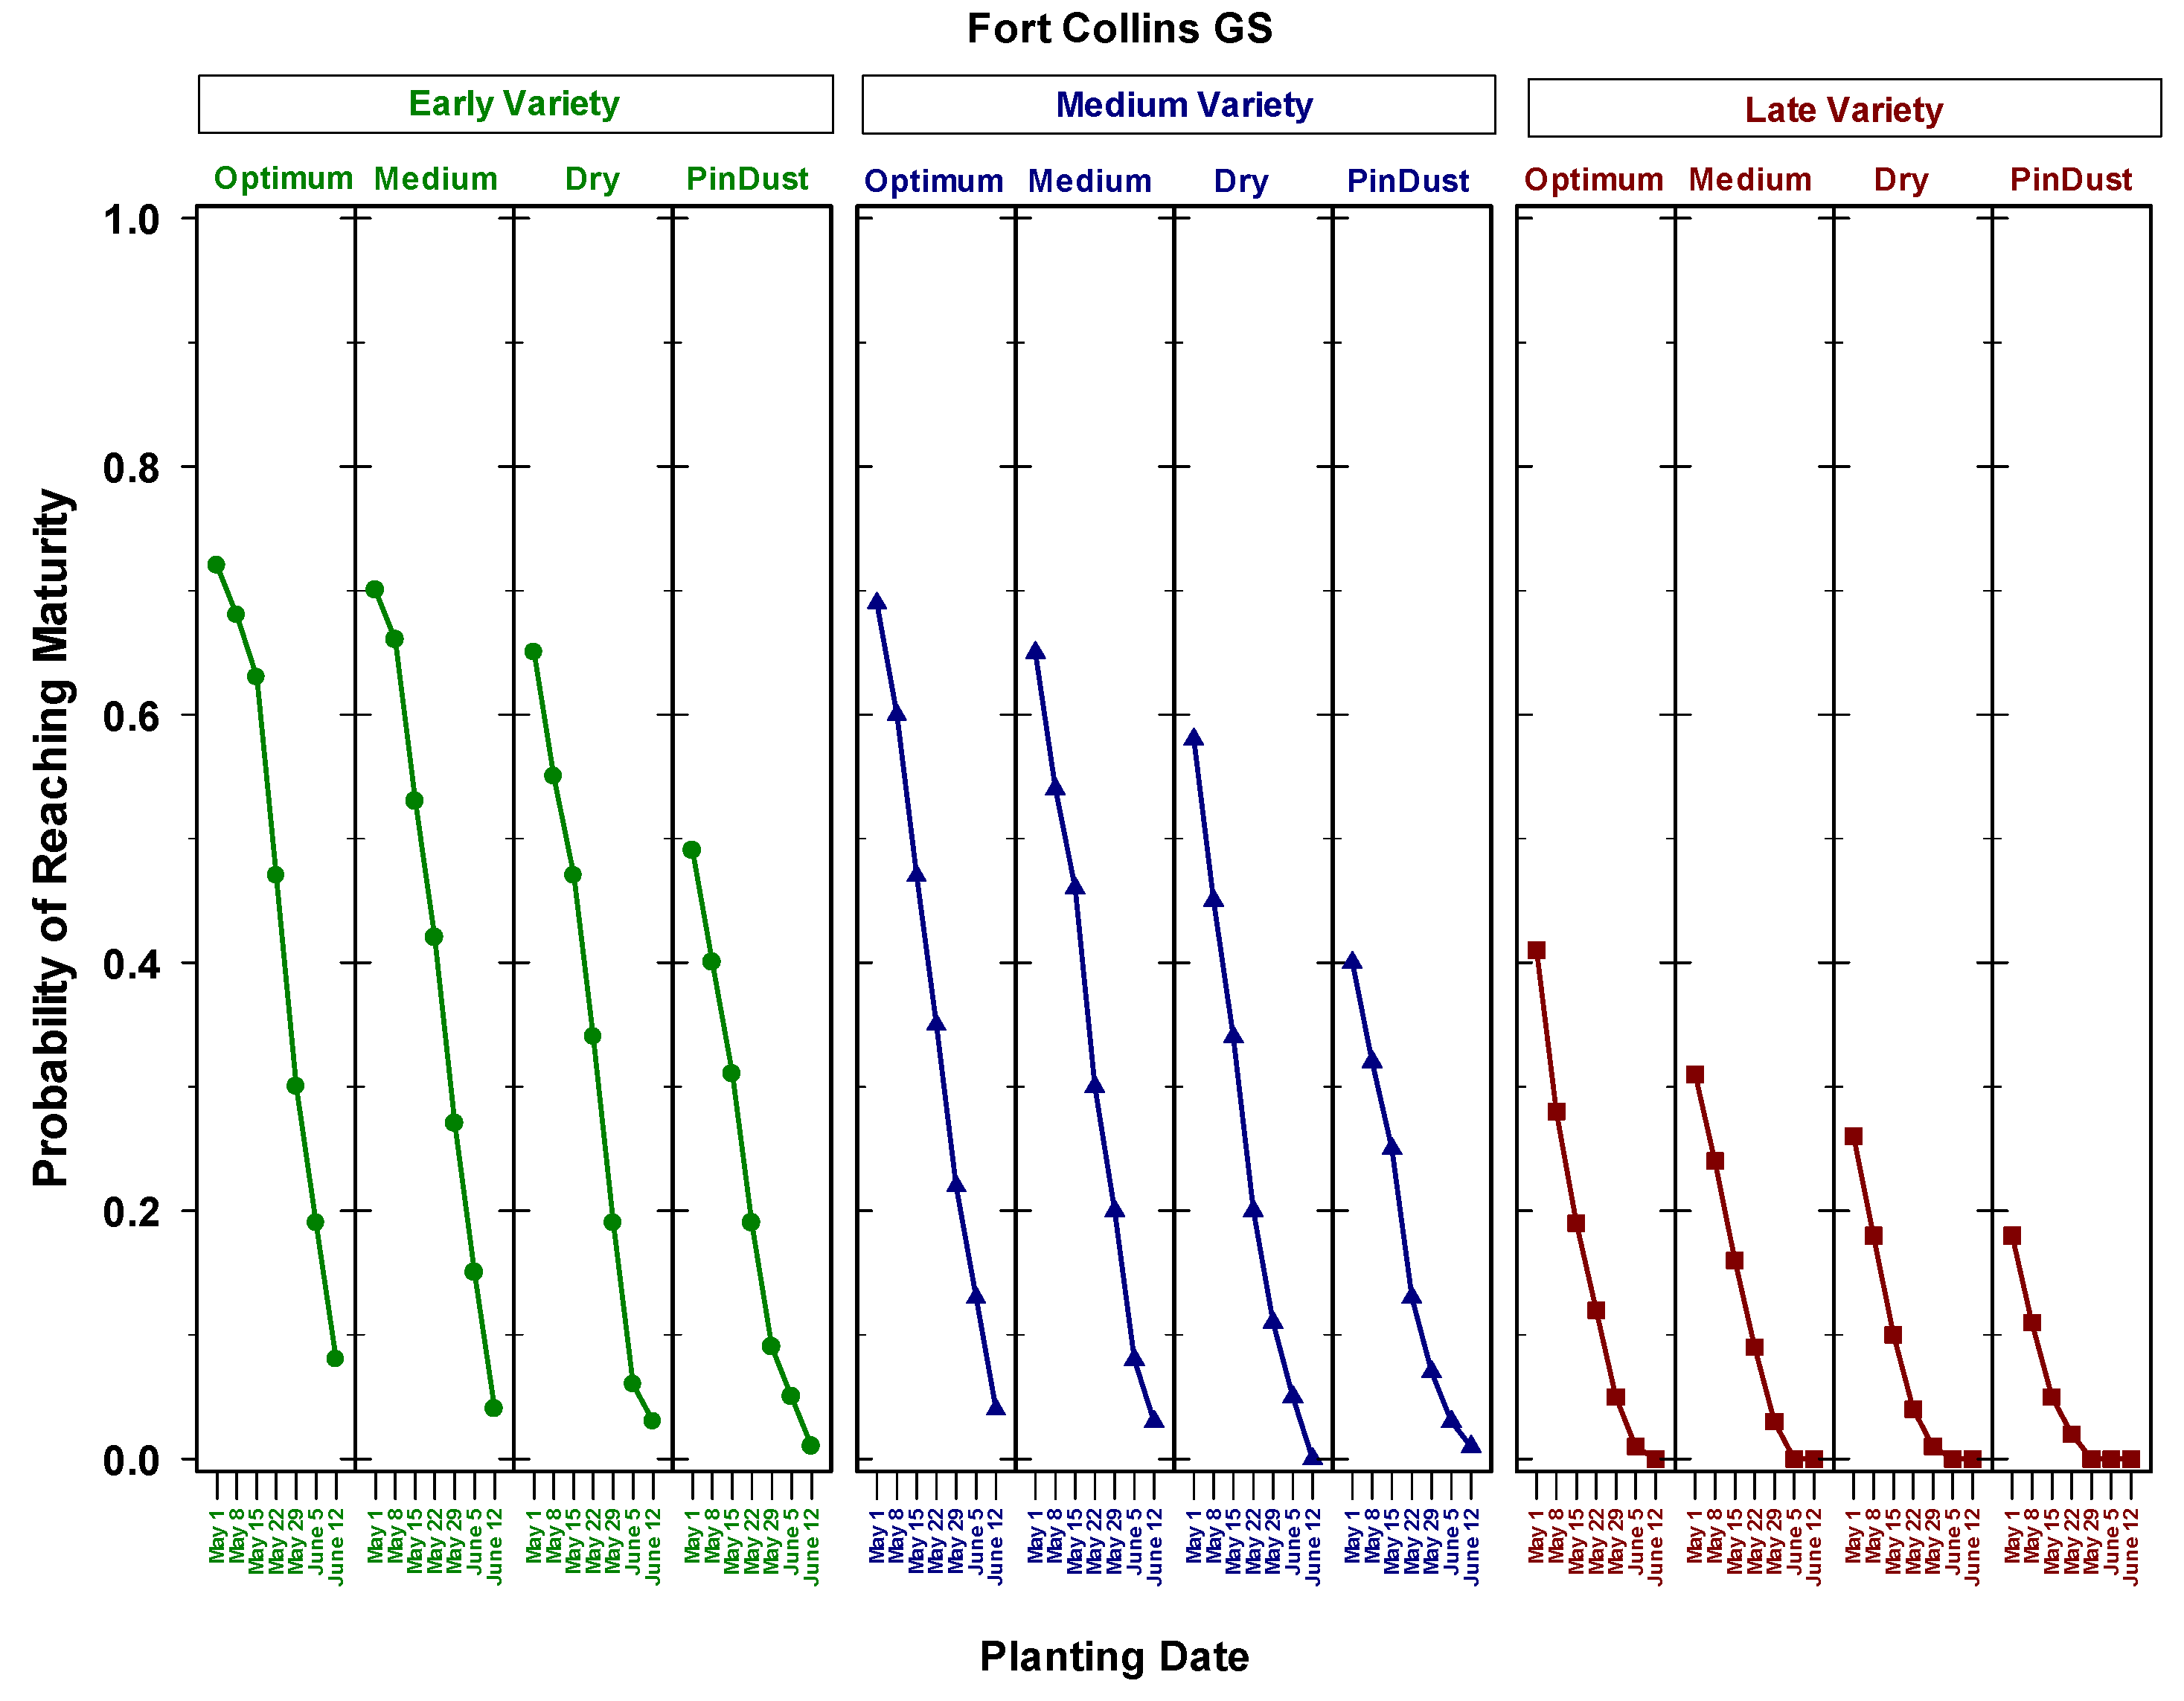
Figure 8.
Probability of sorghum reaching physiological maturity at Fort Collins, Colorado, for seven planting dates using non-stressed (GS) phenological parameters, three maturity classes, and four seedbed water conditions at planting.
Figure 8.
Probability of sorghum reaching physiological maturity at Fort Collins, Colorado, for seven planting dates using non-stressed (GS) phenological parameters, three maturity classes, and four seedbed water conditions at planting.
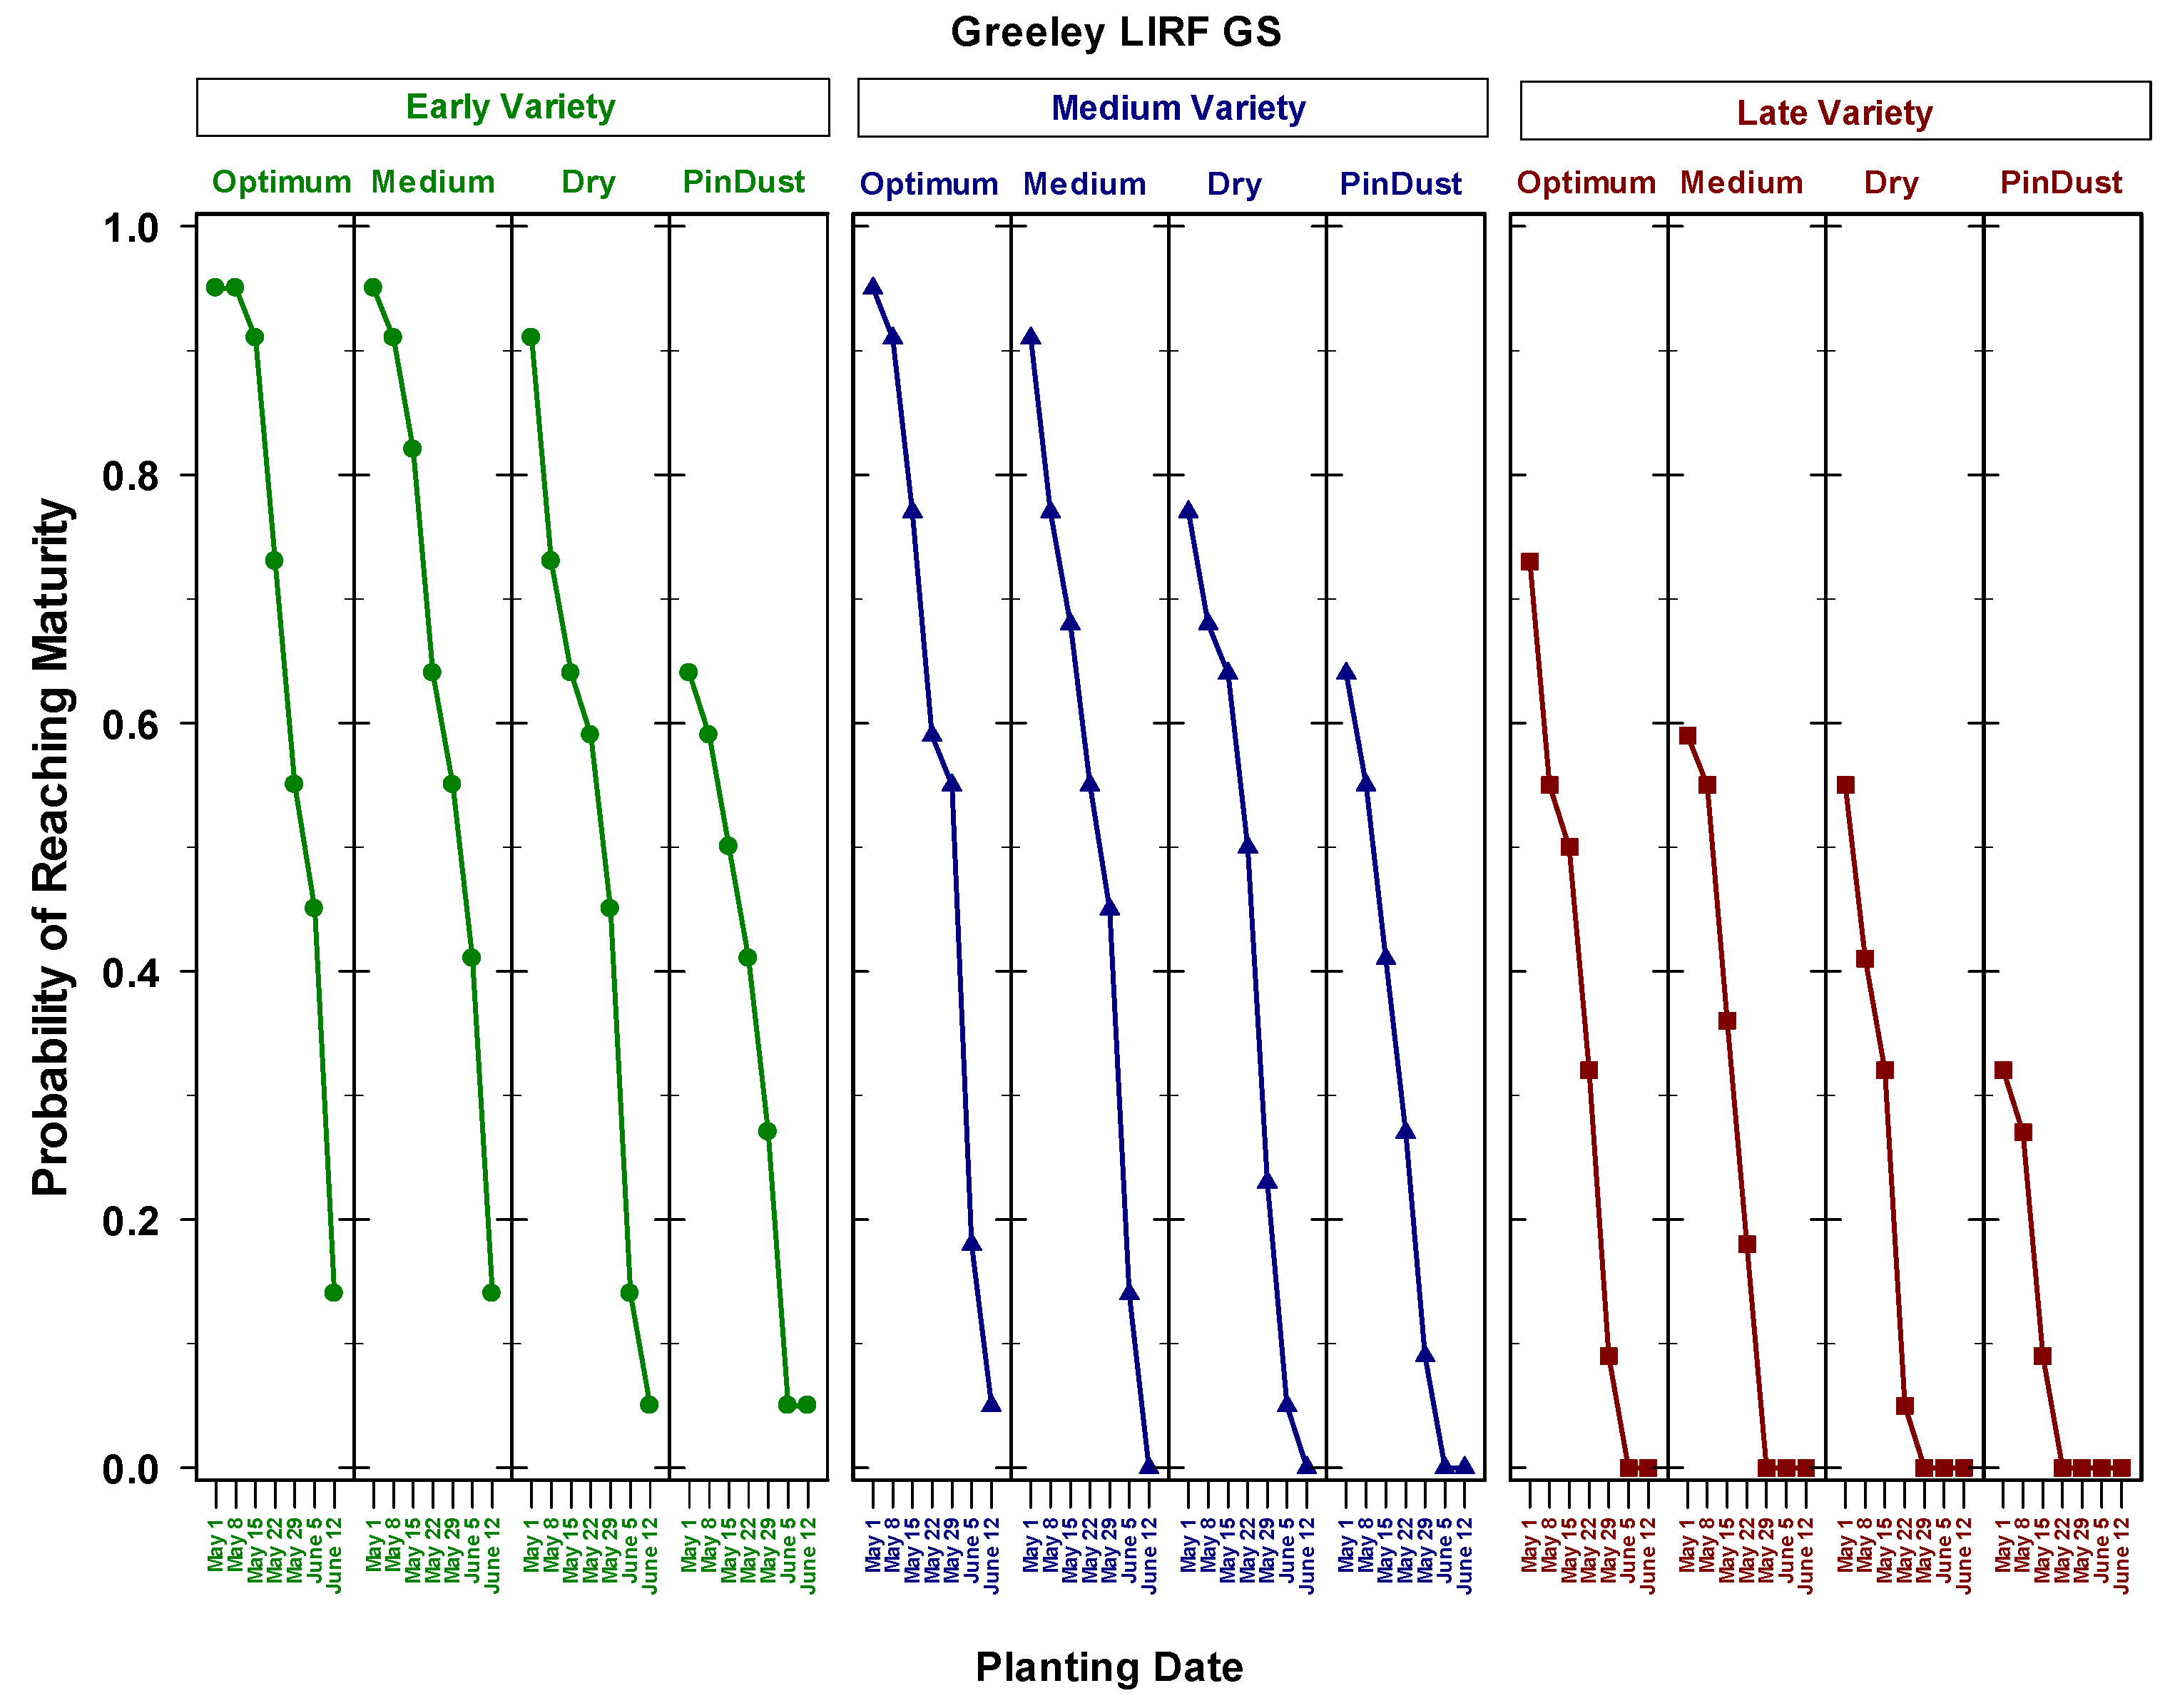
Figure 9.
Probability of sorghum reaching physiological maturity at Greeley LIRF, Colorado, for seven planting dates using non-stressed (GS) phenological parameters, three maturity classes, and four seedbed water conditions at planting.
Figure 9.
Probability of sorghum reaching physiological maturity at Greeley LIRF, Colorado, for seven planting dates using non-stressed (GS) phenological parameters, three maturity classes, and four seedbed water conditions at planting.
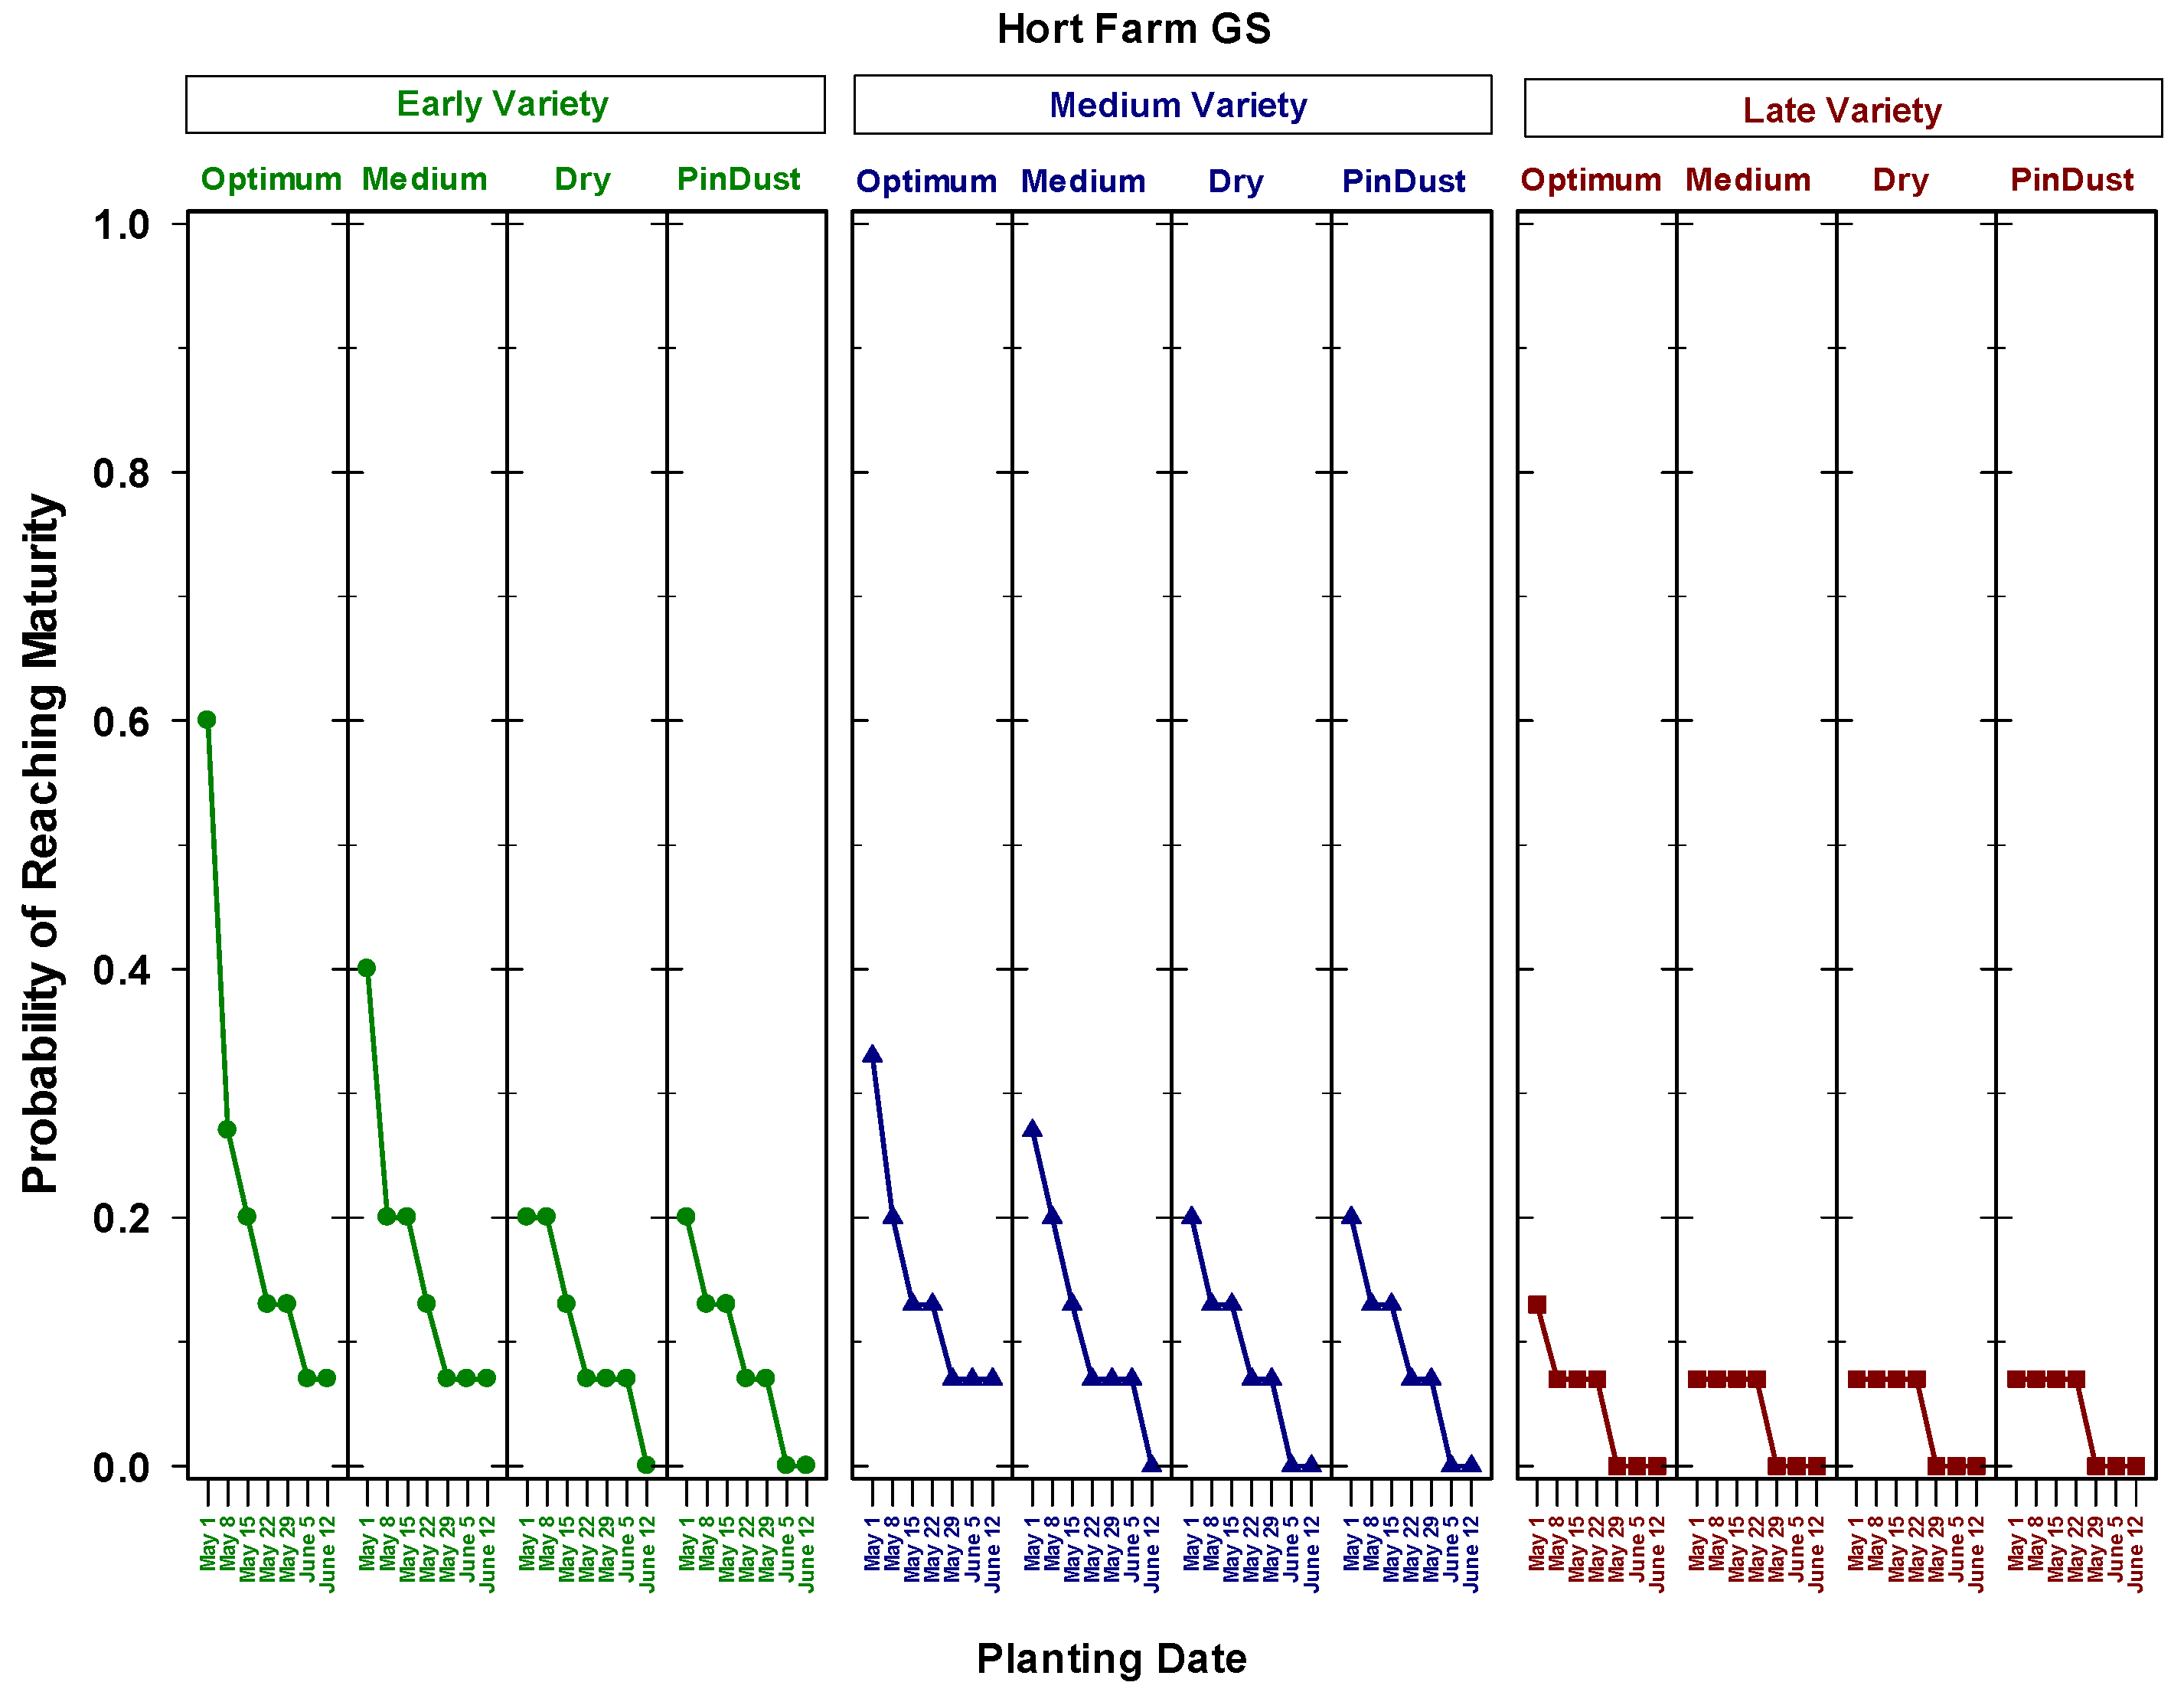
Figure 10.
Probability of sorghum reaching physiological maturity at Hort Farm, Colorado, for seven planting dates using non-stressed (GS) phenological parameters, three maturity classes, and four seedbed water conditions at planting.
Figure 10.
Probability of sorghum reaching physiological maturity at Hort Farm, Colorado, for seven planting dates using non-stressed (GS) phenological parameters, three maturity classes, and four seedbed water conditions at planting.
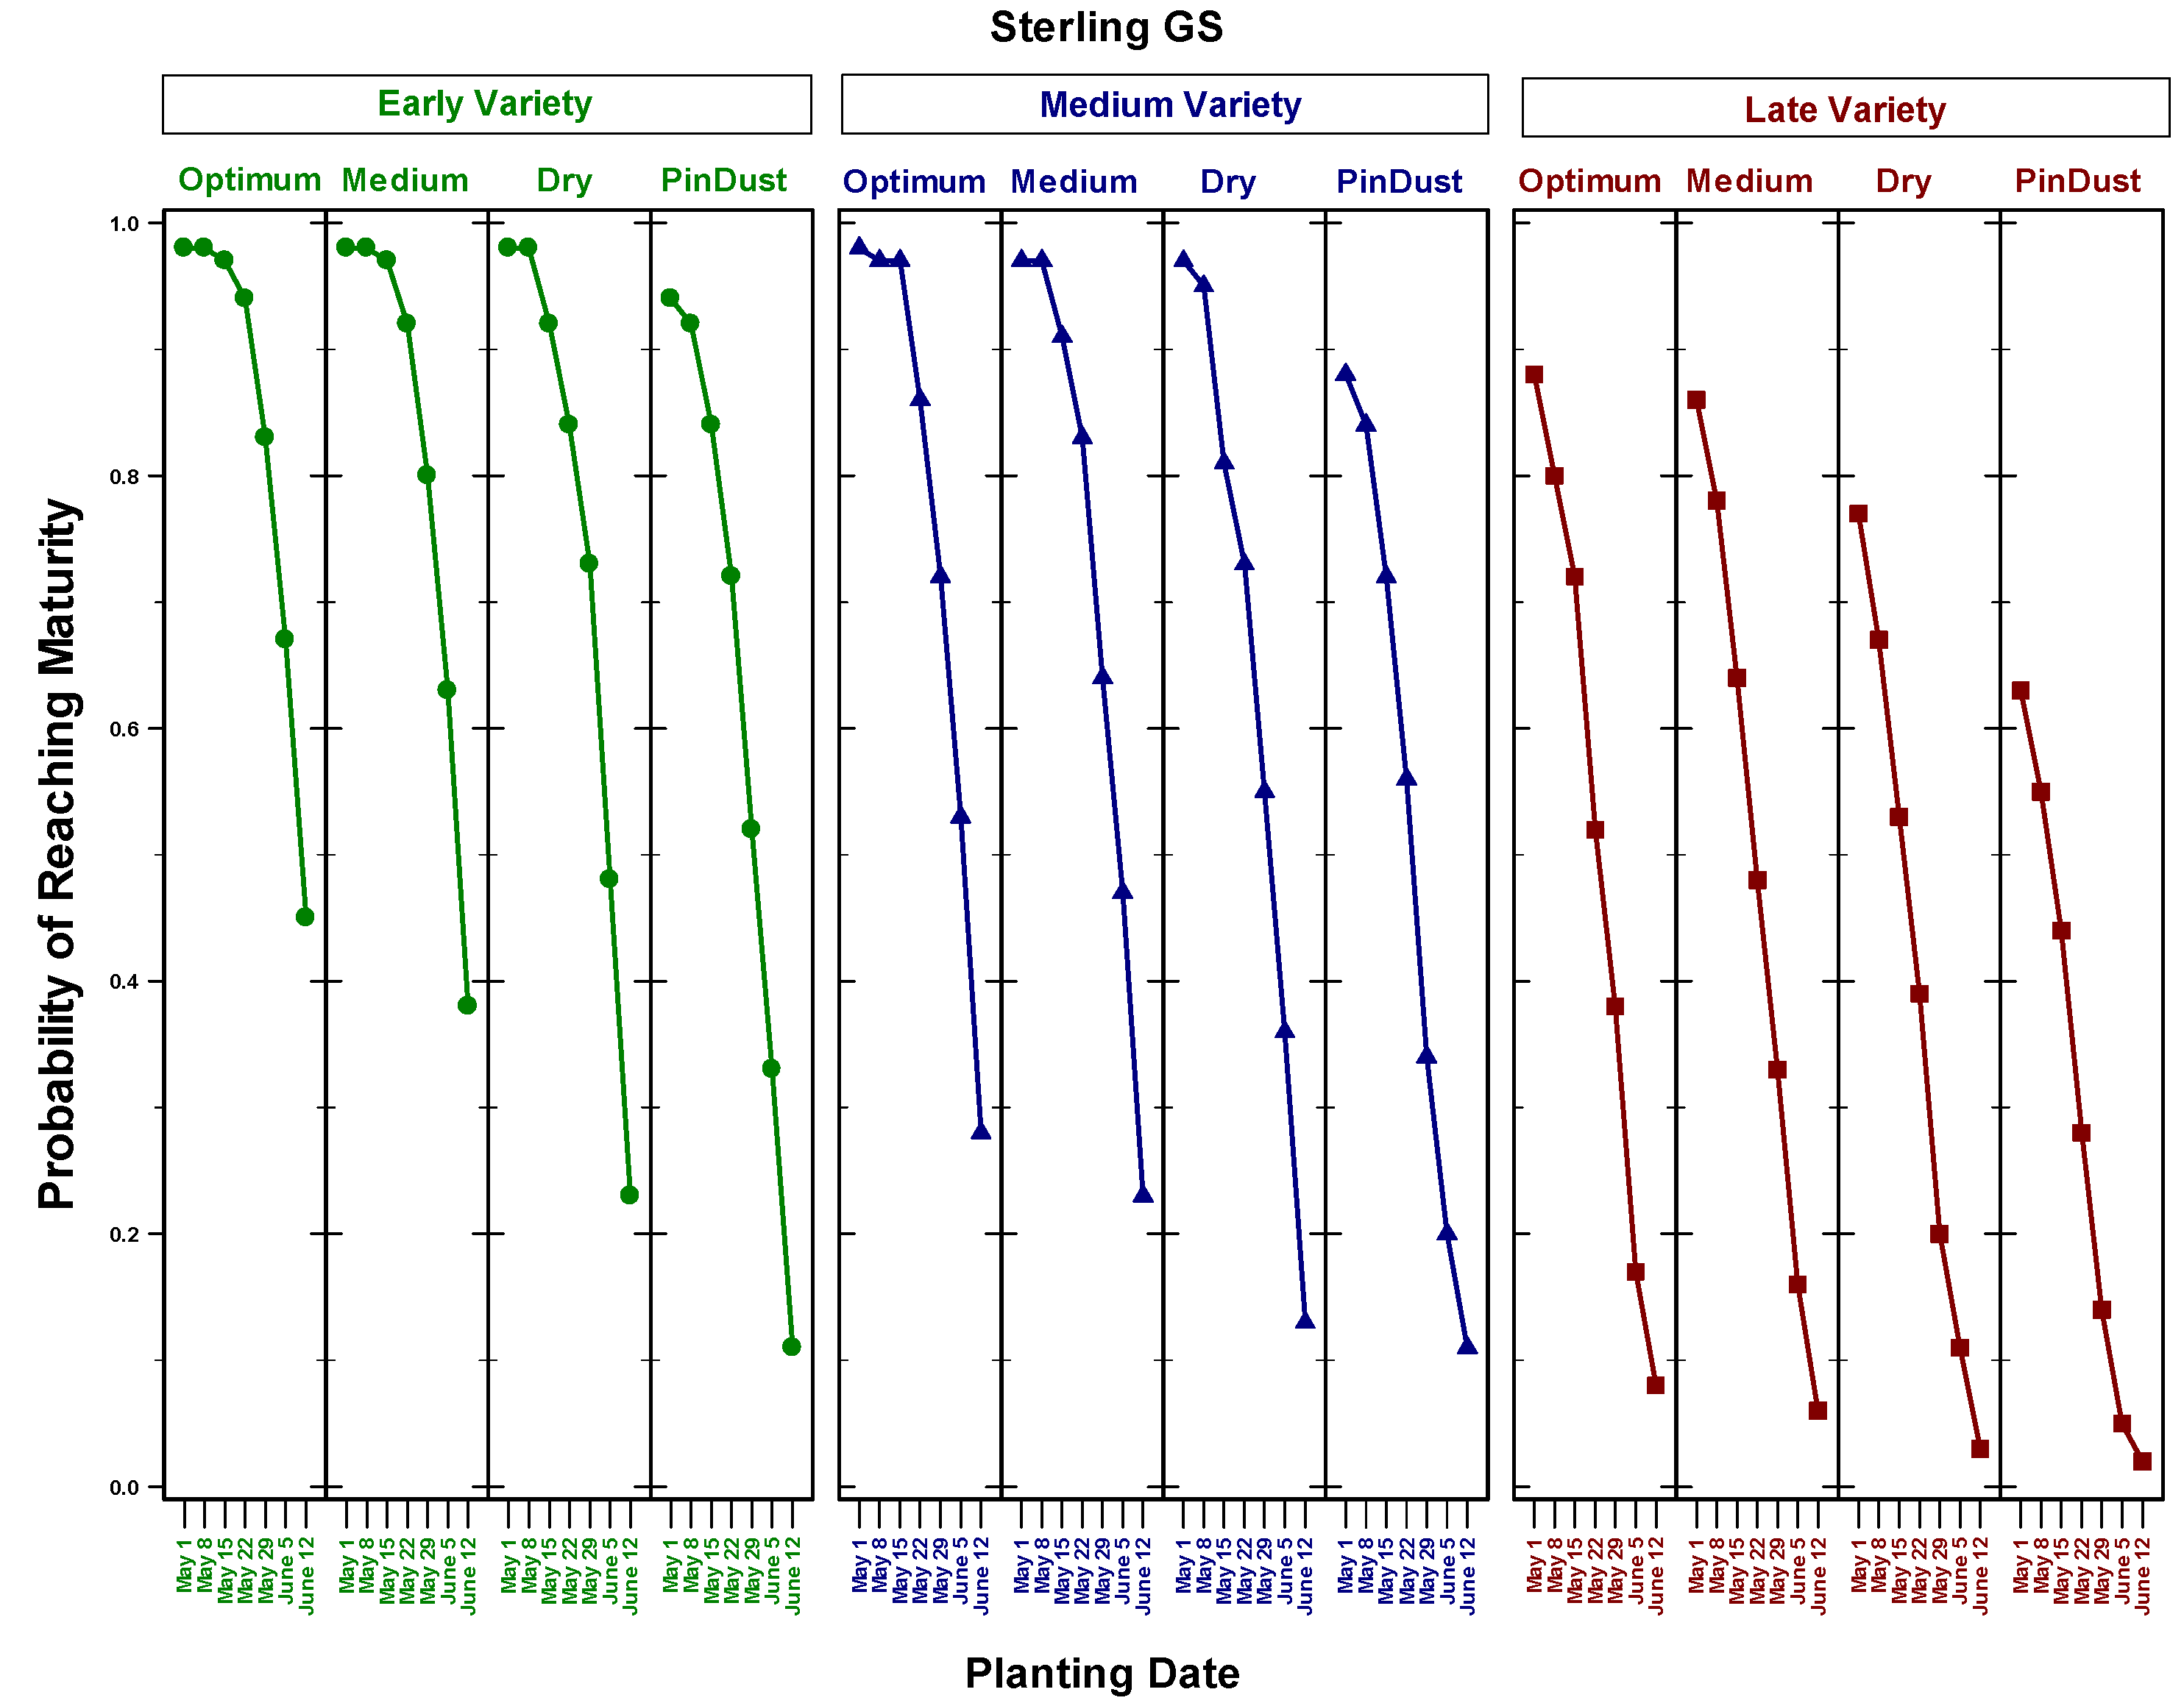
Figure 11.
Probability of sorghum reaching physiological maturity at Sterling, Colorado for seven planting dates using non-stressed (GS) phenological parameters, three maturity classes, and four seedbed water conditions at planting.
Figure 11.
Probability of sorghum reaching physiological maturity at Sterling, Colorado for seven planting dates using non-stressed (GS) phenological parameters, three maturity classes, and four seedbed water conditions at planting.
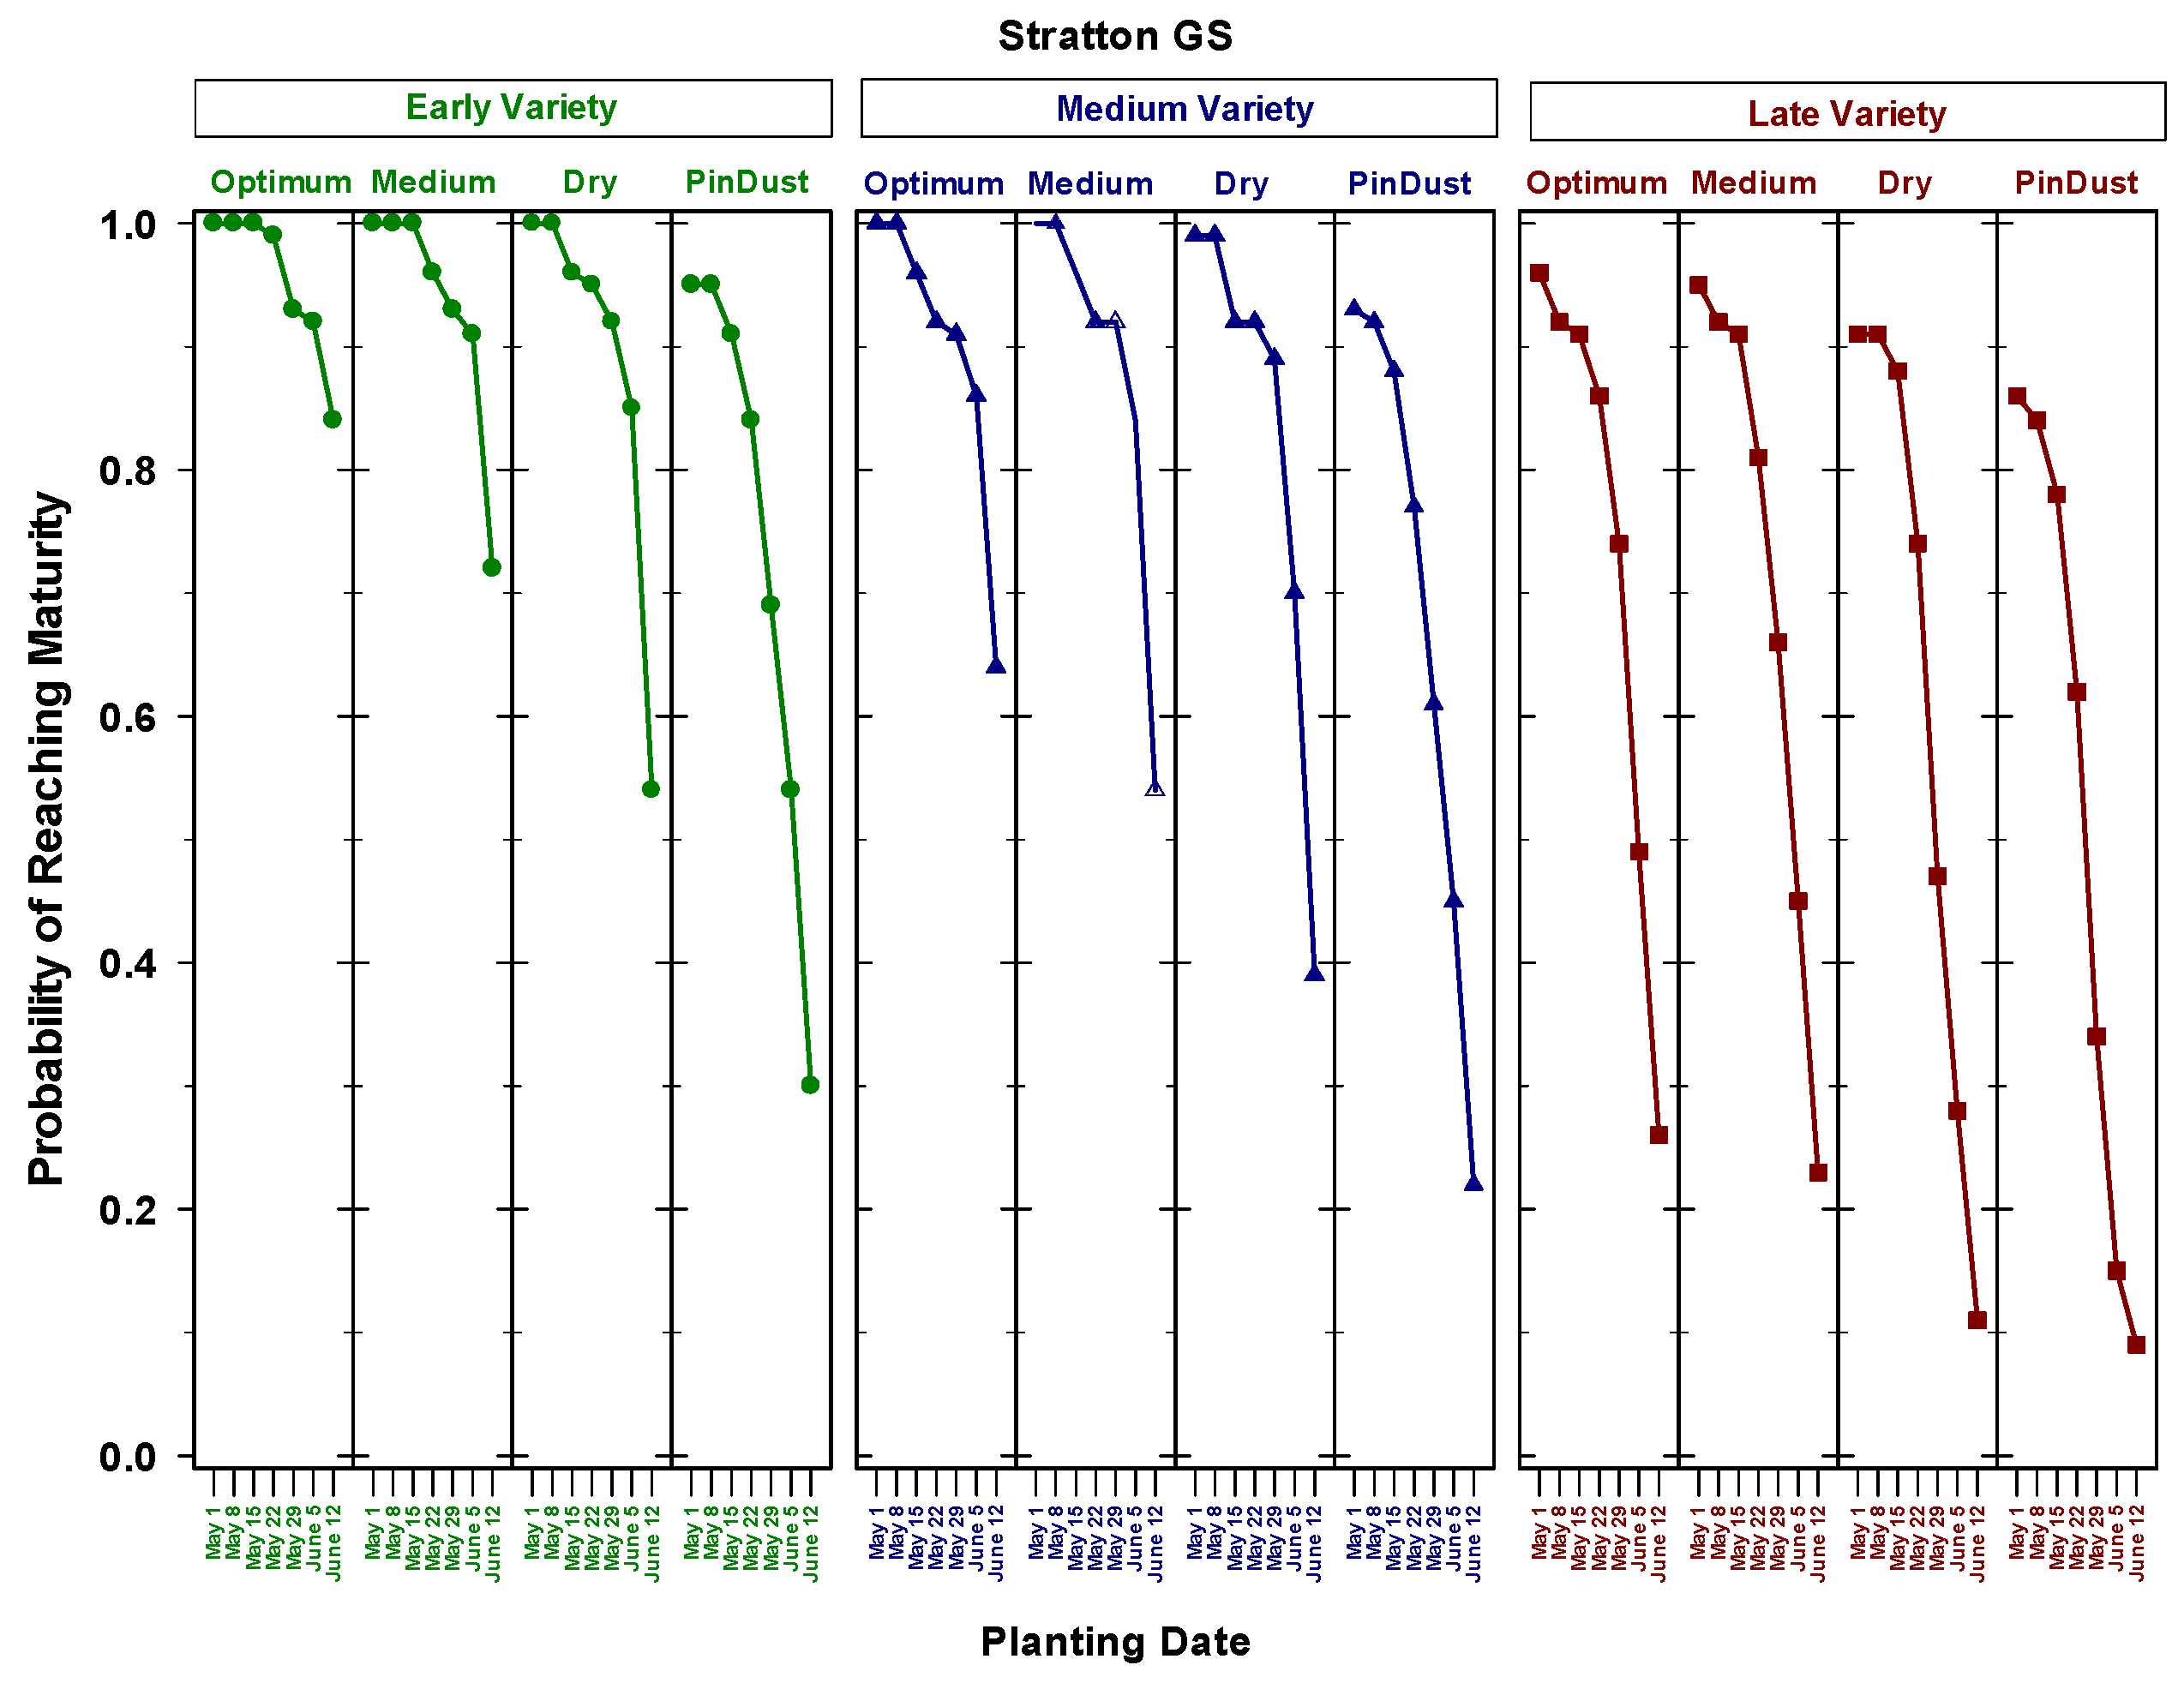
Figure 12.
Probability of sorghum reaching physiological maturity at Stratton, Colorado, for seven planting dates using non-stressed (GS) phenological parameters, three maturity classes, and four seedbed water conditions at planting.
Figure 12.
Probability of sorghum reaching physiological maturity at Stratton, Colorado, for seven planting dates using non-stressed (GS) phenological parameters, three maturity classes, and four seedbed water conditions at planting.
Table 1.
General weather information for nine locations in northeastern Colorado.
Table 1.
General weather information for nine locations in northeastern Colorado.
| Location | Latitude | Longitude | Elevation (m) | Starting Date in Weather File | Ending Date in Weather File | Number of Useable Years | Mean First Frost Date 1 | Mean Temperature 1 May to First Frost Date (°C) |
|---|
| Akron | 40°9′ N | 103°8′ W | 1383 | 1 January 1918 | 31 December 2013 | 96 | 11 October | 18.6 |
| ARDEC | 40°39′ N | 105° W | 1558 | 8 May 1992 | 14 May 2014 | 22 2 | 8 October | 17.6 |
| Ault | 40°34′ N | 104°43′ W | 1497 | 17 March 1992 | 18 May 2014 | 22 | 9 October | 17.9 |
| Drake Farm | 40°36′ N | 104°50′ W | 1572 | 21 November 2001 | 14 February 2014 | 12 | 17 October | 17.9 |
| Fort Collins | 40°35′ N | 105°8′ W | 1561 | 1 January 1895 | 1 September 2014 | 113 | 9 October | 17.5 |
| Greeley LIRF | 40°26′ N | 104°38′ W | 1427 | 4 March 1992 | 8 April 2014 | 22 | 11 October | 18.3 |
| Hort Farm | 40°36′ N | 104°59′ W | 1526 | 1 January 1987 | 31 December 2001 | 15 | 5 October | 17.1 |
| Sterling | 40°16′ N | 103°0′ W | 1363 | 1 January 1950 | 5 July 2014 | 64 | 11 October | 19.1 |
| Stratton | 39°17′ N | 102°31′ W | 1317 | 1 June 1934 | 25 June 2014 | 74 3 | 20 October | 19.1 |
Table 2.
Mean maturity dates for seven planting dates at nine locations in northeastern Colorado.
Table 2.
Mean maturity dates for seven planting dates at nine locations in northeastern Colorado.
| Location | Mean Temperature 1 May to First Frost Date (°C) | Mean Temperature 1 May to 1 November (°C) | Mean First Frost Date 2 (DOY) | Maturity Date (DOY) 1 |
|---|
| 1 May | 8 May | 15 May | 22 May | 29 May | June 5 | 12 June |
|---|
| Akron | 18.6 | 17.6 | 284 | 254 | 259 | 263 | 269 | 278.1 | 288 | 304 |
| ARDEC | 17. 6 | 16.3 | 281 | 271 | 278 | 284 | 303 | 312.6 | 332 | 345 |
| Ault | 17.9 | 16.7 | 282 | 262 | 267 | 275 | 288 | 299.2 | 312 | 336 |
| Drake Farm | 17.9 | 17.1 | 290 | 258 | 262 | 268 | 281 | 291.6 | 301 | 321 |
| Fort Collins | 17.5 | 16.5 | 282 | 269 | 275 | 282 | 294 | 307.8 | 323 | 337 |
| Greeley LIRF | 18.4 | 17.2 | 284 | 255 | 260 | 266 | 275 | 287.2 | 300 | 319 |
| Hort Farm | 17.1 | 15.9 | 278 | 282 | 291 | 300 | 322 | 332.9 | 351 | 361 |
| Sterling | 19.1 | 18.0 | 284 | 247 | 251 | 255 | 262 | 268.6 | 277 | 292 |
| Stratton | 19.0 | 18.4 | 293 | 243 | 247 | 251 | 257 | 262.7 | 270 | 280 |
Table 3.
Probability of reaching maturity for seven planting dates at nine locations in northeastern Colorado using either non-water stressed phenological parameters (GN) or water-stressed phenological parameters (GS).
Table 3.
Probability of reaching maturity for seven planting dates at nine locations in northeastern Colorado using either non-water stressed phenological parameters (GN) or water-stressed phenological parameters (GS).
| Location | Probability of Reaching Maturity |
|---|
| GN or GS Parameters | Planting Date |
|---|
| 1 May (%) | 8 May (%) | 15 May (%) | 22 May (%) | 29 May (%) | 5 June (%) | 12 June (%) |
|---|
| Akron | GN 1 | 91.7 | 90.6 | 87.5 | 80.2 | 68.8 | 45.8 | 25.0 |
| GS 2 | 94.8 | 90.6 | 90.6 | 84.4 | 74.0 | 55.2 | 28.1 |
| ARDEC | GN | 76.2 | 59.1 | 50.0 | 40.9 | 31.8 | 13.6 | 0.0 |
| GS | 76.2 | 72.7 | 54.6 | 40.9 | 31.8 | 18.2 | 0.0 |
| Ault | GN | 81.8 | 72.7 | 68.2 | 50.0 | 40.9 | 18.2 | 4.6 |
| GS | 86.4 | 81.8 | 68.2 | 54.6 | 45.4 | 18.2 | 4.6 |
| Drake Farm | GN | 91.7 | 91.7 | 91.7 | 75.0 | 66.7 | 41.7 | 16.7 |
| GS | 91. 7 | 91.7 | 91. 7 | 75.0 | 66.7 | 50.0 | 33.3 |
| Fort Collins | GN | 69.9 | 64.6 | 56.6 | 41.6 | 29.2 | 15.0 | 6.2 |
| GS | 71.7 | 68.1 | 62.8 | 46.9 | 30.1 | 18.2 | 8.0 |
| Greeley LIRF | GN | 95.4 | 90.9 | 81.8 | 68.2 | 54.6 | 36.4 | 13.6 |
| GS | 95.4 | 95.4 | 90.9 | 72.7 | 54.6 | 45.4 | 13.6 |
| Hort Farm | GN | 53.3 | 26.7 | 20.0 | 13.3 | 6.7 | 6.7 | 6.7 |
| GS | 60.0 | 26.7 | 20.0 | 13.3 | 13.3 | 6.7 | 6.7 |
| Sterling | GN | 98.4 | 96.7 | 96.9 | 90.6 | 78.1 | 62.5 | 40.6 |
| GS | 98.4 | 98.4 | 96.7 | 93.8 | 82.8 | 67.2 | 45.3 |
| Stratton | GN | 100 | 100 | 100 | 94.6 | 91.9 | 90.5 | 75.7 |
| GS | 100 | 100 | 100 | 98.6 | 93.2 | 91.9 | 83.8 |
Table 4.
Sorghum growing degree-days (GDD) for no water stress (GN) and maximum non-terminal water stress (GS) phenological parameters for early, medium, and late maturity classes.
Table 4.
Sorghum growing degree-days (GDD) for no water stress (GN) and maximum non-terminal water stress (GS) phenological parameters for early, medium, and late maturity classes.
| Early Maturity | Medium Maturity | Late Maturity |
|---|
| Interval | GN | GS | GN | GS | GN | GS |
|---|
| GDD (°C·Day) 2 |
|---|
| E to Growing Point Differentiation (GPD) 1 | 405 | 405 | 450 | 450 | 495 | 495 |
| GPD to End of Leaf Growth (ELG) | 160 | 160 | 184 | 184 | 231 | 231 |
| ELG to Anthesis Start (AS) | 80 | 116 | 80 | 97 | 80 | 97 |
| AS to Half Bloom (HB) | 80 | 116 | 80 | 97 | 80 | 97 |
| HB to Full Bloom | 120 | 145 | 120 | 145 | 120 | 145 |
| AS to Maturity | 550 | 499 | 525 | 486 | 538 | 499 |
Table 5.
Sorghum default parameters for seedling emergence.
Table 5.
Sorghum default parameters for seedling emergence.
| Parameter | Value |
|---|
| Germination (∑GDD): 1 | |
| Optimum 2 | 40 |
| Medium | 50 |
| Dry | 70 |
| Planted in Dust 3 | 500 |
| Elongation rate (mm·GDD−1): | |
| Optimum | 1.5 |
| Medium | 1.0 |
| Dry | 0.6 |
| Planted in Dust | 0.0 |
| Planting Depth (cm) | 5 |
| Planting Date | 1, 8, 15, 22, 29, May |
| 5, 12 June |


