Article

Inter-Taxa Differences in Iodine Uptake by Plants: Implications for Food Quality and Contamination

Centre for Research in Bioscience, Faculty of Health and Applied Sciences, University of the West of England, Coldharbour Lane, Frenchay, Bristol BS16 1QY, UK
*
Author to whom correspondence should be addressed.
These authors contributed equally to this work.
Agronomy 2015, 5(4), 537-554; https://doi.org/10.3390/agronomy5040537
Submission received: 22 July 2015 / Revised: 12 October 2015 / Accepted: 4 November 2015 / Published: 9 November 2015
(This article belongs to the Special Issue Accumulation and Distribution of Elements in Crop Plants)

Abstract

:
Although iodine is not essential for plants, they take it up readily and, in foodchains, are significant sources of iodine for organisms with an essential requirement for it. During several nuclear accidents radioiodine has been an important component of releases of radioactivity and has caused serious contamination of foodchains. Differences in iodine uptake by different plant taxa are, therefore, important to nutritional and radioecological studies. Using techniques we have developed for a range of other elements, we analyzed inter-taxa differences in radioiodine uptake by 103 plant species and between varieties of two species, and analyzed them using a recent, phylogenetically-informed, taxonomy. The results show that there are significant differences in uptake above and below the species level. There are significant differences between Monocots and Eudicots in iodine uptake, and, in particular, hierarchical ANOVA revealed significant differences between Genera within Families. These analyses of the taxonomic origin of differences in plant uptake of iodine can help the prediction of crop contamination with radioiodine and the management of stable iodine in crops for nutritional purposes.

1. Introduction

Iodine (I) is readily taken up by plants if available [1], which is important to both agronomy and radioecology because, although I is not an essential element for plants, food crops are a major conduit for the entry of I to human foodchains. Stable I (127I) is an essential trace element for humans whilst the radioisotopes 131I and 129I can be significant radioactive contaminants of the environment [2]. About two hundred million people worldwide suffer from I deficiency disorders (IDD), with an at risk population potentially in excess of one billion [3]. It has been estimated that around 44% of children and adults in Europe have a mild iodine deficiency [4]. Low I intake from food crops is partly responsible for IDD and thus, as for many other trace elements [3], to redress deficiencies it is potentially useful to understand the agronomy of 127I in the soil-crop system. The iodized-salt enrichment diet has reduced I deficiency in some areas but there are still areas with a significant level of IDD.
The toxicologically important radioisotopes 131I and 129I, which are both fission products, can be a significant component of releases of radioactivity to the environment, and, as isotopes of an essential element, tend to accumulate in animals if they are present in food. 131I has a short-half life (eight days), is quite a high energy β/γ emitter and is primarily of concern as a food contaminant in the immediate aftermath of releases from accidents or from fall-out from above-ground nuclear weapons detonation. 129I has a long half-life (15.7 × 10⁶ years) and has been of importance in accidental releases, but it is a major, and potentially mobile, constituent of high and medium level nuclear waste [2], and is released into the marine environment from nuclear-fuel reprocessing plants [5]. 129I has the potential to be drawn upwards through soil profiles from repositories [6] and to be transferred from sea to land [5], provoking interest in its transfer characteristics from soil-to-plants during assessments of nuclear waste repositories and marine releases.
The transfer of I from soils-to-plants is possible because its isotopes can be both available in soil and taken up by plants. In fact, in comparison to many other nutrients and radionuclides, I isotopes are highly available in many soils with, for example, compilations of soil-solution distribution coefficients (Kd) for radionuclides suggesting that 129I is amongst the least strongly adsorbed isotopes in a range of soils [7]. There is little sorption of 129I on clay minerals and any sorption is primarily to organic matter [6]. I is more labile under anoxic than oxic soil conditions. For example, the flooding of paddy soils has long been known to produce the “Akagare” phenomenon in rice, which results from I toxicity caused by large increases in availability brought on by anoxia [8]. It is also clear that there can be significant changes in I mobility between the water-table and the vadose zone in soils [6]. In many soils I and IO3 are the most common ionic forms, with I most likely to be taken up by plants [1] because they have substantial capacity for the uptake of the chemically similar Cl [9]. Overall, although soil-to-plant transfer factors can be quite low from, for example, Andosols with high anion exchange capacities [10], hydroponic experiments show that plants can take up large quantities of I if it is available to them [1] and most soils produce transfers to crops that can contribute significantly to food I content and to radiocontamination if 127I or 131/129I are available in the soil.
It has been suggested, based on a limited number of species, that inter-species differences exist in the plant uptake of I under comparative conditions (e.g., [10]) and concentrations of almost all elements across different plant species do not simply reflect soil availability, i.e., there are significant inter-taxa differences in uptake under the same conditions of availability [11]. It seems likely, therefore, that there might be inter-taxa differences in the concentration to which plants take up I, and that these might be useful to understanding the agronomy of I. There are, however, few data on this phenomenon and no studies that have attempted to link these differences to recent phylogenies of angiosperms (flowering plants), nor to compare them to inter-varietal differences. The understanding of the phylogeny (evolutionary relationships) of angiosperms has been transformed in recent years by molecular and computer methodologies, resulting in new phylogenies for angiosperms (e.g., [12]). Given that many phenotypes can be affected by phylogeny, angiosperm phylogenies specifically for use in comparative biological experiments have been published [13]. These have now been used to analyze inter-species differences in the concentrations to which plants concentrate numerous elements [11,14,15,16,17,18], and to establish that there is a significant influence of angiosperm phylogeny on plant mineralogy, including that of crop plants. Such analyses require quite large databases of inter-species comparisons, often produced by collating data from a variety of sources through, for example, Residual Maximum Likelihood (REML) analysis. Here we utilize techniques successfully used to investigate inter-species differences of other elements to construct a database of relative I concentrations following root exposure in 103 angiosperm species, analyze their differences using a recently published phylogenetic hierarchy for the angiosperms, compare them to inter-varietal differences in two species, and assess their influence on I concentrations in food crops. The usefulness of the results to predicting the transfer of I isotopes from soils to plants in agricultural and radioecological contexts is then discussed.

2. Results and Discussion

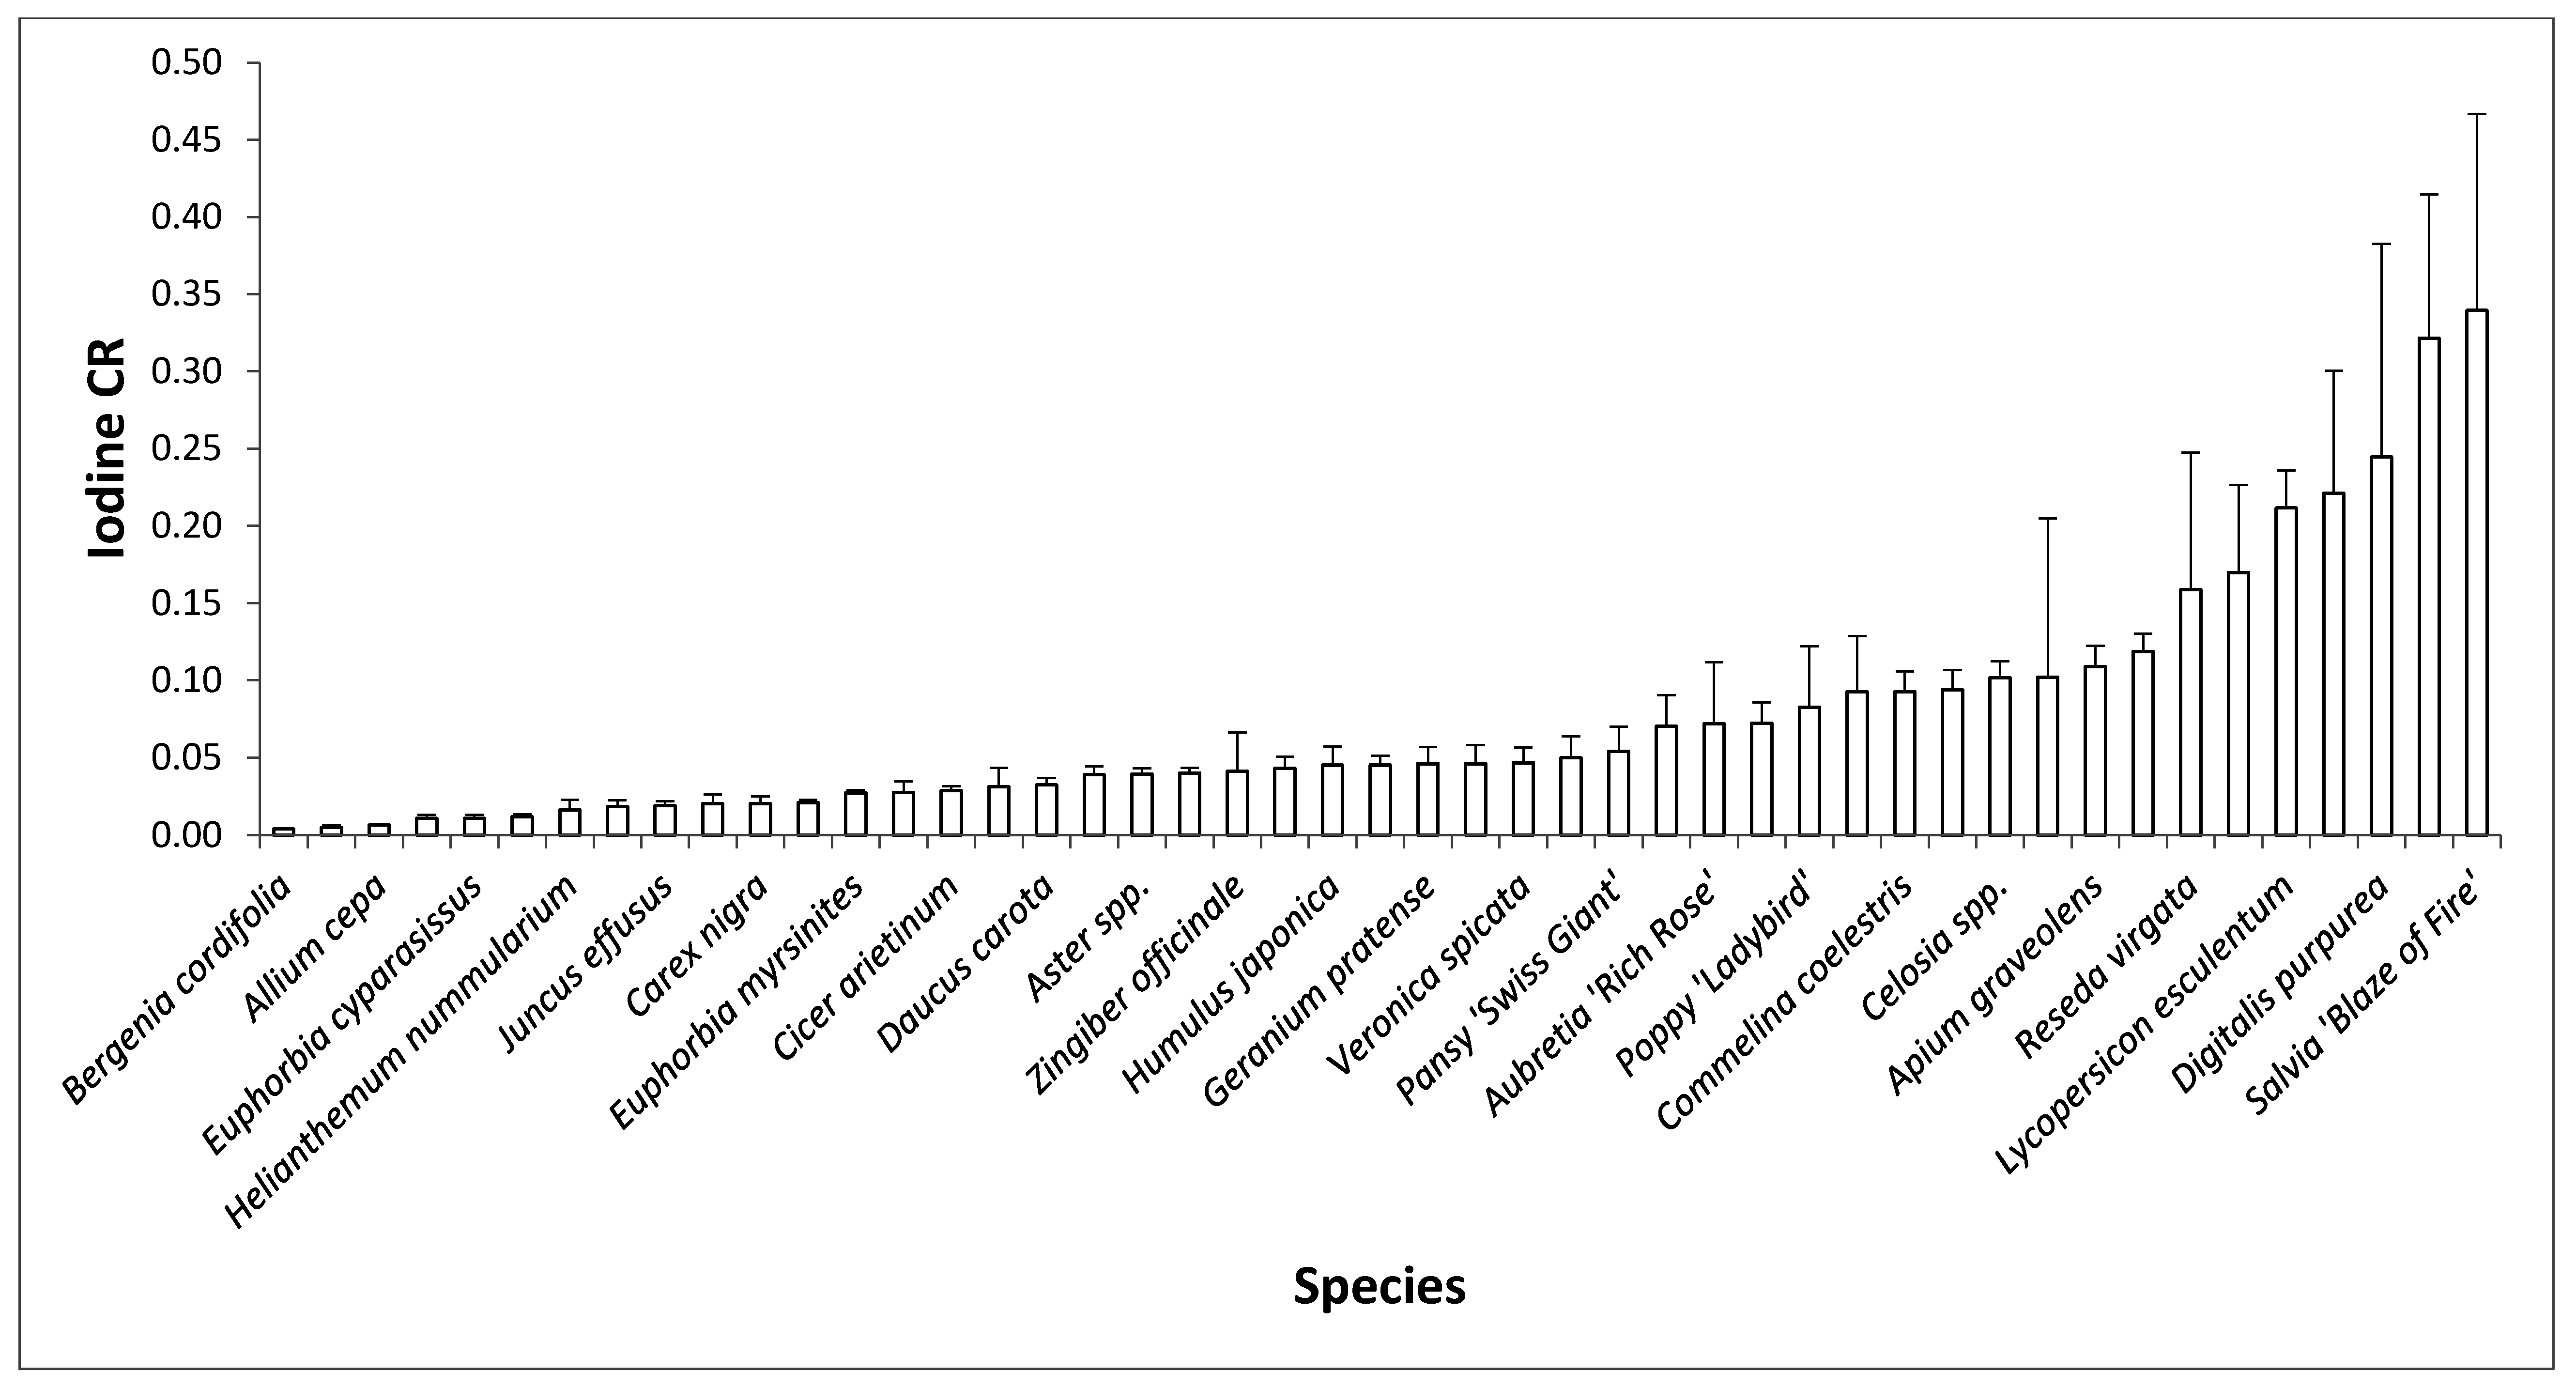
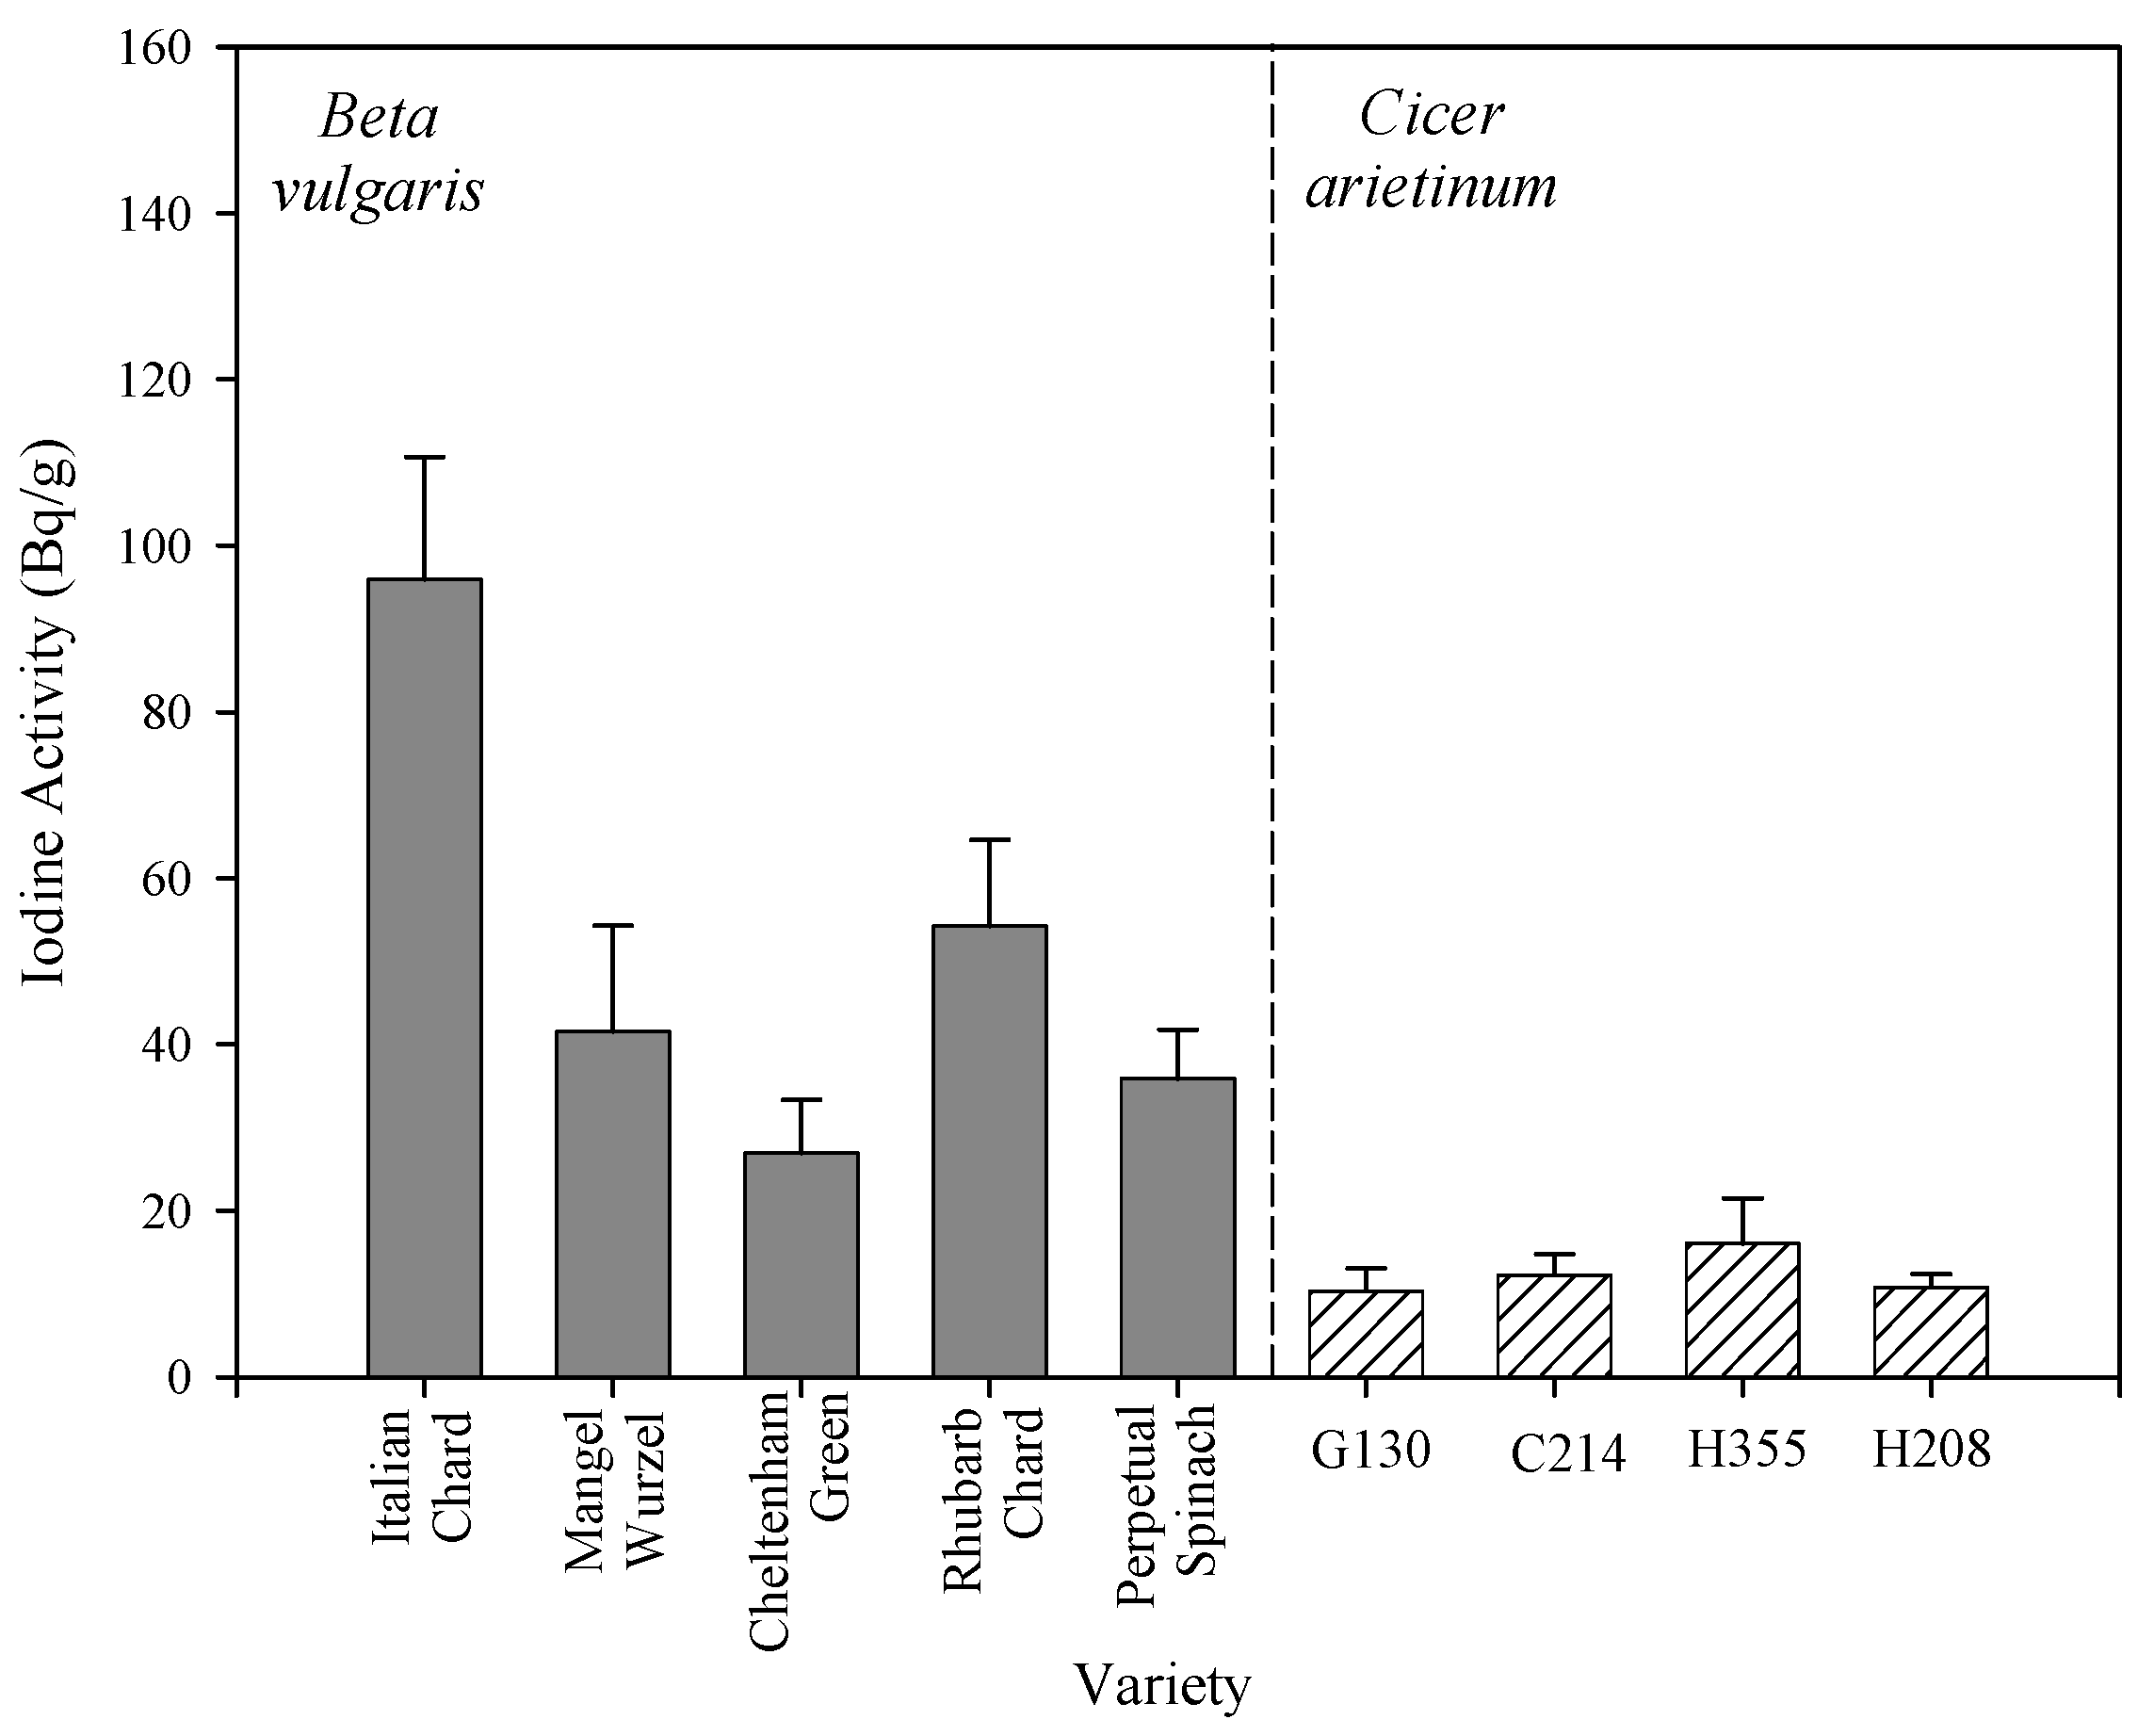
2.1. Inter-Species Differences in I Concentration

REML-estimated relative mean I concentrations in 103 species of plants are shown in Table 1, which is the most taxonomically wide-ranging comparison of relative I concentrations in plants yet published. Given that raw data is loge-transformed prior to REML analysis, the large range in REML transformed values (−6.83 to 3.72) indicates that there are substantial inter-species differences in I uptake after the exposures used to generate data contributing to the database. This was confirmed using species grown for this work, in which replicate values for individual species grown under the same conditions allowed inter-species differences to be analyzed statistically (Figure 1). The International Atomic Energy Agency (IAEA) has recommended, based on data compilations across a range of different soil and crop types, mean soil-to-plant concentration ratios (CRs) for radioelements including radioiodine [19]. Iodine CR is calculated by dividing the concentration in the plants by the concentration in the soil. To enable comparison we estimated an overall CR for radioiodine of 0.075 based on values for cereal stems and leaves, leafy vegetables and non-leafy vegetables (Table 17.1 in [19]). 125I activity values measured in the experiments for Figure 1 were therefore transformed to have a geomean CR of 0.075. In this selection of species, inter-species differences in transformed CR following acute 4 h exposure varied from 0.0005 (Bergenia cordifolia) to 0.127 (Salvia splendens), a variability of recommended CR values that if it had been produced, for example, by different soil types would be regarded as very significant.
Table 1. Residual Maximum Likelihood I concentrations in 103 species of angiosperm listed according to the Angiosperm Phylogeny Group III system. (Study 1: [20]; Studies 2–14: [21]; Study 15: [22]; Studies 16–19: [23]; Studies 20–23: [24]; Studies 24–26: [25]; Study 27: [26]; Study 28: [27]; Studies 29–35 Experiments for this study; Study 36: [10]; Study 37: [28].
“Class”“Subclass”“Superorder”OrderFamilyGenus + SpeciesRelative Mean (I)Studies
MONOCOTSLilianaeCommelinidsCommelinalesCommelinaceaeCommelina coelestis2.64630
ZingiberalesCannanaceaeCanna indica2.33331
ZingiberaceaeZingiber officinale0.01631
PoalesCyperaceaeCarex nigra0.84230
JuncaceaeJuncus effusus0.39331
PoaceaeAgrostis tenuis1.8711, 16
Agrostis alba2.02116
Arrenatherum elatius1.88716
Cynosuarus cristatus2.24416
Dactylis glomerata1.8041, 16
Festuca arundinacea2.13816
Festuca rubra1.73316
Festuca pratensis2.02116
Holcus lanatus0.5121,19
Hordeum vulgare2.8022, 3, 4, 5, 6, 7, 8, 9, 10, 11, 12, 13, 14, 15
Lolium perenne2.311, 16, 20, 21, 22, 23
Lolium multiflorum2.29916
Lolium hybridum1.7021
Phleum pratense2.29616, 20, 21, 22, 23
Poa annua0.6661
Poa trivialis1.591, 16
Poa pratense2.02116
Triticum aesitvum2.85224, 25, 26
Zea mays0.10815, 29
Non-CommelenidsAsparagalesIridaceaeSisyrinchium striatum1.48432
AmaryllidaceaeAllium cepa0.62227, 30, 36, 37
Allium sativum2.32127
Allium porum2.56527
EUDICOTSRanunculanaeranunculiidsRanunculalesPapaveraceaePapaver commutatum−0.00433
RosanaefabidsCucurbitalesCucurbitaceaeCucumis sativa−2.13127
Cucumis melo1.87227
Cucurbita maxima0.61127
Potentilla anserina−0.36718
FabalesFabaceaeCicer arietinum2.71929
Faba vulgaris−1.11727
Lupinus angustifolius0.41229
Medicago sativa2.09931
Medicago lupulina1.84417
Phaseolus vulgaris1.29215, 27
Pisum sativum2.5052, 3, 4, 5, 6, 7, 8, 9, 10, 11, 12, 13, 27
Trifolium repens1.3551, 16, 17, 19, 20, 21, 22, 23
Trifolium subterraneum1.6111
Trifolium pratense0.9231,17,18,20,21,22,23
MalpighialesEuphorbiaceaeEuphorbia cyparasissus−0.14832
Euphorbia myrsinites−0.23231,32
LinaceaeLinum lewisii0.32831,33
Linum usitatissimum0.4731
ViolaceaeViola wittrockiana−4.13433
RosalesCannabaceaeHumulus japonica2.70135
RosaceaeFragaria vesca2.58332
malvidsBrassicalesBrassicaceaeAubretia x cultorum0.18433
Brassica napus3.25827
Brassica oleracea1.07227, 36
Brassica chinensis0.85737
Eruca vesicaria1.46129
Lepidium sativum0.13815
Raphanus sativus2.64215, 27, 36
GeranialesGeraniaceaeGeranium pratense1.15531
SaxifrgalesSaxifrgaceaeBergenia cordifolia−0.49730
MalvalesCistaceaeHelianthemum nummularium−0.83833
CaryophyllanaecaryophylidsCaryophyllalesAmaranthaceaeAmaranthus paniculatus1.91234
Beta rapa3.71827
Beta cycla1.02527
Beta vulgaris2.74915, 29
Celosia cristata1.18430
Spinacia oleracea1.07215, 27, 33, 37
CaryophyllaceaeCerastium holosteiodes2.44317, 18
PolygonaceaeDianthus caryophyllus1.430
Rheum tataricum0.98630
Rumex acetosa1.80117, 18, 19, 27
Rumex obtusifolius2.48517, 18
AsteranaelamiidsEricalesPolemoniaceaeGilia tricolor1.75531
GentianalesRubiaceaeCinchona pubescens−5.53335
Galium vernum−0.29931
LamialesLamiaceaeGlechoma hederacea2.48818
Mentha spicata1.93330
Plectranthus blumei2.2234
Salvia Blaze of Fire'2.19933
OleacaeFraxinus excelsior−1.83531
PlantaginaceaePlantago major1.76317, 18, 19
Plantago lanceolata1.91117, 18, 19
Antirrhinum major1.62431
Digitalis purpurea1.5831
Veronica spicata2.36632
Veronica chamaedrys2.48818
SolanalesSolanceaeLycopersicon esculentum3.61527, 32
Solanum tuberosum−6.82827
Solanum melongena0.0827, 36
Solanum macrocarpon0.58730
ConvolulaceaeIpomea aquatica2.38537
campanulidsApialesApiaceaeApium graveolens−0.92830, 37
Daucus carota2.26527, 29, 37
Heracleum sphondylium−6.82818
Petroselinum crispum2.71927
Scandix cerifolium1.81327
AsteralesAsteraceaeAster x frikartii1.15330
Lactuca sativa0.15915, 24, 25, 26, 27, 29, 36
Helianthus annuus2.86229
Taraxicum officinales−6.82817, 18
Cichorum intybus−6.82827
Cichorum angustifolium1.68427
DipsacalesDipsacaceaeDipsacus fullonium1.09634
Lamium album3.07618
Figure 1. Mean I concentration ratios for 47 different species of plants all grown under the same conditions. Plants were exposed to 125I for 4 h and above ground green shoots harvested and analyzed for 125I activity. Activities were then transformed to give a mean value of 0.075—the mean soil-to-plant concentration ratio recommended by the IAEA (2014) (n = 5, ± 1 × SE).
Agronomy 05 00537 g001

2.2. Taxonomic Influence on Relative Mean I Concentration

Although Q-Q normality plots showed that the REML-modeled mean iodine concentrations in Table 1 approached a normal distribution (Figure 2), they failed the Shapiro-Wilkes test primarily because of a few low values, mostly from study 27 (Heracleum sphondylium, Taraxacum officinale, and Cichorium intybus). Given that ANOVA is relatively robust to the assumption of normality and that there were other values from study 27 in the database, the whole dataset of 103 REML-modeled mean species values was used to analyze for taxonomic effects. Nested ANOVA coded with the APG III angiosperm phylogeny showed that REML-estimated relative mean I concentrations were significantly different between genera within families (Table 2) and between “Superorder”. Using unbalanced nested factors in ANOVA can produce artifacts so we used the same unbalanced taxonomic hierarchy to analyze 103 random numbers with a range of −6.83 to 3.71 (Table 3). This confirmed that, in the database we compiled, the significant nested differences we found were real, indicating that there are significant differences in iodine concentrations in plants associated with taxonomic categories above the species level. A T-test on REML-estimated data between the Monocots and Eudicots (“Classes”) indicated a highly significant difference between them (t = 2.88, df = 100, p = 0.005). Transformation of these values into CRs with a geometric mean of recommended IAEA values predicts significant differences between Monocots and Eudicots in CRs (Figure 3a). One-way ANOVA of REML-modeled values showed that there were significant differences between the Lilianae, Rosanae, Caryophyllanae and Asteranae (F = 2.95, p = 0.037) and produced predictions of significantly different mean CRs for these “Subclasses” (Figure 3b). At the ordinal level, when Orders with 3 or fewer species were excluded, there were significant differences between Orders (F = 2.05, p = 0.045). The Poales (incl. cereals and relatives), Asparagales (incl. onions and relatives), Caryophyllales (incl. beets and their relatives) and Lamiales (incl. mints and their relatives) had I concentrations significantly higher than the Malphigiales (flax and its relatives) and the Apiales (incl. carrot and its relatives) (F = 2.05, p = 0.045), again allowing us to predict significant differences in CR for these orders (Figure 3c). For Beta vulgaris one-way ANOVA showed that there were significant differences between varieties (p = 0.002, F = 6.544), Holm–Sidak tests indicating that Italian Chard had significantly higher concentrations than Mangel–Wurzel, Cheltenham Green and Perpetual Spinach (Figure 4). There were no inter-varietal differences in the concentrations of 125I in the C. arietinum varieties (Figure 4). Overall, it seems clear that the differences between taxa in I concentrations are not all associated with species and that not only is there a significant amount of variance associated with categories above the species level that can be used to make general predictions of CR but also that there can be differences in I uptake between varieties.
Table 2. Results of nested ANOVA of Residual Maximum Likelihood (REML)-modeled concentrations of iodine. Concentrations of 103 species of plants were analyzed using nested taxonomic units as factors—“Subclass” was nested within “Class”, then “Superorder” within “Subclass” within “Class” and so on. A general linear model that excluded the intercept was used.
FactordfSS%SSCumulative SSMSFp-value
“Class”238.284.804.0219.146.260.053
“Subclass”37.370.925.722.452.530.136
“Superorder”31.960.245.970.650.150.928
Order1248.216.0512.024.011.030.494
Family1250.376.3218.344.190.820.623
Genus45239.0630.048.345.312.780.004
Species2445.795.7454.091.900.350.895
Residual98365.7845.90100
Table 3. Results of nested ANOVA of random numbers. Random numbers between −6.83 and 3.70 for 103 species of plants were analyzed using the same taxonomy as for Table 2.
FactordfSS%SSCumulative SSMSFp-value
“Class”267.163.323.3233.582.850.211
“Subclass”335.571.764.0811.861.390.358
“Superorder”324.711.226.308.230.640.603
Order12157.347.7814.0813.111.190.394
Family12129.006.3820.4510.751.280.254
Genus45355.4317.5738.027.890.780.774
Species24244.6512.0950.1210.1914.620.204
Residual981009.1849.88100
Figure 2. Normal Q-Q (Quantile-Quantile) plot of REML-modeled relative iodine concentrations in 103 species of plants. The data approach a normal distribution but fail the Shapiro–Wilkes test of normality primarily because of a few low values.
Agronomy 05 00537 g002
Figure 3. The mean Concentration Ratios predicted in angiosperm taxa according to the phylogeny of APG III (2009). (a) “Class”, 1 = Monocots (n = 28), 2 = Eudicots (73); (b) “Subclass”, 1 = Lilianae (n = 28), 2 = Rosanae (n = 30), 3 = Caryophyllanae (n = 11), 4 = Asteranae (n = 31); (c) Order. 1 = Poales (21), 2 = Asparagales (4), 3 = Fabales (n = 10), 4 = Malphigiales (n = 5), 5 = Brassicales (n = 7), 6 = Caryophyllales (n = 11), 7 = Lamiales (n = 12), 8 = Solanales (n = 4), 9 = Apiales (n = 5), 10 = Asterales (n = 6).
Agronomy 05 00537 g003
Figure 4. Mean I activities of shoots in varieties of seven-week-old Beta vulgaris and Cicer arietenum exposed to an acute dose of 125I. (n = 5, SEs).
Agronomy 05 00537 g004

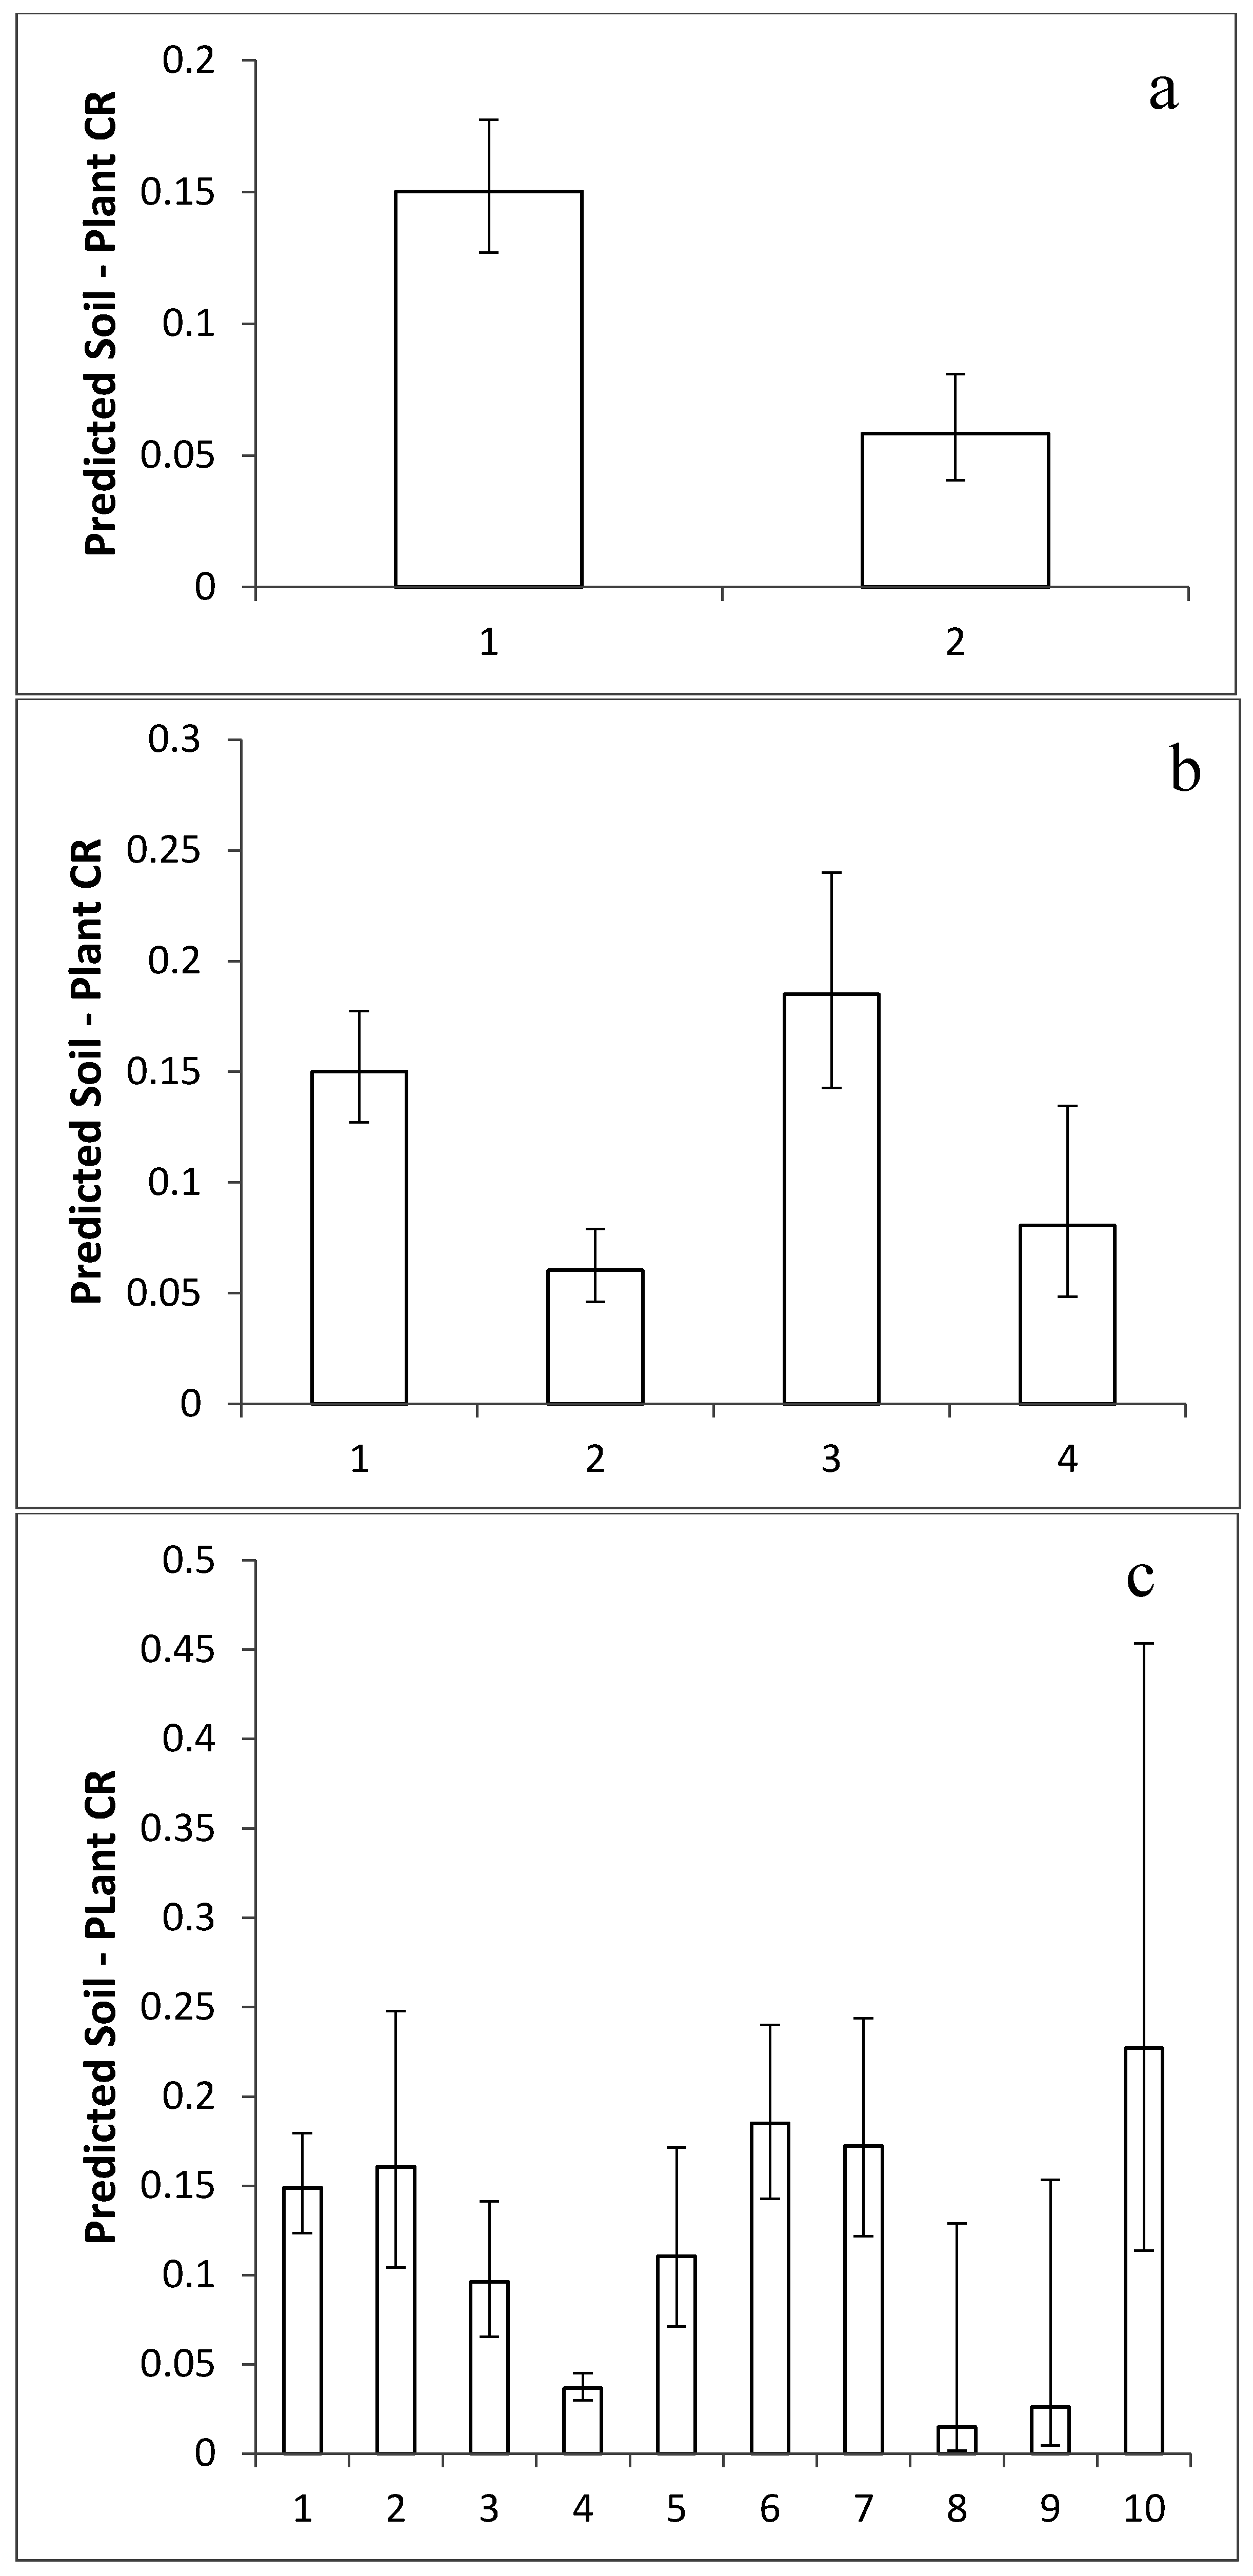
2.3. Comparison of Taxonomic Effects

In total about 12% of the variance in I concentrations was accounted for by ranks of Order (Table 2). This is greater than the influence on N (3.3%) and P (6.8%), [16], but less than that for Cs (23.3%) [17], Pb (20%), Cr (24%), Cu (24%), [11], Na (23%) [16], Cd (27%) [11], Zn (44%), Ni (46%) [11], K (49%) [16], and Ca (63%) [15]. Of the elements for which phylogenetic influences have been detected, I is most closely related to Cl. In the only published analysis of relative mean concentration for Cl [18] there are 24 species that are also in Table 1. There was no correlation between relative mean I and Cl values in these species.

3. Discussion

Table 1 and Figure 1 indicate that there is a wide range of I concentrations between plant species. They confirm the existence of inter-species differences in I concentrations of sufficient magnitude to support previous suggestions that crop species might be as important as soil type in determining I concentrations in crop plants [21]. For elements in which there are very small phylogenetic influences above the species level there is very little variance attributable to taxonomic levels above the species. Table 2 shows that there is a phylogenetic influence on inter-species differences in iodine concentration, especially for Genera within Families. Figure 4 indicates that inter-varietal differences in I concentrations do occur, strengthening the assertion that there is nothing especially significant about the species as a taxonomic unit to describe inter-taxa differences in I concentrations in plants. These observations suggest, for the first time, (a) that angiosperm phylogeny influences the I concentrations of plants; (b) that the species is not an independent sampling unit for I concentrations in plants; and (c) that it might be possible to make general predictions of relative I concentrations in food crops based on phylogeny. If correct, such insights are potentially useful for understanding the agricultural chemistry and food toxicology of I.
The validity of the general insights above, however, depends on a number of assumptions about the relative mean concentrations reported in Table 1. First, a high proportion of the data in Table 1 are from experiments with 125I. There is no evidence of discrimination between I isotopes during plant uptake and 125I has previously been used as a proxy for other I isotopes in uptake experiments [22], so we assume that the data for 125I are very likely to represent the behavior of I isotopes of more agricultural and toxicological significance. Second, it is likely that the acute exposures to I used to generate much of the data in Table 1 will not produce exactly the same relative mean concentrations in plants as chronic exposures. However, much nutrient uptake takes place during the exponential phase of growth when our plants were exposed so we assume that our observations will approximate inter-species differences that might be found following chronic exposures. Nevertheless the data in Table 1 may be more directly relevant to acute exposures to 129I (which can be radioecologically significant, for example, during pulsed movement up through soil profiles [6]) than to long-term uptake of 127I. And third, it is important to acknowledge that the relative mean concentrations between plant species reported in Table 1 might not be the same under all environmental conditions, i.e., there might be an interaction between environment and inter-species differences. Despite these assumptions, it is notable that similar observations to those we make above for I have been reported for numerous other elements using a variety of isotopes, exposure times and environmental regimes [11,14,15,16,17,18]. Thus, given that it is the most taxonomically wide-ranging database yet reported for inter-species differences in plant I concentrations and that it is compatible with results for other elements, Table 1 provides a basis for initiating assessments of the influence of phylogeny on I concentrations in plants. There have been detailed studies of the translocation of I in plants and its partitioning between plant parts [22], which clearly affect I concentrations in food stuffs. As the data in Table 1 focuses on green shoots in toto, phylogenetic influences identified might provide background concentrations upon which internal partitioning is imposed.
If there is no effect of phylogeny on inter-species differences in uptake then, as is approximately the case for N and P [16], there will be no variance associated with taxonomic levels above the species. This is not the case for I and we conclude that Table 1 and Table 2 show that there is an influence of phylogeny on differences in I concentrations between plant species. This gives further support to the assertion that particular taxa of plants have characteristic mineralogies and that a phylogenetic perspective on plant contribution to the transfer of elements in the soil-crop system might be useful [16]. A phylogenetic influence also means that plant species are not independent sampling units for I, i.e., great care must be taken in statistical analysis of I transfer in the soil-crop system as many techniques, such as regression, make the assumption that samples from different species are independent. In contrast to the frequency distribution of relative concentrations of some elements [15], I concentrations in plants are not normally distributed. This indicates that the parametric statistics often used in soil-crop transfer analysis must be used with care in analyses with numerous species. Normal distributions of phenotypes are often characteristic of polygenic, “quantitative”, traits. Quantitative techniques, such as the Quantitative Trait Loci analysis used to locate genes impacting on the concentration of other elements in plants [29,30] might have to be used with care for analysis of the genetic factors affecting the I chemistry of crops.
Detailed analyses of the effects of phylogeny necessitate concentration values for more than 103 species but some patterns do emerge from the analysis carried out here. It seems clear that, as is the case with some other elements [16,17], there is a significant difference in I concentration between Monocot and Eudicot plants. Of Orders with significant numbers of food crops the analysis reported here indicates that plants in the Poales (cereals and relatives), Asparagales (onions and relatives), and Caryophyllales (beets, amaranths, buckwheat and relatives) might have higher than average I concentrations. These Orders might worth further investigations if explanations for dietary loadings of I are being sought, particularly as some of these Orders are represented by few species in Table 1. Further investigations might, for example, test the suggestion that at a given soil availability of I, cereal grains such as amaranths and buckwheat might provide higher I concentrations than grains such as wheat or rice. These effects might be used to expand the reported general pattern of I concentrations in foodstuffs of legumes > vegetables > fruit [31] because they suggest that there are groups of plants with significantly higher I concentrations than legumes.
Figure 4 suggests that although there might be some inter-varietal differences in I concentrations in some crops, they might be small compared to inter-specific differences. This supports conclusions of previous studies with numerous varieties of clover, grasses and other herbage crops [23,25,32]. Nevertheless, further analyses might very usefully compare the amount of variation above and below the species level in order to determine the extent to which I concentrations in plant biomass can be altered by choosing different varieties or different species. The phylogenetic effects described above have some similarity to those we have reported for Cl [18], especially the higher than average values in the Caryophyllales. However, we found no direct correlation in relative mean values for 24 species that occur in both data sets. It might be interesting to investigate, using a dataset with more species, if this lack of correlation reflects real differences in the behavior of I and Cl.
In the database compiled here, loge-transformed values subject to REML-modeling are approximately normally distributed. Using the IAEA recommended value and back transforming modeled values to CRs, confirms the loge-normal distribution of I concentrations in plants and enables us to predict geometric mean CRs for different plant groups and 95% confidence intervals (Figure 2). These suggest that significantly improved predictions of CR for radioiodine can be made by taking taxonomic group into account, with splitting the recommended CR into two, one for Monocots and one for Eudicots, bringing about a significant improvement in predicted CR very simply (Figure 2a). Such overall predictions for groups of many species are very useful in the case of a contamination event in which many Monocots and Eudicots might be contaminated simultaneously. In different ecosystems that have different proportions of Monocots and Eudicots, the predicted CRs in Figure 2 could significantly improve predictions of overall radioiodine transfer from soils to plants.
Overall, in both agriculture and radioecology inter-taxa differences in I uptake by plants are important—in addition to iodized salt and irrigation water, it has been suggested that crop selection and/or breeding might help to provide increases in I concentration in food [31] and predictions of radioiodine movement into foodchains use CRs for soil-to-plant transfer. The data reported here improve the understanding of inter-taxa differences in I concentrations, and by initiating investigations of the phylogenetic distribution of the diversity in I uptake, might help to identify those groups of plants with particular I concentrations thus benefitting both agricultural supply of iodine and predictions of radioiodine transfer to food, flora and fauna.

4. Experimental Section

4.1. Plant Growth

For each of the 47 species, 5 replicates, in 12 cm pots, each filled with 250 g of Levington’s F2S compost (Fisons, Ipswich, UK) (Table 1), were grown for approximately 7 weeks, i.e., to the exponential phase of growth and before anthesis, in a greenhouse with 16 h day and 8 h night at ca. 24 °C and 16 °C, respectively. The 47 species were radiolabeled in 7 experimental sets (“studies”) (Table 1). Forty-seven species were selected to provide a spread across the angiosperm phylogeny. In addition, 5 replicates of each of 5 additional varieties of Beta vulgaris and 4 additional varieties of Cicer arietinum were also radiolabeled—which gave 54 taxa in total. Five replicates of Carex nigra, Canna indica, Geranium pratense, Euphorbia myrsinites and Linum lewisii were labeled in two experimental blocks to provide linking species between blocks. Seeds were supplied by Chiltern Seeds (Cumbria, UK), Kings Seeds (Essex, UK) and the Institute for Crop Research in the Semi-Arid Tropics (Patencheru, Telangana, India).

4.2. Radiolabeling with 125I

Following trial experiments to establish appropriate labeling volumes, carriers, activities and exposures, 50 mL of 50 μM KI radiolabeled with 74 kBq of 125I were added to each pot. During radiolabeling, replicate pots of each species were arranged in a randomized block design in an arena in the laboratory with artificial lighting at ca. 350 Eμ−2s−1. Pots were not watered for 24 h prior to radiolabeling and were placed in the arena with the lights on at least 1 h before the addition of radioactivity. Entire green shoots were harvested 1 cm above soil level 4 h after the radiolabel was added, dried for at least 48 h at 80 °C and then ground up. Ground plant samples were analyzed for 125I γ emissions, with appropriate calibrations and blanks, on an LKB Wallac Compugamma “1282” (NaI (Tl) detector).

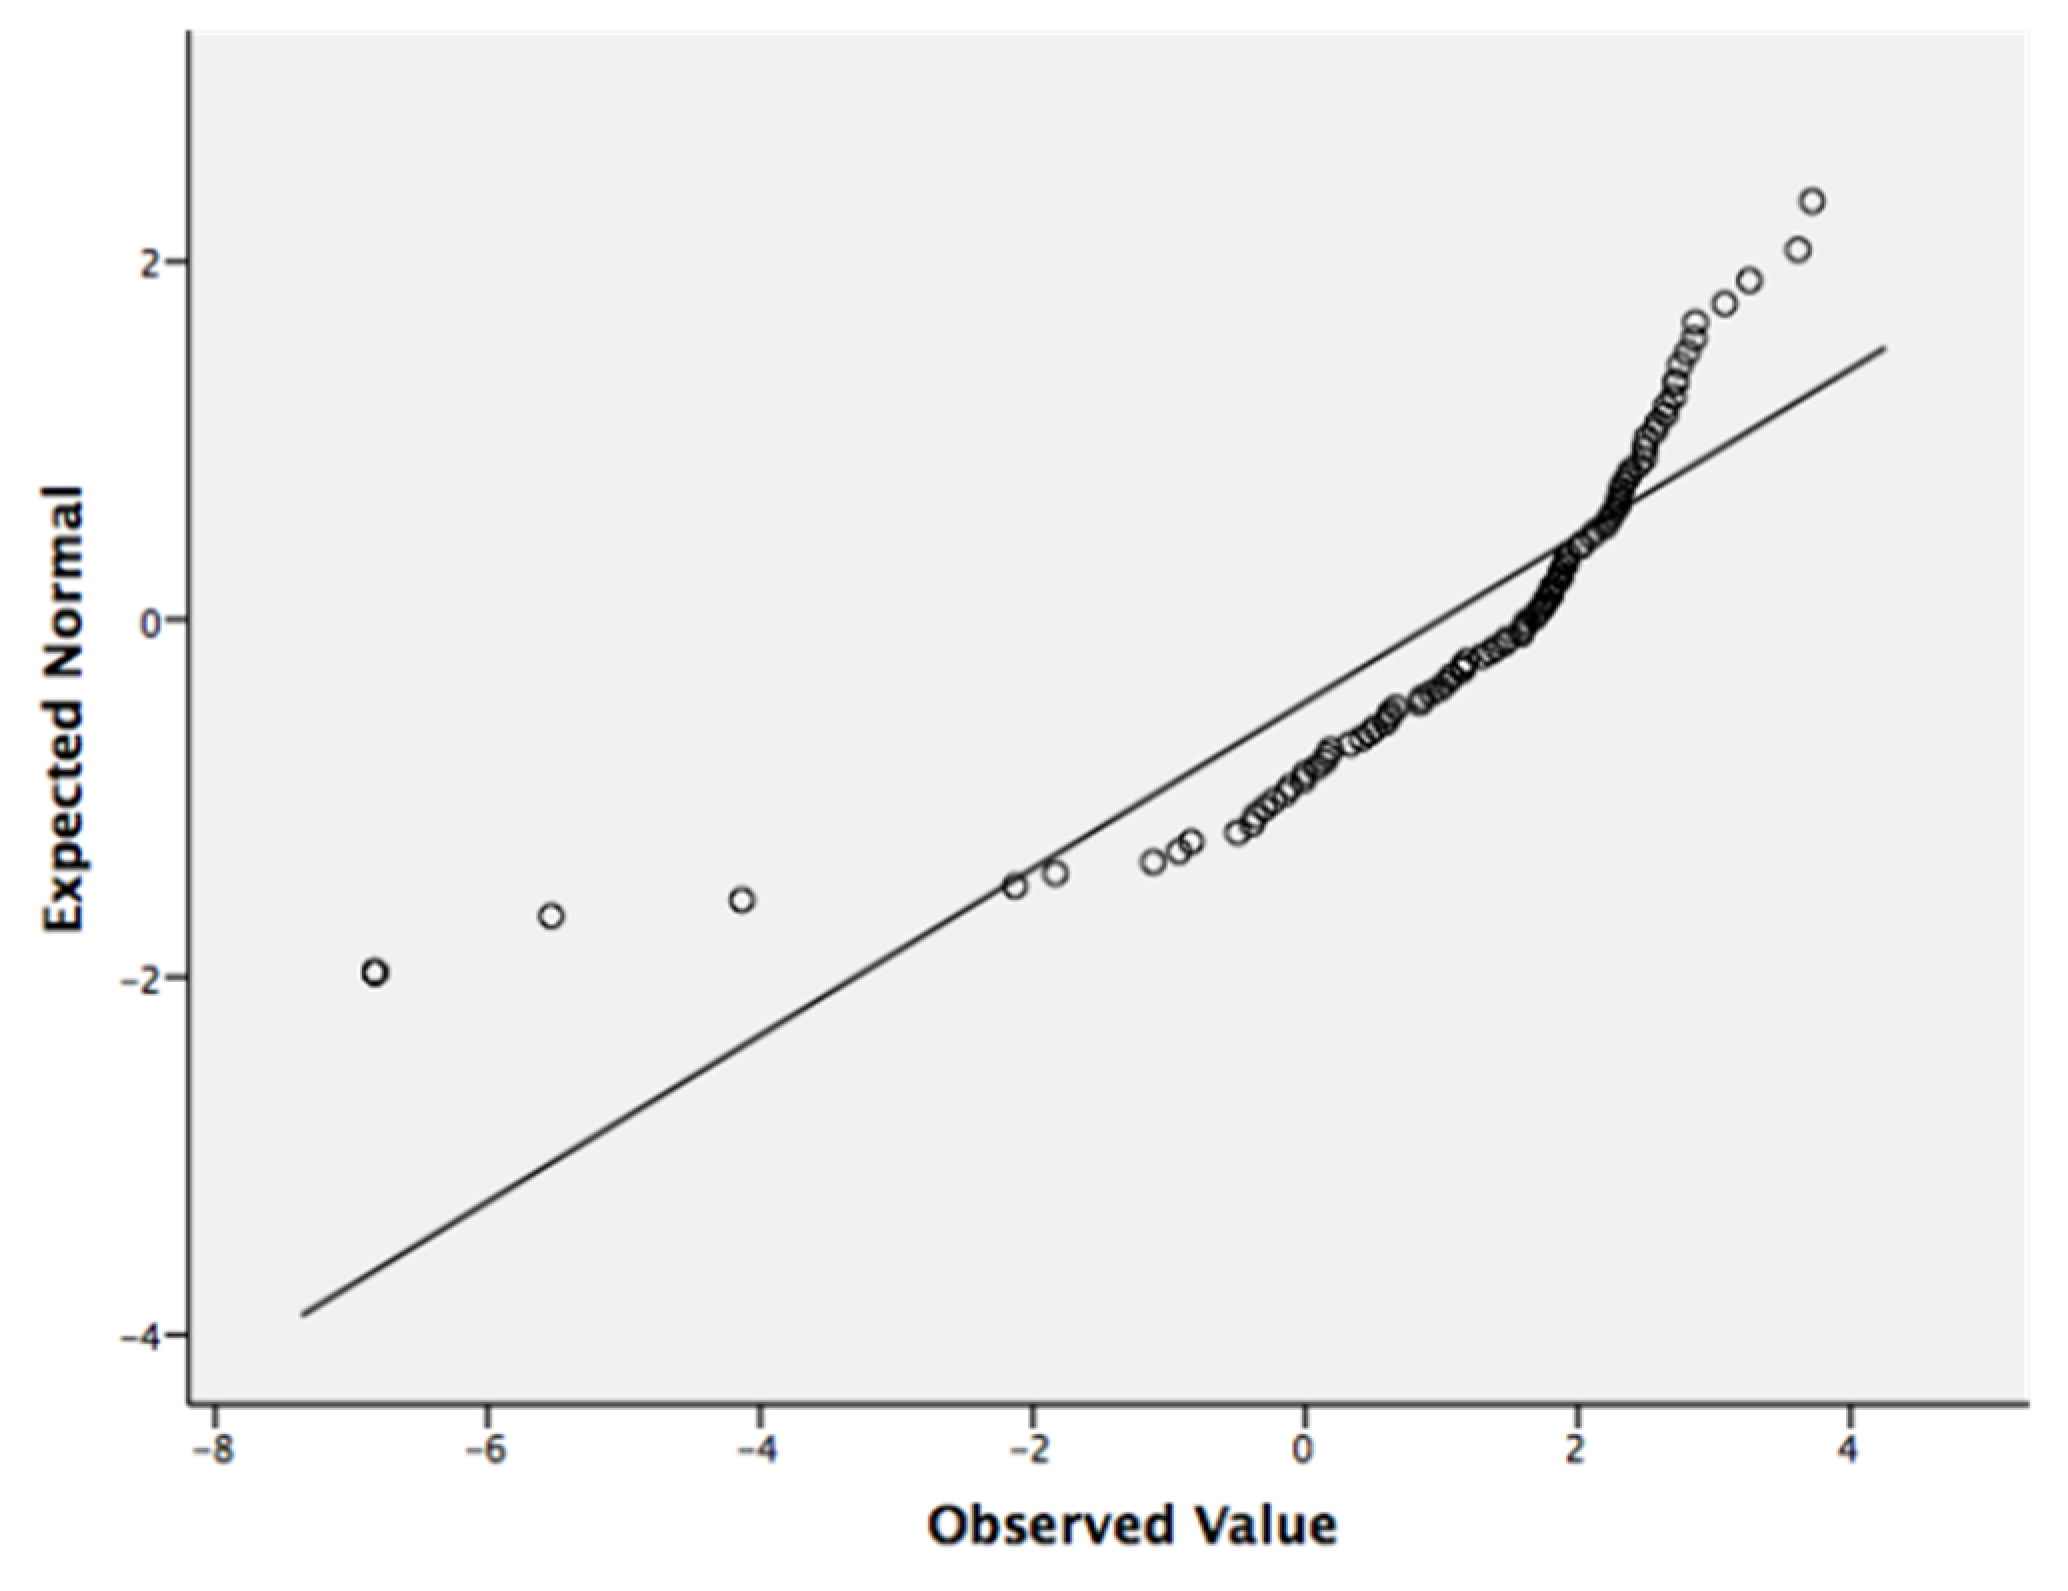
4.3. Residual Maximum Likelihood Analysis (REML)

As used in previous studies [11,14,15,16,17,18] REML modeling was used to estimate relative mean I concentrations across the seven experimental blocks reported here plus the literature data of similar inter-species comparisons of I uptake. There were 30 “studies” identified from 10 literature sources [10,20,21,22,23,24,25,26,27,28] that reported I concentration values after similar experiments, i.e., I concentrations in green shoots after simultaneous root exposures in two or more plant species. There were concentration values for 56 species in these literature sources of which 6 also occurred in the experiments carried out for this analysis. Overall, therefore, the data for analysis included 103 species (47 + 65 − 9) from 37 “studies” (7 + 30) (Table 1). In the REML modeling of I concentrations there were 440 concentration values in 37 “blocks” (studies) from 103 “treatments” (species). The REML modeling accounts for the effect of block (study) on concentration to estimate relative mean concentrations in the treatments (species) across the whole dataset. Differences in absolute concentrations arising from different substrates and exposure conditions are, therefore, accounted for statistically. Raw data were loge-transformed before REML analysis. REML analysis can produce negative as well as positive values [33] and was run on the statistical package SPSS.

4.4. Analysis of Taxonomic Effects

Following REML analysis, the mean I concentrations in species were analyzed using an unbalanced hierarchical Analysis of Variance (ANOVA) coded with the angiosperm phylogeny group III [34]. The nominal designations of “Class”, “Subclass” and “Superorder” were used for categories above the Order, although their application to recent phylogenies is unresolved. Tests for normality of I concentrations using the Shapiro–Wilkes test, and all ANOVAs were carried out on SPSS v 22.0 for Mac (SPSS, Armonk, New York, USA).

Acknowledgments

We would like to thank Judy Brown, Roy Bennet and Janine Wilkins of the University of the West of England (UK) for radioanalytical support, the Natural Environment Research Council, the Environment Agency and the Nuclear Decommissioning Authority (all UK) who provided financial support through the RATE programme and ICRISAT, Telengana, India for chickpea varieties.

Author Contributions

Eleni Siasou compiled the database. Eleni Siasou and Neil Willey analyzed the data and wrote the manuscript.

Conflicts of Interest

The authors declare no conflicts of interest.

References

  1. Zhu, Y.-G.; Huang, Y.-Z.; Hu, Y.; Liu, Y.-X. Iodine uptake by spinach (Spinacia oleracea L.) plants grown in solution culture: Effects of iodine species and solution concentrations. Environ. Int. 2003, 29, 33–37. [Google Scholar] [CrossRef]
  2. Sheppard, S.C. Interpolation of solid/liquid partition coefficients, Kd, for iodine in soils. J. Environ. Radioact. 2003, 70, 21–27. [Google Scholar] [CrossRef]
  3. Welch, R.M.; Graham, R.D. A new paradigm for world agriculture: Meeting human needs—Productive, sustainable, nutritious. Field Crops Res. 1999, 60, 1–10. [Google Scholar] [CrossRef]
  4. Zimmermann, M.B.; Andersson, M. Prevalence of iodine deficiency in Europe in 2010. Ann. Endocrinol. 2011, 72, 164–166. [Google Scholar] [CrossRef] [PubMed]
  5. Fréchou, C.; Calmet, D. 129I in the environment of the La Hague nuclear fuel reprocessing plant—From sea to land. J. Environ. Radioact. 2003, 70, 43–59. [Google Scholar] [CrossRef]
  6. Ashworth, D.J.; Shaw, G.; Butler, A.P.; Cociani, L. Soil transport and plant uptake of radio-iodine from near-surface groundwater. J. Environ. Radiact. 2003, 70, 99–114. [Google Scholar] [CrossRef]
  7. Sheppard, M.; Thibault, D.H. Default soil solid/liquid partition coefficients, Kds, for four major soil types: A compendium. Health Phys. 1990, 59, 471–482. [Google Scholar] [PubMed]
  8. Sheppard, S.C.; Motycka, M. Is the Akgare phenomenon important to iodine uptake by wild rice (Zizania aquatica)? J. Environ. Radioact. 1997, 37, 339–353. [Google Scholar] [CrossRef]
  9. White, P.J.; Broadley, M.R. Chloride in soils and its uptake and movement within the plant. Ann. Bot. 2001, 88, 967–988. [Google Scholar] [CrossRef]
  10. Ban-Nai, T.; Muramatsu, Y. Transfer factors of radioiodine from volcanic-ash soil (Andosol) to crops. J. Radiat. Res. 2003, 44, 23–30. [Google Scholar] [CrossRef] [PubMed]
  11. Broadley, M.R.; Willey, N.J.; Mead, A. A method to assess taxonomic variation in shoot caesium concentration among flowering plants. Environ. Pollut. 1999, 106, 341–349. [Google Scholar] [CrossRef]
  12. APG (Angiosperm Phylogeny Group) II. An update of the Angiosperm Phylogeny Group classification for the orders and families of flowering plants: APG II. Bot. J. Linnean Soc. 2003, 141, 399–436. [Google Scholar]
  13. Soltis, P.S.; Soltis, D.E.; Chase, M.W. Angiosperm phylogeny inferred from multiple genes as a research tool for comparative biology. Nature 1999, 402, 402–404. [Google Scholar] [CrossRef] [PubMed]
  14. Broadley, M.R.; Willey, N.J.; Wilkins, J.; Baker, A.J.M.; Mead, A.; White, P.J. Phylogenetic variation in heavy metal accumulation in angiosperms. New Phytol. 2001, 152, 9–27. [Google Scholar] [CrossRef]
  15. Broadley, M.R.; Bowen, H.C.; Cotterill, H.L.; Hammond, J.P.; Meacham, M.C.; Mead, A.; White, P.J. Variation in the shoot calcium content of angiosperms. J. Exp. Bot. 2003, 54, 1–16. [Google Scholar] [CrossRef]
  16. Broadley, M.R.; Bowen, H.C.; Cotterill, H.L.; Hammond, J.P.; Meacham, M.C.; Mead, A.; White, P.J. Phylogenetic variation in the shoot mineral concentration of angiosperms. J. Exp. Bot. 2004, 55, 321–336. [Google Scholar] [CrossRef] [PubMed]
  17. Willey, N.J.; Tang, S.; Watt, N. Predicting inter-taxa differences in plant uptake of 134/137Cs. J. Environ. Qual. 2005, 34, 1478–1489. [Google Scholar] [CrossRef] [PubMed]
  18. Willey, N.J.; Fawcett, K. Species selection for phytoremediation of 36Cl/35Cl using angiosperm phylogeny and inter-taxa differences in uptake. Int. J. Phytoremediation 2005, 7, 295–306. [Google Scholar] [CrossRef] [PubMed]
  19. International Atomic Energy Agency. Handbook of Parameter Values for the Prediction of Radionuclide Transfer in Terrestrial and Freshwater Environments; Technical Report Series; IAEA: Vienna, Austria, 2010; p. 472. [Google Scholar]
  20. Butler, G.W.; Johnson, J.M. Factors influencing the iodine content of pasture herbage. Nature 1957, 179, 216–217. [Google Scholar] [CrossRef]
  21. Moiseyev, I.T.; Tikhomirov, F.A.; Perevezentsev, V.M.; Rerikh, L.A. Role of soil properties, inter-specific plant differences, and other factors affecting the accumulation of radioactive iodine in crops. Sov. Soil Sci. 1984, 16, 60–66. [Google Scholar]
  22. Cline, J.F.; Klepper, B. Iodine-125 accumulation in plant parts: Influence of water use rate and stable iodine content of soil. Health Phys. 1975, 28, 801–804. [Google Scholar] [CrossRef] [PubMed]
  23. Hartmans, J. Factors affecting the herbage iodine content. Neth. J. Agric. Sci. 1974, 22, 195–206. [Google Scholar]
  24. Sheppard, S.C.; Evenden, W.G.; Amiro, B.D. Investigation of the soil-to-plant pathway for I, Br, Cl and F. J. Environ. Radioact. 1993, 21, 9–32. [Google Scholar] [CrossRef]
  25. Whitehead, D.C. Uptake and distribution of iodine in grass and clover plants grown in solution culture. J. Sci. Food Agric. 1973, 24, 43–50. [Google Scholar] [CrossRef] [PubMed]
  26. Kashparov, V.; Colle, C.; Zvarich, S.; Yoshenko, V.; Levchuk, S.; Lundin, S. Soil-to-plant halogen transfer studies. J. Environ. Radioact. 2005, 79, 187–204. [Google Scholar] [CrossRef] [PubMed]
  27. Bourchet, M.P. Sur l’absorption de l’iode par les végétaux. Acad. Sci. Paris 1899, 129, 768–770. [Google Scholar]
  28. Dai, J.L.; Zhu, Y.G.; Zhang, M.; Huang, Y.Z. Selecting Iodine-Enriched Vegetables and the residual effect of iodate application to soil. Biol. Trace Elem. Res. 2004, 101, 265–276. [Google Scholar] [CrossRef]
  29. White, P.J.; Bowen, H.C.; Willey, N.J.; Broadley, M.R. Selecting plants to minimise radiocaesium contamination of food chains. Plant Soil 2003, 249, 177–186. [Google Scholar] [CrossRef]
  30. Payne, K.C.; Bowen, H.C.; Hammond, J.P.; Hampton, C.R.; Lynn, J.R.; Mead, A.; Swarup, K.; Bennett, M.J.; White, P.J.; Broadley, M.R. Natural egentic variation in caesium (Cs) accumulation by Arabidopsis thaliana. New Phytol. 2004, 162, 535–548. [Google Scholar] [CrossRef]
  31. Johnson, C.C.; Fordyce, F.M.; Stewart, A.G. Environmental Controls in Iodine Deficiency Disorders; Project Summary Report, CR/03/058N; British Geological Survey: Keyworth, UK, 2003. [Google Scholar]
  32. Crush, J.R.; Caradus, J.R. Cyanogenesis potential and iodine concentration in white clover (Trifolium repens L.) cultivars. N. Z. J. Agric. Res. 1995, 38, 309–316. [Google Scholar] [CrossRef]
  33. Thompson, R.; Welham, S.J. REML analysis of mixed models. In The Guide to Genstat, Part 2—Statistics; Payne, R.W., Ed.; VSN International: Oxford, UK, 2001; pp. 413–503. [Google Scholar]
  34. Chase, M.W.; Reveal, J.L. A phylogenetic classification of the land plants to accompany APG III. Bot. J. Linnean Soc. 2009, 161, 122–127. [Google Scholar] [CrossRef]

