Introduction of Aureobasidium pullulans to the Phyllosphere of Organically Grown Strawberries with Focus on Its Establishment and Interactions with the Resident Microbiome

 ,
, 
Abstract
:1. Introduction
2. Results and Discussion
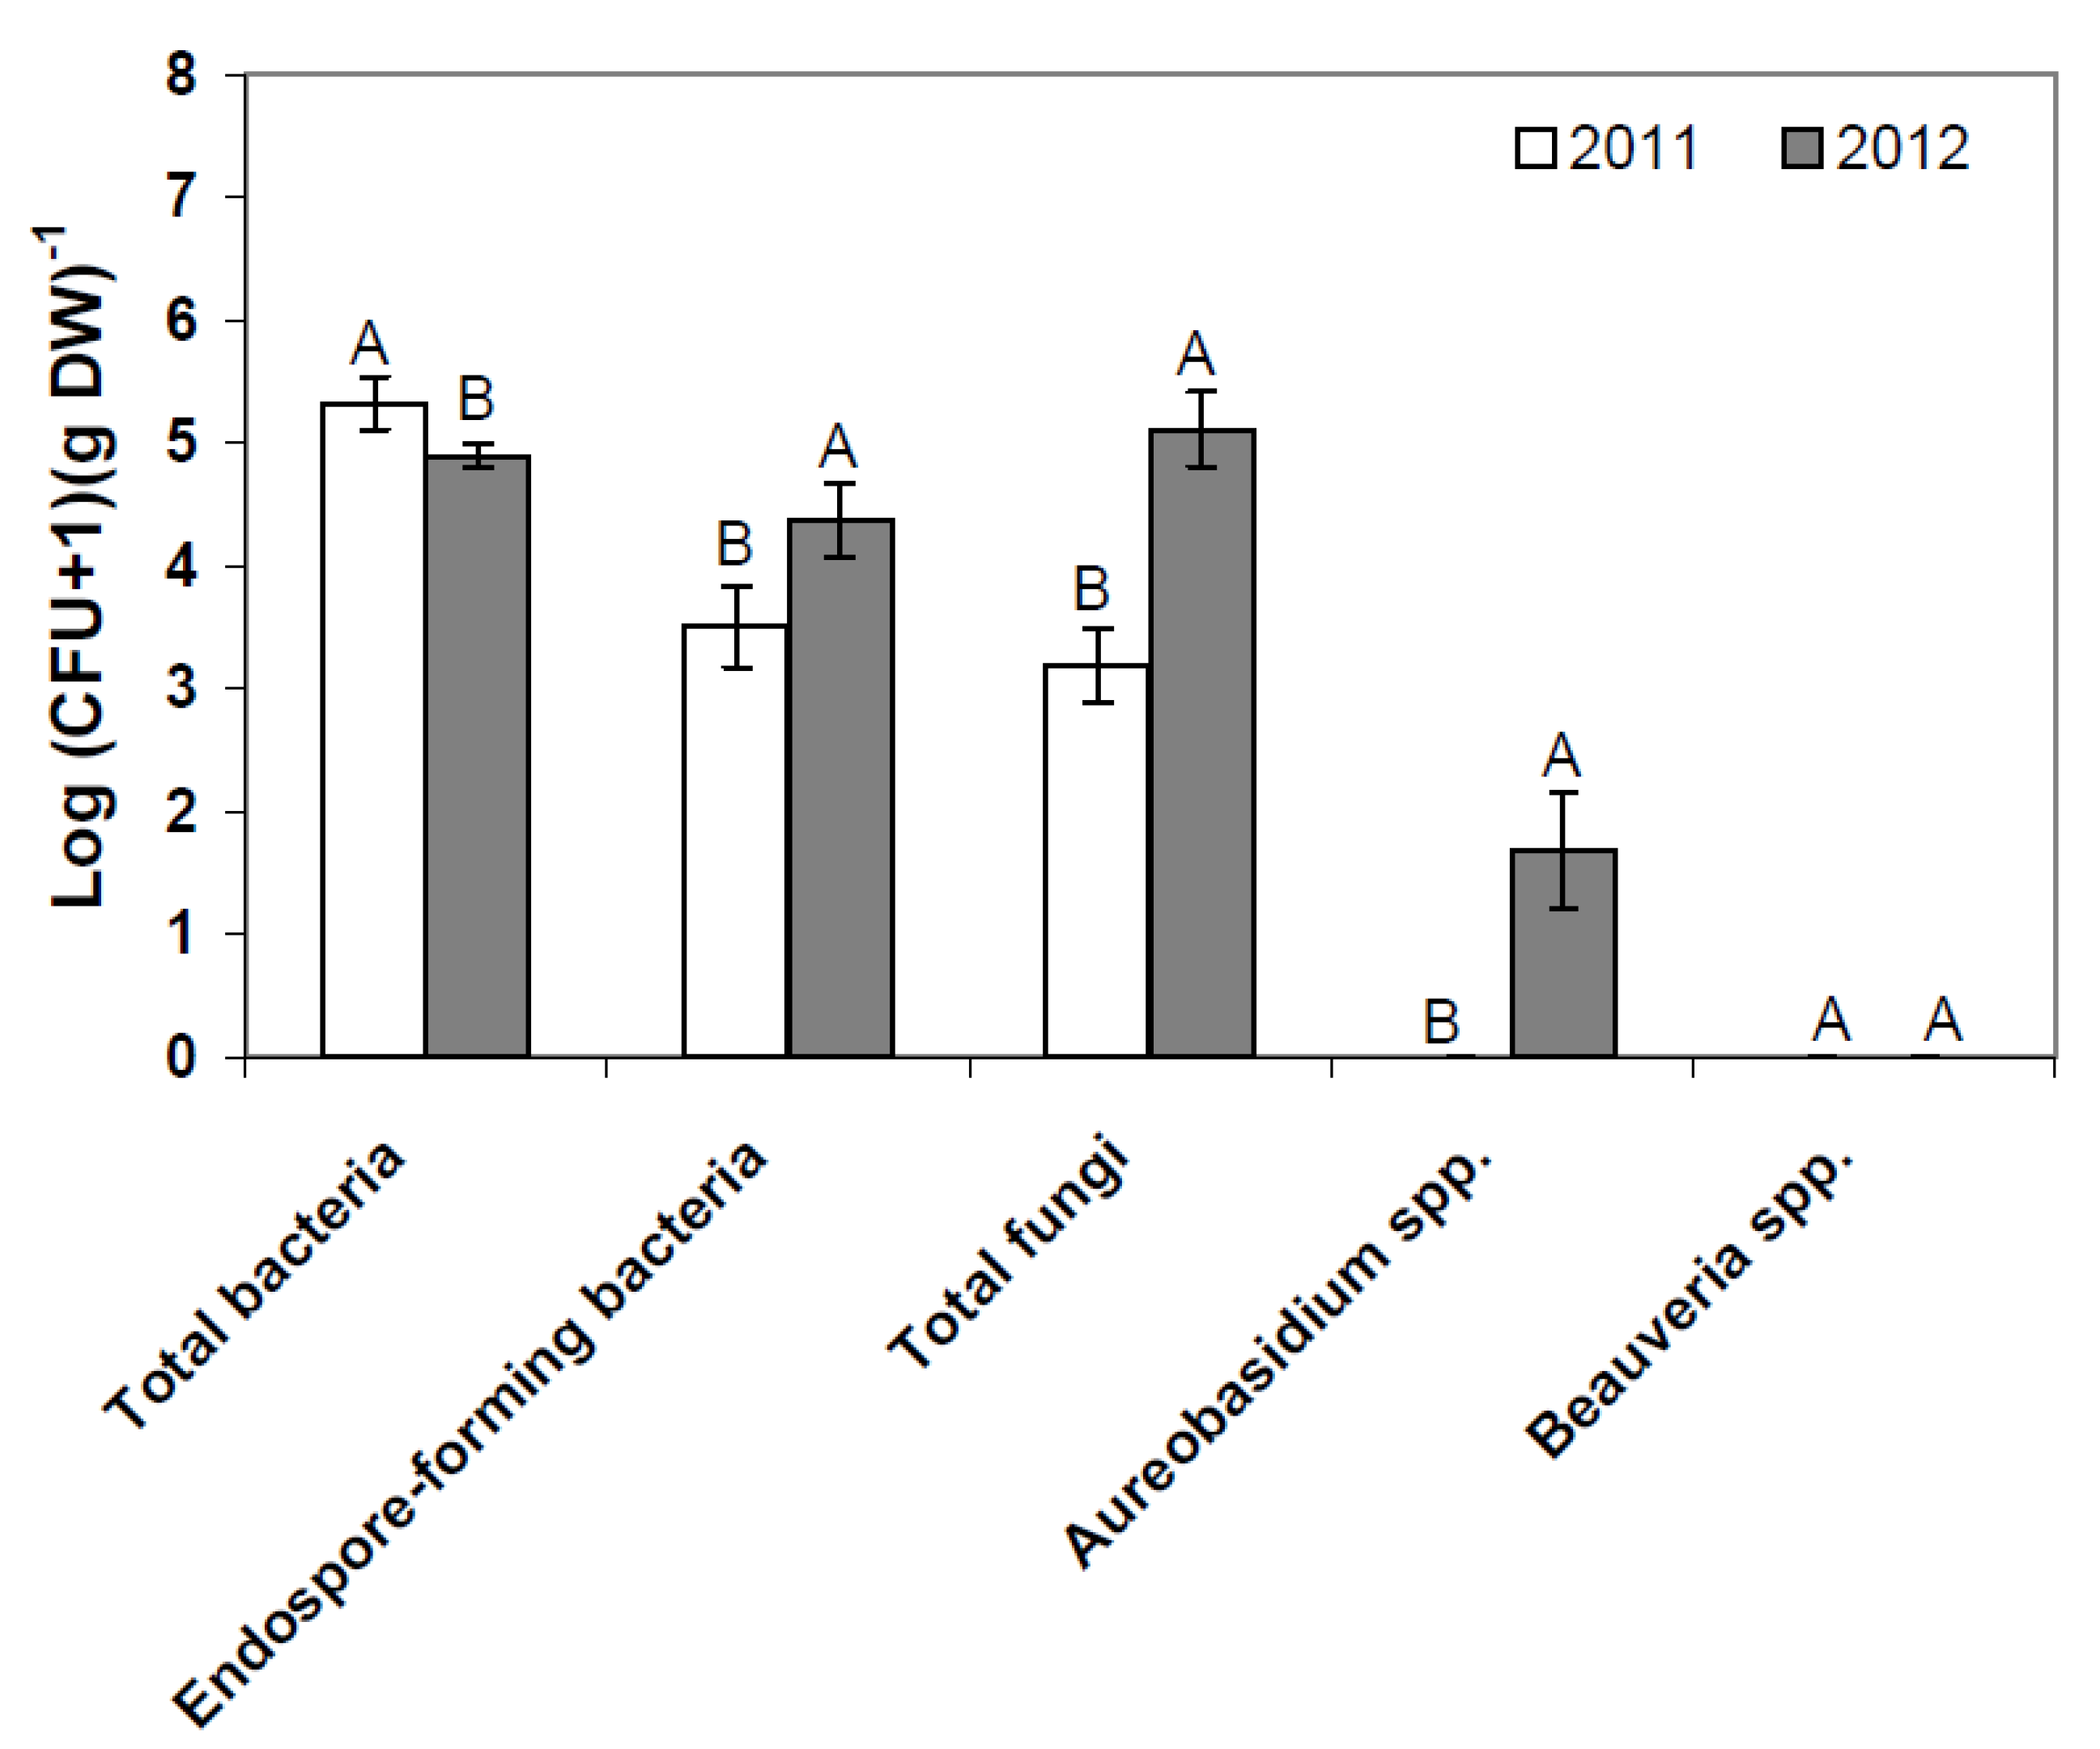
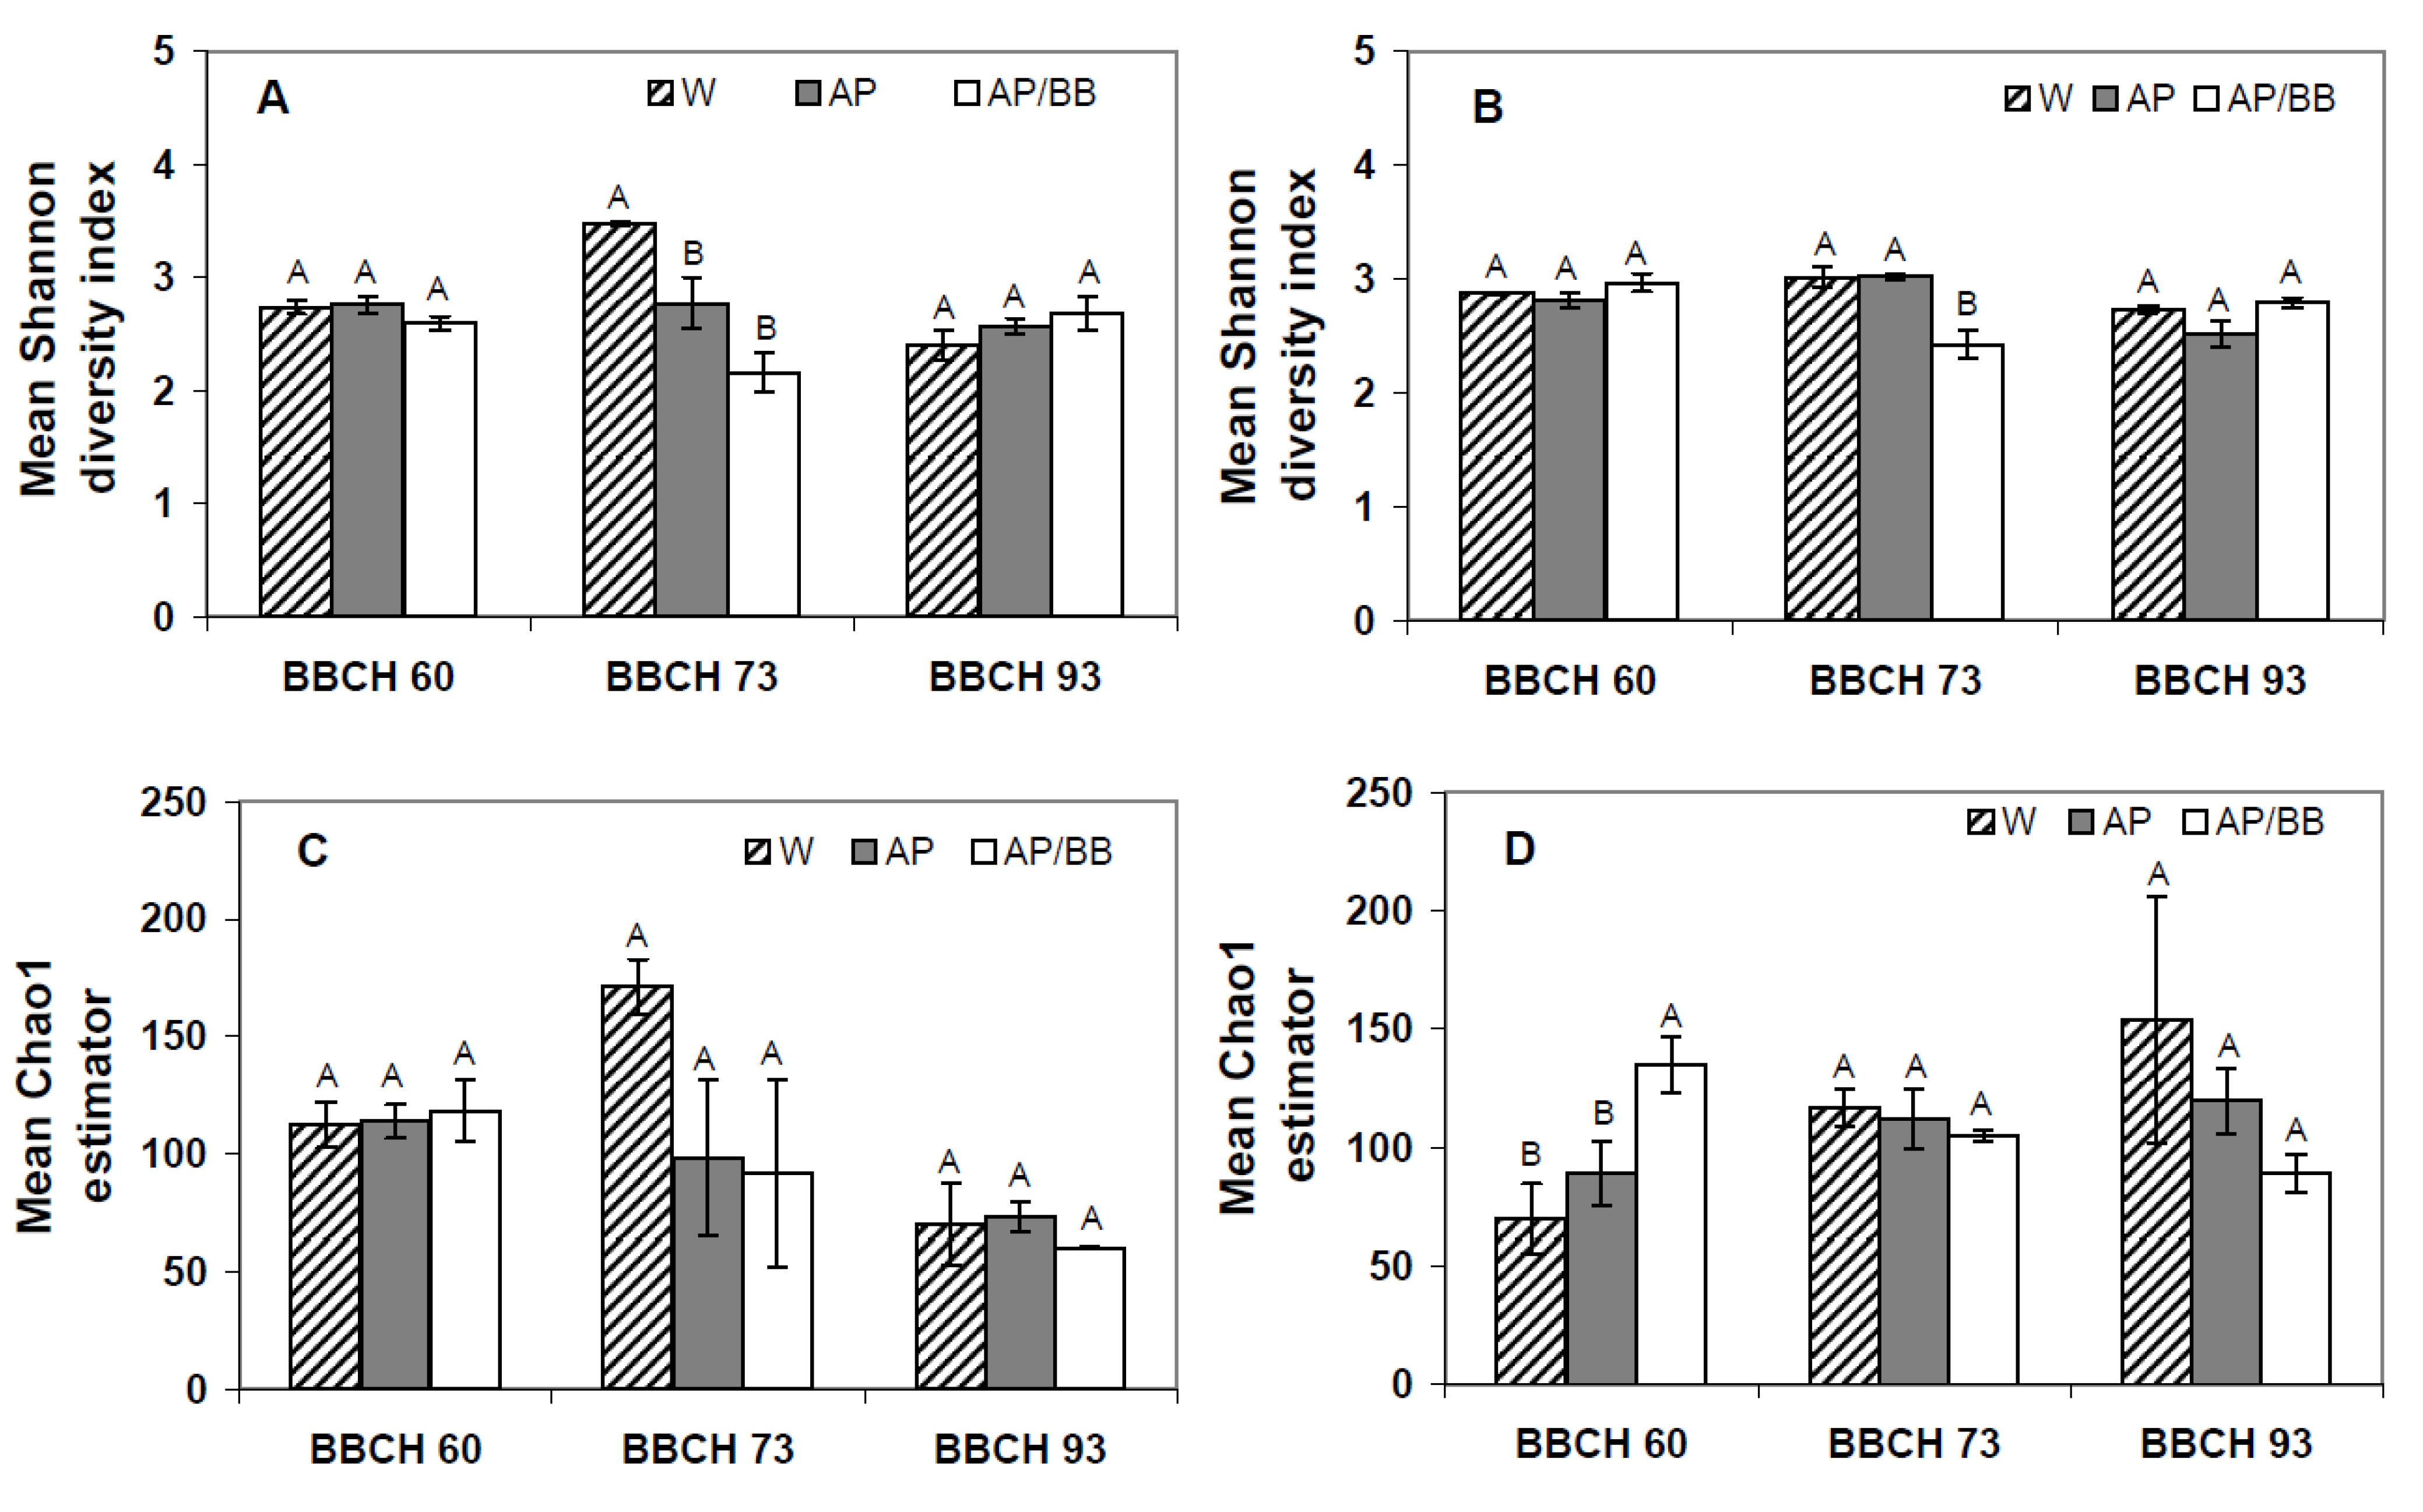
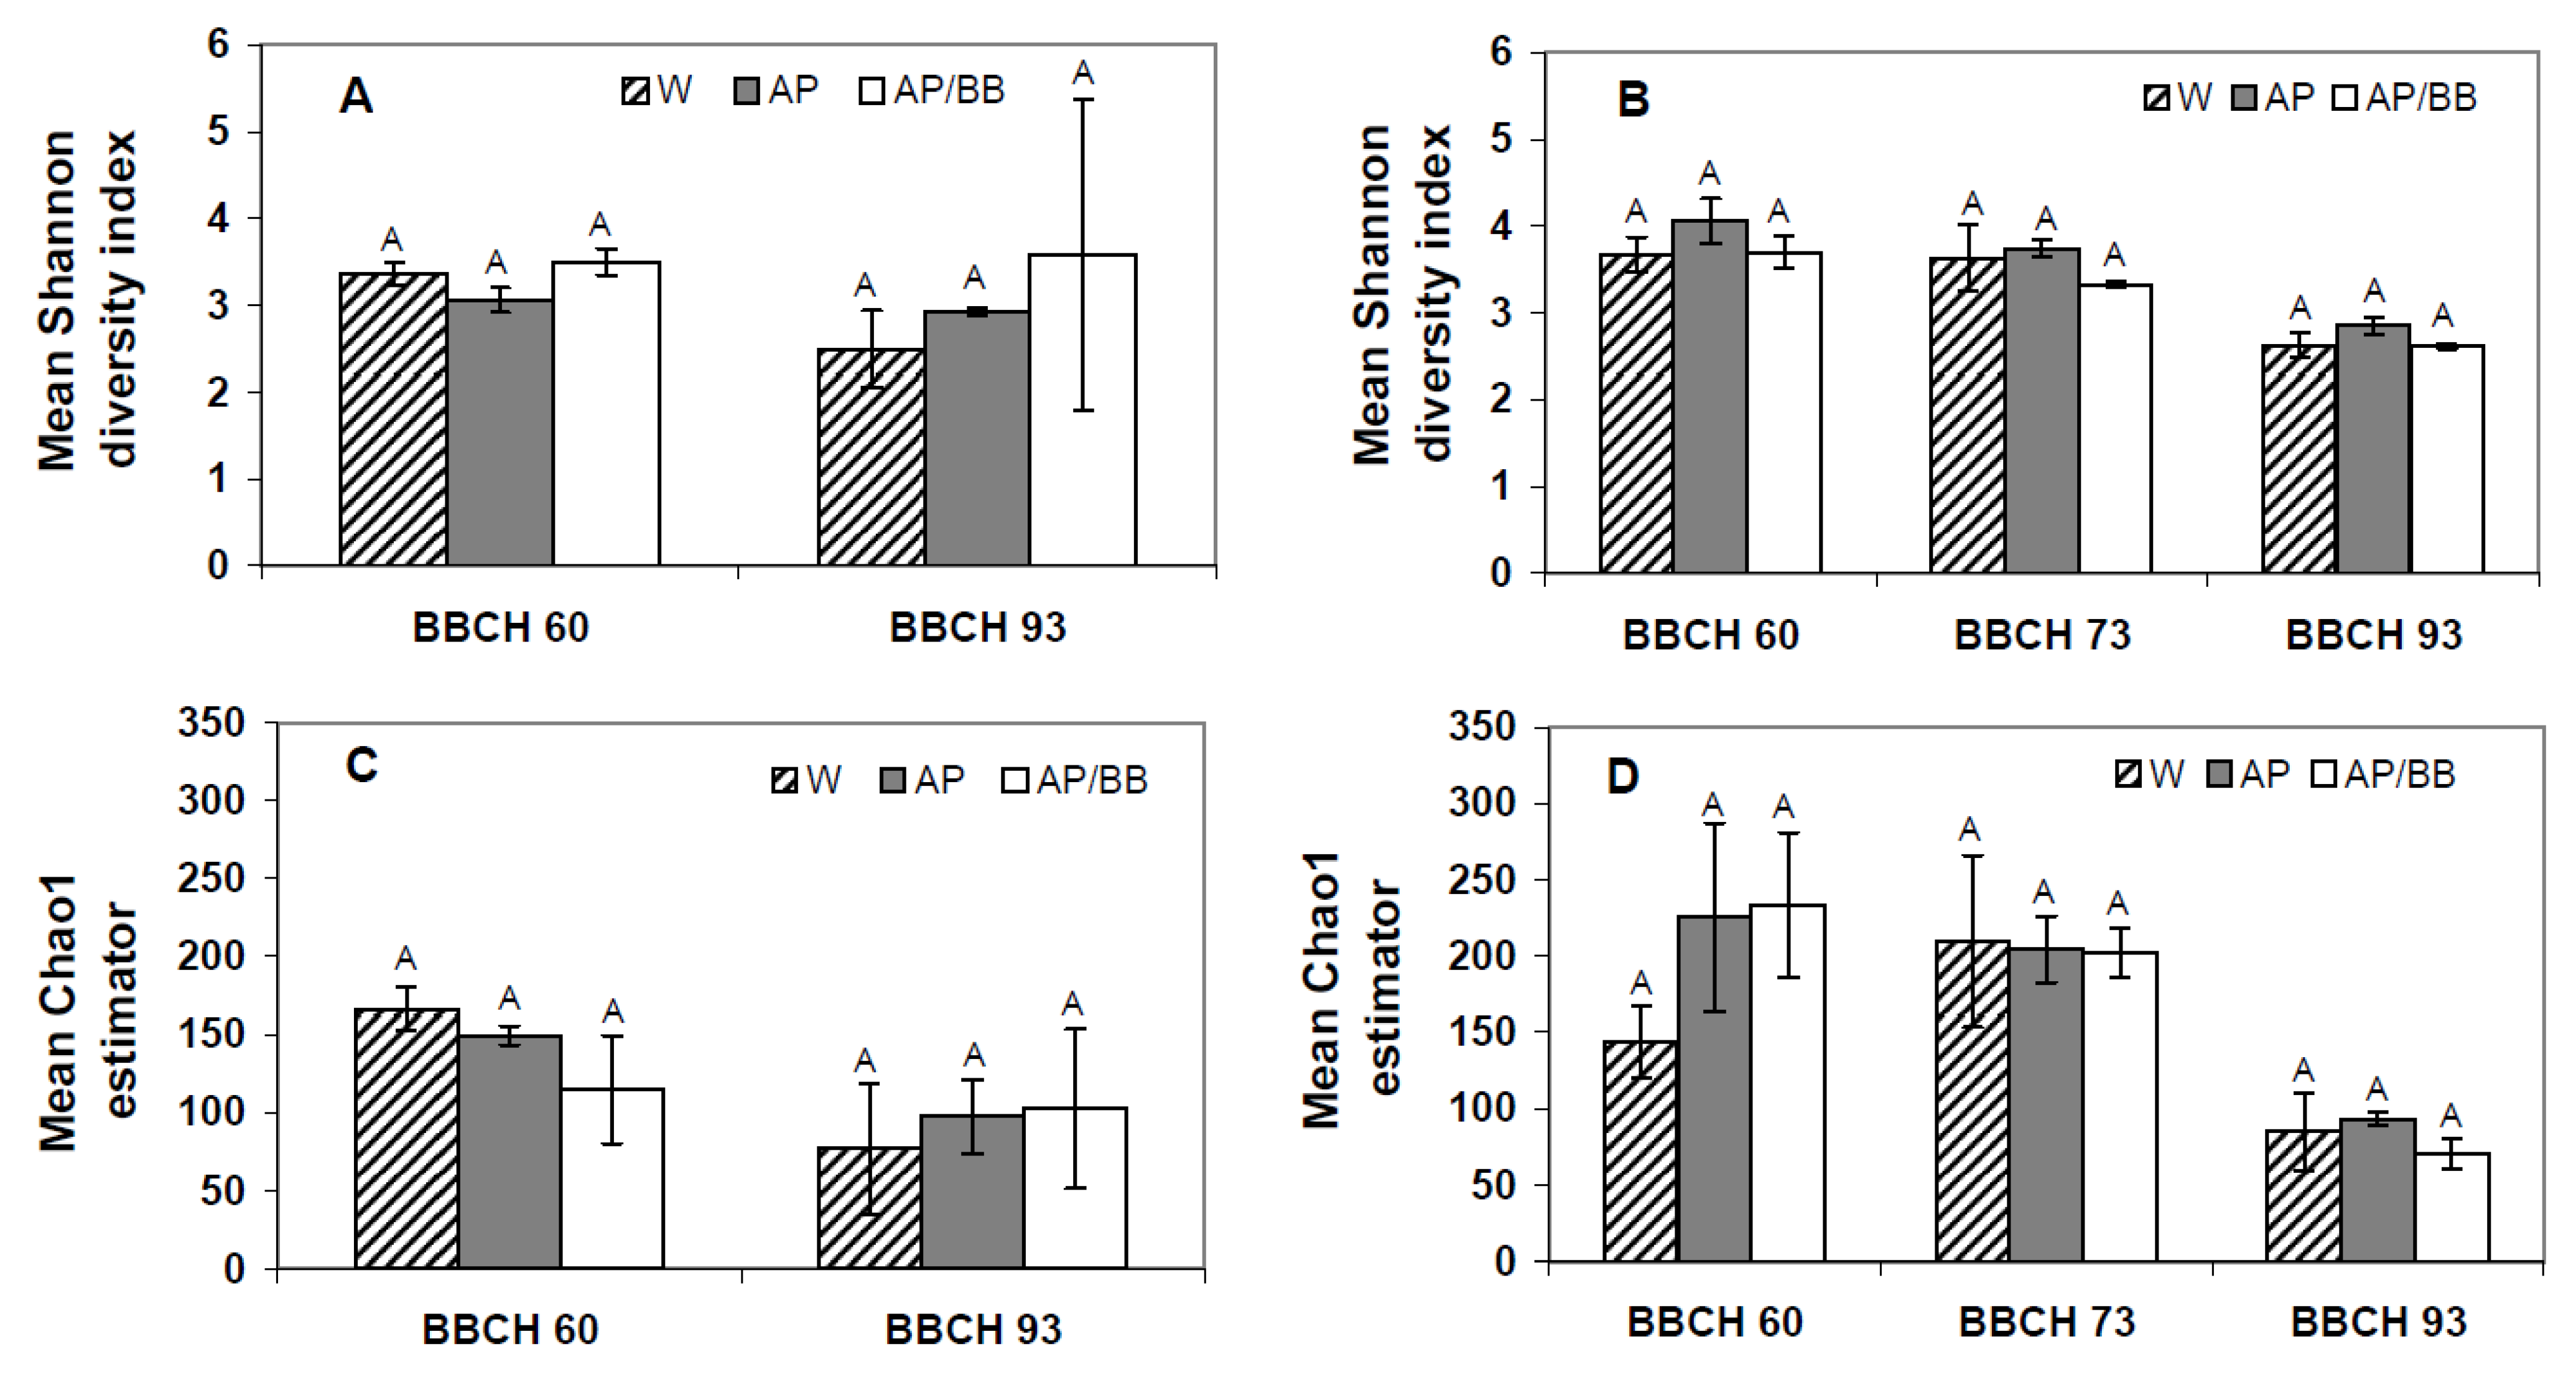
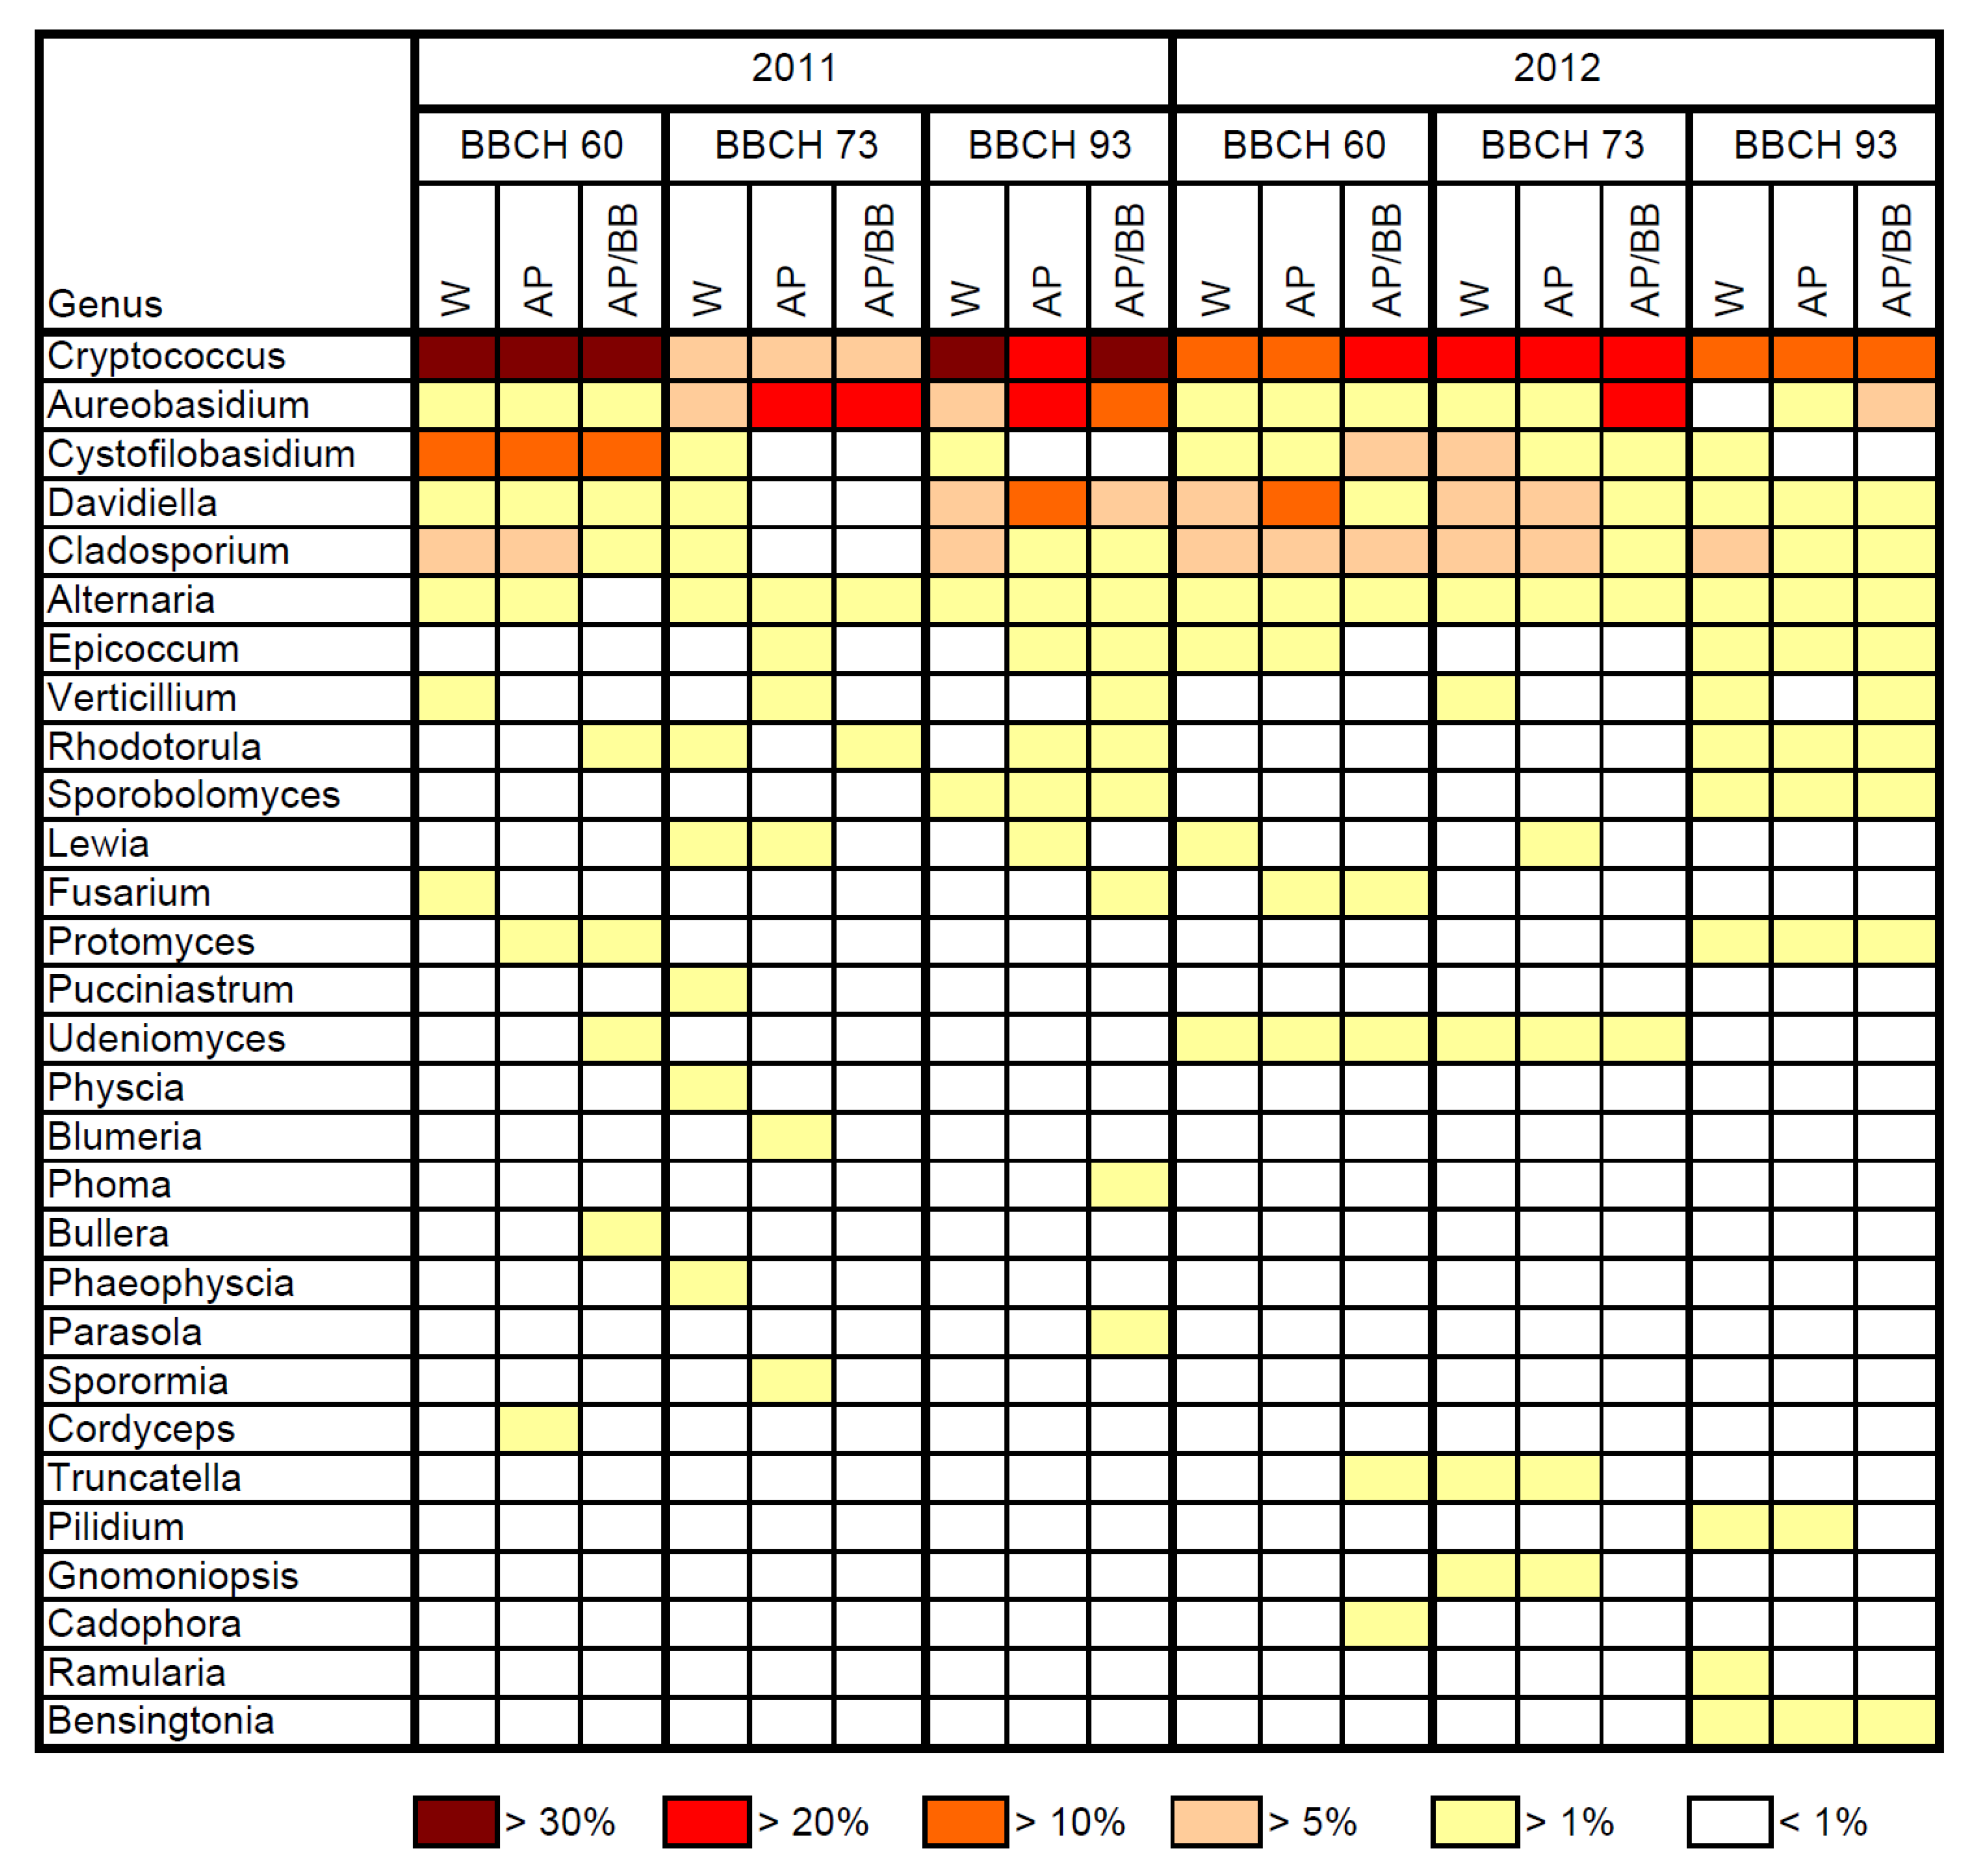
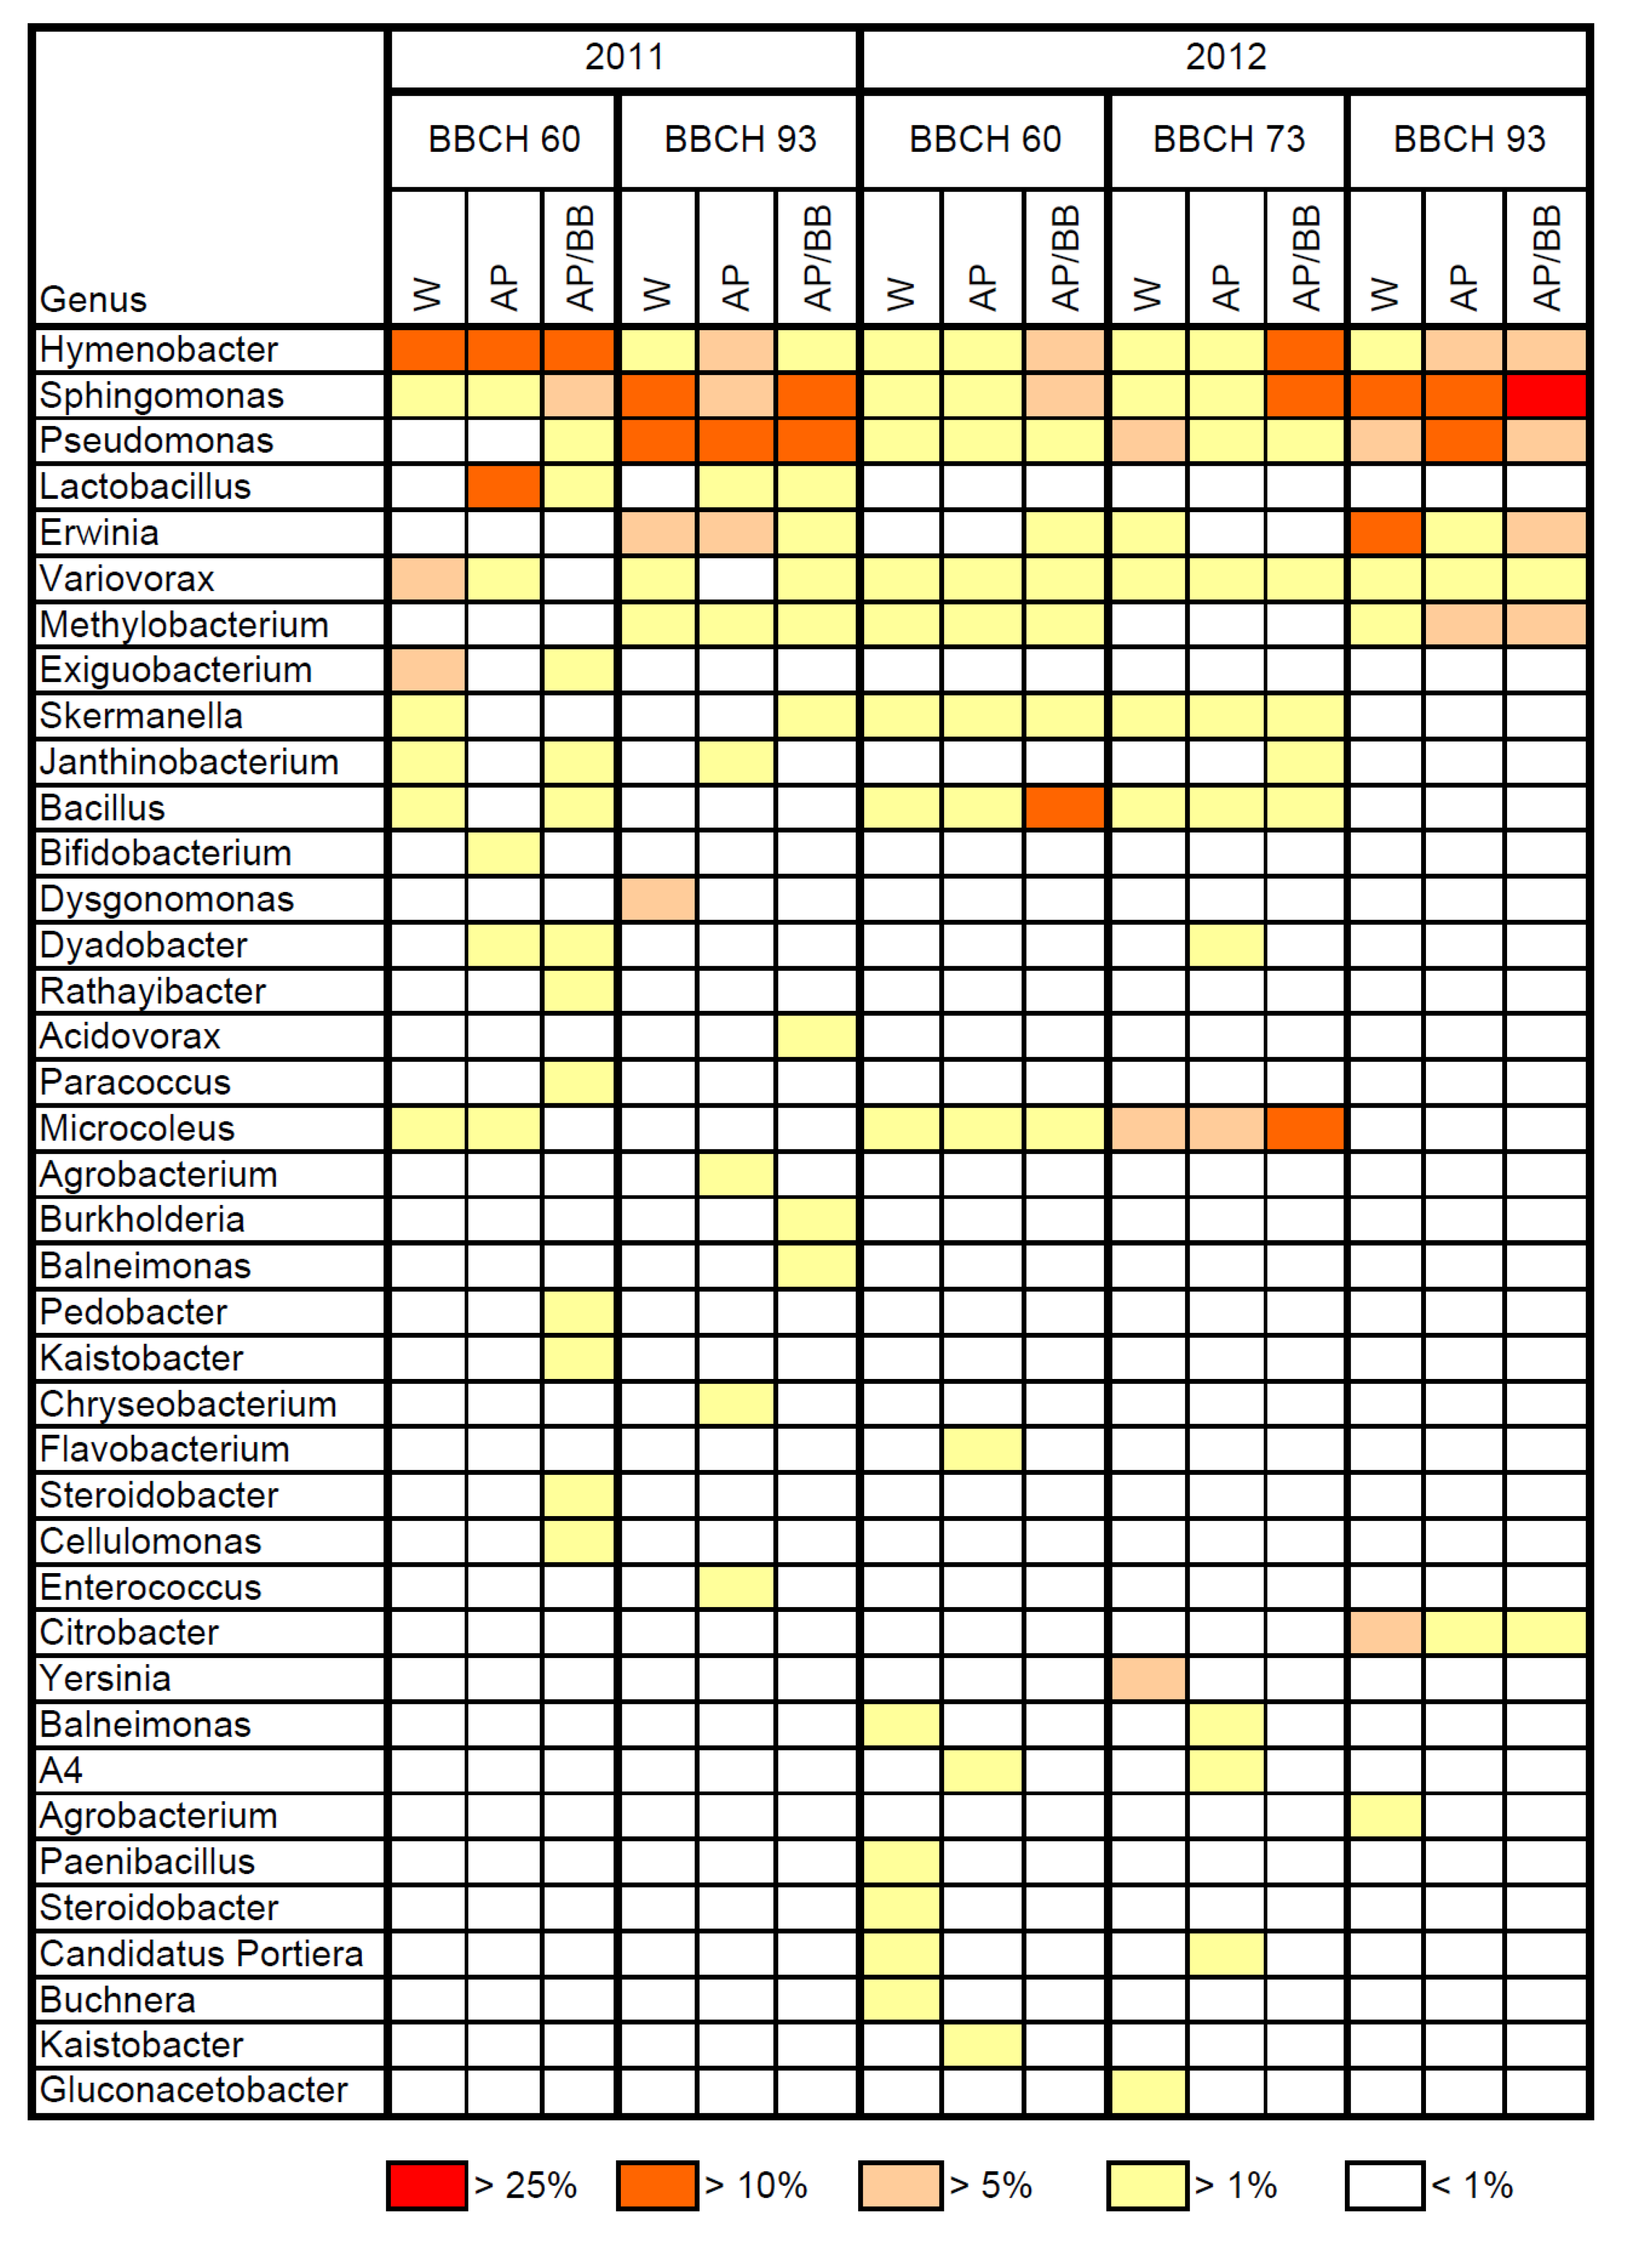
2.1. Composition of Resident Microbial Communities in the Strawberry Phyllosphere

| Fungal ITS rRNA sequences | Bacterial 16S rRNA sequences | |||||||||||
|---|---|---|---|---|---|---|---|---|---|---|---|---|
| 2011 | 2012 | 2011 | 2012 | |||||||||
| Phenological stage a | Mean b | SEM c | Mean | SEM | Mean | SEM | Mean | SEM | ||||
| Untreated control (water) | ||||||||||||
| BBCH 60 | 1217 | 443 | 936 | 411 | 357 d | 31 | 276 | 80 | ||||
| BBCH 73 | 1201 | 234 | 996 | 98 | 234 e | 66 | 761 | 229 | ||||
| BBCH 93 | 324 d | 165 | 1609 | 397 | 357 d | 113 | 1703 | 1193 | ||||
| Single strain treatment ( A. pullulans) | ||||||||||||
| BBCH 60 | 1272 | 255 | 1412 | 301 | 636 e | 215 | 501 d | 339 | ||||
| BBCH 73 | 816 d | 512 | 1275 | 52 | 316 f | NA | 464 | 108 | ||||
| BBCH 93 | 380 | 97 | 1496 | 247 | 229 d | 9 | 1496 | 235 | ||||
| Multiple strain treatment ( A. pullulans/B. bassiana) | ||||||||||||
| BBCH 60 | 1631 | 407 | 1344 | 277 | 103 d | 38 | 952 | 306 | ||||
| BBCH 73 | 482 d | 308 | 1763 d | 150 | NA g | NA | 403 e | 155 | ||||
| BBCH 93 | 340 | 172 | 1059 | 90 | 188 | 85 | 1059 | 365 | ||||

| BBCH 60 (prior to BCA applications) | BBCH 73 (after four BCA applications) | BBCH 93 (four weeks after last BCA application) | ||||||||||||||||||||||||
|---|---|---|---|---|---|---|---|---|---|---|---|---|---|---|---|---|---|---|---|---|---|---|---|---|---|---|
| W a | AP a | AP/BB a | W | AP | AP/BB | W | AP | AP/BB | ||||||||||||||||||
| Fungal order | Mean | SEM | Mean | SEM | Mean | SEM | Mean | SEM | Mean | SEM | Mean | SEM | Mean | SEM | Mean | SEM | Mean | SEM | ||||||||
| Filobasidiales | 0.336 | 0.021 | 0.329 | 0.025 | 0.400 | 0.026 | 0.088 | 0.013 | 0.088 | 0.023 | 0.050 | 0.009 | 0.389 | 0.026 | 0.270 | 0.036 | 0.311 | 0.021 | ||||||||
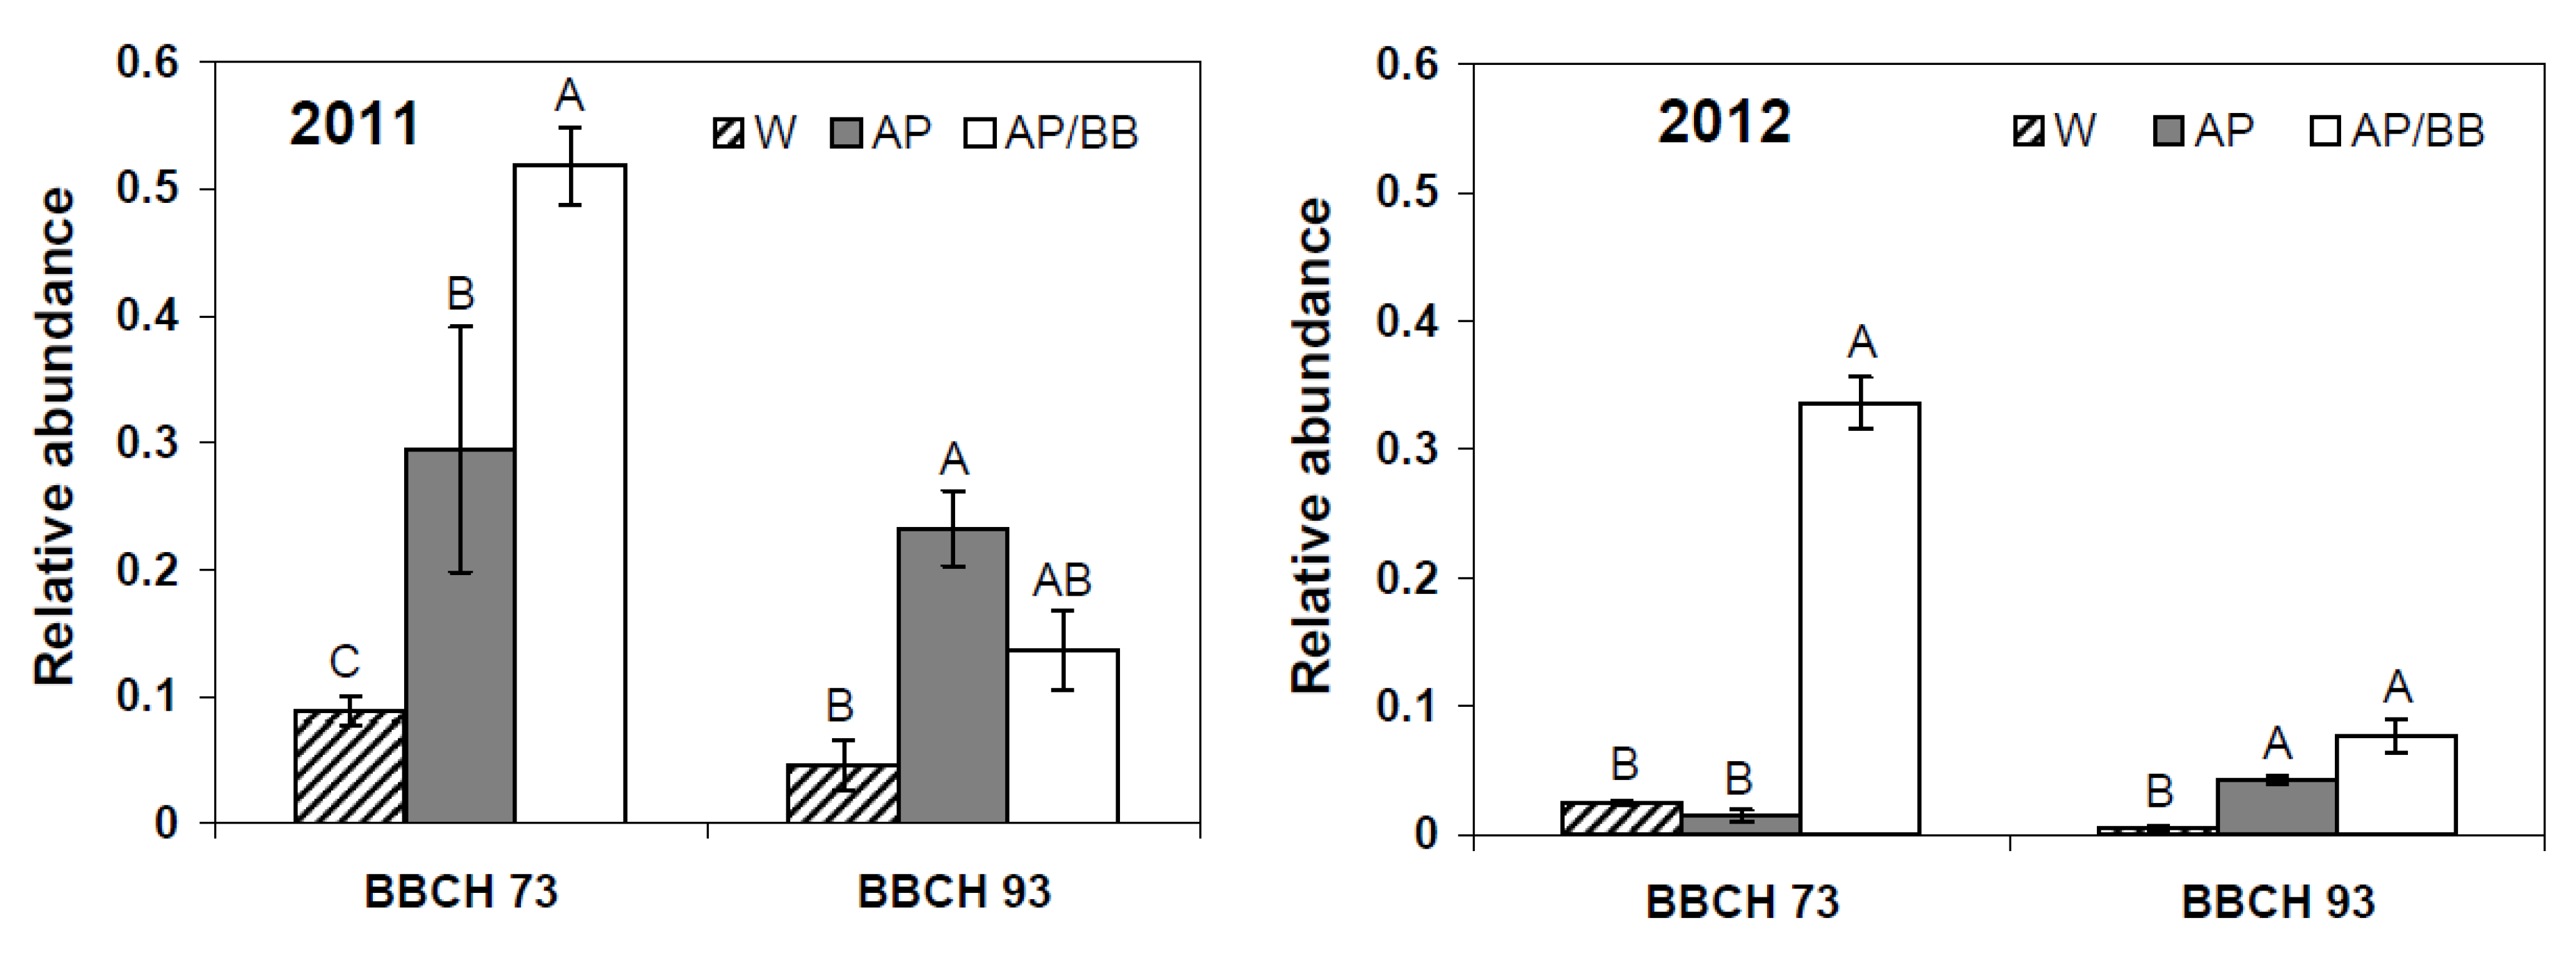
| Dothideales | 0.026 | 0.007 | 0.020 | 0.003 | 0.018 | 0.004 | 0.093 | 0.008 | 0.297 | 0.080 | 0.519 | 0.024 | 0.049 | 0.021 | 0.234 | 0.029 | 0.139 | 0.028 | ||||||||
| Capnodiales | 0.106 | 0.011 | 0.092 | 0.012 | 0.069 | 0.008 | 0.080 | 0.012 | 0.035 | 0.007 | 0.024 | 0.005 | 0.224 | 0.026 | 0.198 | 0.028 | 0.138 | 0.044 | ||||||||
| Cystofilobasidiales | 0.162 | 0.020 | 0.176 | 0.027 | 0.166 | 0.032 | 0.016 | 0.002 | 0.009 | 0.003 | 0.007 | 0.004 | 0.044 | 0.046 | 0.011 | 0.003 | 0.006 | 0.002 | ||||||||
| Pleosporales | 0.033 | 0.006 | 0.035 | 0.008 | 0.027 | 0.001 | 0.096 | 0.010 | 0.103 | 0.035 | 0.040 | 0.004 | 0.047 | 0.020 | 0.076 | 0.022 | 0.114 | 0.034 | ||||||||
| Sporidiobolales | 0.015 | 0.002 | 0.011 | 0.001 | 0.021 | 0.004 | 0.017 | 0.003 | 0.005 | 0.003 | 0.011 | 0.000 | 0.031 | 0.008 | 0.033 | 0.013 | 0.032 | 0.005 | ||||||||
| Chaetothyriales | 0.003 | 0.001 | 0.003 | 0.001 | 0.003 | 0.001 | 0.068 | 0.012 | 0.036 | 0.003 | 0.037 | 0.010 | 0.003 | 0.003 | 0.004 | 0.001 | 0.006 | 0.002 | ||||||||
| Helotiales | 0.011 | 0.004 | 0.008 | 0.002 | 0.006 | 0.001 | 0.010 | 0.001 | 0.004 | 0.002 | 0.020 | 0.006 | 0.053 | 0.021 | 0.017 | 0.008 | 0.041 | 0.007 | ||||||||
| Hypocreales | 0.014 | 0.001 | 0.032 | 0.013 | 0.007 | 0.001 | 0.011 | 0.004 | 0.010 | 0.002 | 0.008 | 0.003 | 0.020 | 0.012 | 0.013 | 0.006 | 0.016 | 0.008 | ||||||||
| Tremellales | 0.027 | 0.005 | 0.019 | 0.002 | 0.035 | 0.006 | 0.003 | 0.001 | 0.008 | 0.003 | 0.001 | 0.001 | 0.001 | 0.002 | 0.001 | 0.001 | 0.002 | 0.001 | ||||||||
| Lecanorales | 0.002 | 0.001 | 0.004 | 0.001 | 0.003 | 0.001 | 0.034 | 0.004 | 0.013 | 0.005 | 0.023 | 0.006 | 0.000 | 0.000 | 0.003 | 0.002 | 0.002 | 0.002 | ||||||||
| Agaricales | 0.003 | 0.001 | 0.002 | 0.000 | 0.002 | 0.000 | 0.001 | 0.000 | 0.001 | 0.001 | 0.002 | 0.001 | 0.043 | 0.047 | 0.016 | 0.002 | 0.041 | 0.009 | ||||||||
| Taphrinales | 0.009 | 0.003 | 0.013 | 0.004 | 0.013 | 0.005 | 0.007 | 0.002 | 0.002 | 0.001 | 0.002 | 0.001 | 0.001 | 0.001 | 0.012 | 0.003 | 0.013 | 0.004 | ||||||||
| Teloschistales | 0.004 | 0.001 | 0.002 | 0.001 | 0.001 | 0.000 | 0.027 | 0.004 | 0.016 | 0.001 | 0.006 | 0.002 | 0.000 | 0.001 | 0.000 | 0.000 | 0.003 | 0.001 | ||||||||
| Erysiphales | 0.002 | 0.001 | 0.003 | 0.001 | 0.004 | 0.001 | 0.017 | 0.001 | 0.016 | 0.005 | 0.002 | 0.001 | 0.000 | 0.001 | 0.001 | 0.001 | 0.004 | 0.002 | ||||||||
| Xylariales | 0.007 | 0.002 | 0.002 | 0.000 | 0.003 | 0.001 | 0.008 | 0.002 | 0.011 | 0.007 | 0.009 | 0.002 | 0.000 | 0.000 | 0.002 | 0.001 | 0.000 | 0.000 | ||||||||
| Pucciniales | 0.000 | 0.000 | 0.001 | 0.000 | 0.000 | 0.000 | 0.017 | 0.003 | 0.010 | 0.005 | 0.009 | 0.004 | 0.000 | 0.000 | 0.000 | 0.000 | 0.000 | 0.000 | ||||||||
| Others b | 0.242 | 0.020 | 0.247 | 0.028 | 0.222 | 0.016 | 0.408 | 0.023 | 0.335 | 0.055 | 0.228 | 0.031 | 0.094 | 0.047 | 0.108 | 0.020 | 0.131 | 0.040 | ||||||||
| BBCH 60 (prior to BCA applications) | BBCH 73 (after four BCA applications) | BBCH 93 (four weeks after last BCA application) | ||||||||||||||||||||||||
|---|---|---|---|---|---|---|---|---|---|---|---|---|---|---|---|---|---|---|---|---|---|---|---|---|---|---|
| W a | AP a | AP/BB a | W | AP | AP/BB | W | AP | AP/BB | ||||||||||||||||||
| Order | Mean | SEM | Mean | SEM | Mean | SEM | Mean | SEM | Mean | SEM | Mean | SEM | Mean | SEM | Mean | SEM | Mean | SEM | ||||||||
| Filobasidiales | 0.214 | 0.009 | 0.190 | 0.021 | 0.348 | 0.018 | 0.308 | 0.029 | 0.258 | 0.021 | 0.257 | 0.028 | 0.234 | 0.010 | 0.204 | 0.022 | 0.209 | 0.018 | ||||||||
| Capnodiales | 0.271 | 0.024 | 0.333 | 0.029 | 0.141 | 0.008 | 0.178 | 0.036 | 0.179 | 0.014 | 0.112 | 0.010 | 0.134 | 0.021 | 0.107 | 0.015 | 0.111 | 0.005 | ||||||||
| Helotiales | 0.100 | 0.009 | 0.119 | 0.022 | 0.063 | 0.012 | 0.059 | 0.008 | 0.102 | 0.027 | 0.047 | 0.014 | 0.267 | 0.008 | 0.360 | 0.052 | 0.234 | 0.035 | ||||||||
| Pleosporales | 0.087 | 0.013 | 0.066 | 0.010 | 0.066 | 0.010 | 0.063 | 0.004 | 0.083 | 0.006 | 0.042 | 0.010 | 0.066 | 0.014 | 0.053 | 0.006 | 0.064 | 0.007 | ||||||||
| Cystofilobasidiales | 0.106 | 0.012 | 0.107 | 0.017 | 0.083 | 0.006 | 0.074 | 0.018 | 0.103 | 0.023 | 0.056 | 0.016 | 0.020 | 0.005 | 0.011 | 0.003 | 0.012 | 0.002 | ||||||||
| Dothideales | 0.016 | 0.005 | 0.017 | 0.003 | 0.023 | 0.005 | 0.025 | 0.001 | 0.015 | 0.005 | 0.338 | 0.020 | 0.005 | 0.002 | 0.043 | 0.003 | 0.077 | 0.013 | ||||||||
| Sporidiobolales | 0.038 | 0.005 | 0.027 | 0.001 | 0.016 | 0.003 | 0.018 | 0.003 | 0.034 | 0.008 | 0.012 | 0.001 | 0.035 | 0.005 | 0.024 | 0.004 | 0.029 | 0.001 | ||||||||
| Agaricostilbales | 0.001 | 0.001 | 0.003 | 0.002 | 0.003 | 0.001 | 0.003 | 0.000 | 0.004 | 0.001 | 0.001 | 0.000 | 0.031 | 0.006 | 0.032 | 0.005 | 0.039 | 0.003 | ||||||||
| Diaporthales | 0.014 | 0.007 | 0.007 | 0.003 | 0.021 | 0.007 | 0.025 | 0.006 | 0.023 | 0.009 | 0.010 | 0.005 | 0.006 | 0.003 | 0.003 | 0.001 | 0.003 | 0.000 | ||||||||
| Xylariales | 0.006 | 0.003 | 0.011 | 0.004 | 0.014 | 0.003 | 0.026 | 0.009 | 0.015 | 0.004 | 0.011 | 0.006 | 0.002 | 0.001 | 0.001 | 0.001 | 0.001 | 0.000 | ||||||||
| Hypocreales | 0.009 | 0.004 | 0.013 | 0.003 | 0.018 | 0.006 | 0.013 | 0.005 | 0.012 | 0.005 | 0.006 | 0.002 | 0.002 | 0.000 | 0.002 | 0.000 | 0.002 | 0.001 | ||||||||
| Taphrinales | 0.004 | 0.003 | 0.003 | 0.001 | 0.009 | 0.001 | 0.005 | 0.001 | 0.004 | 0.001 | 0.003 | 0.000 | 0.014 | 0.002 | 0.012 | 0.002 | 0.018 | 0.003 | ||||||||
| Agaricales | 0.000 | 0.000 | 0.001 | 0.000 | 0.013 | 0.003 | 0.011 | 0.002 | 0.004 | 0.003 | 0.004 | 0.001 | 0.006 | 0.001 | 0.009 | 0.006 | 0.008 | 0.002 | ||||||||
| Others b | 0.133 | 0.002 | 0.103 | 0.001 | 0.184 | 0.001 | 0.193 | 0.002 | 0.164 | 0.001 | 0.101 | 0.000 | 0.178 | 0.001 | 0.139 | 0.000 | 0.193 | 0.001 | ||||||||

| BBCH 60 (prior to BCA applications) | BBCH 93 (four weeks after last BCA application) | ||||||||||||||||
|---|---|---|---|---|---|---|---|---|---|---|---|---|---|---|---|---|---|
| W a | AP a | AP/BB a | W | AP | AP/BB | ||||||||||||
| Bacterial order | Mean | SEM | Mean | SEM | Mean | SEM | Mean | SEM | Mean | SEM | Mean | SEM | |||||
| Burkholderiales | 0.183 | 0.052 | 0.153 | 0.072 | 0.092 | 0.015 | 0.074 | 0.037 | 0.144 | 0.040 | 0.130 | 0.031 | |||||
| Sphingobacteriales | 0.213 | 0.050 | 0.200 | 0.046 | 0.167 | 0.002 | 0.017 | 0.017 | 0.112 | 0.056 | 0.053 | 0.017 | |||||
| Actinomycetales | 0.130 | 0.010 | 0.071 | 0.014 | 0.160 | 0.010 | 0.057 | 0.033 | 0.044 | 0.018 | 0.102 | 0.023 | |||||
| Sphingomonadales | 0.058 | 0.029 | 0.041 | 0.016 | 0.097 | 0.026 | 0.220 | 0.022 | 0.106 | 0.028 | 0.162 | 0.037 | |||||
| Rickettsiales | 0.049 | 0.005 | 0.089 | 0.046 | 0.084 | 0.038 | 0.007 | 0.007 | 0.043 | 0.034 | 0.028 | 0.012 | |||||
| Pseudomonadales | 0.006 | 0.002 | 0.000 | 0.000 | 0.050 | 0.043 | 0.189 | 0.129 | 0.169 | 0.029 | 0.156 | 0.044 | |||||
| Enterobacteriales | 0.010 | 0.008 | 0.002 | 0.002 | 0.000 | 0.000 | 0.229 | 0.092 | 0.158 | 0.069 | 0.089 | 0.019 | |||||
| Rhizobiales | 0.033 | 0.008 | 0.015 | 0.001 | 0.029 | 0.014 | 0.056 | 0.021 | 0.090 | 0.008 | 0.107 | 0.024 | |||||
| Lactobacillales | 0.002 | 0.002 | 0.114 | 0.114 | 0.026 | 0.010 | 0.015 | 0.008 | 0.023 | 0.011 | 0.033 | 0.014 | |||||
| Rhodospirillales | 0.021 | 0.008 | 0.024 | 0.005 | 0.026 | 0.010 | 0.020 | 0.018 | 0.004 | 0.004 | 0.027 | 0.008 | |||||
| Bacillales | 0.033 | 0.011 | 0.012 | 0.001 | 0.033 | 0.017 | 0.007 | 0.006 | 0.019 | 0.019 | 0.011 | 0.004 | |||||
| Pasteurellales | 0.002 | 0.002 | 0.071 | 0.056 | 0.000 | 0.000 | 0.000 | 0.000 | 0.002 | 0.002 | 0.009 | 0.007 | |||||
| Exiguobacterales | 0.090 | 0.090 | 0.009 | 0.002 | 0.011 | 0.004 | 0.000 | 0.000 | 0.000 | 0.000 | 0.000 | 0.000 | |||||
| Rhodobacterales | 0.004 | 0.002 | 0.005 | 0.005 | 0.026 | 0.005 | 0.008 | 0.006 | 0.012 | 0.012 | 0.003 | 0.003 | |||||
| Myxococcales | 0.005 | 0.003 | 0.002 | 0.001 | 0.015 | 0.001 | 0.001 | 0.001 | 0.008 | 0.006 | 0.005 | 0.003 | |||||
| Chroococcales | 0.014 | 0.008 | 0.024 | 0.021 | 0.011 | 0.011 | 0.001 | 0.001 | 0.000 | 0.000 | 0.000 | 0.000 | |||||
| Bifidobacteriales | 0.001 | 0.001 | 0.034 | 0.032 | 0.004 | 0.004 | 0.000 | 0.000 | 0.002 | 0.002 | 0.007 | 0.007 | |||||
| Neisseriales | 0.003 | 0.002 | 0.039 | 0.036 | 0.004 | 0.004 | 0.000 | 0.000 | 0.002 | 0.002 | 0.002 | 0.002 | |||||
| Bacteroidales | 0.000 | 0.000 | 0.000 | 0.000 | 0.000 | 0.000 | 0.059 | 0.059 | 0.000 | 0.000 | 0.000 | 0.000 | |||||
| Flavobacteriales | 0.000 | 0.000 | 0.001 | 0.001 | 0.004 | 0.004 | 0.007 | 0.006 | 0.017 | 0.017 | 0.002 | 0.002 | |||||
| Xanthomonadales | 0.006 | 0.003 | 0.002 | 0.002 | 0.011 | 0.004 | 0.001 | 0.001 | 0.007 | 0.006 | 0.001 | 0.001 | |||||
| Solirubrobacterales | 0.006 | 0.004 | 0.007 | 0.003 | 0.008 | 0.008 | 0.001 | 0.001 | 0.000 | 0.000 | 0.000 | 0.000 | |||||
| iii1-15 | 0.003 | 0.002 | 0.002 | 0.001 | 0.019 | 0.012 | 0.001 | 0.001 | 0.000 | 0.000 | 0.003 | 0.003 | |||||
| Acidimicrobiales | 0.003 | 0.002 | 0.001 | 0.001 | 0.008 | 0.008 | 0.001 | 0.001 | 0.002 | 0.002 | 0.005 | 0.003 | |||||
| 0319-7L14 | 0.003 | 0.002 | 0.000 | 0.000 | 0.011 | 0.004 | 0.000 | 0.000 | 0.000 | 0.000 | 0.001 | 0.001 | |||||
| Others b | 0.123 | 0.040 | 0.080 | 0.016 | 0.107 | 0.061 | 0.030 | 0.020 | 0.037 | 0.030 | 0.062 | 0.037 | |||||
| BBCH 60 (prior to BCA applications) | BBCH 73 (after four BCA applications) | BBCH 93 (four weeks after last BCA application) | ||||||||||||||||||||||||
|---|---|---|---|---|---|---|---|---|---|---|---|---|---|---|---|---|---|---|---|---|---|---|---|---|---|---|
| W a | AP a | AP/BB a | W | AP | AP/BB | W | AP | AP/BB | ||||||||||||||||||
| Bacterial order | Mean | SEM | Mean | SEM | Mean | SEM | Mean | SEM | Mean | SEM | Mean | SEM | Mean | SEM | Mean | SEM | Mean | SEM | ||||||||
| Sphingomonadales | 0.039 | 0.004 | 0.034 | 0.010 | 0.087 | 0.029 | 0.070 | 0.016 | 0.037 | 0.009 | 0.122 | 0.082 | 0.182 | 0.028 | 0.223 | 0.017 | 0.314 | 0.052 | ||||||||
| Enterobacteriales | 0.034 | 0.021 | 0.005 | 0.001 | 0.091 | 0.043 | 0.151 | 0.099 | 0.009 | 0.004 | 0.012 | 0.008 | 0.385 | 0.082 | 0.169 | 0.034 | 0.164 | 0.059 | ||||||||
| Burkholderiales | 0.057 | 0.010 | 0.070 | 0.011 | 0.103 | 0.009 | 0.111 | 0.014 | 0.080 | 0.015 | 0.172 | 0.023 | 0.125 | 0.021 | 0.110 | 0.013 | 0.130 | 0.015 | ||||||||
| Rickettsiales | 0.194 | 0.037 | 0.173 | 0.017 | 0.053 | 0.023 | 0.084 | 0.041 | 0.186 | 0.050 | 0.106 | 0.019 | 0.012 | 0.005 | 0.012 | 0.006 | 0.026 | 0.013 | ||||||||
| Sphingobacteriales | 0.045 | 0.006 | 0.077 | 0.018 | 0.096 | 0.016 | 0.068 | 0.016 | 0.097 | 0.031 | 0.188 | 0.002 | 0.053 | 0.011 | 0.093 | 0.018 | 0.077 | 0.027 | ||||||||
| Rhizobiales | 0.069 | 0.012 | 0.067 | 0.007 | 0.083 | 0.023 | 0.045 | 0.009 | 0.050 | 0.006 | 0.031 | 0.001 | 0.090 | 0.017 | 0.132 | 0.008 | 0.120 | 0.012 | ||||||||
| Actinomycetales | 0.157 | 0.015 | 0.123 | 0.014 | 0.062 | 0.012 | 0.079 | 0.021 | 0.138 | 0.014 | 0.048 | 0.024 | 0.018 | 0.004 | 0.018 | 0.004 | 0.023 | 0.006 | ||||||||
| Pseudomonadales | 0.020 | 0.008 | 0.014 | 0.003 | 0.031 | 0.009 | 0.084 | 0.072 | 0.037 | 0.015 | 0.032 | 0.004 | 0.084 | 0.040 | 0.188 | 0.034 | 0.109 | 0.040 | ||||||||
| Chroococcales | 0.051 | 0.014 | 0.024 | 0.013 | 0.045 | 0.012 | 0.073 | 0.025 | 0.074 | 0.040 | 0.116 | 0.094 | 0.001 | 0.001 | 0.000 | 0.000 | 0.000 | 0.000 | ||||||||
| Bacillales | 0.040 | 0.009 | 0.029 | 0.009 | 0.170 | 0.012 | 0.029 | 0.007 | 0.033 | 0.008 | 0.025 | 0.016 | 0.001 | 0.001 | 0.000 | 0.000 | 0.001 | 0.001 | ||||||||
| Rhodospirillales | 0.042 | 0.010 | 0.037 | 0.000 | 0.025 | 0.005 | 0.034 | 0.010 | 0.031 | 0.007 | 0.028 | 0.000 | 0.002 | 0.001 | 0.001 | 0.001 | 0.001 | 0.001 | ||||||||
| Xanthomonadales | 0.022 | 0.004 | 0.019 | 0.010 | 0.010 | 0.004 | 0.010 | 0.004 | 0.017 | 0.006 | 0.012 | 0.008 | 0.001 | 0.001 | 0.003 | 0.001 | 0.004 | 0.003 | ||||||||
| iii1-15 | 0.010 | 0.002 | 0.034 | 0.006 | 0.006 | 0.001 | 0.011 | 0.005 | 0.014 | 0.006 | 0.004 | 0.004 | 0.000 | 0.000 | 0.000 | 0.000 | 0.000 | 0.000 | ||||||||
| Rhodobacterales | 0.005 | 0.003 | 0.007 | 0.004 | 0.006 | 0.003 | 0.002 | 0.001 | 0.006 | 0.003 | 0.000 | 0.000 | 0.009 | 0.004 | 0.012 | 0.004 | 0.009 | 0.002 | ||||||||
| Myxococcales | 0.006 | 0.003 | 0.014 | 0.005 | 0.008 | 0.003 | 0.008 | 0.003 | 0.010 | 0.004 | 0.007 | 0.001 | 0.000 | 0.000 | 0.000 | 0.000 | 0.000 | 0.000 | ||||||||
| Solirubrobacterales | 0.019 | 0.005 | 0.014 | 0.002 | 0.005 | 0.002 | 0.009 | 0.003 | 0.004 | 0.002 | 0.002 | 0.002 | 0.000 | 0.000 | 0.000 | 0.000 | 0.000 | 0.000 | ||||||||
| Acidimicrobiales | 0.016 | 0.006 | 0.011 | 0.003 | 0.006 | 0.001 | 0.007 | 0.003 | 0.011 | 0.002 | 0.000 | 0.000 | 0.000 | 0.000 | 0.000 | 0.000 | 0.000 | 0.000 | ||||||||
| Gaiellales | 0.013 | 0.006 | 0.011 | 0.005 | 0.007 | 0.001 | 0.006 | 0.003 | 0.010 | 0.005 | 0.003 | 0.003 | 0.000 | 0.000 | 0.000 | 0.000 | 0.000 | 0.000 | ||||||||
| Oceanospirillales | 0.020 | 0.020 | 0.000 | 0.000 | 0.001 | 0.000 | 0.001 | 0.001 | 0.018 | 0.018 | 0.000 | 0.000 | 0.000 | 0.000 | 0.000 | 0.000 | 0.000 | 0.000 | ||||||||
| Flavobacteriales | 0.003 | 0.001 | 0.013 | 0.008 | 0.002 | 0.001 | 0.002 | 0.001 | 0.002 | 0.001 | 0.002 | 0.002 | 0.001 | 0.001 | 0.003 | 0.001 | 0.002 | 0.001 | ||||||||
| Chthoniobacterales | 0.002 | 0.002 | 0.011 | 0.003 | 0.001 | 0.000 | 0.001 | 0.001 | 0.000 | 0.000 | 0.000 | 0.000 | 0.000 | 0.000 | 0.000 | 0.000 | 0.000 | 0.000 | ||||||||
| Others b | 0.138 | 0.050 | 0.210 | 0.072 | 0.102 | 0.022 | 0.120 | 0.044 | 0.135 | 0.030 | 0.090 | 0.023 | 0.037 | 0.020 | 0.036 | 0.010 | 0.022 | 0.005 | ||||||||

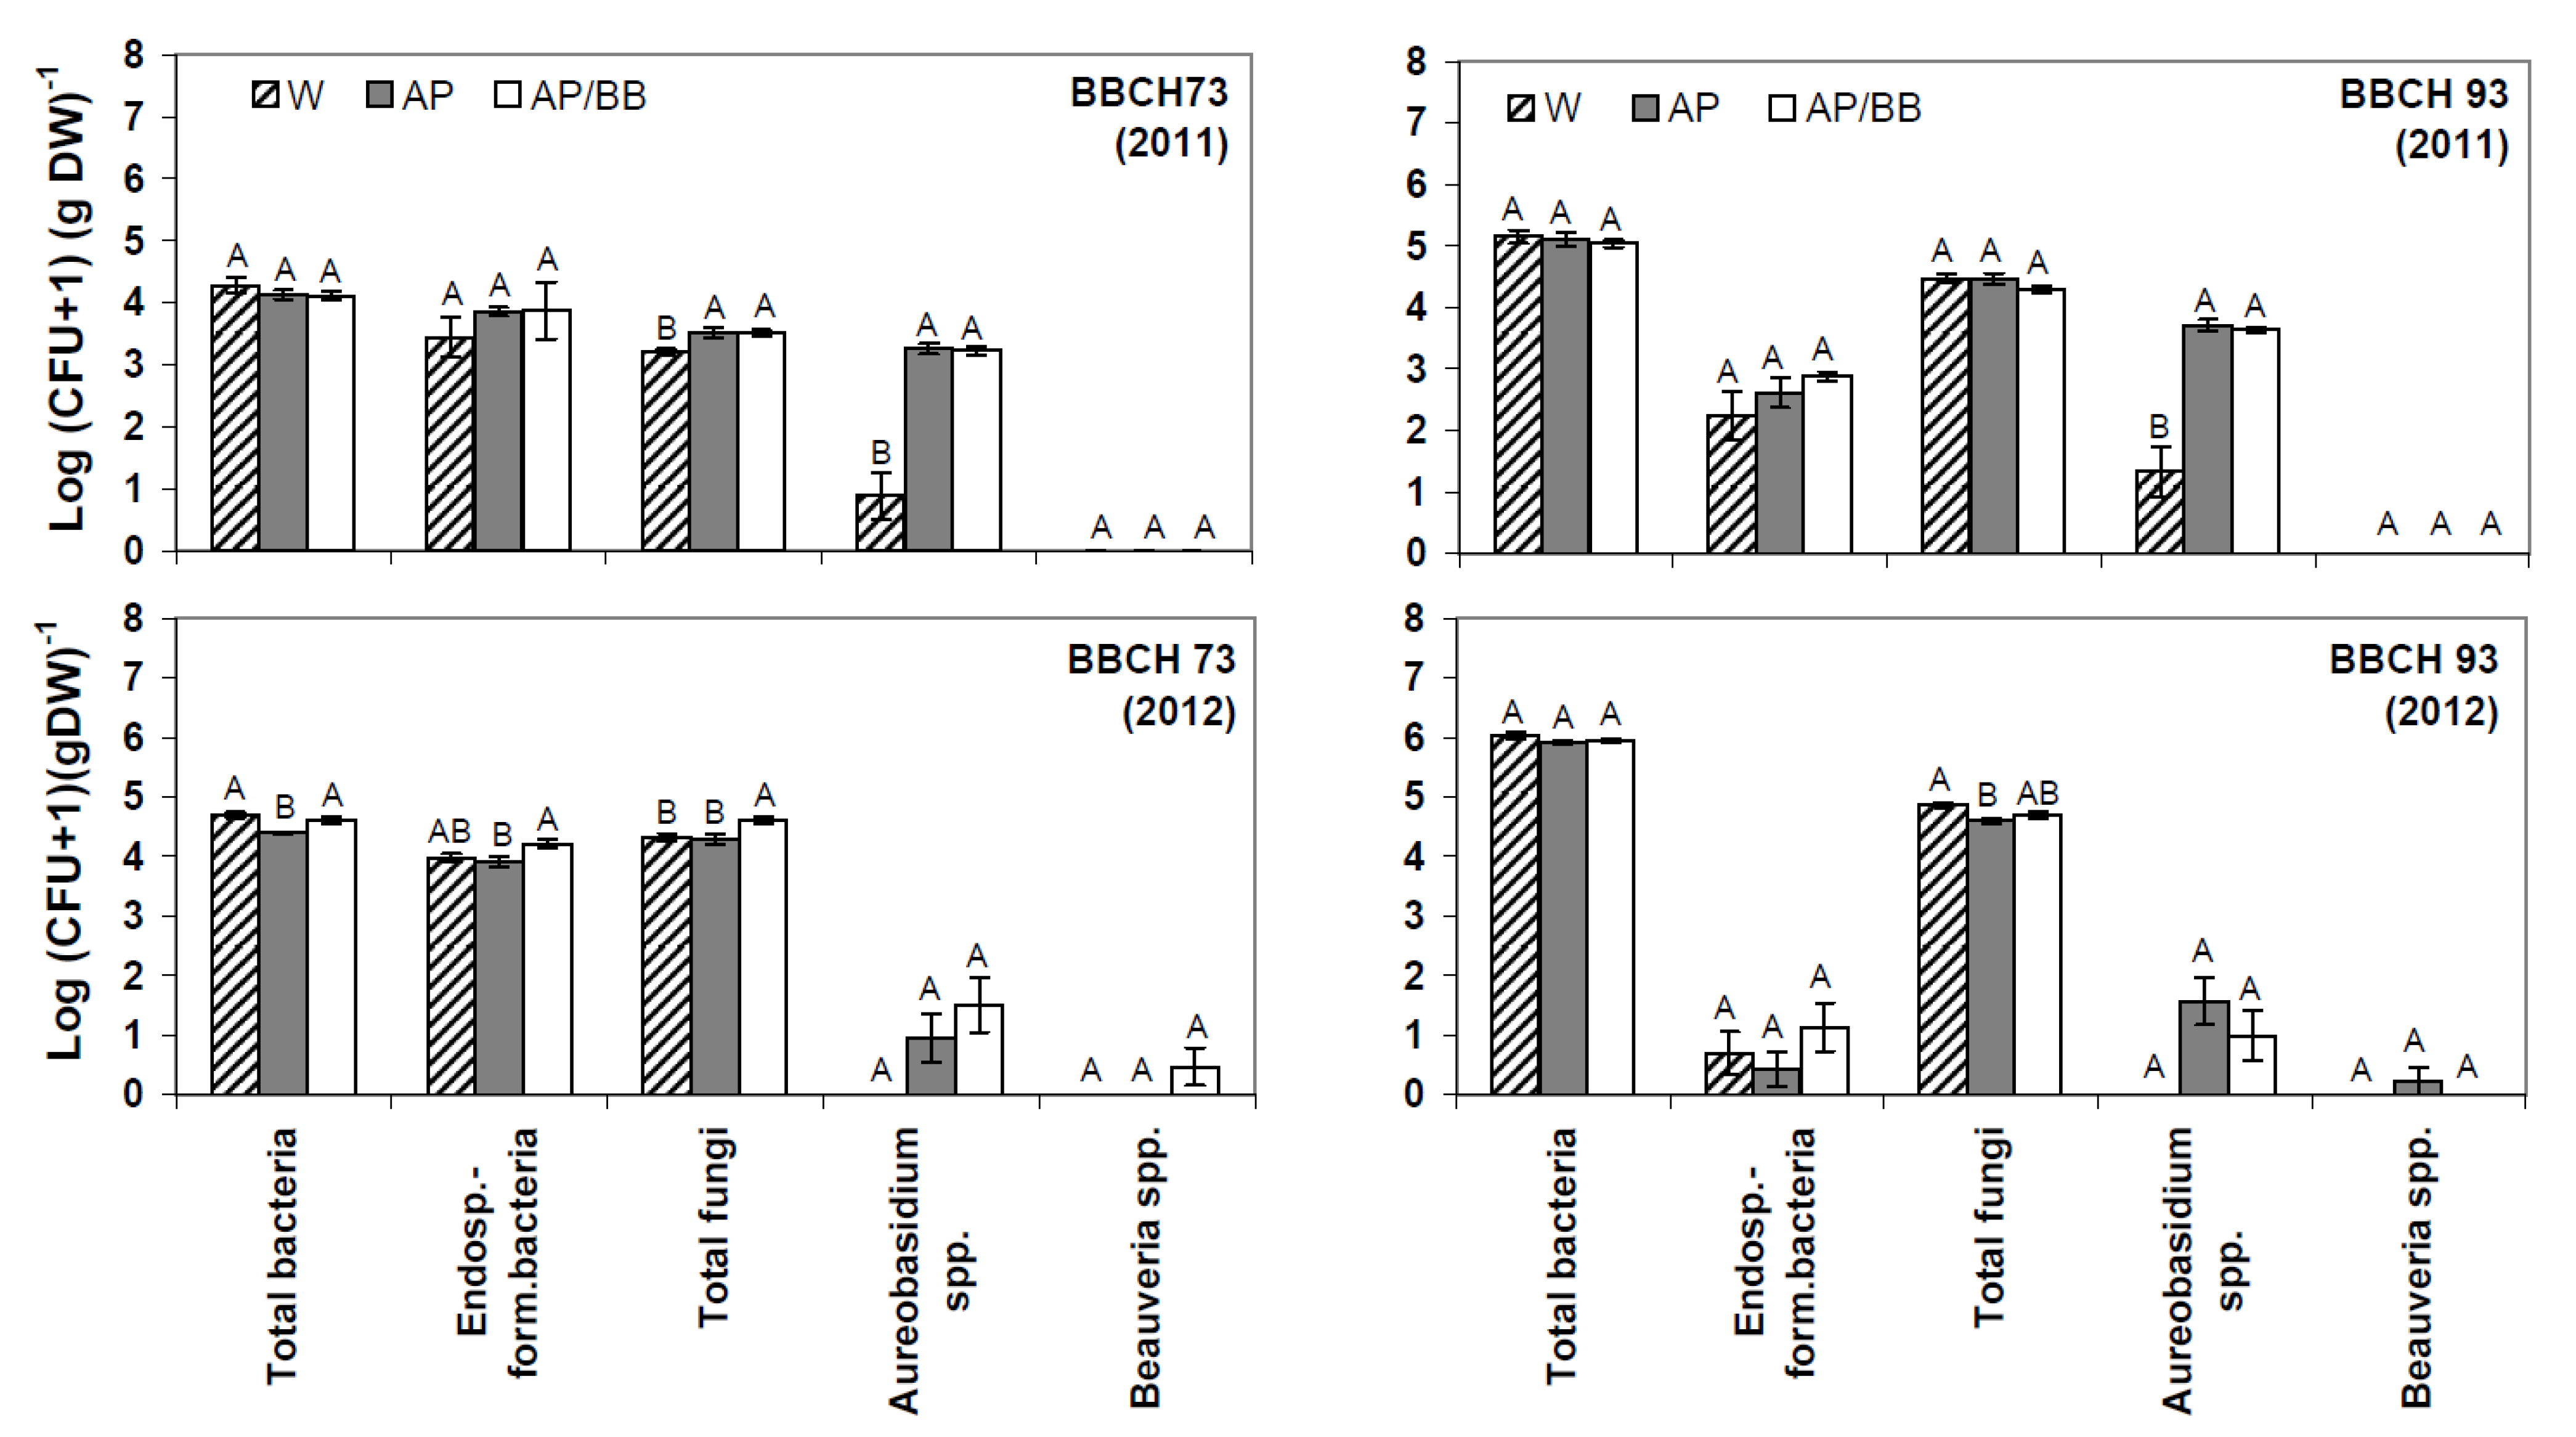
2.2. Effects of Introducing BCAs to the Strawberry Phyllosphere
2.3. Interactions between Environmental Conditions and Microbial Dynamics in the Phyllosphere
| Mean temperature [°C] | Accumulated precipitation [mm] | ||||
|---|---|---|---|---|---|
| 2011 | 2012 | 2011 | 2012 | ||
| During the whole season | 17.0 a | 16.0 a | 103 b | 153 b | |
| 7 d prior to 1st sampling (BBCH 60) | NA c | 8.3 | 3.0 | 7.3 | |
| 3 d prior to 1st sampling (BBCH 60) | NA c | 5.6 | 0.0 | 2.3 | |
| 1 d prior to 1st sampling (BBCH 60) | NA c | 5.7 | 0.0 | 2.0 | |
| 7 d prior to 2nd sampling (BBCH 73) | 14.4 | 14.9 | 8.2 | 12.6 | |
| 3 d prior to 2nd sampling (BBCH 73) | 11.4 | 11.2 | 0.0 | 0.6 | |
| 1 d prior to 2nd sampling (BBCH 73) | 9.8 | 10.3 | 0.0 | 0.6 | |
| 7 d prior to 3rd sampling (BBCH 93) | 19.6 | 21.2 | 7.4 | 14.1 | |
| 3 d prior to 3rd sampling (BBCH 93) | 24.3 | 18.8 | 0.0 | 5.1 | |
| 1 d prior to 3rd sampling (BBCH 93) | 26.0 | 21.5 | 0.0 | 0.0 | |
 = BBCH 93). Filled and open symbols represent data generated in 2011 and 2012, respectively. For 2011, data considering fungal ITS sequences and bacterial 16S rRNA sequences are excluded at BBCH 60 due to missing temperature data. Data for bacterial 16S rRNA sequences are excluded at BBCH 73 due to insufficient bioinformatic data.
= BBCH 93). Filled and open symbols represent data generated in 2011 and 2012, respectively. For 2011, data considering fungal ITS sequences and bacterial 16S rRNA sequences are excluded at BBCH 60 due to missing temperature data. Data for bacterial 16S rRNA sequences are excluded at BBCH 73 due to insufficient bioinformatic data.
= BBCH 93). Filled and open symbols represent data generated in 2011 and 2012, respectively. For 2011, data considering fungal ITS sequences and bacterial 16S rRNA sequences are excluded at BBCH 60 due to missing temperature data. Data for bacterial 16S rRNA sequences are excluded at BBCH 73 due to insufficient bioinformatic data.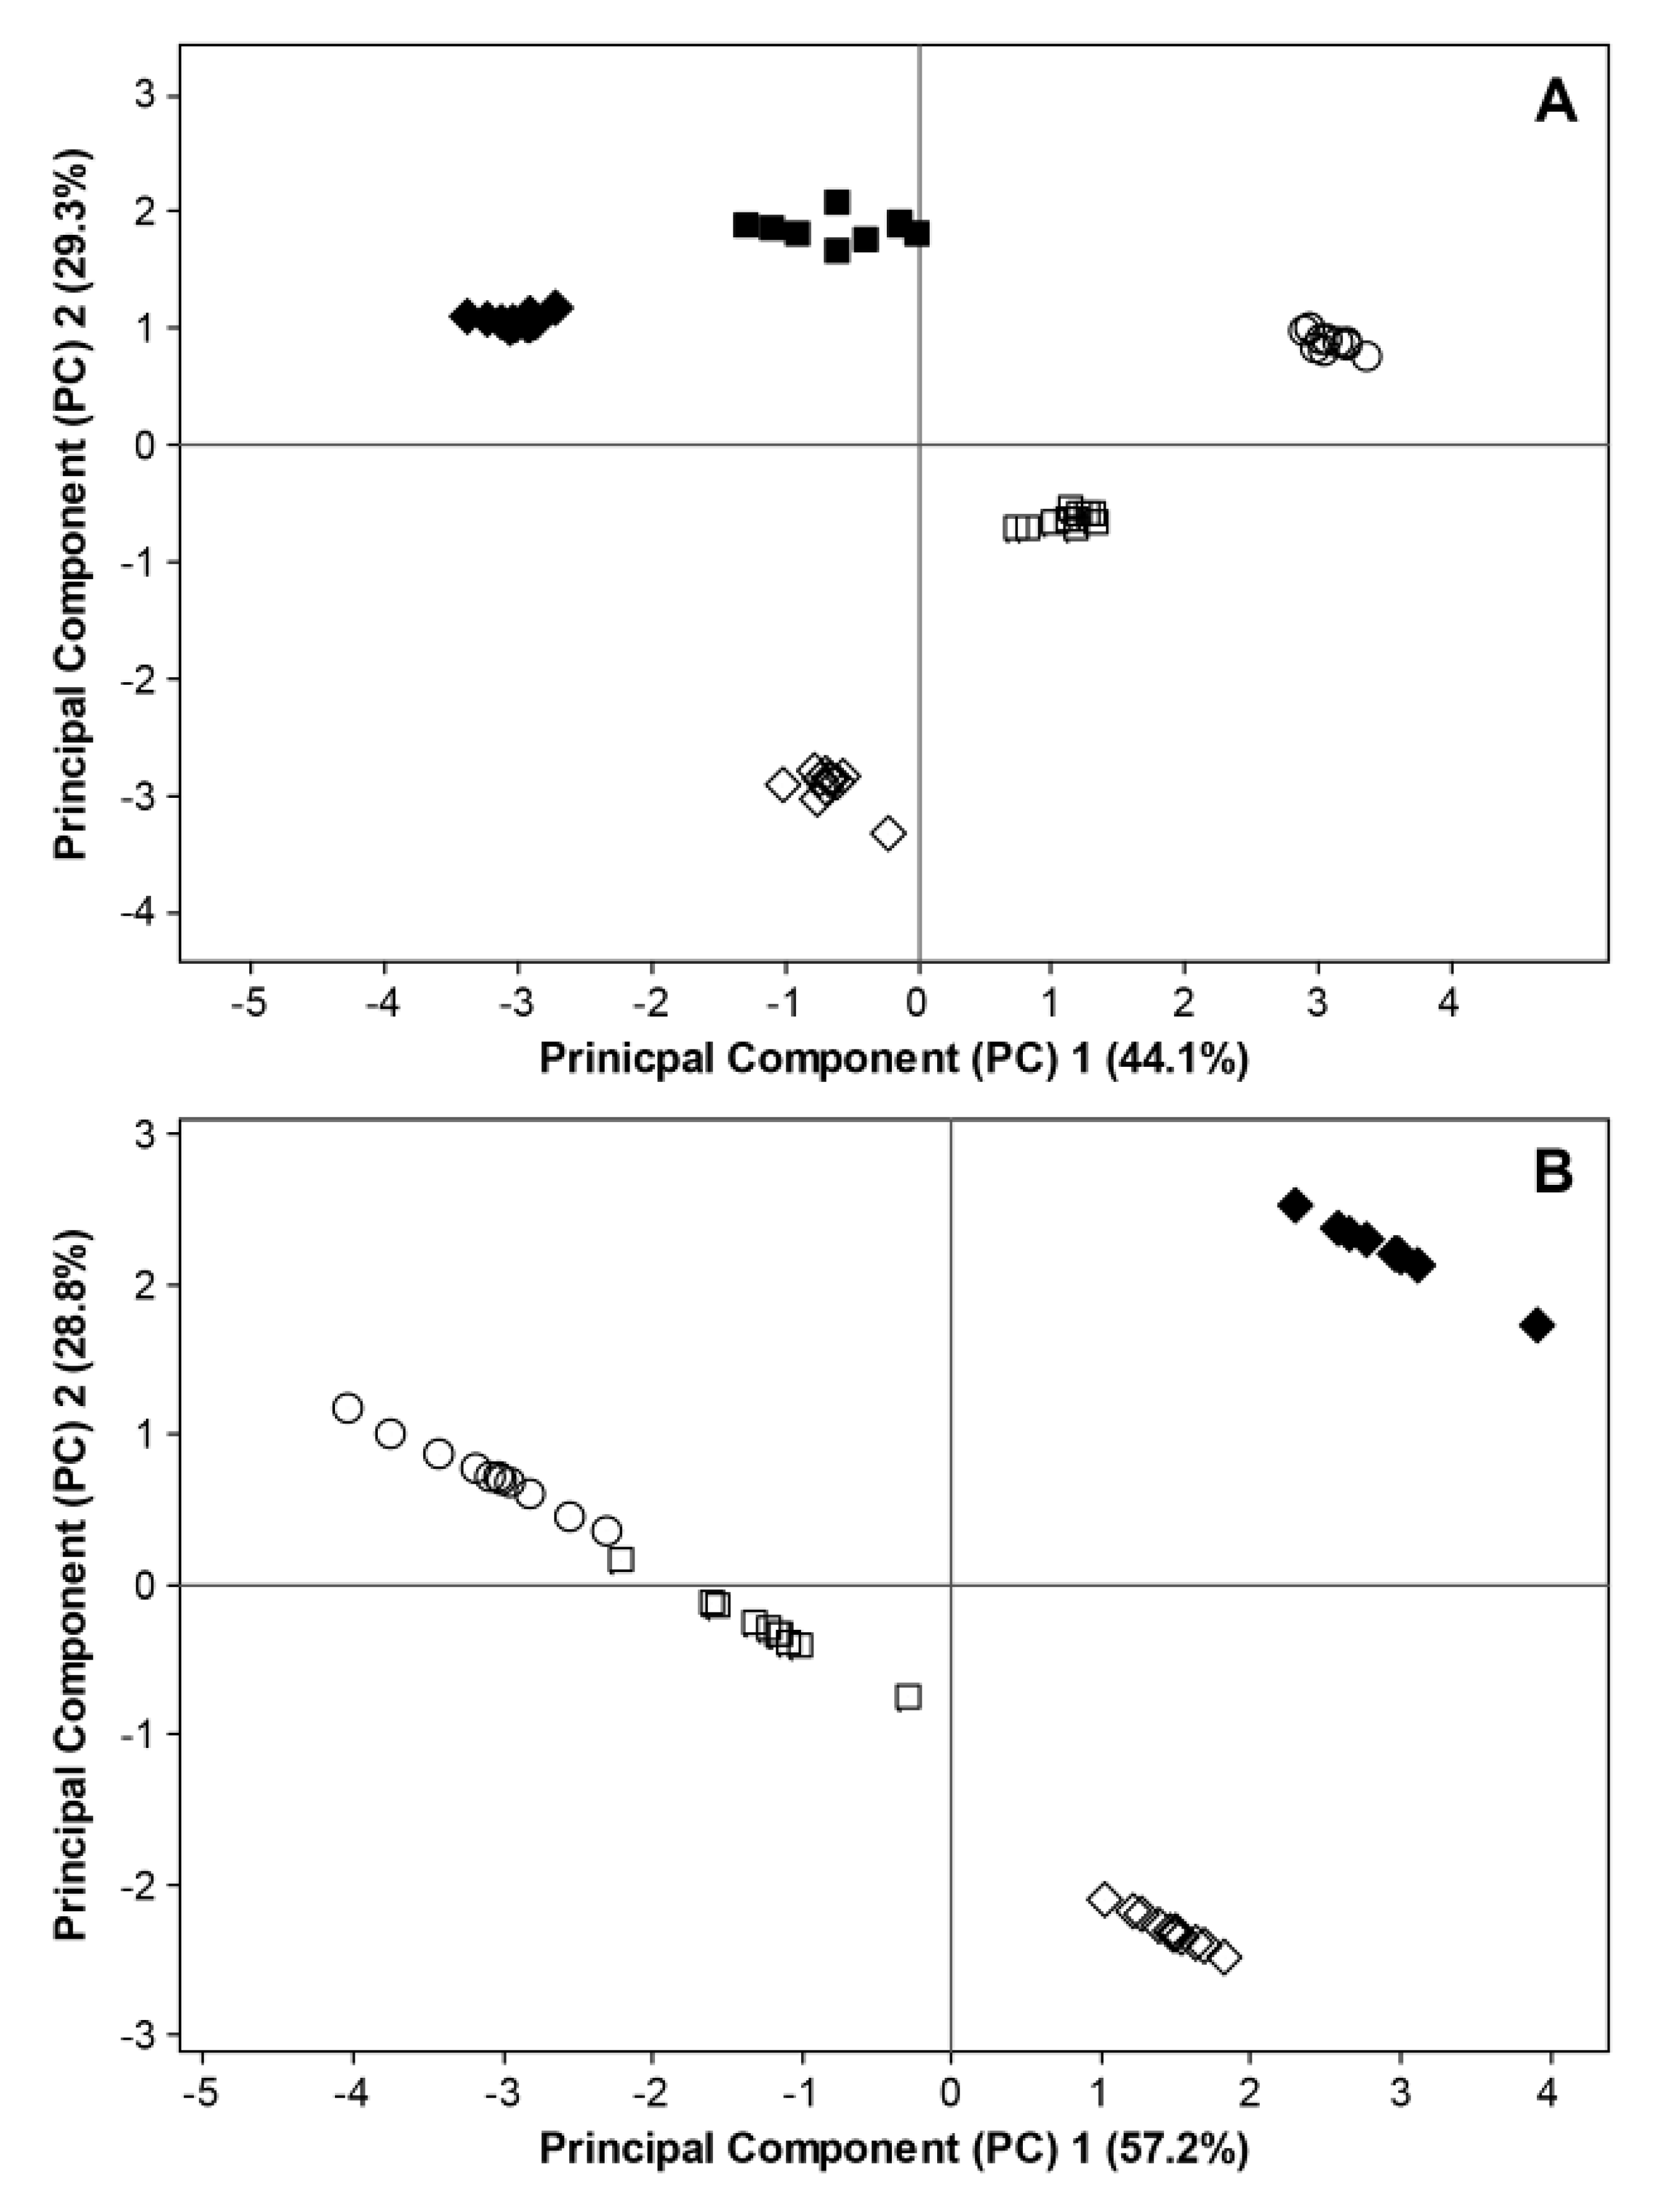
3. Experimental Section
3.1. Experimental Design
3.2. Sample Collection and Microbe Extraction
3.3. Plate Counts
3.4. DNA Isolation and 454 Pyrosequencing
3.5. OTU Picking and Taxomomic Assignment
3.6. Statistical Analysis of Data from Plate Counts and 454 Pyrosequencing
4. Conclusions
Acknowledgments
Conflicts of Interest
References
- Elad, Y.; Kirshner, B.; Yehuda, N.; Sztejnberg, A. Management of powdery mildew and gray mold of cucumber by Trichoderma harzianum T39 and Ampelomyces quisqualis AQ10. BioControl 1998, 43, 241–251. [Google Scholar]
- Kovach, J.; Petzoldt, R.; Harman, G.E. Use of honey bees and bumble bees to disseminate Trichoderma harzianum 1295-22 to strawberries for Botrytis control. Biol. Control 2000, 18, 235–242. [Google Scholar] [CrossRef]
- Elad, Y.; Stewart, A. Microbial Control of Botrytis spp. In Botrytis: Biology, Pathology and Control; Elad, Y., Williamson, B., Tudzynski, P., Delen, N., Eds.; Kluwer Academic Publishers: Dordrecht, The Netherlands, 2004; pp. 223–241. [Google Scholar]
- Freeman, S.; Minz, D.; Kolesnik, I.; Barbul, O.; Zveibil, A.; Maymon, M.; Nitzani, Y.; Kirshner, B.; Rav-David, D.; Bilu, A.; et al. Trichoderma biocontrol of Colletotrichum acutatum and Botrytis cinerea and survival in strawberry. Eur. J. Plant Pathol. 2004, 110, 361–370. [Google Scholar]
- Prokkola, S.; Kivijärvi, P. Effect of biological sprays on the incidence of grey mould, fruit yield and fruit quality in organic strawberry production. Agric. Food Sci. 2007, 16, 25–33. [Google Scholar] [CrossRef]
- Pertot, I.; Zasso, R.; Amsalem, L.; Baldessari, M.; Gino Angeli, G.; Elad, Y. Integrating biocontrol agents in strawberry powdery mildew control strategies in high tunnel growing systems. Crop Prot. 2008, 27, 622–631. [Google Scholar] [CrossRef]
- Andrews, J.H. Biological control in the phyllosphere. Annu. Rev. Phytopathol. 1992, 30, 603–635. [Google Scholar]
- Lindow, S.E.; Brandl, M.T. Microbiology of the phyllosphere. Appl. Environ. Microbiol. 2003, 69, 1875–1883. [Google Scholar] [CrossRef]
- Whipps, J.M.; Hand, P.; Pink, D.; Bending, G.D. Phyllosphere microbiology with special reference to diversity and plant genotype. J. Appl. Microbiol. 2008, 105, 1744–1755. [Google Scholar]
- Jacobsen, B.J. Biological Control of Plant Diseases by Phyllosphere Applied Biological Control Agents. In Microbial Ecology of Aerial Plant Surfaces; Bailey, M.J., Lilley, A.K., Timms-Willson, T.M., Spencer-Phillips, P.T.N., Eds.; CABI: Oxfordshire, UK, 2006; pp. 133–147. [Google Scholar]
- Elad, Y.; Kirshner, B. Survival in the phylloplane of an introduced biocontrol agent (Trichoderma harzianum) and populations of the plant pathogen Botrytis cinerea as modified by abiotic conditions. Phytoparasitica 1993, 21, 303–313. [Google Scholar]
- Monier, J.M.; Lindow, S.E. Aggregates of resident bacteria facilitate survival of immigrant bacteria on leaf surfaces. Microb. Ecol. 2005, 49, 343–352. [Google Scholar]
- Longa, C.M.O.; Pertot, I.; Tosi, S. Ecophysiological requirements and survival of a Trichoderma atroviride isolate with biocontrol potential. J. Basic Microbiol. 2008, 48, 269–277. [Google Scholar]
- Guetsky, R.; Shtienberg, D.; Dinoor, A.; Elad, Y. Establishment, survival and activity of the biocontrol agents Pichia guilermondii and Bacillus mycoides applied as a mixture on strawberry plants. Biocontrol Sci. Technol. 2002, 12, 705–714. [Google Scholar]
- Lima, G.; Ippolito, A.; Nigro, F.; Salerno, M. Effectiveness of Aureobasidium pullulans and Candida oleophila against postharvest strawberry rots. Postharvest Biol. Technol. 1997, 10, 169–178. [Google Scholar]
- Adikaram, N.; Joyce, D.; Terryc, L. Biocontrol activity and induced resistance as a possible mode of action for Aureobasidium pullulans against grey mould of strawberry fruit. Australas. Plant Pathol. 2002, 31, 223–229. [Google Scholar]
- Cook, J.; Bruckart, W.L.; Coulson, J.R.; Goettel, M.S.; Humber, R.A.; Lumsden, R.D.; Maddox, J.V.; McManus, M.L.; Moore, L.; Meyer, S.F.; et al. Safety of microorganisms intended for pest and plant disease control: A framework for scientific evaluation. Biol. Control 1996, 7, 333–351. [Google Scholar]
- Kinkel, L.L. Microbial population dynamics on leaves. Annu. Rev. Phytopathol. 1997, 35, 327–347. [Google Scholar]
- Hunter, P.J.; Hand, P.; Pink, D.; Whipps, J.M.; Bending, G.D. Both leaf properties and microbe-microbe interactions influence within-species variation in bacterial population diversity and structure in the lettuce (Lactuca species) phyllosphere. Appl. Environ. Microbiol. 2010, 76, 8117–8125. [Google Scholar]
- De Jager, E.S.; Wehner, F.C.; Korsten, L. Microbial ecology of the mango phylloplane. Microb. Ecol. 2001, 42, 201–207. [Google Scholar]
- Zhang, B.; Bai, Z.; Hoefel, D.; Tang, L.; Yang, Z.; Zhuang, G.; Yang, J.; Zhang, H. Assessing the impact of the biological control agent Bacillus thuringiensis on the indigenous microbial community within the pepper plant phyllosphere. FEMS Microbiol. Lett. 2008, 284, 102–108. [Google Scholar]
- Sylla, J.; Alsanius, B.W.; Krüger, E.; Reineke, A.; Strohmeier, S.; Wohanka, W. Leaf microbiota of strawberries as affected by biological control agents. Phytopathology 2013, 103, 1001–1011. [Google Scholar]
- Kim, Y.; Cho, M.; Jeong, J.; Lee, H.; Kim, S. pplication of terminal restriction fragment length polymorphism (T-RFLP) analysis to monitor effect of biocontrol agents on rhizosphere microbial community of hot pepper (Capsicum annuum L.). J. Microbiol. 2010, 48, 566–572. [Google Scholar]
- Russell, D.; Chard, J.; McKinlay, R. Effect of Bacillus thuringiensis and a pyrethroid insecticide on the leaf microflora of Brassica oleracea. Lett. Appl. Microbiol. 1999, 28, 359–362. [Google Scholar]
- Okon Levy, N.; Elad, Y.; Katan, J.; Baker, S.C.; Faull, J.L. Trichoderma and soil solarization induced microbial changes on plant surfaces. IOBC/WPRS Bull. 2006, 29, 21–26. [Google Scholar]
- Deacon, J. Fungal Ecology: Saprotrophs. In Fungal biology, 4th ed.; Blackwell Publishing: Malden, MA, USA, 2006; pp. 213–236. [Google Scholar]
- Andrews, J.H. Population Growth and the Landscape Ecology of Microbes on Leaf Surfaces. In Microbial Ecology of Aerial Plant Surfaces; Bailey, M.J., Lilley, A.K., Timms-Willson, T.M., Spencer-Phillips, P.T.N., Eds.; CABI: Oxfordshire, UK, 2006; pp. 239–250. [Google Scholar]
- Chi, Z.; Wang, F.; Chi, Z.; Yue, L.; Liu, G.; Zhang, T. Bioproducts from Aureobasidium pullulans, a biotechnologically important yeast. Appl. Microbiol. Biotechnol. 2009, 82, 793–804. [Google Scholar]
- Thompson, I.P.; Bailey, M.J.; Fenlon, J.S.; Fermor, T.R.; Lilley, A.K.; Lynch, J.M.; McCormack, P.J.; McQuilken, M.P.; Purdy, K.J.; Rainey, P.B.; et al. Quantitative and qualitative seasonal changes in the microbial community from the phyllosphere of sugar beet (Beta vulgaris). Plant Soil 1993, 150, 177–191. [Google Scholar]
- Inácio, J.; Pereira, P.; Carvalho, M.; Fonseca, Á.; Amaral-Collaço, M.T.; Spencer-Martins, I. Estimation and diversity of phylloplane mycobiota on selected plants in a Mediterranean-type ecosystem in Portugal. Microb. Ecol. 2002, 44, 344–353. [Google Scholar]
- Jensen, B.; Knudsen, I.M.B.; Andersen, B.; Nielsen, K.F.; Thrane, U.; Jensen, D.F.; Larsen, J. Characterization of microbial communities and fungal metabolites on field grown strawberries from organic and conventional production. Int. J. Food Microbiol. 2013, 160, 313–322. [Google Scholar]
- Blakeman, J.P.; Fokkema, N.J. Potential for biological control of plant diseases on the phylloplane. Annu. Rev. Phytopathol. 1982, 20, 167–190. [Google Scholar]
- Leveau, J.H.J.; Tech, J.J. Grapevine microbiomics: Bacterial diversity on grape leaves and berries revealed by high-throughput sequence analysis of 16S rRNA amplicons. Acta Hortic. 2011, 905, 31–42. [Google Scholar]
- Ottesen, A.R.; White, J.R.; Skaltsas, D.N.; Newell, M.J.; Walsh, C.S. Impact of organic and conventional management on the phyllosphere microbial ecology of an apple crop. J. Food Prot. 2009, 72, 2321–2325. [Google Scholar]
- Redford, A.J.; Fierer, N. Bacterial succession on the leaf surface: A novel system for studying successional dynamics. Microb. Ecol. 2009, 58, 189–198. [Google Scholar]
- Kitajima, K.; Mulkey, S.; Wright, S. Decline of photosynthetic capacity with leaf age in relation to leaf longevities for five tropical canopy tree species. Am. J. Bot. 1997, 84, 702–708. [Google Scholar]
- Tefera, T.; Vidal, S. Effect of inoculation method and plant growth medium on endophytic colonization of sorghum by the entomopathogenic fungus Beauveria bassiana. BioControl 2009, 54, 663–669. [Google Scholar]
- Vega, F.E.; Posada, F.; Catherine Aime, M.; Pava-Ripoll, M.; Infante, F.; Rehner, S.A. Entomopathogenic fungal endophytes. Biol. Control 2008, 46, 72–82. [Google Scholar]
- Castoria, R.; de Curtis, F.; Lima, G.; Caputo, L.; Pacifico, S.; de Cicco, V. Aureobasidium pullulans (LS-30) an antagonist of postharvest pathogens of fruits: Study on its modes of action. Postharvest Biol. Technol. 2001, 22, 7–17. [Google Scholar]
- Kadivar, H.; Stapleton, A.E. Ultraviolet radiation alters maize phyllosphere bacterial diversity. Microb. Ecol. 2003, 45, 353–361. [Google Scholar]
- Finkel, O.M.; Burch, A.Y.; Lindow, S.E.; Post, A.F.; Belkin, S. Geographical location determines the population structure in phyllosphere microbial communities of a salt-excreting desert tree. Appl. Environ. Microbiol. 2011, 77, 7647–7655. [Google Scholar]
- Wetteronline. Available online: www.wetteronline.de (accessed on 29 May 2013).
- Meier, U.; Graf, H.; Hack, H.; Hess, M.; Kennel, W.; Klose, R.; Mappes, D.; Seipp, D.; Stauss, R.; Streif, J.; et al. Phänologische Entwicklungsstadien des Kernobstes (Malus domestica Borkh.und Pyrus communis L.), des Steinobstes (Prunus-Arten), der Johannisbeere (Ribes-Arten) und der Erdbeere (Fragaria x ananassa Duch.). Nachrichtenbl. Deut. Pflanzenschutzd. 1994, 46, 141–153. [Google Scholar]
- Buée, M.; Reich, M.; Murat, C.; Morin, E.; Nilsson, R.H.; Uroz, S.; Martin, F. 454 pyrosequencing analyses of forest soils reveal an unexpectedly high fungal diversity. New Phytol. 2009, 184, 449–456. [Google Scholar]
- Hamp, T.J.; Jones, W.J.; Fodor, A.A. Effects of experimental choices and analysis noise on surveys of the “rare biosphere”. Appl. Environ. Microbiol. 2009, 75, 3263–3270. [Google Scholar]
- Hirsch, J.; Strohmeier, S.; Pfannkuchen, M.; Reineke, A. Assessment of bacterial endosymbiont diversity in Otiorhynchus spp. (Coleoptera: Curculionidae) larvae using a multitag 454 pyrosequencing approach. BMC Microbiol. 2009, 12, S6. [Google Scholar]
- Caporaso, J.G.; Kuczynski, J.; Stombaugh, J.; Bittinger, K.; Bushman, F.D.; Costello, E.K.; Fierer, N.; Peña, A.G.; Goodrich, J.K.; Gordon, J.I.; et al. QIIME allows analysis of high-throughput community sequencing data. Nat. Methods 2010, 7, 335–336. [Google Scholar]
- Quince, C.; Lanzén, A.; Curtis, T.P.; Davenport, R.J.; Hall, N.; Head, I.M.; Read, L.F.; Sloan, W.T. Accurate determination of microbial diversity from 454 pyrosequencing data. Nat. Methods 2009, 6, 639–641. [Google Scholar]
- Wang, Q.; Garrity, G.M.; Tiedje, J.M.; Cole, J.R. Naive Bayesian classifier for rapid assignment of rRNA sequences into the new bacterial taxonomy. Appl. Environ. Microbiol. 2007, 73, 5261–5267. [Google Scholar]
- STATISTICA für Windows [Software-System für Datenanalyse], Version 7.1. ed; StatSoft, Inc.: Tulsa, OH, USA, 2005.
- Hammer, Ø; Harper, D.A.T.; Ryan, P.D. PAST: Paleontological statistics software package for education and data analysis. Palaeontol. Electron. 2001, 4, 1–9. [Google Scholar]
- Minitab, I. Minitab 16 Statistical Software. Available online: www.minitab.com (acessed on 1 September 2012).
- Alabouvette, C.; Olivain, C.; Steinberg, C. Biological control of plant diseases: The european situation. Eur. J. Plant Pathol. 2006, 114, 329–341. [Google Scholar]
- Moser, R.; Pertot, I.; Elad, Y.; Raffaelli, R. Farmers’ attitudes toward the use of biocontrol agents in IPM strawberry production in three countries. Biol. Control 2008, 47, 125–132. [Google Scholar]
© 2013 by the authors; licensee MDPI, Basel, Switzerland. This article is an open access article distributed under the terms and conditions of the Creative Commons Attribution license (http://creativecommons.org/licenses/by/3.0/).
Share and Cite
Sylla, J.; Alsanius, B.W.; Krüger, E.; Reineke, A.; Bischoff-Schaefer, M.; Wohanka, W. Introduction of Aureobasidium pullulans to the Phyllosphere of Organically Grown Strawberries with Focus on Its Establishment and Interactions with the Resident Microbiome. Agronomy 2013, 3, 704-731. https://doi.org/10.3390/agronomy3040704
Sylla J, Alsanius BW, Krüger E, Reineke A, Bischoff-Schaefer M, Wohanka W. Introduction of Aureobasidium pullulans to the Phyllosphere of Organically Grown Strawberries with Focus on Its Establishment and Interactions with the Resident Microbiome. Agronomy. 2013; 3(4):704-731. https://doi.org/10.3390/agronomy3040704
Chicago/Turabian StyleSylla, Justine, Beatrix W. Alsanius, Erika Krüger, Annette Reineke, Monika Bischoff-Schaefer, and Walter Wohanka. 2013. "Introduction of Aureobasidium pullulans to the Phyllosphere of Organically Grown Strawberries with Focus on Its Establishment and Interactions with the Resident Microbiome" Agronomy 3, no. 4: 704-731. https://doi.org/10.3390/agronomy3040704
APA StyleSylla, J., Alsanius, B. W., Krüger, E., Reineke, A., Bischoff-Schaefer, M., & Wohanka, W. (2013). Introduction of Aureobasidium pullulans to the Phyllosphere of Organically Grown Strawberries with Focus on Its Establishment and Interactions with the Resident Microbiome. Agronomy, 3(4), 704-731. https://doi.org/10.3390/agronomy3040704