

Evaluating the Effects of Long-Term Salinity Stress on the Growth and Physiology of Mono and Mixed Crops
by
 , , ,
, , ,
Khulan Sharavdorj
1 ,
,
Ser-Oddamba Byambadorj
2 ,
,
Yeongmi Jang
1,
Youngjik Ahn
3 and
Jin-Woong Cho
1,* 1
Department of Crop Science, College of Agriculture and Life Science, Chungnam National University, Daejeon 34134, Republic of Korea
2
Laboratory of Forest Genetics and Ecophysiology, National University of Mongolia, Ulaanbaatar 14201, Mongolia
3
Department of Horticulture and Forestry, Pai Chai University, 155-40, Baejae-ro, Seo-gu, Daejeon 35345, Republic of Korea
*
Author to whom correspondence should be addressed.
Agronomy 2024, 14(2), 287; https://doi.org/10.3390/agronomy14020287
Submission received: 13 December 2023
/
Revised: 11 January 2024
/
Accepted: 25 January 2024
/
Published: 27 January 2024
(This article belongs to the Special Issue Integration of Agronomic Practices for Sustainable Crop Production)
Abstract
:Soil salinity is a key factor to limiting agricultural products throughout the world, especially in arid and semi-arid areas, since it intervenes with plant morpho-physiology, resulting in reduced growth and development, as well as disruption of ion homeostasis. This work examined the effects of salinity stress on the mono-cropping of T. pratense, F. arundinacea, and M. sativa and CaSO4 and MgSO4 on the mixed-cropping of T. pratense and F. arundinacea under saline conditions. Plants were assessed by dry weights, physiological parameters (photosynthesis rate, SPAD, SLA), forage quality, and ion concentrations. The biomass of all mono species decreased under salinity, except M. sativa, and mixed cropping was affected less than mono-cropping. The values of the mono-cropping of SPAD were decreased in the long term, and SLA was higher than the control in mixed cropping, with the photosynthesis rate of mono-cropping being higher in medium salinity in the long-term; moreover, CaSO4 and MgSO4 enhanced the photosynthesis rate of mixed cropping. Overall, we concluded that M. sativa is tolerant to medium salinity, and mixed cropping plus MgSO4 and CaSO4 were efficient under salinity stress.
1. Introduction
In a low- and middle-income countries, livestock are everywhere; up to 60% of rural households are engaged in raising livestock [1]. Livestock play vital role in South Asia and Africa, accounting for up to 40% of their agricultural gross domestic product and being the foundational livelihood of herders in rangeland ecosystems [2]. It has been estimated that 40% of the Earth’s land is covered by grasslands, which are mainly used for livestock grazing, and research has shown that light and moderate grazing can improve grassland diversity; however, heavy grazing typically leads to serious degradation [3]. The growth of animal husbandry is hindered by the difficulty of protecting rangeland and a deficiency of forage. The response to this issue is to stimulate forage production from multiple sources [4]. Forage crops are mainly composed of plant leaves and stems, and they include not only plants consumed directly by livestock, such as pasture grass, but also straw crops, immature cereal crops, or material harvested as fodder [5]. Crop cultivation is faced with multiple difficulties due to soil salinity, not only in coastal areas but also from other sources such as improper agronomic practices or the use of recycled water for irrigation that may contain a hefty number of salts [6]. Plant growth is mostly affected by the excessive salt concentrations in saline soils all around the world (iso-osmotic calcium nitrate and sodium chloride stresses have differential effects on growth and photosynthetic capacity in tomato). Over a billion hectares of land in more than a hundred countries globally has been affected by salinity, and the numbers are continuing to climb [6]. Stress caused by salt in plants is composed of three main parts: osmotic stress, ion toxicity, and nutritional discrepancy. When the salinity is high, plants are unable to withstand the large number of solutes in their cytoplasm. Salinity stress triggers osmotic and ion toxicity as Na+ ions are assimilated, and the Na+/K+ ratio is reduced with lower osmotic potential in plant roots. These imbalances in ion concentrations hinder the uptake and transport of important ions, undermining crucial plant processes and functions [7,8]. Moreover, forage quality indicated by crude protein (CP), neutral detergent fiber (NDF), acid detergent fiber (ADF), and high CP and lower fiber content indicates high quality in terms of protein and digestibly. Studies have shown that salinity decreases the CP content of crops [9,10].
Tall fescue (Festuca arundinacea Schreb) is a well-known pasture and turf grass, renowned for its drought tolerance, which allows it to endure in areas where other cool-season grasses cannot, and it has high growth rates and competition with other pasture species, as well as providing a nutritive value to grazing animals [11]. Unlike other cool-season grasses, tall fescue is usually thought to be of low forage quality, and because of limited salt tolerance compared to warm-season grasses, its extensive usage as silage in arid areas is further limited [12]. Red clover (Trifolium pratense L.) is an essential grassland forage crop across temperate regions, regularly used in cycles with yearly crops or re-sown meadows, offering high yields, symbiotic N fixation, good soil structure, and high-quality animal feed [13]. Moreover, compared to the other legumes, red clover has a slower rate of protein degradation during ensiling, thus making it an excellent feed for grazing livestock [14]. The high protein content, digestibility, and quality of the milk produced by livestock that consume alfalfa make Alfalfa (Medicago sativa L.) a highly valued cash crop, one that is primarily used as livestock feed [15]. Alfalfa has earned the title of “queen of forages” because of its considerable importance and nutriment [16]. Moreover, alfalfa has the ability of N fixation and reduces the necessity for chemical N fertilizers, being extensively cultivated globally, particularly in dry and semi-dry areas [17,18]. Regardless of a plant’s salt tolerance, a high concentration of salt affects plant growth and reduces the yield. However, it was established that environmental impact can differ greatly between plant species and soil conditions depending on salinity levels and duration [19]. In this, recent studies and our previous studies suggest that certain agricultural practices such as mixed cropping and the additional application of fertilizers alleviate the effects of salinity stress on crop productivity [14,20,21]. Mixed cropping, also known as intercropping, is a traditional method that involves planting multiple crop varieties in one area simultaneously [22]. Intercropping legumes is a viable option to diversify crops and increase the production of cropping systems in an eco-friendly way, and it can be used to enrich soils with nitrogen produced through the legume–rhizobia symbiosis, thus increasing the quality of the soil and the amount of organic carbon stored [23]. Furthermore, magnesium sulfate (MgSO4) is one of the primary magnesium (Mg) fertilizers that does not require lime application to the soil. It enhances the seedlings’ capacity to endure salinity through enhancing the secondary metabolic synthesis pathways, and it is critical for plants’ photosynthesis [24]. Another one of the most abundant cations in plant is calcium (Ca), and it is vitally important in processes that maintain the structure and operational unity of plant membranes, stabilize cell wall structures, regulate ion transfer and selectivity, and manage ion exchange operations and cell wall enzyme activities [25].
Our previous study was focused on the effect of calcium and magnesium sulfate on monocrops under various salinity stresses [14]. Further, the purpose of the present study was to investigate changes in physiology and growth of the mono forage crops by exposing them to various salinity concentrations and then observing whether the salt tolerance of forage crops could improve through the application of magnesium and calcium sulfate fertilizers in mixed cropping.
2. Materials and Methods
2.1. Plant Materials and Experimental Design
The experiments were performed from March 2023 to September 2023 in a greenhouse at Chungnam National University (CNU), Daejeon, South Korea. Seeds of Medicago sativa L. (20 kg/ha−1), Trifolium pratense L. (20 kg/ha−1), and Festuca arundinacea Shreb. (10 kg/ha−1), were provided by the National Institution of Animal Science of Korea. Seeds were sown in 38.5 L pots (55 × 35 × 20 cm) with sandy clay soil on 1 March 2023. Soils (natural) were well mixed with CaCO3 (700 kg/ha−1), NO3 (15 kg/ha−1), and manure (26 kg/ha−1), and the soil pH was 7.3.
Two types of experiments were performed: (I) mono-cropping: where T. pratense; F. arundinacea; M. sativa species were grown solely in a pot; (II) mixed cropping: T. pratense and F. arundinacea were grown in a pot as mixed-cropping with a seed rate of 40% T. pratense + 60% F. arundinacea. Seedlings were emerged after 3 to 10 days depending on the species, and seedlings were irrigated normally every two to three days. Treatments commenced on the 10th of May. The control (CON) was planted and grown in the same conditions with other treatments but with no added salinity or other solutions. Salinity solution (NaCl) was applied (25 mM, 50 mM, and 100 mM) for mono-cropping, and CaSO4 + NaCl (10 mM CaSO4 + 100 mM NaCl) and MgSO4 + NaCl (2 mM MgSO4 + 100 mM NaCl) were applied for mixed cropping every three days until the measurement ended. Each treatment had three replicates (three pot), and the pot was completely filled with the given solution and then the solution was completely drained from the bottom of the pot. The inside temperature of the greenhouse was not controlled, and the first measurement was conducted on the 10–11 July, namely, 60 DAT (days after treatment), with the second measurements conducted on 20–21 September 2023, namely, 120 DAT (days after treatment).
2.2. Measurement of Leaf Area and Biomass
Four plants from three pots at each treatment were carefully harvested and thoroughly washed with tap water. After the plants were separated into leaves, stems, and roots, leaf area was measured with a leaf area meter (LI-3100 Li-Cor), and plants parts are oven-dried at 80 °C to determine biomass. Specific leaf area (SLA) was calculated as the ratio of leaf area to leaf dry mass (m2 kg−1) [26].
where A is the area of a given leaf or all leaves of a plant, and ML is the dry mass of those leaves.
SLA = A/ML
2.3. Measurements of SPAD, Photosynthesis Rate
Leaf color was measured with a chlorophyll meter (SPAD) and expressed as a SPAD value. Net photosynthetic rate was measured between 8:00 and 12:00 using a portable open-flow gas-exchange system (LI-Core 6400). Light intensities were 0, 500, 1000, 1500, and 2000 (PPFD) μmol m−2 s−1; leaf temperature was 25–30 °C; the leaf–air vapor pressure difference was approximately 1.5 kPa; and the ambient CO2 concentration was 400 μmol−1 during measurements.
2.4. Crude Protein, ADF, and NDF in Plant Tissues
Plants were oven-dried at 80 °C and powdered into fine powder. The percentage of CP was determined by using Kjeldahl equipment following the methods of the Association of Official Analytical Chemists (AOAC) [27]. Neutral detergent fiber (NDF) and acid detergent fiber (ADF) were analyzed following the Van Soest methodology [28].
2.5. Statistical Analysis
All the statistical analyses were performed using the Statistical Analysis Software (version 9.4) (SAS) package developed by SAS Institute Inc. in 2014 [29]. All parameters were visualized by a heat map function. The heat map was built by using the Display R program package, and both rows and columns were grouped [30]. Data analysis included three-way ANOVA (species and treatments, measurement period), and Duncan’s test was used to estimate the least significant range between means (p < 0.01). All measurements represent the means and standard errors (SE).
3. Results
3.1. Growth and Biomass
A variety of growth parameters (plant height, biomass, and specific leaf area) and SPAD values were calculated to determine the effect of various salinity levels on the growth of mono-cropping T. pratense, F. arundinacea, and M. sativa. Three-way ANOVA indicated a significant difference in biomass (above-ground, root), SLA between species, treatments, measurement period, species x measurement period, species × treatments, and measurement period × treatments. Overall, no significant difference was found in any parameter for the root length and shoot height (Table 1).
Figure 1 shows the variation of the plant height (shoot, root length) of mono-cropping during the experiment periods. The results show that T. pratense shoot heights were decreased under salinity stress, and the highest value was found in the control, but M. sativa showed slightly increased shoot heights under 25 mM and 50 mM NaCl treatments compared to the control throughout the experiment period and F. arundinacea showed decreased shoot height at 60 DAT, but with long-term salinity exposure, shoot height eventually increased compared to the control (Figure 1A,B). However, the high salinity concentration increased the root lengths of T. pratense, and other species showed decreased length under salinity at 60 DAT; however, in long-term treatments, all of the species showed decreased length under the control, and the highest values were found in the moderate (50 mM) salinity treatment (Figure 1C,D).
For the mixed cropping experiment under salinity plus magnesium and calcium sulfate, shoot height of mixed F. arundinacea were higher in the control and 2 MgSO4 + NaCl treatment, and mixed T. pratense showed a higher height in the 10 CaSO4 + NaCl treatment. The lowest height was found only in the salinity treatments at the first measurement, and the growth of T. pratense slightly increased at the second measurement (Figure 2A,B). The root length of mixed F. arundinacea showed the highest length in the 100 mM NaCl treatment and highest length of T. pratense was found in the 10 CaSO4 + NaCl treatment at 60 DAT. In the long term, magnesium and calcium sulfate increased the root length of both species (Figure 2C,D).
Figure 3 shows the above-ground and root biomass of salinity stress of mono-cropping, wherein T. pratense had the highest above-ground biomass compared with the other species, T. pratense had the highest above-ground biomass throughout the experiment, and M. sativa had the higher biomass under high salinity treatments, but F. arundinacea showed higher above-ground biomass in the control and low-salinity treatments (Figure 3A,B). The root biomass of M. sativa was the lowest compared to other species, and the 25 mM NaCl treatment had the highest root biomass of F. arundinacea and M. sativa, with the root biomass of T. pratense being increased in the long term (Figure 3C,D).
The biomass of mixed cropping is shown in Figure 4. The above-ground biomass of F. arundinacea was found to be the highest in the 2 MgSO4 + NaCl treatment throughout the experiment period, and the above-ground biomass of T. pratense was the highest in the control at 60 DAT (Figure 4A). Moreover, T. pratense was found to have the highest biomass in the CON at 120 DAT (Figure 4B). The root biomass of F. arundinacea was higher than T. pratense, and higher values were found in the 100 mM NaCl treatment at 60 DAT, and in the long term, the root biomass of T. pratense was the highest in the CON and 10 CaSO4 + NaCl for F. arundinacea (Figure 4C,D).
3.2. SPAD, Specific Leaf Area (SLA), and Photosynthesis
Figure 5 shows the SPAD values of mono-cropping under salinity treatments. M. sativa and F. arundinacea’s SPAD values were increased in the high-salinity treatment compared to the control, and the values of T. pratense were decreased when the salinity concentration increased in the short term (Figure 5A). However, in the long term, the SPAD values of M. sativa and T. pratense were decreased under higher salinity concentration, and F. arundinacea was similar with the short-term results (Figure 5B).
The SPAD value of the mixed cropping of T. pratense and F. arundinacea are shown in Figure 6. The SPAD value of T. pratense was higher than F. arundinacea, and the highest values were found in the control at 60 DAT. However, the SPAD value of F. arundinacea was found to be the highest in the 10 CaSO4 + NaCl treatment, and the T. pratense value was decreased in 2 MgSO4 + NaCl, with the highest found in the control at 120 DAT (Figure 6A,B).
The SLA of T. pratense was decreased in the long-term salinity application, and the values of M. sativa and F. arundinacea were slightly increased when the salinity concentration increased at 60 DAT and decreased when the salinity concentration increased at 120 DAT (Figure 7A,B).
The SLA of the mixed cropping of F. arundinacea and T. pratense are shown in Figure 8. The SLA of T. pratense was found to be higher than F. arundinacea, and the 100 mM NaCl treatment increased the value of F. arundinacea at 60 DAT, with the value of T. pratense increased under salinity at 120 DAT.
The photosynthetic rate of mono-cropping under different salinity concentrations is presented in Figure 9, showing that photosynthesis rate increased when the PAR levels increased for all species and treatments. The photosynthesis rate of T. pratense was lower with exposure to long-term salinity, and the control treatment had the highest rate compared to other treatments. Conversely, the rate of M. sativa was increased in the salinity treatments at 60 DAT but in the long term, the photosynthesis rate was also decreased. With regards to F. arundinacea, photosynthesis rates were comparable among treatments and relatively high in the control at 60 DAT. However, in the long term, the figures were observed to be higher under high-salinity concentration, while the control was in the middle.
Furthermore, the photosynthesis rate of intercropped F. arundinacea and T. pratense are shown in Figure 10. Both species experienced a lower rate over the long-term salinity exposure; F. arundinacea demonstrated higher rates under salinity plus magnesium and calcium sulfate treatments, and NaCl treatment lowered the rate of photosynthesis. With T. pratense, values were similar among treatments, apart from NaCl at 60 DAT, but the control and NaCl treatments presented higher values in the long term.
3.3. Elemental Analysis and Crop Quality
To demonstrate the effect of treatments on element distribution, we analyzed the concentrations of the ions of Na+, P, K+, Ca2+, and Mg2+ in the stem, leaf, and root of mono-cropping of T. pratense, F. arundinacea, and M. sativa and mixed cropping of F. arundinacea and T. pratense. The sodium contents were increased when the salinity concentration increased, and the highest content was found in roots of all mono-cropping. Comparing between species, F. arundinacea had the highest content of Na+. The Ca2+ contents were found to be slightly different between species, and the highest value was found in 50 mM NaCl of T. pratense, with salinity stress slightly increasing the Ca content of all species except F. arundinacea. For the contents of K+ and P, salinity stress slightly decreased the K+ content in the leaf and P contents of the stems, leaves, and roots of all species. Moreover, Mg2+ contents were decreased when low and medium salinity were applied, but high salt concentration increased the content of Mg2+ of all species in all parts of the plant at 60 DAT. For the mixed cropping, Na+ contents were higher in all of the treatments than the control, and Ca content also increased when the salinity and MgSO4 and CaSO4 treatments were applied, except in roots. The K+ contents were higher in the control than the other treatments, and the lowest content was found in 2 MgSO4 + NaCl. The highest Mg2+ content was found in the control, and the lowest content was found in the root of the 2 MgSO4 + NaCl treatment. The salinity treatment decreased the P content, but 2 MgSO4 + NaCl and 10 CaSO4 + NaCl increased the content of P at 60 DAT. In the long term, the contents of mono-cropping’s ion were increased when compared with the short-term salinity stress, and Na+ contents were increased when salinity concentration increased, and the lowest Na+ content was found in M. sativa. The salinity treatment slightly increased the Ca2+ content of T. pratense but decreased M. sativa’s Ca2+ concentration. Further, the salinity treatments increased the K+ contents of T. pratense, and the other two species showed no difference between treatments, with Mg2+ showing similar results between treatments of all species. The P contents were significantly higher than the first measurements, and salinity increased the P content of M. sativa and decreased the P content of F. arundinacea and T. pratense. For the mixed cropping, Na+ contents were similar with mono-cropping; Ca2+ contents were increased when applied CaSO4, salinity and Mg2+ treatments; and application of CaSO4 increased the P contents at 120 DAT (Figure 6, Table S1). Table 2 shows the CP, ADF, and NDF of the mono-cropping of T. pratense, M. sativa, and F. arundinacea under various salinities, as well as the mixed cropping of T. pratense and F. arundinacea under magnesium and calcium sulfate treatments at 60 DAT and 120 DAT. The CP of mono T. pratense and F. arundinacea were increased when the salinity concentration increased, but M. sativa showed no difference between treatments at 60 DAT. For the long-term (120 DAT) salinity treatments, CP showed no difference between treatments, but M. sativa showed decreased values under high salinity. The NDF of all species showed a slight increase, and ADF contents were decreased in the short term (60 DAT), but in the long term (120 DAT), NDF values were increased when salinity concentration increased, and ADF did not show a difference between treatments. For the mixed cropping, samples from two species were mixed for analysis, and CON had the highest CP content and sole salinity had the lowest CP content when compared to the other treatments at 60 DAT, but at 120 DAT, CP was decreased under magnesium and calcium sulfate treatments. In the case of NDF and ADF, magnesium and calcium sulfate treatments increased the NDF contents throughout the experiment period, and ADF content did not show a significant difference between treatments.
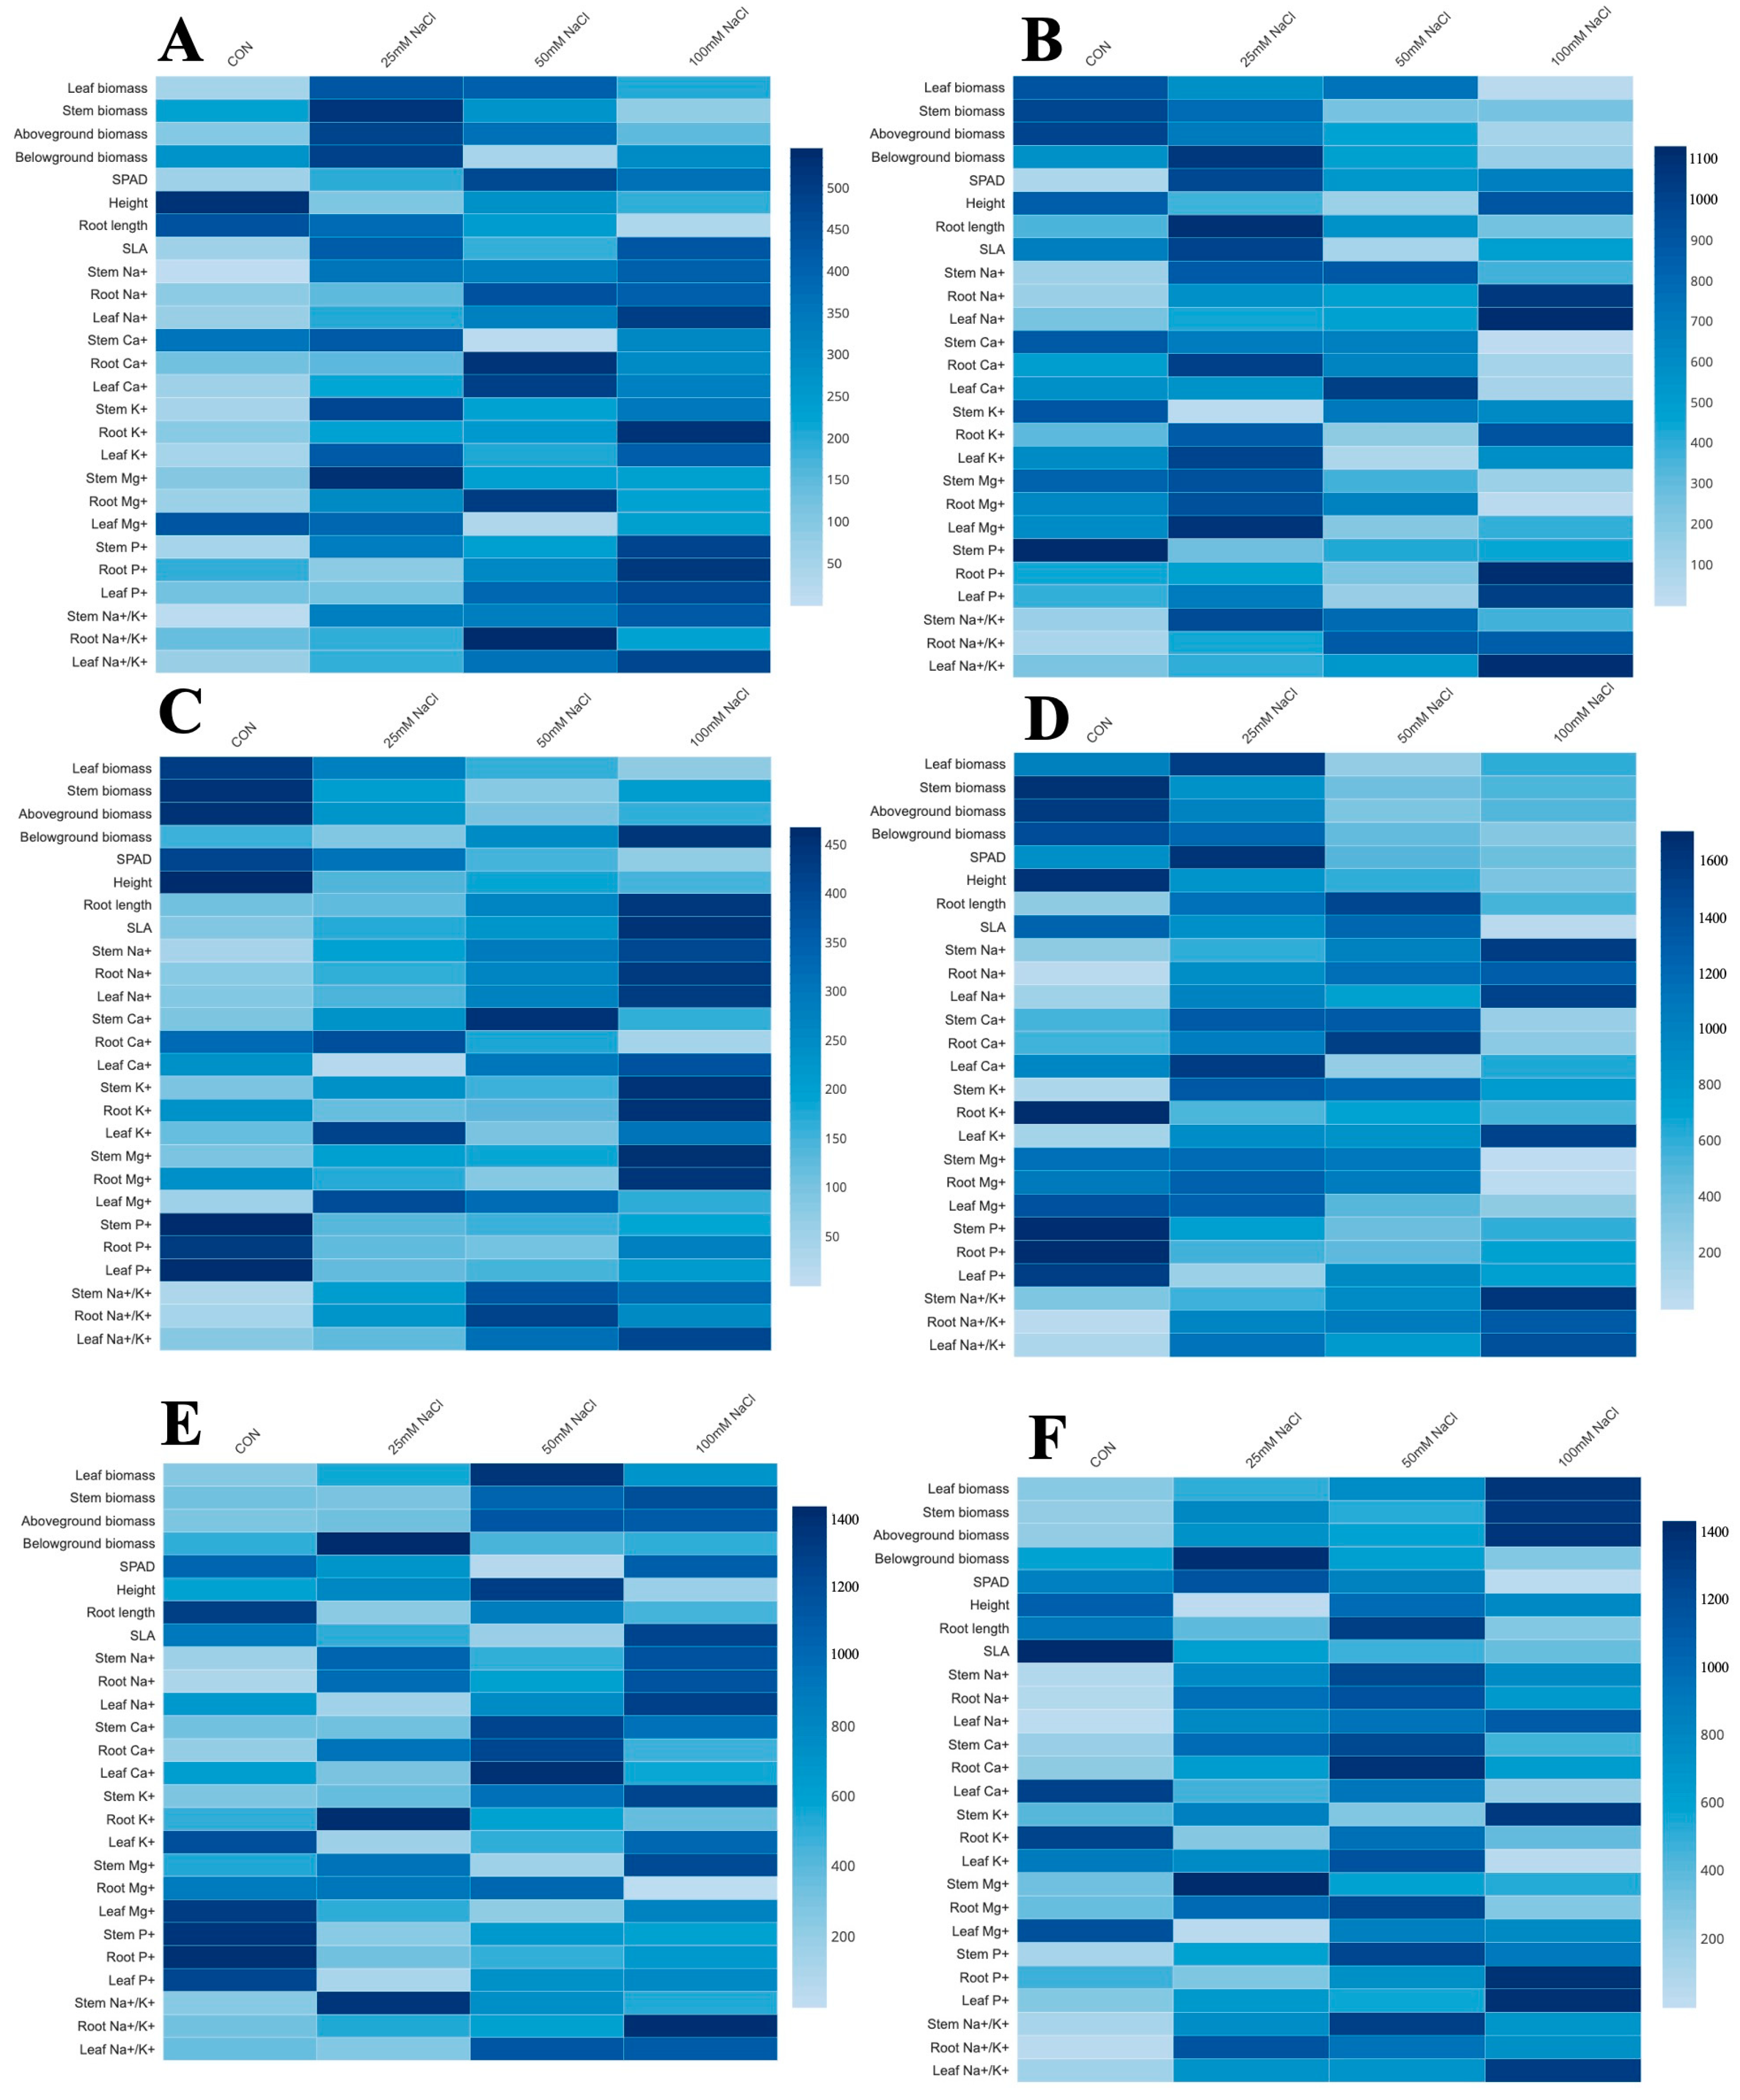
In order to assess the effects of treatments on mono-cropping of T. pratense, F. arundinacea, and M. sativa, a heat map was constructed using both morphological and macronutrient variables to identify the key parameters. As shown in Figure 11, the hierarchical (row) clustering was carried out using the data collected from all three species, grown under three different salinity treatments or as the CON, regarding their morphological and macronutrient features. The heat map effectively demonstrates the varying morphological responses to salinity stress and the CON (Figure 11).
4. Discussion
Salt stress is a major environmental factor that leads to seed dormancy and impedes the normal growth of plants as well as their output [31]. If a plant is exposed to a high amount of salt, the soil solution becomes more concentrated, and salinity can cause oxidative and osmotic stress, turgescence, and ion toxicity; interfere with plant metabolism; disorganize cell membranes; generate an overabundance of reactive oxygen species (ROS) causing oxidative damage to cells and their metabolic processes; and ultimately reduce crop yield [32].
The finding of this study indicates that salinity stress decreased the crop growth and biomass of all species except M. sativa in mono-cropping (Figure 3), which indicates that this species is moderately salt tolerant. According to [33], M. sativa has shown root growth and leaf yellowing under 150 mM NaCl salinity treatment, but most glycophytes respond to a relatively low salt concentration of roughly 100 mM. Our study revealed that T. pratense showed higher biomass than M. sativa, and this could be explained by humidity and high moisture in the soil, which is the opposite of the optimal conditions of M. sativa [34]. Moreover, salinity stress had less of an effect on mixed cropping, wherein the biomass of the above-ground area and roots of T. pratense and F. arundinacea were higher under salinity than under mono-cropping (Figure 4). Intercropping is a representation of sustainable agriculture, being is aimed at achieving objectives such as ecological balance, resource efficiency, and higher yield quality and quantity [35]. Moreover, intercropping with legumes has a greater advantage over mono-cropping under a saline environment [36]. The ratio of biomass allocated to belowground and above-ground components at a given moment has an impact on the subsequent acquisition of water, minerals, and light, while the division of biomass to vegetative and reproductive components influences seed yield and quality [37]. Our results are consistent with previous observations that the results of multivariate analysis showed that raising the NaCl concentration evidently decreased the fresh and dry mass of roots and shoots of T. fragiferum in mono-cropping, and according to [38], intercropping enhances the ability of sorghum and kochia to cope with saline soil conditions, thus providing important nutritional requirements for livestock and enhancing soil fertility. Moreover, moderate salinity increased the root length of mono-cropping in the long term, and shoot height was decreased in T. pratense and M. sativa, but in the long term, shoot heights of F. arundinacea were not affected by salinity stress. In addition, the shoot height of mixed cropping was higher than mono-cropping in both species, and magnesium sulfate on F. arundinacea and calcium sulfate on T. pratense enhanced the shoot height and root length compared to the control. In the long term, salinity treatment showed similar results to the control. According to Wang et al. in 2022 [39], utilization of mixed cropping and crop rotations significantly increased plant growth, and the interspecific interactions provided certain crops with competitive advantages for nutrients and superior yield levels. The papers collectively suggest that salinity can have varying effects on root length. According to [40], in P. maritima, total lateralmroot length increased at low NaCl concentrations (50 and 100 mM), but it was reduced at a higher concentration (200 mM), and Arif et al. in 2019 [41] found that salinity stress increased root hair traits, such as length and density. Finally, Shalhevet et al. in 1995 [42] showed that changes in root length were more sensitive to salinity than changes in shoot height in soybean and maize. Moreover, the SPAD values of mono and mixed cropping were decreased under salinity. Comparing between mixed and mono-cropping under salinity, both T. pratense and F. arundinacea showed decreased values, but the application of 10 mM CaSO4 turned out to be efficient for both species (Figure 6). The SLA values of the mono-cropping of M. sativa and F. arundinacea were lower than T. pratense and for the mixed-cropping, salinity increased the SLA of both species in a long-term of salinity treatment. Photosynthesis is the most essential process that happens within the chloroplasts of higher plants. Salt stress can have both direct and indirect influences on the chlorophyll quantity and the photosynthetic efficiency of plants. Direct effects are accomplished by adjusting the activity and expression of enzymes that are involved in chlorophyll biosynthesis and photosynthesis. The indirect effects are attained through the action of specific regulatory pathways [43]. Our results agree with [44] that salinity stress decreases the photosynthesis rate of mono-cropping.
Crop quality is often indicated by crude protein (CP), acid detergent fiber (ADF), and neutral detergent fiber (NDF). Maturity of the plants is the fundamental determinant of the quality of the forage; however, the interplay between environmental and agronomic conditions with maturity can affect the quality of crops [45]. The current study revealed that a high percentage of salinity stress increased the CP of mono T. pratense and F. arundinacea, and a low level of salinity (25 mM NaCl) decreased the CP of all species in the short term; moreover, M. sativa showed decreased values in the long term and other species showed no difference between treatments. For the NDF content, it increased under salinity stress, and ADF did not show a significant difference between treatments under mono-cropping. Our finding agrees with [46] in that applying the correct amount of salinity to plants increases their nutritional quality. Moreover, salinity decreased the CP of mixed cropping, but calcium sulfate treatment increased the CP, and it was similar to the control at 60 DAT. However, in the long term, salinity increased the NDF content of mixed cropping, and calcium and magnesium sulfate plus salinity was similar but higher than the control (Table 2). Intercropping can improve the sustainability of forage production, reducing the need for protein feed and the hazard of N pollution [47]. Intermixing forage legumes, such as red clover, with perennial cereals has the potential to augment the effectiveness of the total cropping system in the areas of soil regeneration, soil and water conservation, nutrient cycling, forage production, and pest suppression [48]. Furthermore, salinity increased the content of Na+ and decreased the K+ contents in the short term, and our results are consistent with another research [49]. The presence of excessive salt in the soil results in a low water potential zone, making it harder for plant roots to access vital water and nutrients [50]. Moreover, salinity increased the Ca2+ of mono- and mixed cropping. According to [51], within a matter of seconds after exposure to NaCl, plants demonstrate a sudden surge in their cytosolic calcium levels. In a long-term salinity application, content of P was significantly increased in all species, and salinity treatments increased the P content of M. sativa and decreased the other species in mono-cropping. Phosphorus (P) is a necessary macronutrient for plant growth and is vital for agricultural production, with some studies finding similar results that salinity decreased the P uptake in plants [52]. P deficiency is a significant environmental pressure that hinders the growth of plants and reduces crop yield [53].
Moreover, in the presence of high salinity levels, mixed cropping proves to be more beneficial than mono-cropping as it leads to improved forage indices in terms of both quantity and quality, particularly when combined with legumes.
5. Conclusions
This study aimed to evaluate the impact of different concentrations of salinity treatments on the morpho-physiological characteristics of mono-cropping of T. pratense, F. arundinacea, and M. sativa and MgSO4 and CaSO4 on the mixed cropping of T. pratense and F. arundinacea under saline conditions. Despite the known of adaptability of these species to various environmental conditions, our findings demonstrated that their morpho-physiological traits were significantly influenced by the applied salinity and Ca+ and Mg2+ sulfate treatments, be it mono- or mixed cropping. The extent of these effects varied depending on the species and growing types. Generally, the growth of F. arundinacea growing in mono-cropping was decreased under high salinity, but the effect of mixed cropping increased the growth, with M. sativa being relatively less affected by high salinity. This work shows that M. sativa has moderate salt tolerance, and that F. arundinacea and T. pratense could be adapted under saline condition as mixed cropping, with additional MgSO4 and CaSO4 application improving the growth of these forage crops.
Supplementary Materials
The following supporting information can be downloaded at https://www.mdpi.com/article/10.3390/agronomy14020287/s1, Table S1: Ion concentrations (g/kg) in the stems, roots, and leaves of mono F. arundinacea, T. pratense, and M. sativa and mixed cropping under various salinity Mg, and Ca sulfate treatments at 60 DAT and 120 DAT.
Author Contributions
Conceptualization, J.-W.C. and K.S.; methodology, K.S.; software and data analysis, K.S. and S.-O.B.; data collection, K.S., Y.J., Y.A., and S.-O.B.; writing—original draft preparation, K.S. and S.-O.B.; writing—review and editing, K.S. and J.-W.C.; supervision, J.-W.C.; funding acquisition, J.-W.C. All authors have read and agreed to the published version of the manuscript.
Funding
This work was financially supported by research fund of National Research Foundation of Republic of Korea (no. 2021R1F1A1052323) in 2021.
Data Availability Statement
The data used are primarily reflected in the article. Other relevant data are available from authors upon request.
Conflicts of Interest
The authors declare no conflicts of interest.
References
- FAO World Livestock: Transforming the Livestock Sector through the Sustainable Development Goals; FAO: Rome, Italy, 2018.
- Duan, C.; Shi, P.; Zong, N.; Wang, J.; Song, M.; Zhang, X. Feeding Solution: Crop-Livestock Integration via Crop-Forage Rotation in the Southern Tibetan Plateau. Agric. Ecosyst. Environ. 2019, 284, 106589. [Google Scholar] [CrossRef]
- Yang, Y.; Zhang, H.; Liu, W.; Sun, J.; Zhao, M.; Han, G.; Pan, Q. Effects of Grazing Intensity on Diversity and Composition of Rhizosphere and Non-Rhizosphere Microbial Communities in a Desert Grassland. Ecol. Evol. 2023, 13, e10300. [Google Scholar] [CrossRef]
- Lee, J.M.; Clark, D.A.; Clark, C.E.F.; Waugh, C.D.; Roach, C.G.; Minneé, E.M.K.; Glassey, C.B.; Woodward, S.L.; Woodfield, D.R.; Chapman, D.F. A Comparison of Perennial Ryegrass- and Tall Fescue-Based Swards with or without a Cropping Component for Dairy Production: Animal Production, Herbage Characteristics and Financial Performance from a 3-Year Farmlet Trial. Grass Forage Sci. 2018, 73, 340–354. [Google Scholar] [CrossRef]
- Bengtsson, J.; Bullock, J.M.; Egoh, B.; Everson, C.; Everson, T.; O’Connor, T.; O’Farrell, P.J.; Smith, H.G.; Lindborg, R. Grasslands—More Important for Ecosystem Services than You Might Think. Ecosphere 2019, 10, e02582. [Google Scholar] [CrossRef]
- Atta, K.; Mondal, S.; Gorai, S.; Singh, A.P.; Kumari, A.; Ghosh, T.; Roy, A.; Hembram, S.; Gaikwad, D.J.; Mondal, S.; et al. Impacts of Salinity Stress on Crop Plants: Improving Salt Tolerance through Genetic and Molecular Dissection. Front. Plant Sci. 2023, 14, 1241736. [Google Scholar] [CrossRef]
- Acosta-Motos, J.R.; Ortuño, M.F.; Bernal-Vicente, A.; Diaz-Vivancos, P.; Sanchez-Blanco, M.J.; Hernandez, J.A. Plant Responses to Salt Stress: Adaptive Mechanisms. Agronomy 2017, 7, 18. [Google Scholar] [CrossRef]
- Junedi, M.A.; Mukhopadhyay, R.; Manjari, K.S. Alleviating Salinity Stress in Crop Plants Using New Engineered Nanoparticles (ENPs). Plant Stress 2023, 9, 100184. [Google Scholar] [CrossRef]
- Arshad, M.; Gruber, M.Y.; Wall, K.; Hannoufa, A. An Insight into MicroRNA156 Role in Salinity Stress Responses of Alfalfa. Front. Plant Sci. 2017, 8, 356. [Google Scholar] [CrossRef] [PubMed]
- Qiu, Y.; Wang, Y.; Fan, Y.; Hao, X.; Li, S.; Kang, S. Root, Yield, and Quality of Alfalfa Affected by Soil Salinity in Northwest China. Agriculture 2023, 13, 750. [Google Scholar] [CrossRef]
- Chakrabarti, M.; Nagabhyru, P.; Schardl, C.L.; Dinkins, R.D. Differential Gene Expression in Tall Fescue Tissues in Response to Water Deficit. Plant Genome 2022, 15, e20199. [Google Scholar] [CrossRef] [PubMed]
- Fan, S.; Amombo, E.; Yin, Y.; Wang, G.; Avoga, S.; Wu, N.; Li, Y. Root System Architecture and Genomic Plasticity to Salinity Provide Insights into Salt-Tolerant Traits in Tall Fescue. Ecotoxicol. Environ. Saf. 2023, 262, 115315. [Google Scholar] [CrossRef] [PubMed]
- Ergon, Å.; Bakken, A.K. Breeding for Intercropping: The Case of Red Clover Persistence in Grasslands. Euphytica 2022, 218, 98. [Google Scholar] [CrossRef]
- Sharavdorj, K.; Byambadorj, S.O.; Jang, Y.; Cho, J.W. Application of Magnesium and Calcium Sulfate on Growth and Physiology of Forage Crops under Long-Term Salinity Stress. Plants 2022, 11, 3576. [Google Scholar] [CrossRef] [PubMed]
- Hou, C.; Li, X.; Tian, D.; Xu, B.; Zhang, C.; Ren, J.; Chen, N. Evaluation of the Effects of Water and Salinity Stress on the Growth and Biochemistry of Alfalfa (Medicago sativa L.) at the Branching Stage. Sustainability 2022, 14, 10262. [Google Scholar] [CrossRef]
- Kumar, S.; Li, G.; Yang, J.; Huang, X.; Ji, Q.; Liu, Z.; Ke, W.; Hou, H. Effect of Salt Stress on Growth, Physiological Parameters, and Ionic Concentration of Water Dropwort (Oenanthe javanica) Cultivars. Front. Plant Sci. 2021, 12, 660409. [Google Scholar] [CrossRef] [PubMed]
- Fernandez, A.L.; Fabrizzi, K.P.; Tautges, N.E.; Lamb, J.A.; Sheaffer, C.C. Cutting Management and Alfalfa Stand Age Effects on Organically Grown Corn Grain Yield and Soil N Availability. Renew. Agric. Food Syst. 2019, 34, 144–154. [Google Scholar] [CrossRef]
- Hosseini-Nasr, F.; Etesami, H.; Alikhani, H.A. Silicon Improves Plant Growth-Promoting Effect of Nodule Non-Rhizobial Bacterium on Nitrogen Concentration of Alfalfa Under Salinity Stress. J. Soil Sci. Plant Nutr. 2023, 23, 496–513. [Google Scholar] [CrossRef]
- Ondrasek, G.; Rathod, S.; Manohara, K.K.; Gireesh, C.; Anantha, M.S.; Sakhare, A.S.; Parmar, B.; Yadav, B.K.; Bandumula, N.; Raihan, F.; et al. Salt Stress in Plants and Mitigation Approaches. Plants 2022, 11, 717. [Google Scholar] [CrossRef]
- Sharavdorj, K.; Jang, Y.; Byambadorj, S.O.; Cho, J.W. The Effect of MgSO4 and CaSO4 on Seedlings of Forage Crops under Environmental Stress. Plant Physiol. Rep. 2022, 27, 702–716. [Google Scholar] [CrossRef]
- Chamkhi, I.; Cheto, S.; Geistlinger, J.; Zeroual, Y.; Kouisni, L.; Bargaz, A.; Ghoulam, C. Legume-Based Intercropping Systems Promote Beneficial Rhizobacterial Community and Crop Yield under Stressing Conditions. Ind. Crops Prod. 2022, 183, 114958. [Google Scholar] [CrossRef]
- Dai, J.; Qiu, W.; Wang, N.; Wang, T.; Nakanishi, H.; Zuo, Y. From Leguminosae/Gramineae Intercropping Systems to See Benefits of Intercropping on Iron Nutrition. Front. Plant. Sci. 2019, 10, 605. [Google Scholar] [CrossRef]
- Gizachew Raji, S.; Dörsch, P. Effect of Legume Intercropping on N2O Emissions and CH4 Uptake during Maize Production in the Great Rift Valley, Ethiopia. Biogeosciences 2020, 17, 345–359. [Google Scholar] [CrossRef]
- Massawe, P.I.; Mtei, K.M.; Munishi, L.K.; Ndakidemi, P.A. Improving Soil Fertility and Crops Yield through Maize-Legumes (Common Bean and Dolichos Lablab) Intercropping Systems. J. Agric. Sci. 2016, 8, 148. [Google Scholar] [CrossRef]
- Tuna, A.L.; Kaya, C.; Ashraf, M.; Altunlu, H.; Yokas, I.; Yagmur, B. The Effects of Calcium Sulphate on Growth, Membrane Stability and Nutrient Uptake of Tomato Plants Grown under Salt Stress. Environ. Exp. Bot. 2007, 59, 173–178. [Google Scholar] [CrossRef]
- Garnier, E.; Shipley, B.; Roumet, C.; Laurent, G. A Standardized Protocol for the Determination of Specific Leaf Area and Leaf Dry Matter Content. Funct. Ecol. 2001, 15, 688–695. [Google Scholar] [CrossRef]
- Pereira, S.; Singh, S.; Oliveira, R.S.; Ferreira, L.; Rosa, E.; Marques, G. Co-Inoculation with Rhizobia and Mycorrhizal Fungi Increases Yield and Crude Protein Content of Cowpea (Vigna unguiculata (L.) Walp.) under Drought Stress. Landbauforschung 2020, 70, 56–65. [Google Scholar] [CrossRef]
- Van Soest, P.J.; Robertson, J.B.; Lewis, B.A. Methods for Dietary Fiber, Neutral Detergent Fiber, and Nonstarch Polysaccharides in Relation to Animal Nutrition. J. Dairy Sci. 1991, 74, 3583–3597. [Google Scholar] [CrossRef]
- SAS Institute Inc. SAS Software; 9.4; SAS Institute Inc.: Cary, NC, USA, 2014; pp. 1–25. [Google Scholar]
- R Core Team. R: A Language and Environment for Statistical Computing; R Core Team: Vienna, Austria, 2021. [Google Scholar]
- Ahmad, I.; Zhu, G.; Zhou, G.; Younas, M.U.; Suliman, M.S.E.; Liu, J.; Zhu, Y.; Salih, E.G.I. Integrated Approaches for Increasing Plant Yield under Salt Stress. Front. Plant Sci. 2023, 14, 1215343. [Google Scholar] [CrossRef]
- Verma, T.; Bhardwaj, S.; Singh, J.; Kapoor, D.; Prasad, R. Triacontanol as a Versatile Plant Growth Regulator in Overcoming Negative Effects of Salt Stress. J. Agric. Food Res. 2022, 10, 100351. [Google Scholar] [CrossRef]
- Hassan, M.U.; Kareem, H.A.; Hussain, S.; Guo, Z.; Niu, J.; Roy, M.; Saleem, S.; Wang, Q. Enhanced Salinity Tolerance in Alfalfa through Foliar Nano-Zinc Oxide Application: Mechanistic Insights and Potential Agricultural Applications. Rhizosphere 2023, 28, 100792. [Google Scholar] [CrossRef]
- Buscaglia, H.J.; Van Es, H.M.; Geohring, L.D.; Vermeulen, H.C.A.M.; Fick, G.W.; Lucey, R.E. Agroclimatology Alfalfa Yield and Quality Are Affected by Soil Hydrologic Conditions. Agron. J. 1994, 86, 535–542. [Google Scholar] [CrossRef]
- Ghaffarian, M.R.; Yadavi, A.; Movahhedi Dehnavi, M.; Dabbagh Mohammadi Nassab, A.; Salehi, M. Improvement of Physiological Indices and Biological Yield by Intercropping of Kochia (Kochia scoparia), Sesbania (Sesbania aculeata) and Guar (Cyamopsis tetragonoliba) under the Salinity Stress of Irrigation Water. Physiol. Mol. Biol. Plants 2020, 26, 1319–1330. [Google Scholar] [CrossRef]
- Panta, S.; Flowers, T.; Doyle, R.; Lane, P.; Haros, G.; Shabala, S. Temporal Changes in Soil Properties and Physiological Characteristics of Atriplex Species and Medicago Arborea Grown in Different Soil Types under Saline Irrigation. Plant Soil 2018, 432, 315–331. [Google Scholar] [CrossRef]
- Tang, L.; Zhou, Q.S.; Gao, Y.; Li, P. Biomass Allocation in Response to Salinity and Competition in Native and Invasive Species. Ecosphere 2022, 13, e3900. [Google Scholar] [CrossRef]
- Hedayati-Firoozabadi, A.; Kazemeini, S.A.; Pirasteh-Anosheh, H.; Ghadiri, H.; Pessarakli, M. Forage Yield and Quality as Affected by Salt Stress in Different Ratios of Sorghum Bicolor-Bassia Indica Intercropping. J. Plant Nutr. 2020, 43, 2579–2589. [Google Scholar] [CrossRef]
- Wang, S.; Zhao, Z.; Ge, S.; Zhang, K.; Tian, C.; Mai, W. The Effects of Suaeda Salsa/Zea mays L. Intercropping on Plant Growth and Soil Chemical Characteristics in Saline Soil. Agriculture 2022, 12, 107. [Google Scholar] [CrossRef]
- Rubinigg, M.; Wenisch, J.; Elzenga, J.T.M.; Stulen, I. NaCl Salinity Affects Lateral Root Development in Plantago Maritima. Funct. Plant Biol. 2004, 31, 775–780. [Google Scholar] [CrossRef] [PubMed]
- Arif, M.R.; Islam, M.T.; Robin, A.H.K. Salinity Stress Alters Root Morphology and Root Hair Traits in Brassica napus. Plants 2019, 8, 192. [Google Scholar] [CrossRef]
- Shalhevet, J.; Huck, M.G.; Schroeder, B.P.; Huck, G.; Schroeder, B. Root and Shoot Growth Responses to Salinity in Maize and Soybean. Agron. J. 1995, 87, 512–516. [Google Scholar] [CrossRef]
- Yang, Z.; Li, J.L.; Liu, L.N.; Xie, Q.; Sui, N. Photosynthetic Regulation Under Salt Stress and Salt-Tolerance Mechanism of Sweet Sorghum. Front. Plant Sci 2020, 10, 1722. [Google Scholar] [CrossRef]
- Hnilickova, H.; Kraus, K.; Vachova, P.; Hnilicka, F. Salinity Stress Affects Photosynthesis, Malondialdehyde Formation, and Proline Content in Portulaca oleracea L. Plants 2021, 10, 845. [Google Scholar] [CrossRef]
- Ferrari, F.N.; Parera, C.A. Germination of Six Native Perennial Grasses That Can Be Used as Potential Soil Cover Crops in Drip-Irrigated Vineyards in Semiarid Environs of Argentina. J. Arid. Environ. 2015, 113, 1–5. [Google Scholar] [CrossRef]
- Lu, Q.; Ge, G.T.; Sa, D.W.; Wang, Z.J.; Hou, M.L.; Jia, Y.S. Effects of Salt Stress Levels on Nutritional Quality and Microorganisms of Alfalfa-Influenced Soil. PeerJ 2021, 9, e11729. [Google Scholar] [CrossRef] [PubMed]
- Stoltz, E.; Nadeau, E. Effects of Intercropping on Yield, Weed Incidence, Forage Quality and Soil Residual N in Organically Grown Forage Maize (Zea mays L.) and Faba Bean (Vicia faba L.). Field Crops Res. 2014, 169, 21–29. [Google Scholar] [CrossRef]
- Law, E.P.; Wayman, S.; Pelzer, C.J.; DiTommaso, A.; Ryan, M.R. Intercropping Red Clover with Intermediate Wheatgrass Suppresses Weeds without Reducing Grain Yield. Agron. J. 2022, 114, 700–716. [Google Scholar] [CrossRef]
- Poustini, K.; Esmaeili, A.; Abbasi, A.; Sadeghpour, A. Ion Concentration and Energy Response of Two Wheat Cultivars to Salt Stress. J. Plant Nutr. 2020, 43, 1447–1457. [Google Scholar] [CrossRef]
- Manishankar, P.; Wang, N.; Köster, P.; Alatar, A.A.; Kudla, J. Calcium Signaling during Salt Stress and in the Regulation of Ion Homeostasis. J. Exp. Bot. 2018, 69, 4215–4226. [Google Scholar] [CrossRef] [PubMed]
- Knight, H.; Trewavas, A.J.; Knight, M.R. Calcium Signalling in Arabidopsis Thaliana Responding to Drought and Salinity. Plant J. 1997, 12, 1067–1078. [Google Scholar] [CrossRef]
- Su, R.; Zhang, Z.; Chang, C.; Peng, Q.; Cheng, X.; Pang, J.; He, H.; Lambers, H. Interactive Effects of Phosphorus Fertilization and Salinity on Plant Growth, Phosphorus and Sodium Status, and Tartrate Exudation by Roots of Two Alfalfa Cultivars. Ann. Bot. 2022, 129, 53–64. [Google Scholar] [CrossRef]
- Xu, H.X.; Weng, X.Y.; Yang, Y. Effect of Phosphorus Deficiency on the Photosynthetic Characteristics of Rice Plants. Russ. J. Plant Physiol. 2007, 54, 741–748. [Google Scholar] [CrossRef]
Figure 1.
Evaluation of mono T. pratense, F. arundinacea, and M. sativa by analyzing shoot height and root length under four different treatments. Plants were treated either as the CON or with 25 mM NaCl, 50 mM NaCl, or 100 mM NaCl solution within calculated 60 DAT and 120 DAT. (A) Shoot height at 60 DAT. (B) Shoot height at 120 DAT. (C) Root length at 60 DAT. (D) Root length at 120 DAT. Vertical bars represent standard errors (n = 4). Different lowercase letters indicate significant differences among the treatments at α = 0.05.

Figure 2.
Evaluation of mixed T. pratense and F. arundinacea by analyzing shoot height and root length under four different treatments. Plants were treated 100 mM NaCl solution, 2 MgSO4 + 100 mM NaCl, or 10 CaSO4 + 100 mM NaCl within calculated 60 DAT and 120 DAT. (A) Shoot height at 60 DAT. (B) Shoot height at 120 DAT. (C) Root length at 60 DAT. (D) Root length at 120 DAT. Vertical bars represent standard errors (n = 4). Different lowercase letters indicate significant differences among the treatments at α = 0.05.
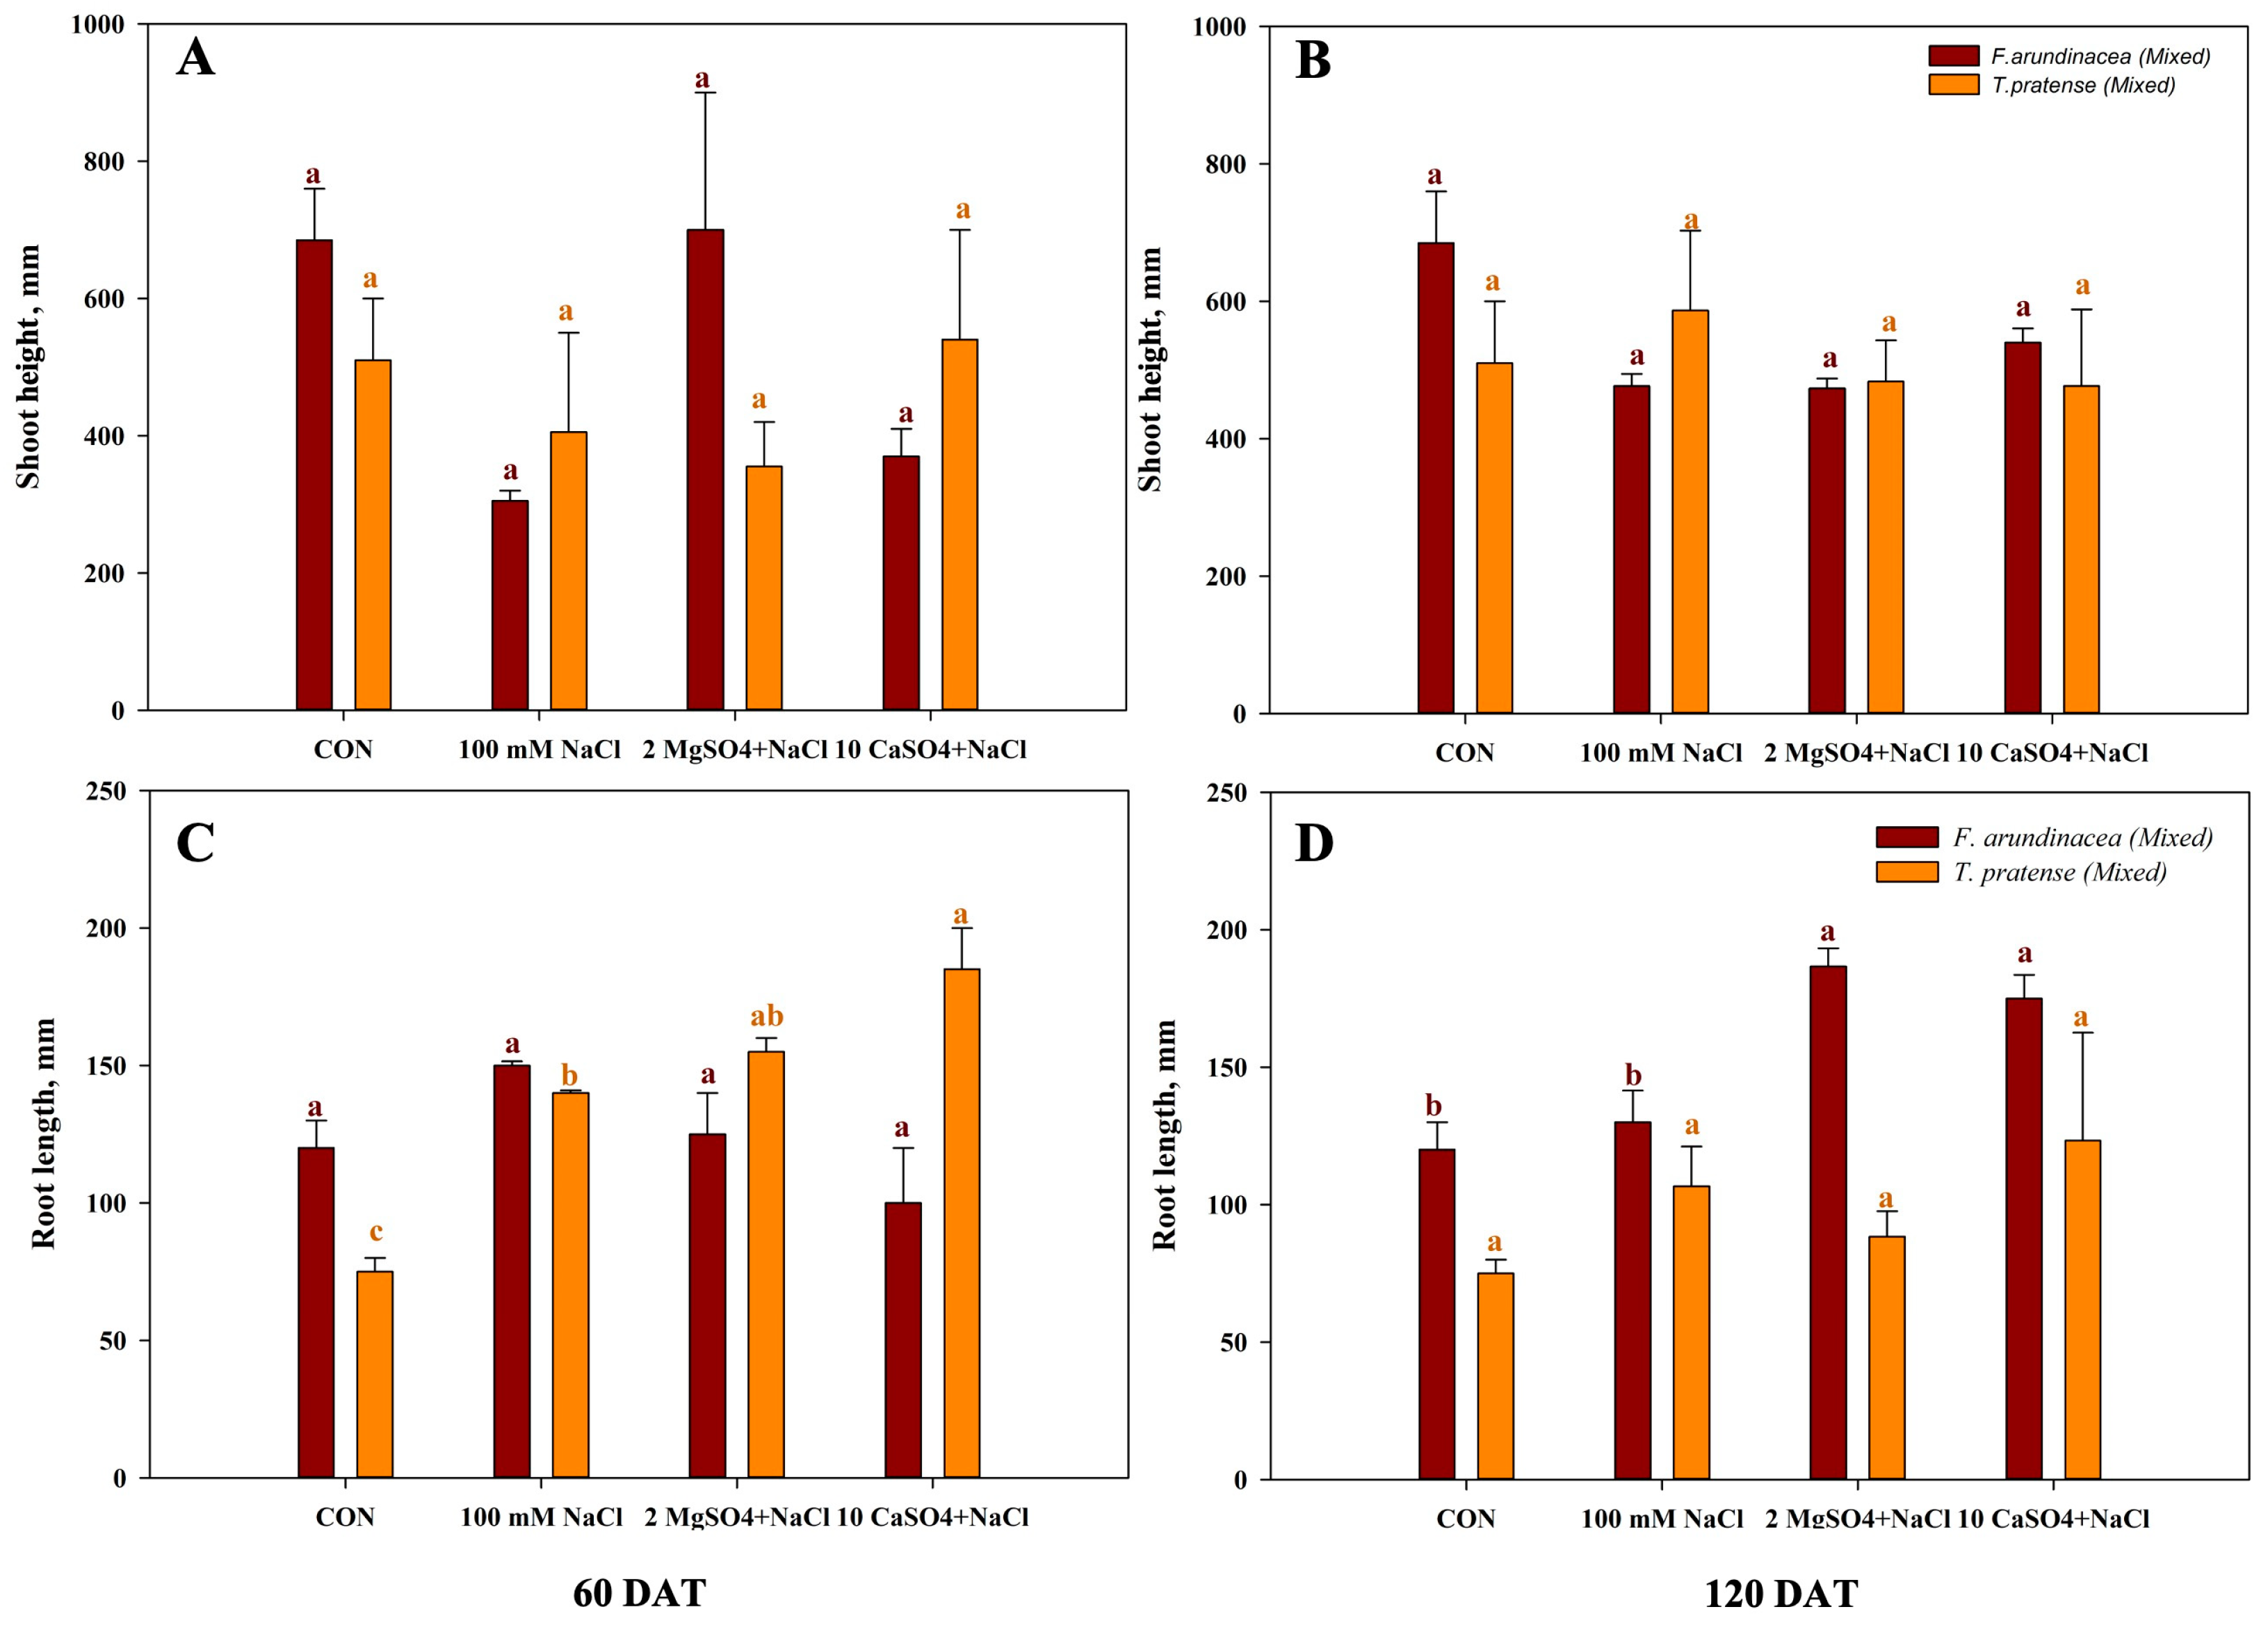
Figure 3.
Evaluation of mono T. pratense, F. arundinacea, and M. sativa by analyzing above-ground biomass and root biomass under four different treatments. Plants were treated as the CON or with 25 mM NaCl, 50 mM NaCl, or 100 mM NaCl solution within the calculated 60 DAT and 120 DAT. (A) Above-ground biomass at 60 DAT. (B) Above-ground biomass at 120 DAT. (C) Root biomass at 60 DAT. (D) Root biomass at 120 DAT. Vertical bars represent standard errors (n = 4). Different lowercase letters indicate significant differences among the treatments at α = 0.05.

Figure 4.
Evaluation of mixed T. pratense and F. arundinacea by analyzing above-ground biomass and root biomass under four different treatments. Plants were treated with 100 mM NaCl solution, 2 MgSO4 + 100 mM NaCl, or 10 CaSO4 + 100 mM NaCl within the calculated 60 DAT and 120 DAT. (A) Above-ground biomass at 60 DAT. (B) Above-ground biomass at 120 DAT. (C) Root biomass at 60 DAT. (D) Root biomass at 120 DAT. Vertical bars represent standard errors (n = 4). Different lowercase letters indicate significant differences among the treatments at α = 0.05.
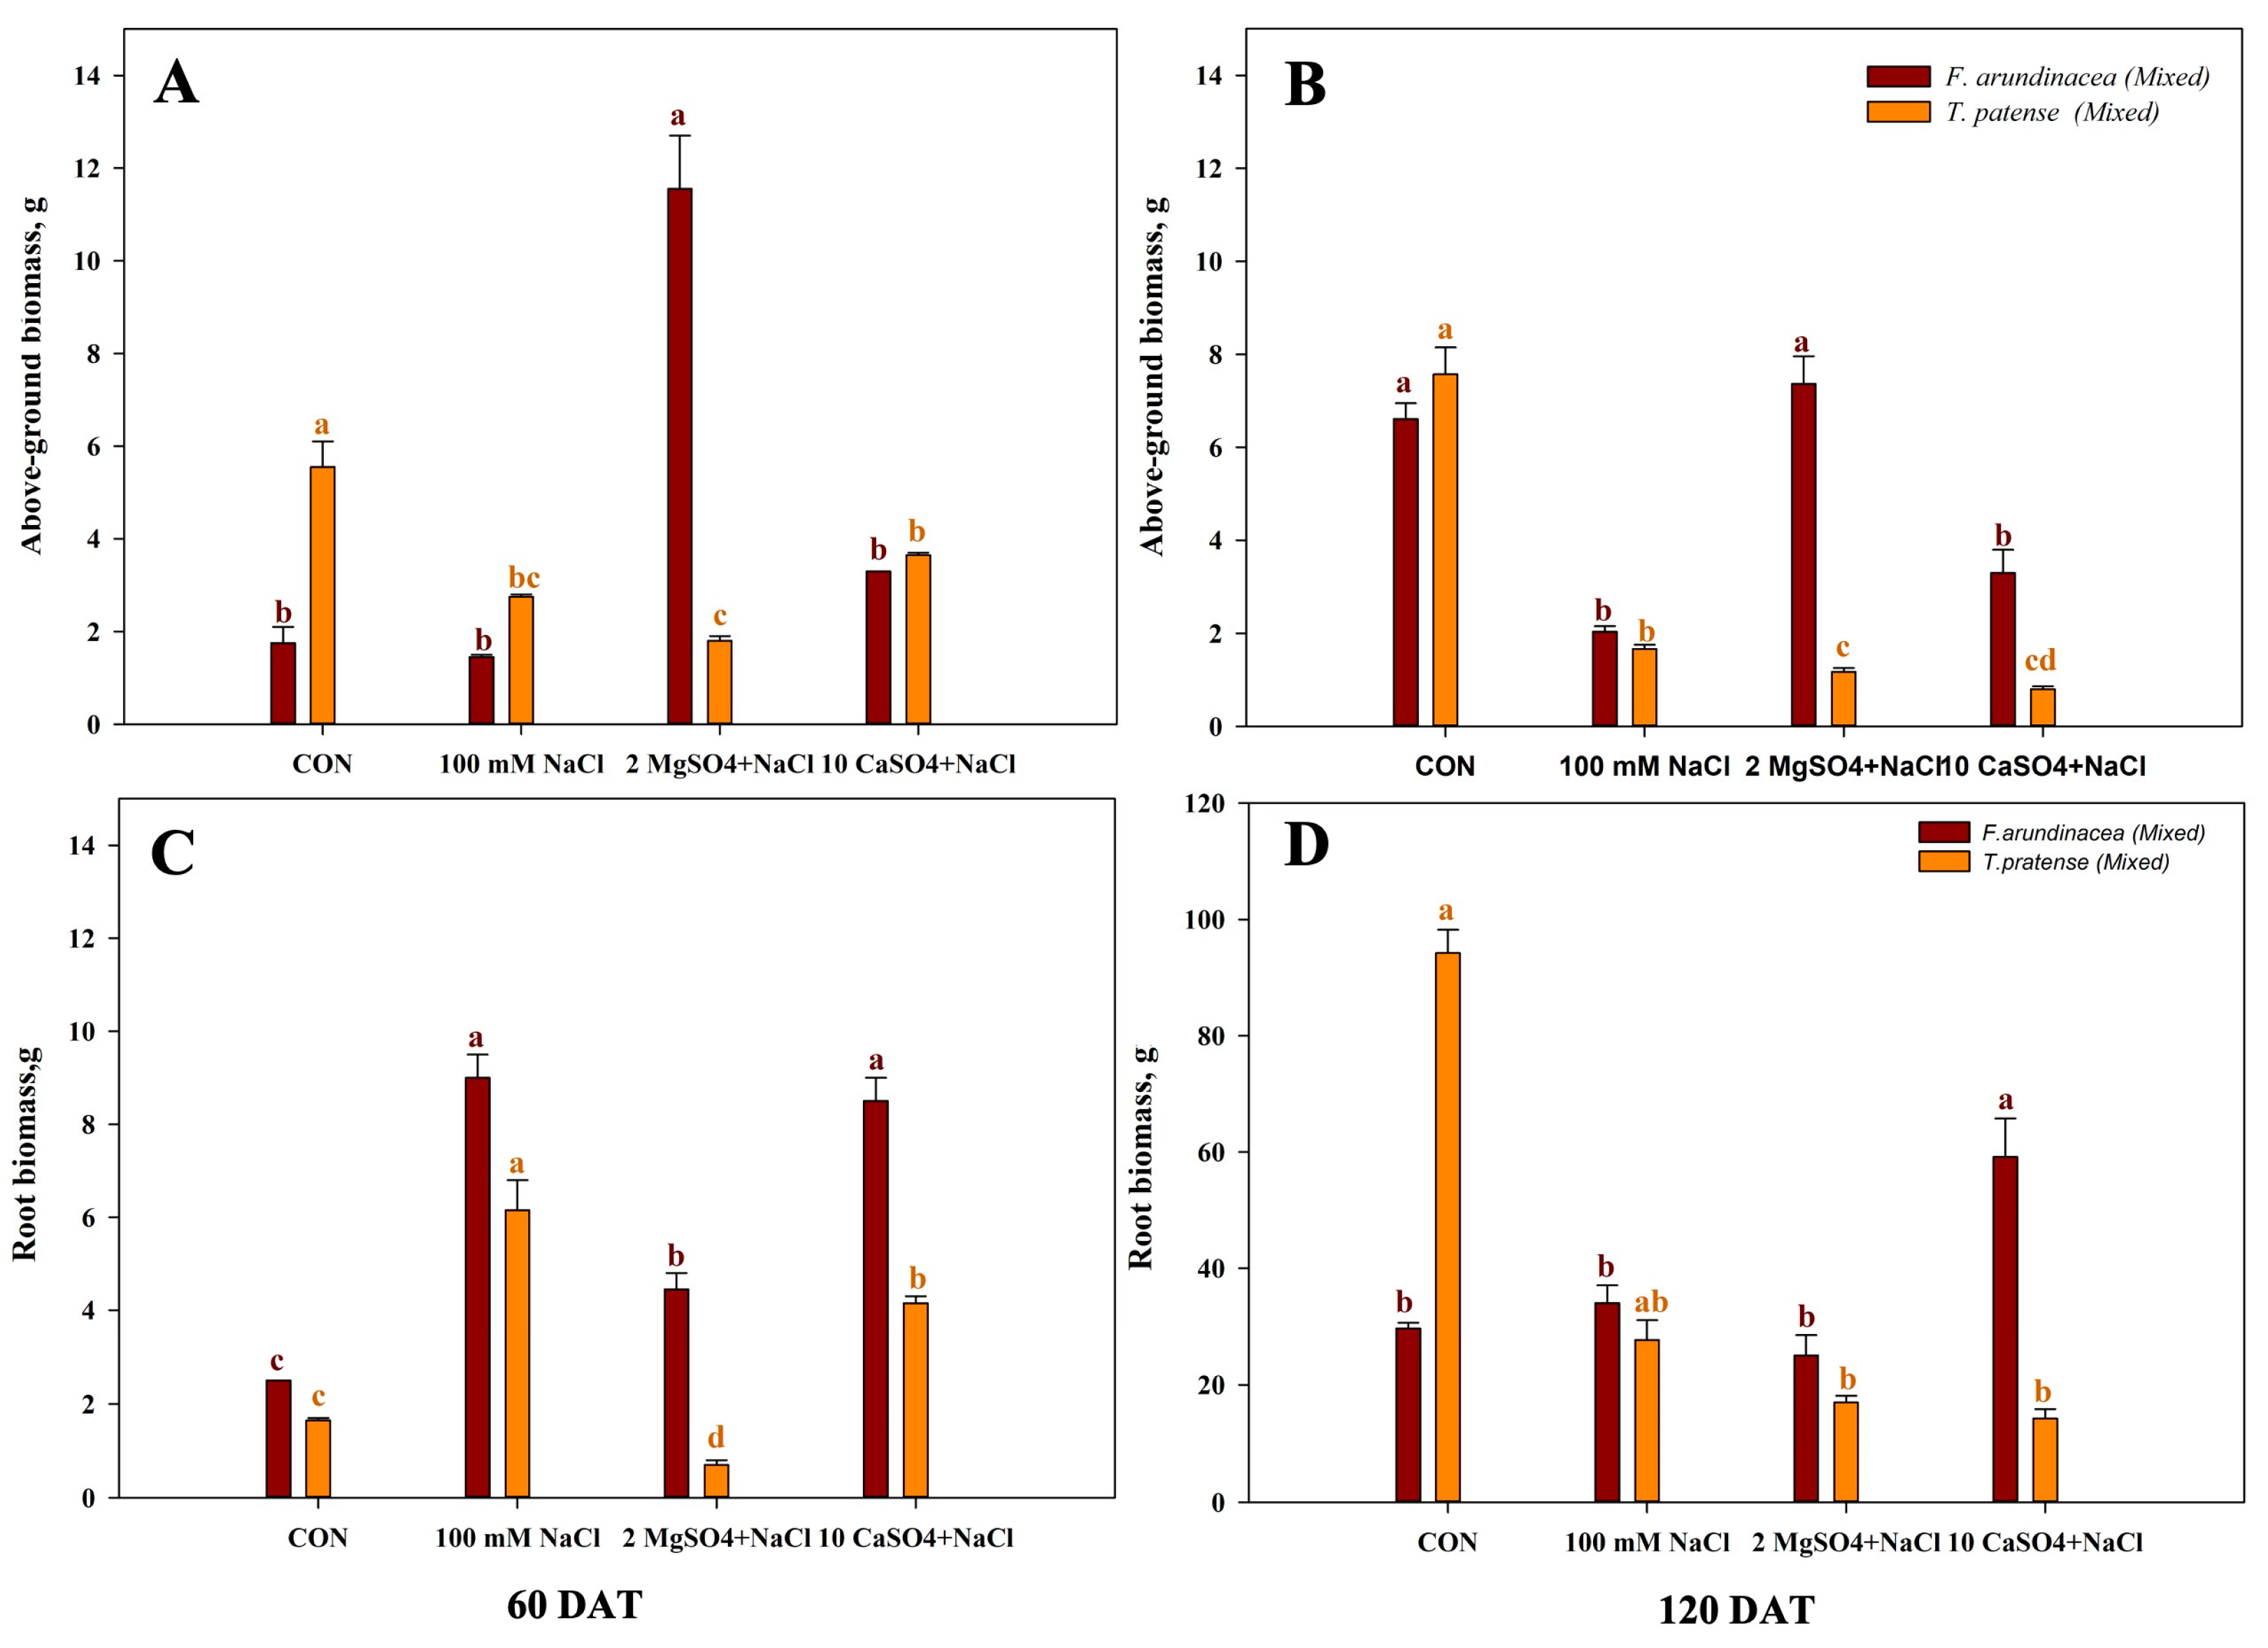
Figure 5.
Course of SPAD values of mono T. pratense, F. arundinacea, and M. sativa under four different treatments (A) at 60 DAT and (B) 120 DAT. Relative chlorophyll concentration assessed by SPAD measurements. Measurements were made on three species of each of the four biological replicates per treatment; four individual SPAD values per leaf were averaged. Vertical bars represent standard error (n = 4). Different lowercase letters indicate significant differences among them at α = 0.05.
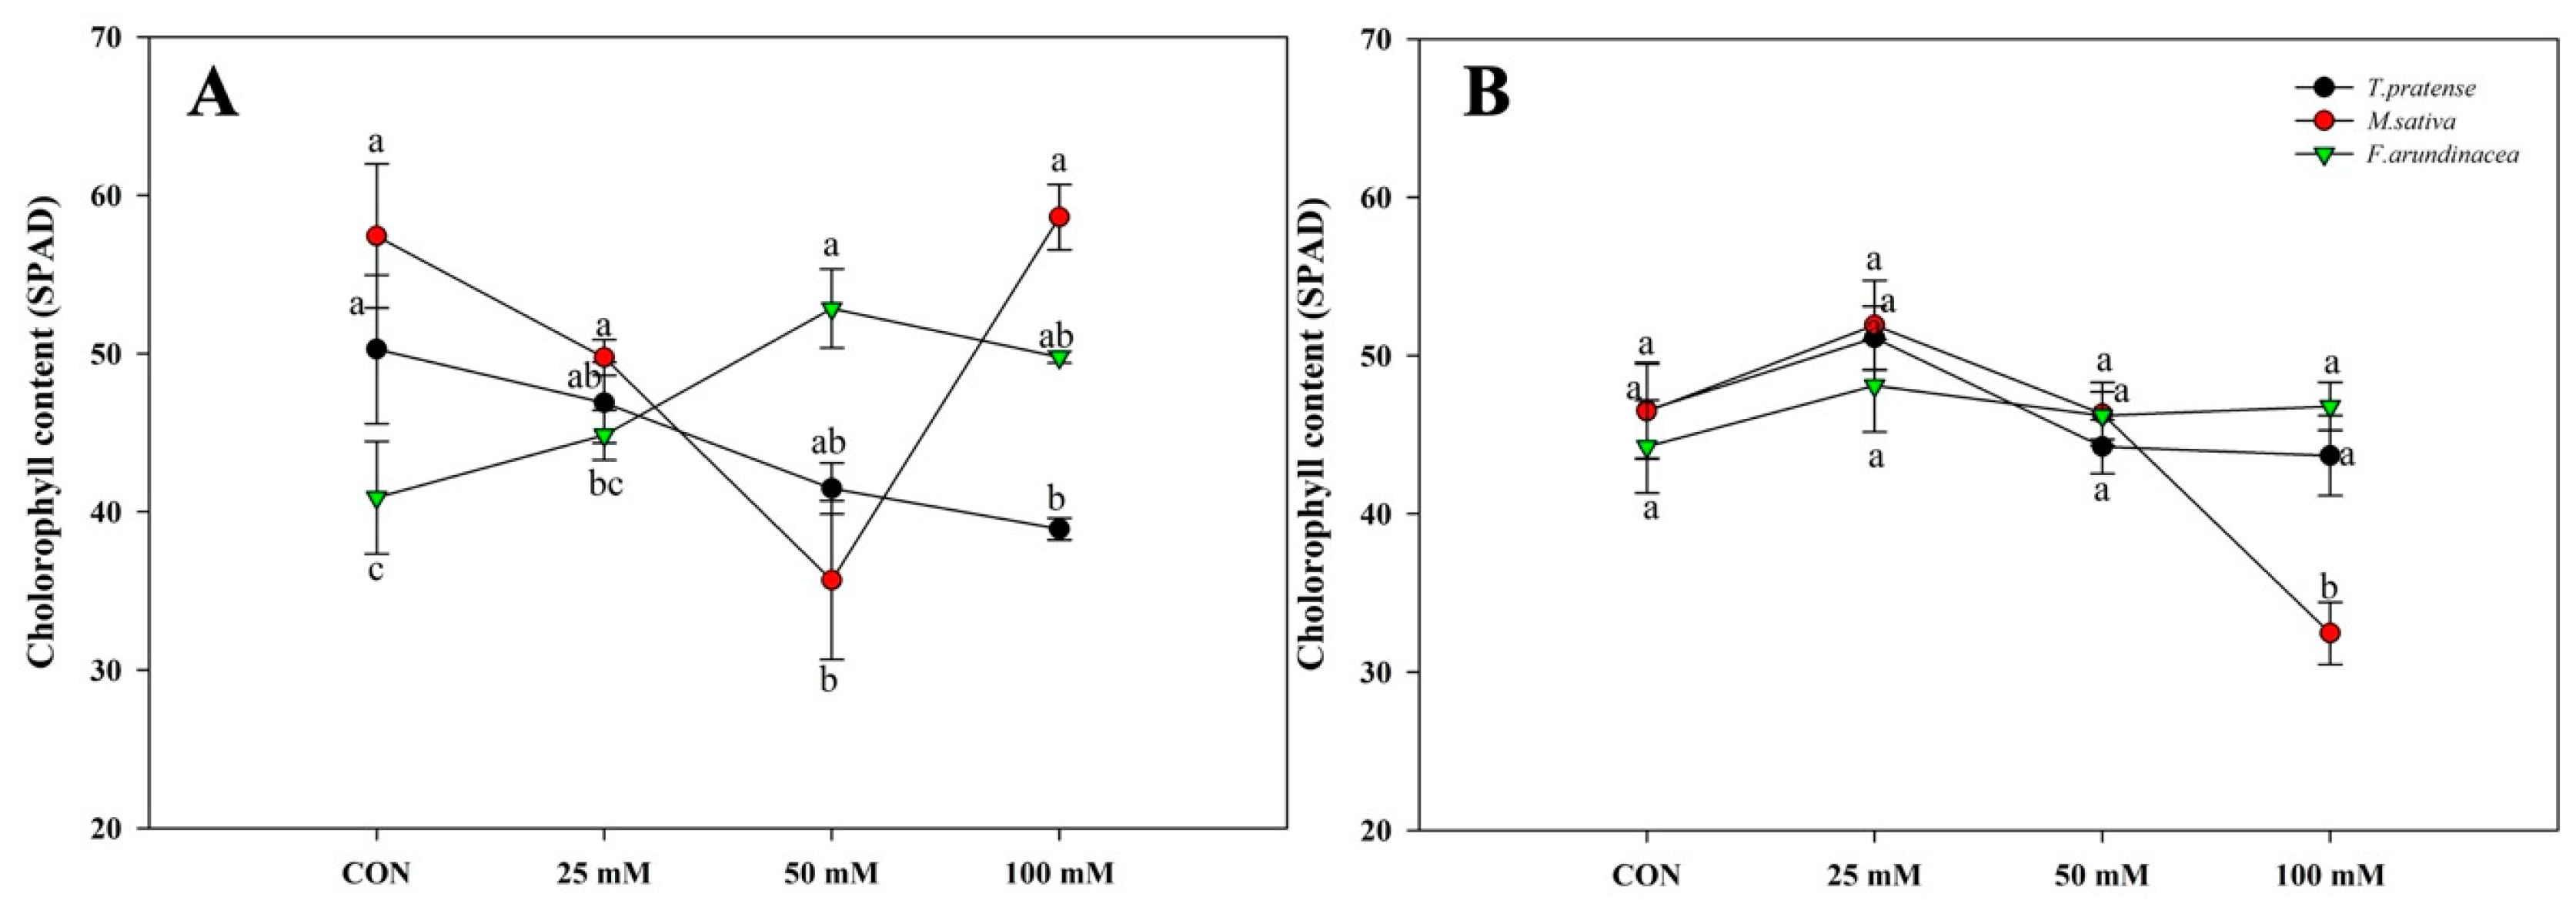
Figure 6.
Course of SPAD values of mixed T. pratense and F. arundinacea under four different treatments (A) at 60 DAT and (B) at 120 DAT. Relative chlorophyll concentration assessed by SPAD measurements. Measurements were made on two species of each of the four biological replicates per treatment; four individual SPAD values per leaf were averaged. Vertical bars represent standard error (n = 4). Different lowercase letters indicate significant differences among them at α = 0.05.

Figure 7.
Course of the specific leaf area of mono T. pratense, F. arundinacea, and M. sativa under four different treatments (A) at 60 DAT and (B) at 120 DAT. Vertical bars represent standard error (n = 4). Different lowercase letters indicate significant differences among them at α = 0.05.
Figure 7.
Course of the specific leaf area of mono T. pratense, F. arundinacea, and M. sativa under four different treatments (A) at 60 DAT and (B) at 120 DAT. Vertical bars represent standard error (n = 4). Different lowercase letters indicate significant differences among them at α = 0.05.
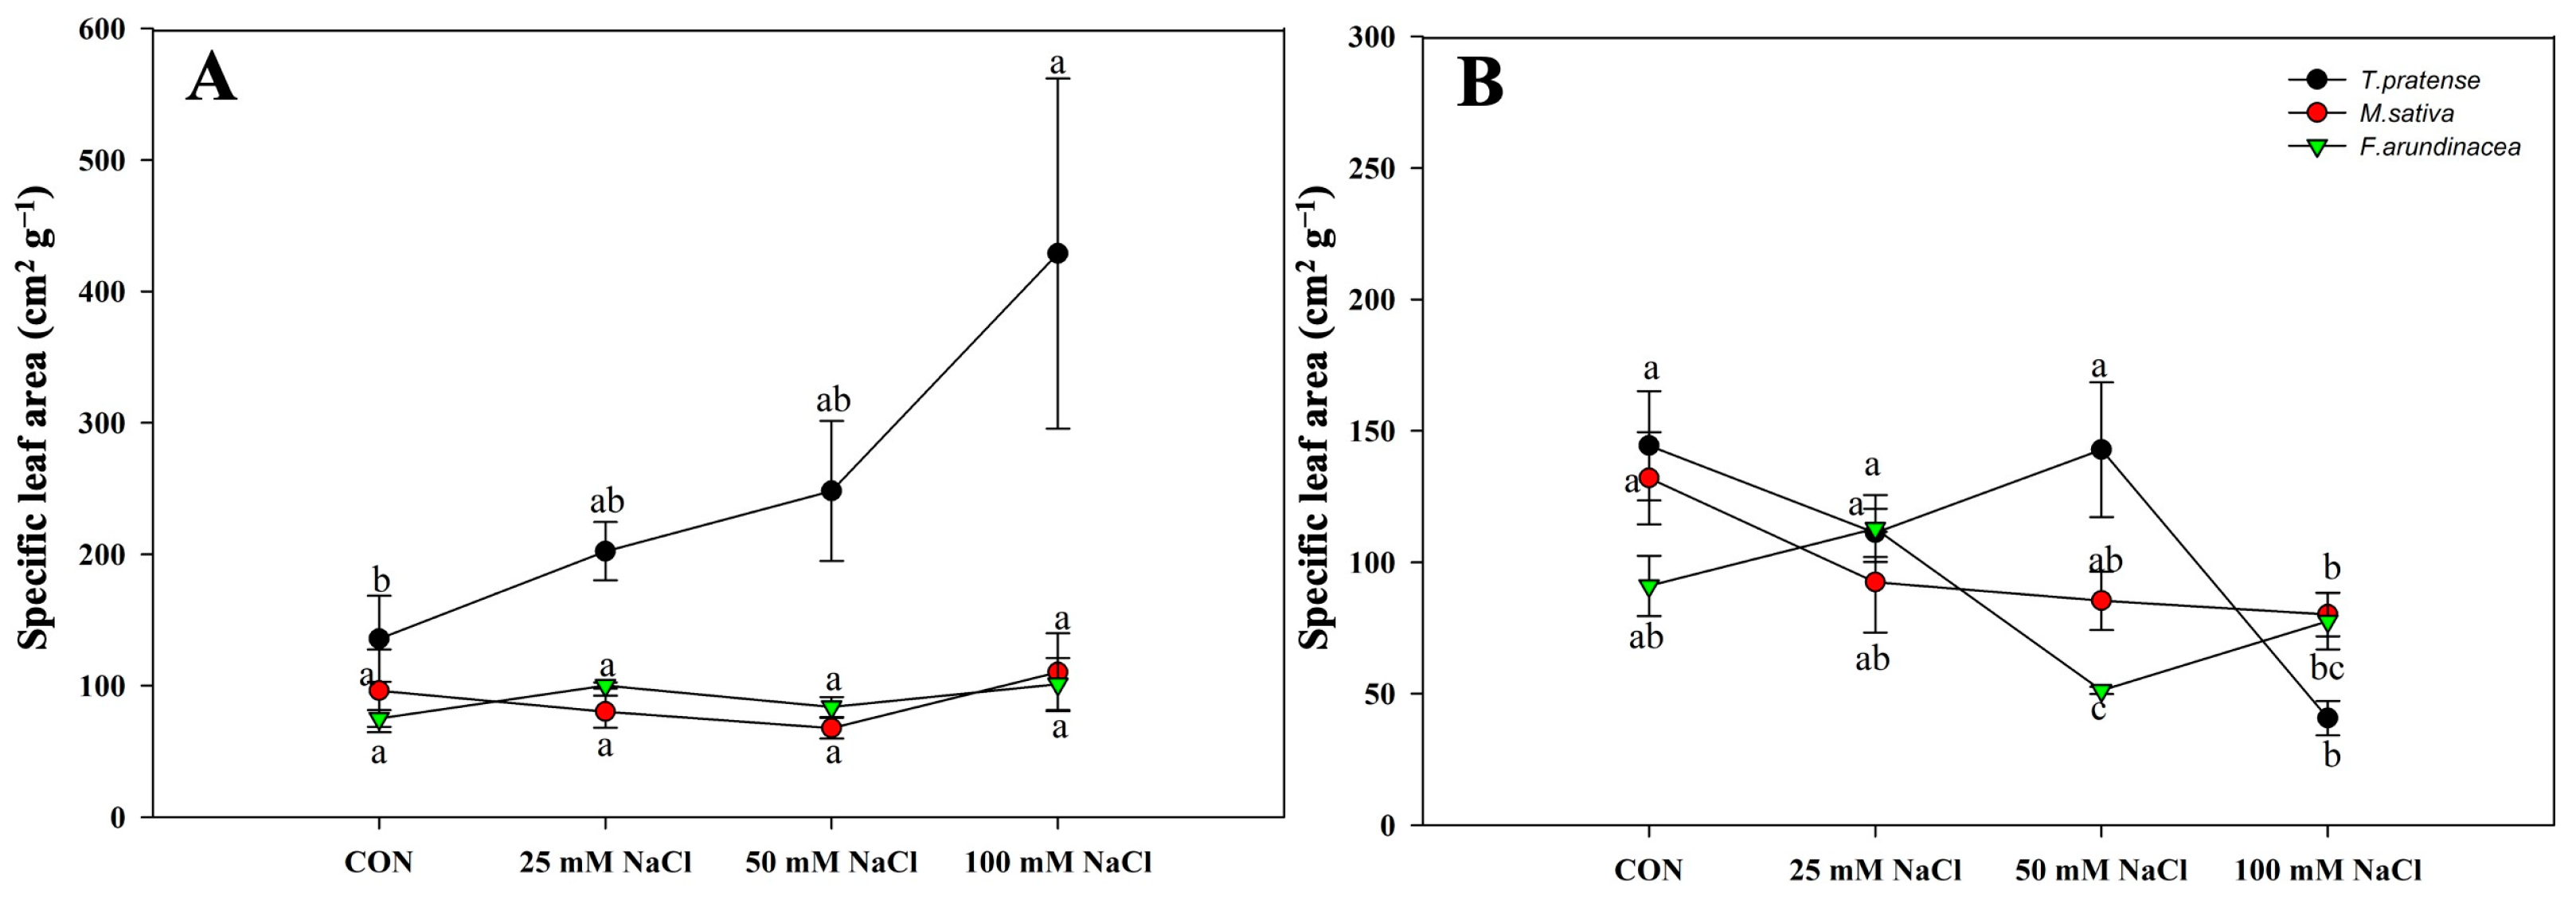
Figure 8.
Course of specific leaf area of mixed T. pratense and F. arundinacea (A) at 60 DAT and (B) at 120 DAT. Vertical bars represent standard error (n = 4). Different lowercase letters indicate significant differences among them at α = 0.05.
Figure 8.
Course of specific leaf area of mixed T. pratense and F. arundinacea (A) at 60 DAT and (B) at 120 DAT. Vertical bars represent standard error (n = 4). Different lowercase letters indicate significant differences among them at α = 0.05.

Figure 9.
Photosynthetic rates of mono T. pratense, F. arundinacea, and M.sativa under 400 μmol·mol−1 CO2 at the PAR value from 0 to 2000 µmol·m−2 s−1 with the air ambient temperature: (A) T. pratense mono at 60 DAT; (B) M. sativa mono at 60 DAT; (C) F. arundinacea mono at 60 DAT; (D) T. pratense mono at 120 DAT; (E) M. sativa mono at 120 DAT; (F) F. arundinacea mono at 120 DAT.

Figure 10.
Photosynthetic rates of four different treatments under 400 μmol·mol−1 CO2 at the PAR value from 0 to 2000 µmol·m−2 s−1 with the air ambient temperature. (A) F. arundinacea mixed at 60 DAT; (B) F. arundinacea mixed at 120 DAT; (C) T. pratense mixed at 60 DAT; (D) T. pratense mixed at 120 DAT.
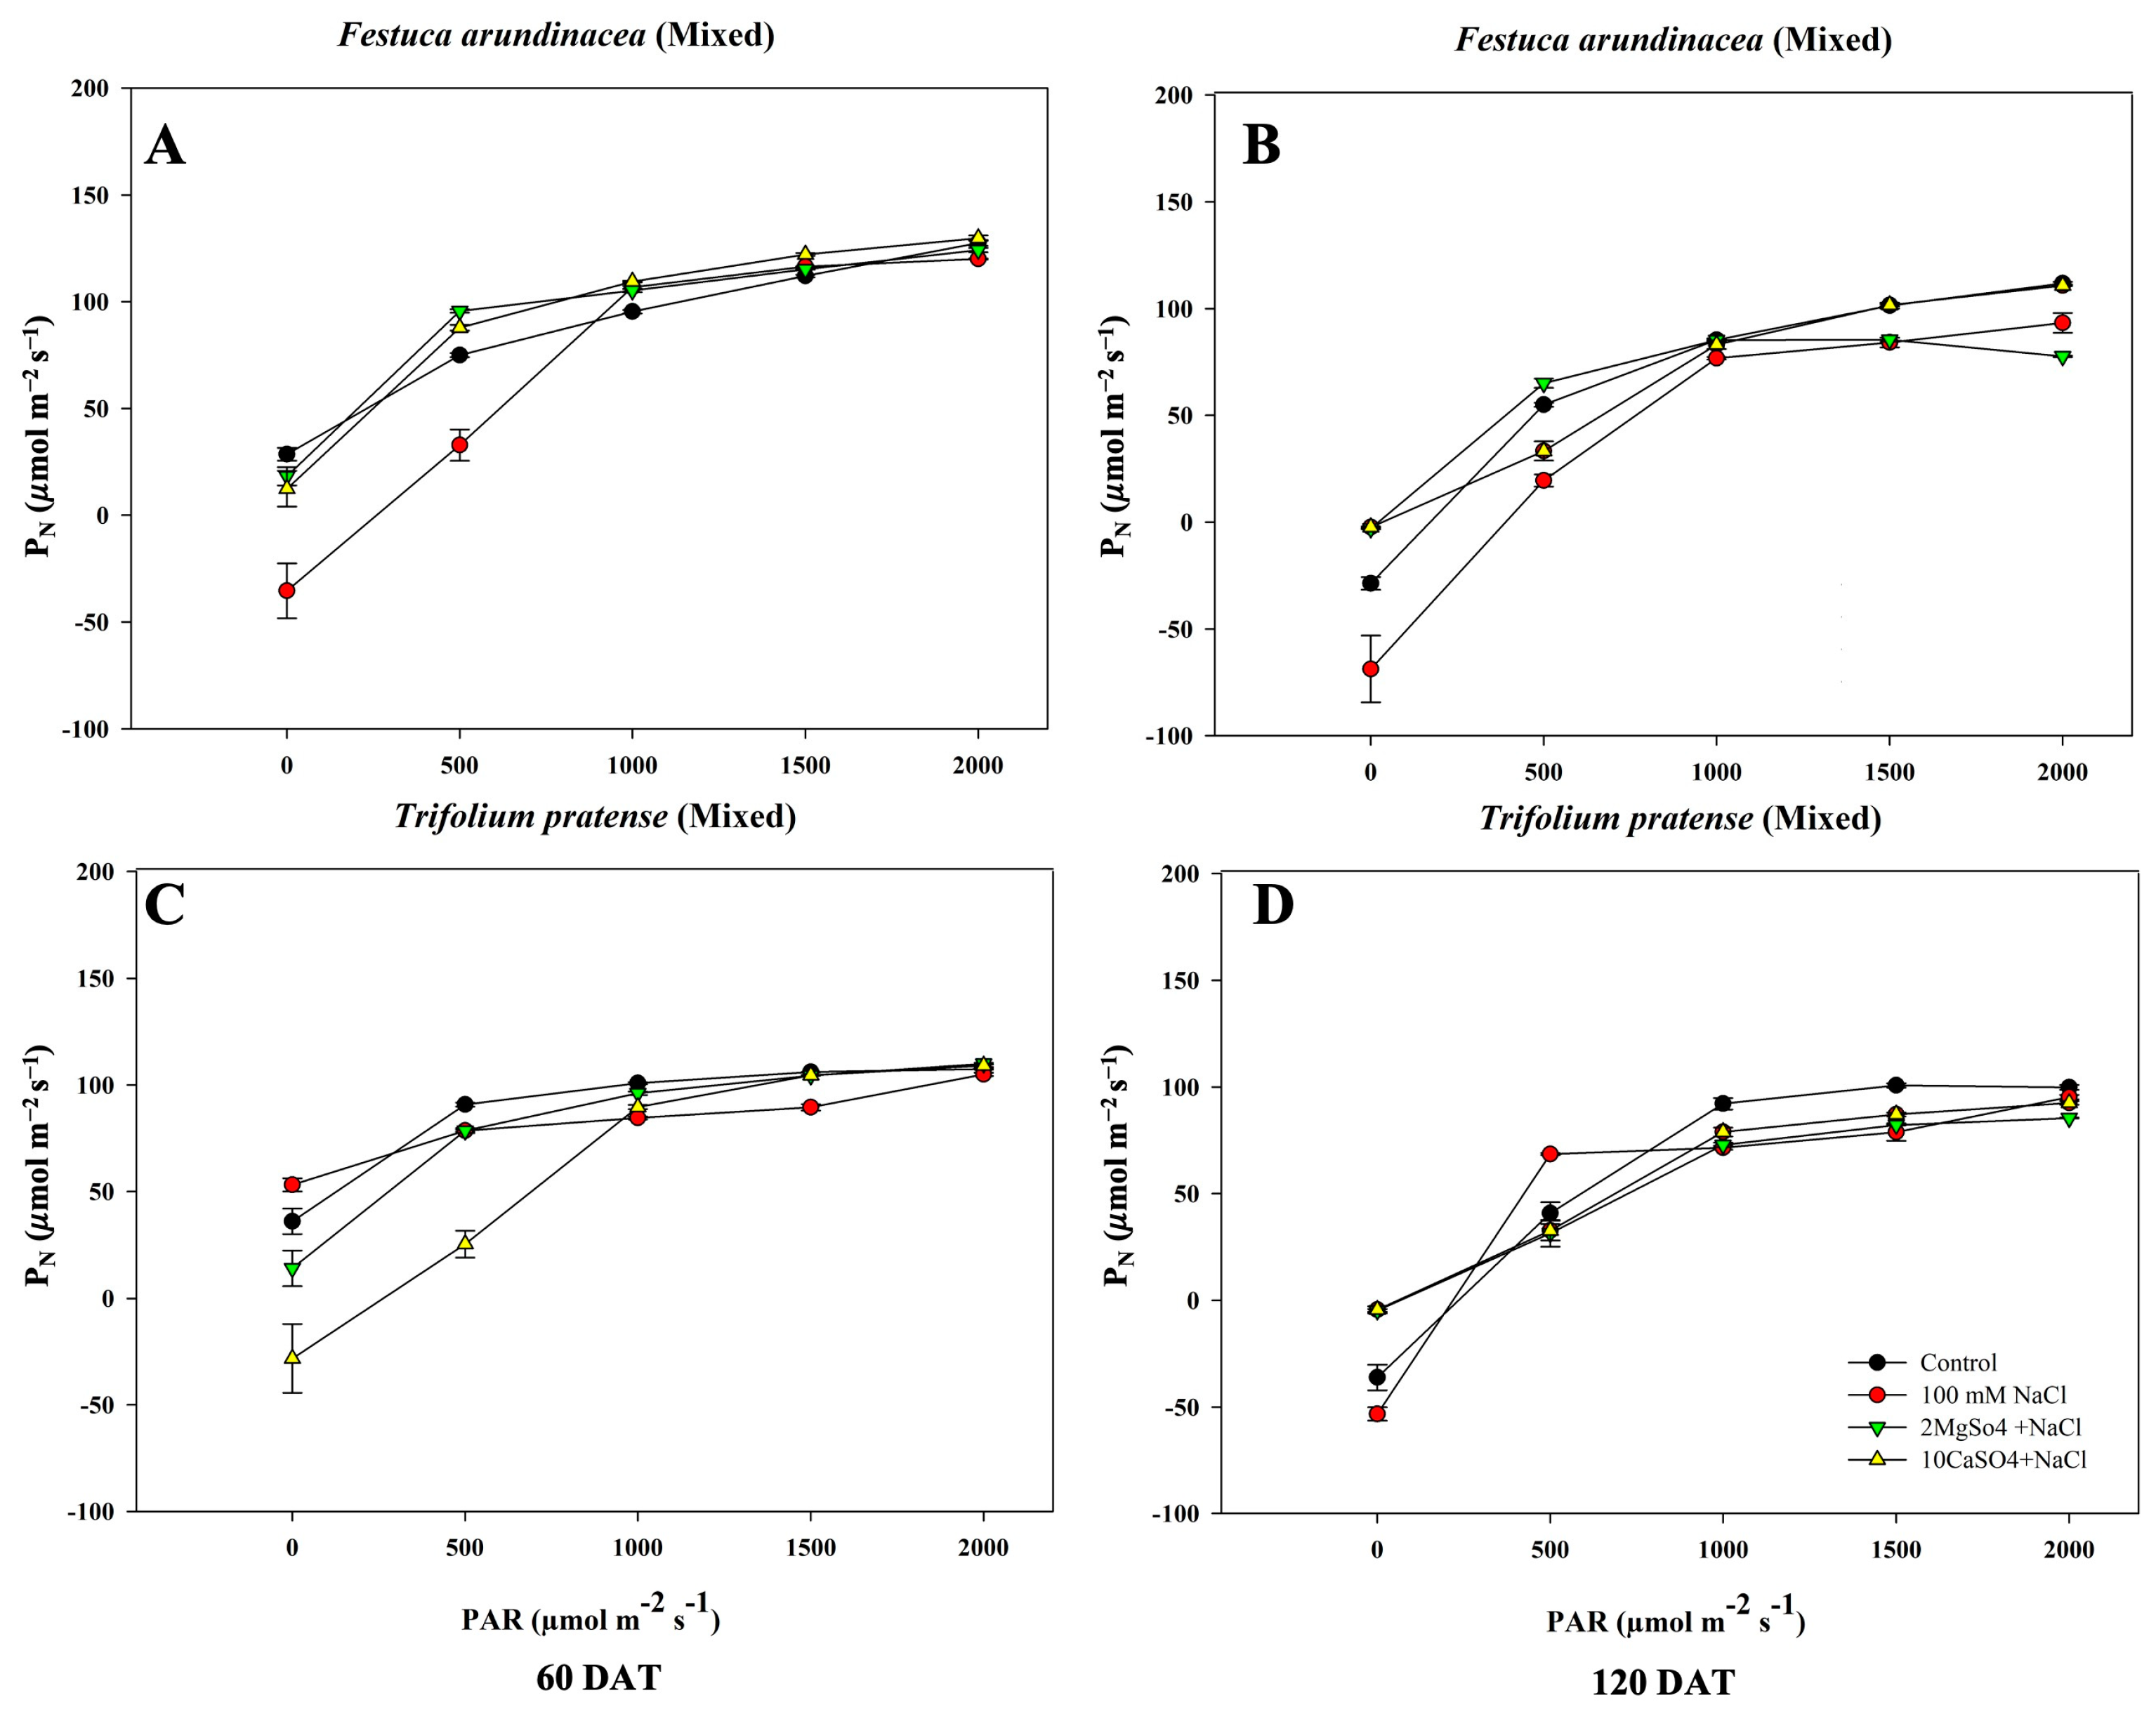
Figure 11.
Heat map for morphological parameters and macronutrients under different treatments in F. arundinacea at (A) 60 DAT and (B) 120 DAT; T. pratense at (C) 60 DAT and (D) 120 DAT; and M. sativa at (E) 60 DAT and (F) 120 DAT.
Figure 11.
Heat map for morphological parameters and macronutrients under different treatments in F. arundinacea at (A) 60 DAT and (B) 120 DAT; T. pratense at (C) 60 DAT and (D) 120 DAT; and M. sativa at (E) 60 DAT and (F) 120 DAT.

Table 1.
Three-way ANOVA analysis of species, treatments, and measurement period in mono-cropping. ANOVA analysis of total shoot height, root length, above-ground biomass, root biomass, SLA, SPAD of species, treatments, measurement period, species × measurement period, species × treatments, and measurement period × treatments.
| Measurements | Species | Treatments | Measurements Period | Species × Measurements Period | Species × Treatments | Measurements Period × Treatments | ||||||||||||
|---|---|---|---|---|---|---|---|---|---|---|---|---|---|---|---|---|---|---|
| D | F | P | D | F | P | D | F | P | D | F | P | D | F | P | D | F | P | |
| Shoot height | 2 | 4.06 | 0.0214 | 3 | 3.22 | 0.0276 | 1 | 4.42 | 0.0391 | 2 | 1.72 | 0.1859 | 6 | 1.46 | 0.2040 | 3 | 0.77 | 0.5142 |
| Root length | 2 | 1.31 | 0.2766 | 3 | 1.43 | 0.2404 | 1 | 0.49 | 0.4852 | 2 | 0.84 | 0.4363 | 6 | 2.17 | 0.0557 | 3 | 1.89 | 0.1386 |
| Above-ground biomass | 2 | 297.71 | <0.0001 | 3 | 40.54 | <0.0001 | 1 | 556.52 | <0.0001 | 2 | 29.32 | <0.0001 | 6 | 68.21 | <0.0001 | 3 | 12.94 | <0.0001 |
| Root biomass | 2 | 633.27 | <0.0001 | 3 | 160.24 | <0.0001 | 1 | 2277.77 | <0.0001 | 2 | 583.28 | <0.0001 | 6 | 78.51 | <0.0001 | 3 | 153.21 | <0.0001 |
| Total Biomass | 2 | 496.39 | <0.0001 | 3 | 157.58 | <0.0001 | 1 | 2609.73 | <0.0001 | 2 | 402.00 | <0.0001 | 6 | 84.55 | <0.0001 | 3 | 141.91 | <0.0001 |
| SLA | 2 | 19.96 | <0.0001 | 3 | 0.89 | 0.4489 | 1 | 11.81 | 0.0010 | 2 | 12.47 | <0.0001 | 6 | 1.59 | 0.1635 | 3 | 6.72 | 0.0005 |
| SPAD | 2 | 1.08 | 0.3450 | 3 | 3.53 | 0.0190 | 1 | 2.15 | 0.1473 | 2 | 4.66 | 0.0124 | 6 | 5.14 | 0.0002 | 3 | 5.91 | 0.0012 |
Table 2.
Crop quality indicators (%), crude protein (CP), acid detergent fiber (ADF), and neutral detergent fiber (NDF) of mono and mixed cropping under various salinity, 2 MgSO4 + NaCl, and 10 CaSO4 + NaCl treatments at 60 DAT and 120 DAT.
Table 2.
Crop quality indicators (%), crude protein (CP), acid detergent fiber (ADF), and neutral detergent fiber (NDF) of mono and mixed cropping under various salinity, 2 MgSO4 + NaCl, and 10 CaSO4 + NaCl treatments at 60 DAT and 120 DAT.
| Measurement Period | Species | Treatments | ||||||
|---|---|---|---|---|---|---|---|---|
| CON | 25 mM NaCl | 50 mM NaCl | 100 mM NaCl | 2MS + NaCl | 10CS + NaCl | |||
| 60 DAT | T. pratense | CP | 15.011 b | 12.93 c | 17.39 a | 18.31 a | - | - |
| NDF | 31.95 a | 30.42 a | 25.74 a | 30.65 a | - | - | ||
| ADF | 29.47 a | 23.35 c | 21.59 d | 25.02 b | - | - | ||
| M. sativa | CP | 19.74 ab | 15.37 c | 18.01 b | 19.98 a | - | - | |
| NDF | 26 c | 34.01 a | 31.01 b | 24.28 c | - | - | ||
| ADF | 20.62 c | 26.75 a | 24.84 b | 20.61 c | - | - | ||
| F. arundinacea | CP | 13.15 b | 13.86 b | 18.42 a | 19.91 a | - | - | |
| NDF | 61.86 a | 61.20 a | 53.27 b | 48.59 c | - | - | ||
| ADF | 32.05 b | 33.92 a | 24.63 c | 25.71 c | - | - | ||
| Mixed cropping | CP | 16 a | - | - | 12.57 b | 13.40 b | 16.62 a | |
| NDF | 41.48 b | - | - | 41.76 b | 48.15 a | 47.51 a | ||
| ADF | 27.52 a | - | - | 28.27 a | 28.29 a | 27.43 a | ||
| 120 DAT | T. pratense | CP | 16.63 bc | 17.6 ab | 15.78 c | 18.49 a | - | - |
| NDF | 40.11 b | 33.69 c | 39.53 b | 42.27 a | - | - | ||
| ADF | 26.48 ab | 23.29 c | 25.55 b | 27.47 a | - | - | ||
| M. sativa | CP | 20.06 a | 20.23 a | 21.07 b | 18.00 ab | - | - | |
| NDF | 38.44 c | 34.5 bc | 35.26 ab | 43.29 a | - | - | ||
| ADF | 29.0 ab | 24.55 b | 24.60 a | 29.68 b | - | - | ||
| F. arundinacea | CP | 14.76 a | 15.43 a | 12.65 a | 14.43 b | - | - | |
| NDF | 57.57 b | 58.52 c | 60.30 c | 61.24 a | - | - | ||
| ADF | 28.06 a | 26.10 b | 29.43 b | 27.39 a | - | - | ||
| Mixed cropping | CP | 16.64 a | - | - | 15.46 ab | 14.27 c | 13.62 bc | |
| NDF | 53.63 c | - | - | 61.56 a | 59.95 b | 57.50 a | ||
| ADF | 29.85 a | - | - | 29.32 a | 29.12 a | 28.09 a | ||
Different letters within a cultivar indicate significant differences between groups (p < 0.05).
Disclaimer/Publisher’s Note: The statements, opinions and data contained in all publications are solely those of the individual author(s) and contributor(s) and not of MDPI and/or the editor(s). MDPI and/or the editor(s) disclaim responsibility for any injury to people or property resulting from any ideas, methods, instructions or products referred to in the content. |
© 2024 by the authors. Licensee MDPI, Basel, Switzerland. This article is an open access article distributed under the terms and conditions of the Creative Commons Attribution (CC BY) license (https://creativecommons.org/licenses/by/4.0/).
Share and Cite
MDPI and ACS Style
Sharavdorj, K.; Byambadorj, S.-O.; Jang, Y.; Ahn, Y.; Cho, J.-W. Evaluating the Effects of Long-Term Salinity Stress on the Growth and Physiology of Mono and Mixed Crops. Agronomy 2024, 14, 287. https://doi.org/10.3390/agronomy14020287
AMA Style
Sharavdorj K, Byambadorj S-O, Jang Y, Ahn Y, Cho J-W. Evaluating the Effects of Long-Term Salinity Stress on the Growth and Physiology of Mono and Mixed Crops. Agronomy. 2024; 14(2):287. https://doi.org/10.3390/agronomy14020287
Chicago/Turabian StyleSharavdorj, Khulan, Ser-Oddamba Byambadorj, Yeongmi Jang, Youngjik Ahn, and Jin-Woong Cho. 2024. "Evaluating the Effects of Long-Term Salinity Stress on the Growth and Physiology of Mono and Mixed Crops" Agronomy 14, no. 2: 287. https://doi.org/10.3390/agronomy14020287
Note that from the first issue of 2016, this journal uses article numbers instead of page numbers. See further details here.