Abstract
Accurately and effectively measuring the breaking quality of harvested corn kernels is a critical step in the intelligent development of corn harvesters. The detection of broken corn kernels is complicated during the harvesting process due to turbulent corn kernel movement, uneven lighting, and interference from numerous external factors. This paper develops a deep learning-based detection method in real time for broken corn kernels in response to these issues. The system uses an image acquisition device to continuously acquire high-quality corn kernel image data and cooperates with a deep learning model to realize the rapid and accurate recognition of broken corn kernels. First, we defined the range of broken corn kernels based on image characteristics captured by the acquisition device and prepared the corn kernel datasets. The corn kernels in the acquired image were densely distributed, and the highly similar features of broken and whole corn kernels brough challenges to the system for visual recognition. To address this problem, we propose an improved model called BCK-YOLOv7, which is based on YOLOv7. We fine-tuned the model’s positive sample matching strategy and added a transformer encoder block module and coordinate attention mechanism, among other strategies. Ablation experiments demonstrate that our approach improves the BCK-YOLOv7 model’s ability to learn effectively broken corn kernel features, even when high-density features are similar. The improved model achieved a precision rate of 96.9%, a recall rate of 97.5%, and a mAP of 99.1%, representing respective improvements of 3.7%, 4.3%, and 2.8% over the original YOLOv7 model. To optimize and deploy the BCK-YOLOv7 model to the edge device (NVIDIA Jetson Nano), TensorRT was utilized, resulting in an impressive inference speed of 33 FPS. Finally, the simulation system experiment for corn kernel broken rate detection was performed. The results demonstrate that the system’s mean absolute deviation is merely 0.35 percent compared to that of manual statistical results. The main contribution of this work is the fact that this is the first time that a set of deep learning model improvement strategies and methods are proposed to deal with the problem of rapid and accurate corn kernel detection under the conditions of high density and similar features.
1. Introduction
Corn is one of the most important food crops in China and plays a crucial role in ensuring national food security [1]. In recent years, the state has vigorously promoted the development of intelligent agricultural machinery and equipment, but research on corn intelligent harvesting equipment is still insufficient. Restricted by conditions such as regions, corn varieties, and harvesting equipment in China, the moisture content of corn during the harvest period is usually around 25% [2,3]. A high grain moisture content easily leads to an excessively high grain breakage rate during harvesting, which puts forward higher requirements on the reliability and adaptability of the corn harvesting device. Accurately obtaining the corn kernel breakage rate in real time during the harvesting process is a prerequisite for the precise control of the harvesting device. Therefore, how to obtain the breakage rate of corn kernels is the basis for studying the adaptive intelligent harvesting of corn kernels, and it is also an urgent problem to be solved.
The quality detection methods for major food crops currently include near-infrared spectroscopy, hyperspectral and multispectral imaging, and machine vision technology [4,5]. Machine learning detection is widely used by researchers due to its non-destructive, fast, and low-cost characteristics for detecting the appearance quality of food crops. Birla [6] et al. used machine learning techniques to detect normal, broken, and different sizes of rice seeds, while Singh and Chaudhury [7] extracted various features such as rice color and texture and input them into a reverse neural network to classify four types of rice with an average accuracy of 96%. Zhu et al. and Chen et al. [8,9] designed a grain image acquisition device to obtain image information for the online detection of broken grains. Wu et al. [10] developed the online detection of corn kernel damage rate and impurity content using feature threshold and backpropagation (BP) neural network technology. Although these studies have made progress in detecting grain appearance quality using traditional machine learning techniques, their research basis mainly relies on artificially extracted features and strict external environments. In addition, the processing speed and accuracy of traditional machine learning models are slow, which brings challenges to the real-time detection of grain quality.
In recent years, with the rapid development of machine learning (especially deep learning technology), many landmark technologies have emerged in the field of object detection and gradually applied to the field of grain quality detection [4]. Some researchers proposed a two-stage deep learning method (image segmentation–classification) to evaluate the harvest quality of grains, and the experimental results show that this method is better than is manual detection [11,12]. Rasmussen et al. [13] fine-tuned the Faster R-CNN model to detect oversized particles in the feed in order to improve the value of corn silage. Experiments showed that the average accuracy of the improved model was significantly better than that of the original model. Liu and Wang [14] detected the ear picking damage of the corn harvester based on the YOLOv3-tiny model, and they solved the problem of insufficient images of broken ears by simply synthesizing the dataset. Zhang et al. [15] used improved Deeplabv3+ and YOLOv4 to realize dynamic detection of rice loss and breakage in combine harvesters. Additionally, Liu et al. [16] proposed a CPU-Net semantic segmentation model to calculate corn impurity, and the experimental results showed that the average relative error between the impurity rate obtained using the monitoring device and the manual statistics was 4.64 %. However, there are still few studies on the real-time online task of detecting broken corn kernels using deep learning technology. In particular, Li et al. [17] developed a broken corn kernel detection device based on the YOLOv4-tiny model, and tests showed that the detection accuracy of the device reached 93.5% and 93% for whole and broken corn kernels, respectively.
The real-time online detection of broken corn kernels using deep learning technology is a challenge. On the one hand, it is very difficult to obtain high-quality corn kernel images in a complex harvesting environment. On the other hand, partially broken corn kernels and whole kernels have pretty similar visual features, and uneven lighting circumstances also put forward higher requirements for the algorithm model. Although the above-mentioned authors [17] have initially realized the online detection of broken corn kernels, there is still potential for advancement in terms of detection accuracy and efficiency. Therefore, based on the above research, this paper aims to further study the real-time task of detecting broken corn kernels. The research content of this paper mainly includes the following two parts: (1) the proposition and design of a corn kernel image acquisition device without external power to ensure continuous and sufficient image data. (2) Based on the YOLOv7 model, the BCK-YOLOv7 model specially suitable for the detection of broken corn kernels under high-density conditions is proposed, and deployed to edge devices to achieve the efficient and accurate identification of broken corn kernels.
2. Materials and Methods
The “Zheng Shan 958” varieties of corn planted by Shandong University of Technology were selected as the research samples. Additionally, the samples with the moisture content of 28.3% were collected by the corn kernel harvester in real time on 16 October 2022.
2.1. Corn Kernels Image Acquisition Device
In the complex working environment of the corn harvester, installing a camera directly on the harvester to collect images of corn kernels and identify them requires high-precision hardware and high-performance algorithms. This undoubtedly increases the cost and difficulty of detection. Chen et al. [9] proposed that the use of machine learning technology to solve the problem of the real-time detection of grain quality should meet certain requirements: ensuring the continuity and periodicity of sampling, providing a suitable light field, and accurate and efficient detection algorithms.
Therefore, this paper designs an acquisition device that can acquire high-quality corn kernel images in real time, as shown in Figure 1. The device consists of a feeding hopper, an adjustable chute reclaimer, a guiding flow mechanism, a single-layer uniform plate, and an image acquisition system. The entire image acquisition process is driven by the gravity of the corn kernel itself. The corn kernel flow was collected by the feed hopper and passed through the chute reclaimer. Then, it entered the guiding flow mechanism to complete the monolayerization of corn kernels through a single-layer uniform plate, which ensured that there was absolutely no overlap in height. Finally, the monolayered corn kernel flow was directed to the image acquisition area. The chute reclaimer, together with the restrictor plate, could limit the corn kernel flow, while the feeding hopper was equipped with a discharge chute to prevent blockage. The industrial camera (Hikvision, MV-CA050-10C, Zhejiang, China) was used to collect images of corn kernels at a rate of FPS = 32, and the image resolution was 1024 × 1280 (each image contains about 60 corn kernels, including whole and broken corn kernel). The collected images were then transmitted to the edge device (NVIDIA Jetson Nano, 16GB, Shanghai, China) via an Ethernet cable.
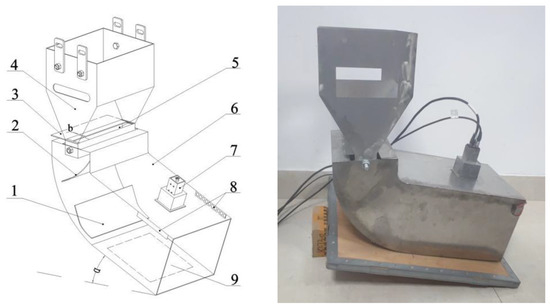
Figure 1.
Image acquisition machine for corn kernel. 1. Single-layer uniform plate; 2. buffer plate; 3. restrictor plate; 4. feeding hopper; 5. chute reclaimer; 6. guiding flow mechanism; 7. industrial camera; 8. light strip; 9. image acquisition area.
In addition, there are many optimizations for image acquisition devices. Two light strips are installed on both sides of the camera to provide a stable light source. Additionally, a rough white sticker is pasted on the inner wall of the guiding flow mechanism to reduce the impact of direct light and slow down the flow rate of corn kernels. The feeding hopper and the guiding flow mechanism were originally connected by a hinge to explore and determine the appropriate connection angle through experiments, which prevented the problem of a “blurred image” caused by the high-speed flow of corn kernels. Finally, the two mechanisms were welded together to ensure reliability. Figure 2 displays corn kernel images that were obtained both before and after the device’s parameters were optimized.
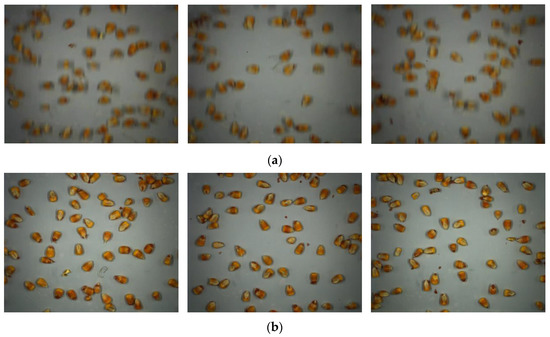
Figure 2.
Comparison of corn kernel images obtained. (a) The serious smear problem of the image before device optimization, which was not conducive to the visual recognition of broken corn kernels; however, the high-quality image obtained after device optimization was ideal (b).
2.2. Datasets Preparation
The performance of deep learning models is strongly dependent on the original dataset’s quality. High-quality datasets can increase the upper limit of the model [18,19]. According to the image data of corn kernels obtained in this paper shown in Figure 2, although most of the broken corn kernels are obviously different from the intact kernels, some broken kernels are still challenging to identify because of position occlusion and the orientation of the broken surface, as illustrated in Figure 3. Therefore, it is essential to formulate the datasets according to strict and scientific labeling principles.
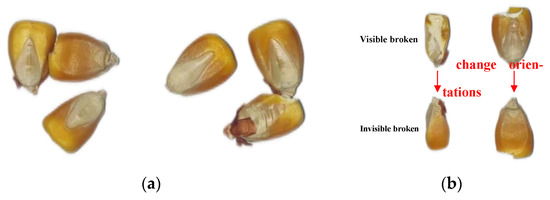
Figure 3.
Difficulties in detecting broken corn kernels. (a) Broken regions of corn kernel are blocked; (b) problem with broken corn kernel face orientation.
2.2.1. Broken Corn Kernel Definition
According to the national standards of the People’s Republic of China [20,21], broken corn kernels are defined as corn kernels whose damage degree reaches more than one-fifth (inclusive) of the grain volume. Additionally, we draw on the actual operating experience of inspectors to further clarify the method of determining broken corn kernels. This paper stipulates that broken corn kernels mainly include truncated kernels with more than one-fifth of the corn kernel volume, severely cracked kernels, and apparently broken kernels (the exfoliation of the root tip of the corn kernel is not included in the scope of broken corn kernels), as shown in Figure 4a. Moreover, from the perspective of visual system detection, the broken corn kernels are separated into large-scale and small-scale broken corn kernels (Figure 4b).
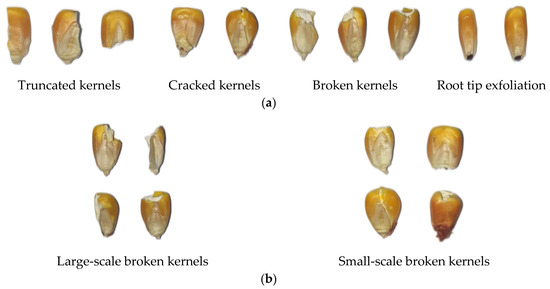
Figure 4.
Definition of broken corn kernel in this paper. (a) Broken corn kernels mainly include truncated, cracked and broken kernels, in which the exfoliation of the root tip of the corn kernel is not included; (b) from the perspective of visual system detection, the broken corn kernels are separated into large-scale and small-scale broken corn kernels.
2.2.2. Corn Kernel Datasets
To train the model, we obtained 438 corn kernel images using the image acquisition device in Section 2.1. Some of the images were carefully labeled for each object (whole and broken) in the LabelImg software (version: 1.8.6) according to the above-mentioned broken corn kernel standard, while the rest were used for model testing. The division ratio of the training set to the validation set and test set is 6:2:2 and the specific use distribution of the datasets is shown in Table 1. Furthermore, a data augmentation process, the Mosaic data augmentation technique was used to increase train datasets [22,23]. However, considering the small size of corn kernels and the inconspicuous characteristics of some broken corn kernels, we limited the range of image scale changes during the Mosaic data enhancement process to between 0.9 and 1.1 times, which further accelerated model convergence.

Table 1.
The usage distribution of corn kernel images.
2.3. Broken Corn Kernel Detection Model
2.3.1. Baseline Model Determination
The YOLO series algorithm is the pioneering work of the single-stage detection model. Compared to the two-stage detection model, YOLOv1 and YOLOv2 only have advantages in detection speed. However, the model after the YOLOv3 version is continuously optimized and improved in terms of accuracy and speed through the superposition of tricks. To determine the baseline model suitable for the detection task of broken corn kernels in this paper, we chose the classic representative YOLOv3, YOLOv4, YOLOv5, and YOLOv7 models to pre-train on the datasets of this paper and compared the detection results (all models were fine-tuned, training cycle 110), as shown in Table 2. Obviously, the YOLOv7 model had the best detection effect on the datasets, so it was selected as the baseline model.
Table 2.
Comparison of the pre-training performance of the YOLO series models.
However, YOLOv7 series comprise seven deformed models, including YOLOv7, YOLOv7x, and YOLOv7-tiny, etc. [24]. To identify the most suitable YOLOv7 network structure for our task, we trained all seven models on our datasets. The results show that YOLOv7-tiny performed better than the other models in terms of training performance. Although its training accuracy was slightly lower, its model size and computational consumption were significantly smaller, making it highly beneficial for deployment on edge devices. Based on YOLOv7-tiny, we proposed a new model, called BCK-YOLOv7, which was specifically designed for detecting broken corn kernels.
2.3.2. BCK-YOLOv7
Figure 5 displays the network structure of the BCK-YOLOv7 model, which we have optimized for the real-time detection of broken corn kernels. Starting with the YOLOv7-tiny model, we made several improvements to enhance its performance. Specifically, the model’s positive sample matching strategy (PSMS) was adjusted, and the prior box was re-clustered to improve detection precision. Additionally, we integrated a transformer encoder block module (TEB) and a coordinate attention mechanism (CA) into the YOLOv7-tiny structure, further enhancing the model’s suitability for detecting broken corn kernels. The PSMS optimization strategy is marked in the training process of the BCK-YOLOv7 (Figure 6), and the addition positions of the TEB and CA modules can be obtained in the BCK-YOLOv7 structural model (Figure 5). For additional information on the improvements, please refer to the following section.
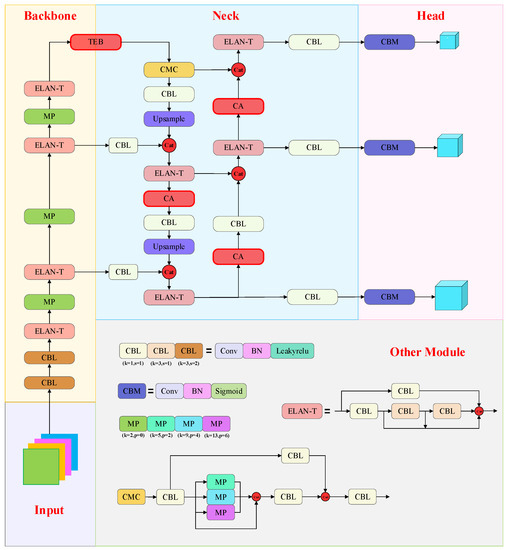
Figure 5.
BCK-YOLOv7 model network structure. TEB and CA modules are added at the end of the backbone and in the proper position of the neck, respectively.
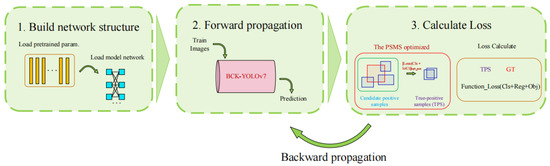
Figure 6.
The training process of BCK-YOLOv7. The PSMS is optimized in the loss calculation part.
Tuning model for broken corn kernel. When using the YOLOv7-tiny model for detecting broken corn kernels, a major challenge is the highly similar characteristics of different objects under high density. The color of whole and broken corn kernels does not differ significantly, and broken corn kernels are more challenging to judge because of the damage’s position and orientation. Therefore, the feature similarity often leads to an unreasonable distribution of positive and negative samples in the model, resulting in unfavorable information being learned by the model.
The PSMS used in YOLOv7-tiny incorporates the prior box of YOLOv5 [25] and the simOTA strategy in YOLOX [23]. It works by first identifying candidate positive samples. Then, the intersection of union (IoU) of the object ground truth and all candidate positive samples is calculated, and the simOTA strategy is used to select the top 10 candidate positive samples with the highest coincidence degree. These samples are then rounded and added to obtain the number of positive samples, k. Finally, the cost function is used to determine the k candidate positive sample frames with the smallest classification and regression loss as the final positive sample.
After conducting experiments, it was observed that the PSMS parameter threshold mentioned earlier was not suitable for the task. The primary goal of using original matching parameters is to increase the number of positive samples and balance positive and negative samples, which usually results in the calculation of three or four positive samples. However, in the case of high-density broken corn kernel detection in this study, insufficient positive samples are not the primary issue. Instead, accurately identifying broken corn kernels, which have highly similar features to whole kernels, was the key concern. Figure 7a illustrates that some positive samples determined via training using original parameters were unreasonable, leading to confusion in model training and poor detection accuracy. To address this issue, the PSMS of YOLOv7-tiny was optimized. We applied the strict principle of “rather lack than excess” and replaced Top10 with Top4 of the IoU between the object GT and candidate positive samples to obtain more precise positive samples, as shown in Figure 7b. In addition, we re-clustered the prior anchors and increased the proportion of classification loss in the cost function, while decreasing the proportion of regression loss, which mainly considered for the similarity of corn kernel characteristics and external shapes.
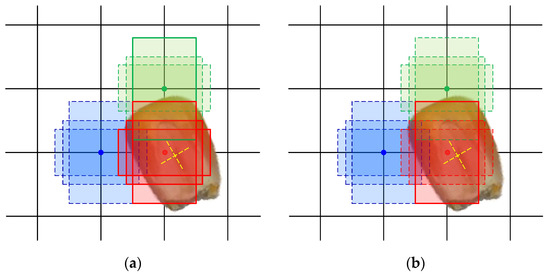
Figure 7.
The positive sample-matching results before and after parameter optimization. Different colored boxes indicate the predicted results of different grids. All the boxes are considered candidate positive samples, but only the solid-line boxes are eventually established as final positive samples. (a) The matching results of positive samples under the original parameters; despite the fact that most of the candidate boxes cannot accurately capture the characteristics of broken corn kernels, the model still determines 4 final positive samples of broken corn kernels. (b) The result of optimizing the parameters of the matching strategy proposed in this paper, where the model tries to select 1–2 optimal candidate boxes as positive samples as much as possible.
Transformer encoder block (TEB). The transformer was originally proposed to address the limitations of RNN and LSTM network models, namely short memory length and low computational efficiency, in NLP applications [26]. The introduction of the transformer encoder block (TEB) into computer vision by the vision transformer (ViT) solved the problem of image classification [27], marking the application of the transformer in computer vision. In this paper, we draw inspiration from the ViT model and incorporate TEB into the backbone tail of the YOLOv7 model to enhance its detection ability. Figure 8 shows the structure of TEB, which mainly consists of a multi-head attention layer and a feed-forward network (MLP).
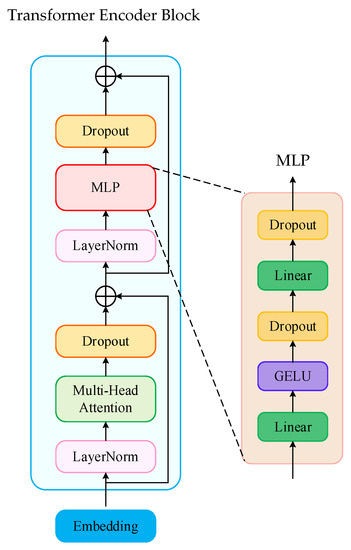
Figure 8.
The structure of the transformer encoder block, which mainly consists of a multi-head attention block and a MLP layer. Multi-head attention can help a model to pay more attention to global information, not only the current pixels. LayerNorm and Dropout layers can prevent the model from over fitting and accelerate the network convergence.
The input F1 ∈ RC×H×W is first dimensionally transformed into the TEB input F2 ∈ R(H×W)C. Then, multi-head attention can allow the model to jointly attend to information from different representation subspaces at different positions. More specifically, the correlation features between different pixels in different subspaces of corn grain images can be obtained in this paper, so as to obtain richer global information, as defined by Equation (1):
where headi = Attention(QWiQ, KWiK, VWiV); h is the number of heads; Q, K, and V represent the query matrix, key matrix, and feature matrix, respectively, and WiQ, WiQ, WiV are the corresponding mapping matrices; WO is the fusion matrix.
MultiHead(Q, K, V) = Concat(head1, …, headh)WO
MLP’s function is to extract additional features, but its benefit is that the total cost of calculation is low, and more nonlinearity is introduced. In addition, the TEB structure also adds LayerNorm and Dropout modules to simplify calculations and uses a residual structure to prevent training degradation problems [28]. Unlike the local information focus of CNNs within the receptive field size, the TEB structure enables it to obtain global information and detailed features. Thus, we believe that inserting the TEB structure behind the YOLOv7 network’s backbone structure improves its ability to gather global information.
Coordinate attention (CA). The coordinate attention (CA) module is a lightweight attention module that can be easily integrated into various deep networks with minimal additional computational overhead [29]. The structure of the CA module is illustrated in Figure 9. The CA module first performs pooling on the input F1 ∈ RC×H×W along the X and Y directions to obtain two different feature maps, Fw ∈ RC×H×1 and Fh ∈ RC×1×W. The two feature maps are fused, and dimensionally reduced to obtain the feature map f ∈ RC/r×1×(W+H). Then, f ∈ RC/r×1×(W+H) is split into two new feature maps, fw ∈ RC/r×H×1 and fh ∈ RC/r×1×w, and the final attention maps gw ∈ RC×H×1 and gh ∈ RC×1×W are obtained via dimension-boosting operations. The attention maps can be applied to the input features using weighted mapping, which highlights the areas of interest and enhances the perception of the model. The CA module can capture both channel information and position-sensitive information, making it particularly effective at performing high-density prediction tasks such as broken corn kernel detection. The output of the CA module can be defined by Equation (2):
where yc(i, j) is the output of the c-th channel at height i and width j; xc(i, j) is the input of the c-th channel at height i and width j; gch(i) is the attention weight of the c-th channel at height i; gcw(j) is the attention weight of the c-th channel at width i.
yc(i, j) = xc(i, j)×gch(i)×gcw(j)

Figure 9.
Coordinate attention module.
2.4. Evaluation Metrics
In this study, four evaluation metrics were chosen to assess the performance of the BCK-YOLOv7 model: precision (P), recall (R), mean average precision (mAP), and frames per second (FPS). P represents the ratio of correctly predicted positive samples to the total number of positive sample predictions made by the model. R represents the ratio of the number of positive samples predicted by the model to the total number of true positive samples. P and R are often used to evaluate a model’s ability to predict a specific category. mAP assesses the detection performance of the model on the entire datasets, and it is calculated as the mean of the average precision of all categories. FPS is the number of images processed by the model per second and is used to measure the detection speed. Table 3 provides a summary of the formulas and brief descriptions.
Table 3.
The evaluation metrics.
2.5. Edge Deployment of BCK-YOLOv7 Model
The BCK-YOLOv7 model, while representing an improvement compared to YOLOv7-tiny, still requires high hardware requirements for the real-time detection of broken corn kernels. To address this issue, the model is optimized and accelerated for deployment on NVIDIA Jetson Nano. The model is first converted into an intermediate representation in the ONXX format, generating a model static calculation graph. An optimized inference engine is then created using TensorRT. The TensorRT-accelerated application program runs 20~40 times faster than the CPU platform version odes. In this paper, the optimization process involves eliminating unused network layers, inter-layer fusion (convolutional layer, bias, and ReLu layer fusion), and similar tensor aggregation. TensorRT provides three optimized models of INT8, FP16, and FP32, which have different data precision, model detection precision, memory usage, and processing delay characteristics.
3. Results and Discussions
3.1. Model Training Parameters and Environment Configuration
We obtained the datasets of 438 corn kernel images, each with a resolution of 1024 × 1280. The datasets were partitioned into training, validation, and test sets with a ratio of 6:2:2. The BCK-YOLOv7 model was trained for 150 cycles, including a warm-up period of the first three training cycles. The pre-training parameters of the YOLOv7-tiny model were utilized to expedite training. To calculate the model classification and confidence loss, we employed the BCEWithLogitsLoss loss function and the CIoU loss function for the classification loss and bounding box regression loss, respectively. In addition, the Adam optimizer with an initial learning rate of 1 × 10⁻³ was used for the training model, and the batch size was set to eight. All model training and testing procedures were conducted on the same workstation (i7-12700F@2.10 GHz, with 32 GB of RAM, NVIDIA GeForce RTX 3080 with 10 GB memory), PyTorch version 3.9, and CUDA 11 was utilized for training acceleration.
3.2. Broken Corn Kernel Detection Results
To evaluate the performance of the proposed broken corn kernel detection model, BCK-YOLOv7, we conducted tests on representative corn kernel images and compared them to the original network detection results, as shown in Figure 10. The first column in Figure 10 displays the images of corn kernels to be detected, and we mark the broken corn kernels in the image with a red box. The first three images represent typical images obtained using the designed detection device, and the remaining include manually collected similar images (almost all broken or whole kernels) which are used to test the model’s generalization ability. The second and third column show the detection results of the BCK-YOLOv7 and YOLOv7-tiny models on five corn kernels images, respectively. Additionally, whole and broken corn kernels detected using the model are highlighted in yellow and green, respectively.
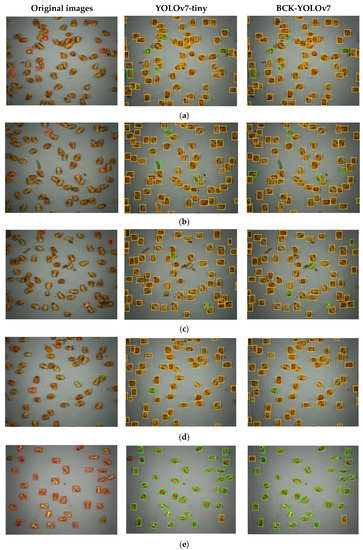
Figure 10.
Comparison of the BCK-YOLOv7 and YOLOv7-tiny models’ results for the detection of broken corn kernels. The first column is the original image of broken corn kernels marked in red, The second and third column show the detection results of YOLOv7-tiny and BCK-YOLOv7 models, respectively, and the detected whole and broken corn kernels are highlighted in yellow and green.
The first column in Figure 10 clearly shows that both the BCK-YOLOv7 and YOLOv7-tiny models exhibit high accuracy in identifying large-scale broken corn kernels, with all red-marked broken corn kernels being perfectly detected. This suggests that the YOLOv7-tiny model is a reasonable detection baseline and has certain advantages for corn kernel detection. However, as shown in the second column, the YOLOv7-tiny model’s detection performance for detecting small-scale broken corn kernels is significantly inferior to that of the improved BCK-YOLOv7 model proposed in this paper. For example, because the broken corn kernels on both sides of the second image are either pointing downward or have considerable wear, their characteristics are indistinct. It is extremely difficult for the YOLOv7-tiny models to identify between broken and whole corn kernels. However, the improved BCK-YOLOv7 model can still accurately detect them.
In the third row, the improved BCK-YOLOv7 model still exhibits high recognition accuracy for detecting broken corn kernels in environments with more impurities, with the only shortcoming being that it misidentifies a round-headed whole corn kernel as a broken kernel. We think this is mainly due to the small proportion of round corn kernels in actual harvest environments and their similar shape and appearance to those of broken kernels. Nevertheless, the detection performance of the improved BCK-YOLOv7 model is significantly better than that of the YOLOv7-tiny model. The latter not only exhibits misdetection and missed detection of corn kernels, but also mistakenly identifies many corn cobs that adhere to corn kernels as corn kernels (the similar situation is found in the second image). We attribute this to the positive sample matching strategy mentioned in Section 2.3.2, which distributes a large number of unreasonable positive samples to broken corn kernels, causing confusion during model training and making convergence difficult, ultimately resulting in overfitting.
Moreover, the results of the model generalization ability test demonstrate that the improved BCK-YOLOv7 model still exhibits excellent detection performance, despite the differences between the test corn kernel detection image and the distribution of kernel categories in the training and verification set images. In conclusion, Figure 10 clearly confirms the accurate detection performance of BCK-YOLOv7 on broken corn kernels. Whether identifying large and small-scale defective corn kernels, or the environment with many impurities, the improved BCK-YOLOv7 model consistently achieves ideal recognition results and can almost completely identify all broken corn kernels.
3.3. Ablation Experiments
We carried out a number of ablation experiments to evaluate the effectiveness of the improvement strategies proposed in this study to improve the performance of the BCK-YOLOv7 model. Table 4 displays the pertinent results of the ablation experiment performed under the same settings. The BCK-YOLOv7 model proposed in this paper has P, R and mAP values of 96.9%, 97.5% and 99.1% on the detection results of intact and broken corn kernels, which is better than other research results of the detection of broken corn kernels [10,17]. This shows the effectiveness and superiority of the BCK-YOLOv7 model proposed in this paper at performing the task of detecting broken corn kernels Next, we analyze the importance of each proposed improvement strategy.
Table 4.
The result of ablation studies on corn kernels datasets.
The importance of tuning the model. To improve the detection performance of the YOLOv7-tiny model for broken corn kernels, we used fine-tuning parameters, which involved re-clustering a more appropriate prior anchor, strictly adjusting the threshold of the matching strategy parameters of positive samples, and increasing the weight of classification loss. Table 4 shows that after fine-tuning, the model’s detection performance improved, with an increase in mAP of 1.8%, and in precision and recall values of more than 3.0%.
The effect of transformer encloder block. Table 4 indicates that the addition of the transformer block encode (TBE) module at the end of the backbone part of the YOLOv7-tiny model improved precision and mAP. However, the recall and parameter values are not ideal, with the model parameter doubling. As a result, we only added a transformer block encode module in this study, as an excessively large model was not desired. Nonetheless, adding the TBE module did enhance the overall detection performance of the model.
The impact of the attention mechanism. To evaluate the effectiveness of the attention mechanism, we conducted a visualization of the feature maps generated by the model before and after integrating the channel attention (CA) module. As illustrated in Figure 11, the CA module demonstrated a remarkable ability to locate the region of interest. Obviously, after adding the CA module, the area of interest of the model is mainly concentrated in the center of the corn kernel, and the ability to focus on broken corn kernels is also improved. This improvement is also evident in the model detection indicators, as the addition of the CA attention module resulted in a 1.9% increase in recall and a 0.4% increase in mAP. Furthermore, the incorporation of the CA module did not significantly increase computational consumption. Overall, these results highlight the positive impact of the attention mechanism on the model’s detection performance for broken corn kernels.
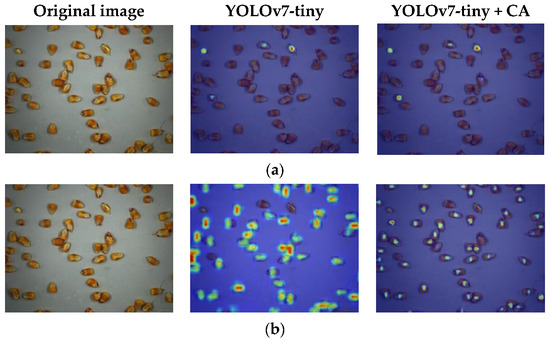
Figure 11.
Results of the comparison of the ROI location for YOLOv7-tiny and YOLOv7-tiny + CA. (a) Region of interest for broken corn kernels; (b) region of interest for whole corn kernels.
3.4. Model Deployment
The FP16 optimization mode, which considers both accuracy and efficiency, was chosen for model acceleration after the experiment. The results of the optimization showed that, while the accuracy only decreases by approximately 1%, the inference speed of the model deployed with the NVIDIA Jetson TX2 edge device approaches 33 FPS, which is about two times faster than that previously. The results of various optimization modes are shown in Table 5.
Table 5.
The results of various optimization modes.
3.5. System Experiment
We deployed the BCK-YOLOv7 model optimized and accelerated by TensorRT to NVIDIA Jetson Nano on 6 December 2022, and installed it at the auger opening for the simulation experiment. A continuous stream of mixed whole and broken corn kernel samples were fed into the auger, and the detection device captured corn kernel images in real time (FPS = 32). These images were then transmitted to the edge industrial computer to perform the detection work. To assess the performance of the entire detection system in measuring corn kernel breakage, we used a simple calculation method for quantification, namely Qb = Nb/Nb+w × 100%. Qb stands for the corn kernel broken rate, while the number of broken corn kernels and the total number of corn kernels are represented by Nb and Nb+w, respectively.
We manually calculated the breakage rate of the experimental corn kernel samples finding this to be 4.58% and evaluated the system’s ability to detect the breakage rate by comparing system detection results to those of manual detection. To minimize the impact of errors on test results, we continually detected and computed the breakage rate of give images of corn kernels as the system’s single detection result. The results of the system’s continuous detection of 20 groups of corn kernel breakage rates are displayed in Table 6. The findings indicate that the system’s identified average breakage rate for corn is 4.87%, and the mean absolute deviation is 0.35%. This demonstrates the system’s high level of dependability. Furthermore, Figure 12 makes it clearly evident that the results of the system detection fluctuate around the real value and are slightly bigger than the real value as a whole. We think that this is mostly due to the fact that there are not enough corn kernels in each image, which leads broken corn kernels to have a higher influence on the breakage rate. Nevertheless, the detection error of corn kernel breakage rate in the system can be controlled at about 0.35%, and the time for a single output result can be compressed to within 165 ms, which is quite excellent.
Table 6.
Comparison of the Qb values calculated by the system and manually.
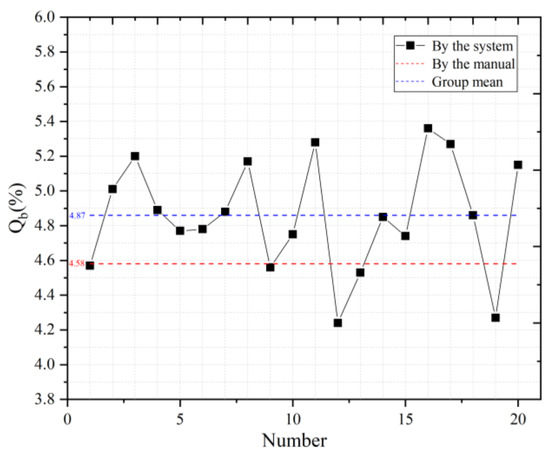
Figure 12.
The system detection results of 20 groups of broken corn kernels.
4. Conclusions
This study addresses the challenge of detecting broken corn kernels in real time in the complex working environment of corn harvesters. To achieve the high-precision and low-latency identification of broken corn kernels, we propose a broken corn kernel detection system based on deep learning. The system combines an image acquisition hardware device with a deep learning algorithm for the accurate and efficient identification of broken corn kernels. The image acquisition device developed in this paper ensures the conversion of the disordered grain flow into a plane steady flow, providing high-quality images for the accurate identification of broken kernels. Our biggest contribution is the fine tuning of the sample-matching strategy of the YOLOv7 model, adding the transformer encode block module and the coordinate attention mechanism, and proposing the BCK-YOLOv7 model to detect broken corn kernels. The improved model solves the challenge of identifying non-obvious or highly similar broken corn kernels under high density. Ablation tests show significant improvement in the detection performance of the BCK-YOLOv7 model, with recognition accuracy and recall rates of 96.9% and 97.5%, respectively, and an average accuracy rate of 99.1%. To optimize the model for edge devices, we use TensorRT to accelerate the BCK-YOLOv7 model in the FP6 mode, approaching an interference speed of 33 FPS. Our system simulation experiment shows that the broken corn kernel monitoring data of the visual detection system proposed in this paper fluctuates around the artificial statistical results, with the mean absolute deviation being 0.35%, indicating the effectiveness of our proposed system at monitoring corn kernel breakage.
It should be mentioned that the work performed for this paper only focuses on single-sided corn kernel detection and cannot judge the status of the other surfaces. Future work will focus on full-surface corn kernel detection to improve detection accuracy. Additionally, more detection classes are also our key considerations.
Author Contributions
Conceptualization, D.G. and Q.W.; methodology, Q.W.; software, Q.W.; validation, H.Y., D.Y. and C.Z.; formal analysis, Q.H.; investigation, Q.W.; resources, C.Z.; data curation, Q.H.; writing—original draft preparation, Q.W.; writing—review and editing, D.G.; visualization, Q.W.; supervision, H.Y.; project administration, D.G.; funding acquisition, D.G. All authors have read and agreed to the published version of the manuscript.
Funding
This research was funded by the National Key R&D Program of China, grant number 2021YFD2000502, the Natural Science Foundation of Shandong Province, grant number ZR2022ME064, and the Modern Agricultural Industrial System of Shandong Province, grant number SDAIT-02-12.
Data Availability Statement
Not applicable.
Acknowledgments
We are grateful to Jie Ma for corn kernel data.
Conflicts of Interest
The authors declare no conflict of interest.
References
- Wang, Q.; Chen, Y. Advantages Analysis of Corn Planting in China. J. Agric. Sci. Tech. China 2018, 20, 1–9. [Google Scholar]
- Xie, R.-Z.; Ming, B.; Gao, S.; Wang, K.-R.; Hou, P.; Li, S.-K. Current state and suggestions for mechanical harvesting of corn in China. J. Integr. Agric. 2022, 21, 892–897. [Google Scholar] [CrossRef]
- Guo, Y.-N.; Hou, L.-Y.; Li, L.-L.; Gao, S.; Hou, J.-F.; Ming, B.; Xie, R.-Z.; Xue, J.; Hou, P.; Wang, K.-R.; et al. Study of corn kernel breakage susceptibility as a function of its moisture content by using a laboratory grinding method. J. Integr. Agric. 2022, 21, 70–77. [Google Scholar] [CrossRef]
- Velesaca, H.O.; Suárez, P.L.; Mira, R.; Sappa, A.D. Computer vision based food grain classification: A comprehensive survey. Comput. Electron. Agric. 2021, 187, 106287. [Google Scholar] [CrossRef]
- Sen, N.; Shaojin, M.; Yankun, P.; Wei, W.; Yongyu, L. Research Progress of Rapid Optical Detection Technology and Equipment for Grain Quality. Nongye Jixie Xuebao/Trans. Chin. Soc. Agric. Mach. (China) 2022, 53, 1–12. [Google Scholar]
- Birla, R.; Chauhan, A.P.S. An Efficient Method for Quality Analysis of Rice Using Machine Vision System. J. Adv. Informat. Technol. 2015, 6, 140–145. [Google Scholar] [CrossRef]
- Singh, K.R.; Chaudhury, S. Efficient technique for rice grain classification using back-propagation neural network and wavelet decomposition. IET Comput. Vis. 2016, 10, 780–787. [Google Scholar] [CrossRef]
- Zhu, X.; Du, Y.; Chi, R.; Deng, X. Design of On-line Detection Device for Grain Breakage of Corn Harvester Based on OpenCV. In Proceedings of the 2019 ASABE Annual International Meeting. American Society of Agricultural and Biological Engineers, Boston, MA, USA, 7–10 July 2019. [Google Scholar] [CrossRef]
- Chen, J.; Lian, Y.; Zou, R.; Zhang, S.; Ning, X.; Han, M. Real-time grain breakage sensing for rice combine harvesters using machine vision technology. Int. J. Agric. Biol. Eng. 2020, 13, 194–199. [Google Scholar] [CrossRef]
- Wu, K.; Zhang, M.; Wang, G.; Chen, X.; Wu, J. A Continuous Single-Layer Discrete Tiling System for Online Detection of Corn Impurities and Breakage Rates. Agriculture 2022, 12, 948. [Google Scholar] [CrossRef]
- Kar, A.; Kulshreshtha, P.; Agrawal, A.; Palakkal, S.; Boregowda, L.R. Annotation-free Quality Estimation of Food Grains using Deep Neural Network. BMVC 2019, 52, 1–12. [Google Scholar]
- Velesaca, H.O.; Mira, R.; Suarez, P.L.; Larrea, C.X.; Sappa, A.D. Deep Learning based Corn Kernel Classification. In Proceedings of the IEEE/CVF Conference on Computer Vision and Pattern Recognition Workshops, Seattle, WA, USA, 14–19 June 2020; pp. 66–67. [Google Scholar]
- Rasmussen, C.B.; Kirk, K.; Moeslund, T.B. Anchor tuning in Faster R-CNN for measuring corn silage physical characteristics. Comput. Electron. Agric. 2021, 188, 106344. [Google Scholar] [CrossRef]
- Liu, Z.; Wang, S. Broken Corn Detection Based on an Adjusted YOLO With Focal Loss. IEEE Access 2019, 7, 68281–68289. [Google Scholar] [CrossRef]
- Zhang, Q.; Hu, J.; Xu, L.; Cai, Q.; Yu, X.; Liu, P. Impurity/Breakage Assessment of Vehicle-Mounted Dynamic Rice Grain Flow on Combine Harvester Based on Improved Deeplabv3+ and YOLOv4. IEEE Access 2023, 11, 49273–49288. [Google Scholar] [CrossRef]
- Liu, L.; Du, Y.; Chen, D.; Li, Y.; Li, X.; Zhao, X.; Li, G.; Mao, E. Impurity monitoring study for corn kernel harvesting based on machine vision and CPU-Net. Comput. Electron. Agric. 2022, 202, 107436. [Google Scholar] [CrossRef]
- Li, X.; Du, Y.; Yao, L.; Wu, J.; Liu, L. Design and Experiment of a Broken Corn Kernel Detection Device Based on the Yolov4-Tiny Algorithm. Agriculture 2021, 11, 1238. [Google Scholar] [CrossRef]
- Munappy, A.; Bosch, J.; Olsson, H.H.; Arpteg, A.; Brinne, B. Data management challenges for deep learning. In Proceedings of the 2019 45th Euromicro Conference on Software Engineering and Advanced Applications (SEAA), Kallithea, Greece, 28–30 August 2019; pp. 140–147. [Google Scholar]
- Whang, S.E.; Lee, J.-G.; Kaist, S.E.W.; Kaist, J.-G.L. Data collection and quality challenges for deep learning. Proc. VLDB Endow. 2020, 13, 3429–3432. [Google Scholar] [CrossRef]
- GB 1353-2018; Maize. State Administration for Standardization of China: Beijing, China, 2018.
- GB/T 5494-2019; Inspection of Grain and Oils—Determination of Foreign Matter and Unsound Kernels of Grain and Oilseeds. State Administration for Standardization of China: Beijing, China, 2019.
- Bochkovskiy, A.; Wang, C.-Y.; Liao, H.-Y.M. Yolov4: Optimal speed and accuracy of object detection. arXiv 2020, arXiv:2004.10934. [Google Scholar]
- Ge, Z.; Liu, S.; Wang, F.; Li, Z.; Sun, J. Yolox: Exceeding yolo series in 2021. arXiv 2021, arXiv:2107.08430. [Google Scholar]
- Wang, C.-Y.; Bochkovskiy, A.; Liao, H.-Y.M. YOLOv7: Trainable bag-of-freebies sets new state-of-the-art for real-time object detectors. arXiv 2022, arXiv:2207.02696. [Google Scholar]
- Jocher, G.; Stoken, A.; Borovec, J.; Chaurasia, A.; Changyu, L. ultralytics/yolov5. Github Repository, YOLOv5. 2020. Available online: https://github.com/ultralytics/yolov5 (accessed on 21 June 2023).
- Vaswani, A.; Shazeer, N.; Parmar, N.; Uszkoreit, J.; Jones, L.; Gomez, A.N.; Kaiser, Ł.; Polosukhin, I. Attention is all you need. arXiv 2017, arXiv:1706.03762. [Google Scholar]
- Dosovitskiy, A.; Beyer, L.; Kolesnikov, A.; Weissenborn, D.; Zhai, X.; Unterthiner, T.; Dehghani, M.; Minderer, M.; Heigold, G.; Gelly, S. An image is worth 16×16 words: Transformers for image recognition at scale. arXiv 2020, arXiv:2010.11929. [Google Scholar]
- He, K.; Zhang, X.; Ren, S.; Sun, J. Identity Mappings in Deep Residual Networks. In European Conference on Computer Vision; Springer: Cham, Switzerland, 2016; pp. 630–645. [Google Scholar]
- Hou, Q.; Zhou, D.; Feng, J. Coordinate attention for efficient mobile network design. In Proceedings of the IEEE/CVF Conference on Computer Vision and Pattern Recognition, Nashville, TN, USA, 20–25 June 2021; pp. 13713–13722. [Google Scholar]
Disclaimer/Publisher’s Note: The statements, opinions and data contained in all publications are solely those of the individual author(s) and contributor(s) and not of MDPI and/or the editor(s). MDPI and/or the editor(s) disclaim responsibility for any injury to people or property resulting from any ideas, methods, instructions or products referred to in the content. |
© 2023 by the authors. Licensee MDPI, Basel, Switzerland. This article is an open access article distributed under the terms and conditions of the Creative Commons Attribution (CC BY) license (https://creativecommons.org/licenses/by/4.0/).