Abstract
In citrus cultivation, it is a difficult task for farmers to classify different pests correctly and make proper decisions to prevent citrus damage. This work proposes an efficient modified lightweight transfer learning model which combines the effectiveness and accuracy of citrus pest characterization with mobile terminal counting. Firstly, we utilized typical transfer learning feature extraction networks such as ResNet50, InceptionV3, VGG16, and MobileNetV3, and pre-trained the single-shot multibox detector (SSD) network to compare and analyze the classification accuracy and efficiency of each model. Then, to further reduce the amount of calculations needed, we miniaturized the prediction convolution kernel at the end of the model and added a residual block of a 1 × 1 convolution kernel to predict category scores and frame offsets. Finally, we transplanted the preferred lightweight SSD model into the mobile terminals developed by us to verify its usability. Compared to other transfer learning models, the modified MobileNetV3+RPBM can enable the SSD network to achieve accurate detection of Panonychus Citri Mcgregor and Aphids, with a mean average precision (mAP) up to 86.10% and the counting accuracy reaching 91.0% and 89.0%, respectively. In terms of speed, the mean latency of MobileNetV3+RPBM is as low as 185 ms. It was concluded that this novel and efficient modified MobileNetV3+RPBM+SSD model is effective at classifying citrus pests, and can be integrated into devices that are embedded for mobile rapid detection as well as for counting pests in citrus orchards. The work presented herein can help encourage farm managers to judge the degree of pest damage and make correct decisions regarding pesticide application in orchard management.
1. Introduction
Horticultural management faces the problem of identifying and classifying pests. Citrus yield and quality are adversely affected by pest damage, which occurs frequently [1]. Due to its complex structure and the high similarity in appearance between different species [2,3], pest classification is a challenging task. To prevent the transmission of pests that cause citrus diseases, it is necessary to identify and classify pests as soon as possible in crops and to select pesticides and biological prevention methods that are effective.
Manual capture and sampling methods for pest identification are ineffective, laborious, and labor-intensive. Commonly, methods for detecting pests that utilize physical information technology, including the acoustic detection method [4,5], electronic nose technology [6,7], and spectral imaging technology [8,9], have spatial and temporal limitations when used in complex orchard environments. As a result of the breakthrough development in target detection and recognition technology due to the upgrading of computer hardware and deep learning technologies, it is gradually becoming possible to use digital image technology to accurately analyze pest images and understand the degree of pest damage [10,11]. To overcome the limitations of traditional detection methods, the development of a visual computerized system using machine learning for image processing for the accurate classification and identification of pests will gradually become a trend in the field of agricultural research [12].
In recent years, the CNN-based deep learning model, as a class of powerful image classification tools, has been widely applied to various problems in the agricultural industry, including for the identification of plant diseases [13], the classification of fruits [14], weed identification [15], and the classification of pests in crops [16]. Li et al. [17] put forward a detection method for pests associated with rape that relied on a deep convolutional neural network, which achieved the rapid and accurate detection of five rape pests, including Aphids, cabbage caterpillar larvae, rape bugs, flea beetles, and Phaedon brassicae Baly, with an average accuracy of 94.12%. Kuzuhara et al. [18] proposed a two-stage pest detection and identification technique utilizing enhanced convolutional neural networks and using the Xception model to re-identify the CNN output.
The single-shot multibox detector (SSD) model prioritizes inference speed and can guarantee better accuracy. It has become the model of choice for many mobile target recognition researchers. He et al. [19] designed a rapeseed pest imaging system and developed a supporting Android application based on the SSD model, which can be combined with UAV and Internet of Things technology to monitor rapeseed pests. In addition, there are many cases of detection systems similar to those designed by He [20,21]. The accuracy of plant species identification was improved by using Google Net, AlexNet, and VGGNet models in [22]. Khan et al. [23] conducted an intensive pre-training SSD model to extract depth features to classify six kinds of ale and banana fruit diseases to improve classification accuracy and the degree of accuracy. In [24], an SSD network analyzed complex pest images to determine powerful local features. Therefore, the classification of 12 important rice field pests with a high average accuracy was achieved. However, the above cases of pest detection have only remained in the aspect of model building and have not realized specific applications. To this end, it is particularly urgent to design a mobile pest imaging system combined with the SSD model to realize intelligent pest monitoring.
In this paper, we take citrus trees as the research object and Panonychus citri Mcgregor (PCM) and Aphids as the detection objects. We combine several typical transfer learning models, pre-train the SSD network, compare and analyze the classification accuracy and efficiency of each model, and select the best model, which can effectively alleviate the problem of a poor model effect caused by insufficient training samples, and can be adapted to the detection of various diseases. The contribution of this paper is as follows:
- We compare the latest MobileNet, GoogLeNet, ReseNet and VGGNet feature extraction networks, and optimize the best feature extraction network to further improve the detection speed and accuracy of the SSD.
- Before the model performs prediction, we add a miniaturized residual block of a 1 × 1 convolution kernel to each feature map used for prediction to predict category scores and frame offsets.
- The effective modified MobileNetV3-SSD model is transplanted into the embedded terminal developed by us to realize the rapid monitoring of pests.
Citrus plantations are investigated using a rapid detection method to obtain pest information, which is of great significance for the identification of citrus pests and provides a theoretical basis for the precise management of the orchard and the design of accurate fertilization and application equipment.
2. Materials and Methods
2.1. Datasets of Pests
The dataset images were collected on 13 October 2021 at the selenium-enriched navel orange planting base in Yongzhou, Hunan Province, China (26°22′40″ N, 111°46′28″ E), as this is a high incidence period for PCM and Aphids. The weather was clear and sunny that day. During sampling, a CMOS camera (Sony ILCE-7RM4A, Sony Corporation, Tokyo, Japan) was used as the sampling tool to acquire image data with a single citrus tree as the basic unit, and a total of 100 citrus tree images were collected. In consideration of a sampling equilibrium, five locations in the middle of citrus trees were selected as sampling points: front (A), back (C), left (D), right (B), and top (E). The sampling diagram is shown in Figure 1. In total, 1000 images were collected for the two types of pests, and the size of the images was uniformly adjusted to 224 × 224 pixels after preprocessing. To enhance the network model’s accuracy in detecting anomalies, clipping, rotation, translation, and other methods were adopted to enhance the dataset images, and the two pest datasets were amplified to a total of 5000 images.
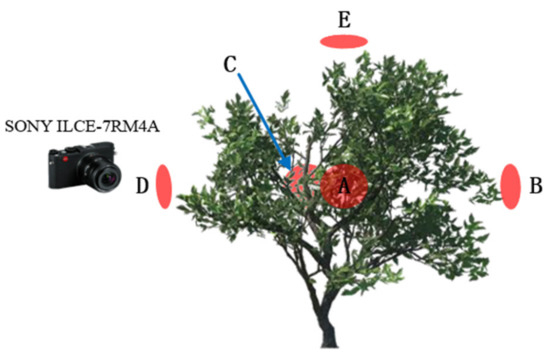
Figure 1.
Sampling diagram. (A, B, C, D, and E represent the front, right, back, left, and top positions of the canopy of citrus trees, respectively, and are the positions for data collection).
LabelImg software “https://github.com/heartexlabs/labelImg (accessed on 25 June 2023)” was used to label the preprocessed pest images, and an xml data source file was generated. The labeled 10,000 sample images were split into three datasets, the training set, validation set, and test set, which were assigned randomly at a proportion of 8:1:1.
2.2. Modified SSD
The classic SSD network is a one-stage target detection network modeled after YOLO. It was proposed to improve the rough design of the anchor set by the YOLO network. It is designed using mainly multi-scale and multi-aspect ratio dense anchor points and a feature pyramid network. The SSD model is based on the base network of VGG16 and ends with several newly added layers. Instead of using the last feature map of ConvNet, it uses the multiple layers in a pyramidal feature hierarchy of ConvNet to predict objects with different scales, which is very beneficial for imaging PCM and aphid targets of various sizes as in our datasets. In this paper, under the premise of ensuring accuracy, to reduce the amount of model parameters and improve the detection speed, we will improve the SSD model from two aspects: feature extraction network optimization and prediction convolution kernel miniaturization.
2.2.1. Optimization of Feature Extraction Networks
The original SSD is based on VGG16 and is a feature to extract the backbone network. However, with the development of the transfer learning model structure, pre-training models are becoming more abundant. To optimize the best feature extraction network, we chose the ResNet50 model of the ResNet series and the InceptionV3 model of the GoogLeNet series for validation. However, the above three models have complex structures and parameters that are too large, making them difficult to apply in mobile or embedded devices. MobileNetV3 has outstanding structural lightweight features and has obvious advantages under the premise that embedded systems require model simplification. To this end, we chose the latest MobileNetV3 model as the fourth comparison network and trained it on the datasets in combination with the SSD framework for comparing the detection performance of each model.
- 1
- VGG16
In the Network of Visual Geometry Groups [25], the structure depth is extended to 16 layers by using a very small (3 × 3) convolution filter. Two completely connected layers are formed by successive 3 × 3 convolutions and 2 × 2 maximum pool layers in the VGG model. The softmax output of is the last layer. The VGG16 model structure is displayed in Figure 2.
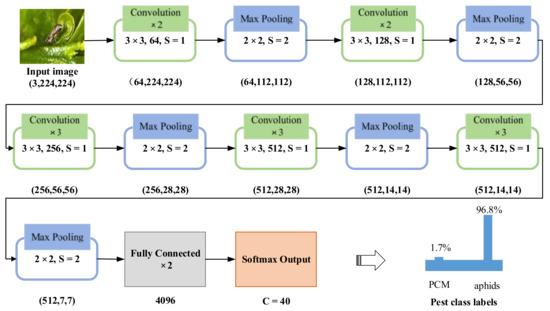
Figure 2.
VGG16 model (S-Stride).
- 2
- ResNet
The deep residual network, also known as ResNet, provides a direct path for information dissemination throughout the entire network by virtue of the deep structure of the system [26]. Due to improvements at the network level, the performance and accuracy of the deep network decline rapidly. The gradient disappears in RESNET during backpropagation. The parasitic neural network has a fast (or jumping) connection with a normal period, which allows it to understand global characteristics. Quick connections can be added immediately after multiple weight layers. During training, the network can skip unnecessary layers and optimize the number of correction layers to increase the speed of the process. Mathematically, conclusion H(x) can be expressed as follows:
Weights are learned from residual mappings, as shown in the following equation:
where layers of nonlinear weights are represented by F(x).
In this paper, we evaluated the ResNet50 residual network model for cropland pest classification. The Resnet50 model consists of 50 parameter layers on a deep spool network. As shown in Figure 3, these parameters are associated with the transition through the learning cycle. There are 7 × 7 volumes, 64 cores, 3 × 3 layers in the maximum pool, 2 steps, 16 remaining blocks, 7 × 7 layers in the intermediate pool, 7 × 7 layers in interval 7, and a softmax output layer before the connection is completed. A softmax output level of 2 represents the number of aggregated pests.
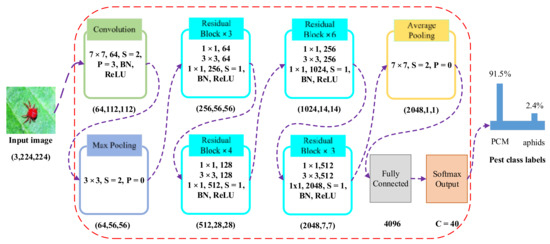
Figure 3.
Transfer learning architecture with modified ResNet50 model (BN—batch normalization, S—stride, and P—padding).
- 3
- GoogLeNet
GoogLeNet [27] is a depth model that uses a CNN. Using this model, knowledge transfer learning has improved computing efficiency and produced good results in a variety of fields [28,29]. In total, the GoogLeNet architecture comprises twenty-two deep elements, including two volumes, four largest pools, nine linear encapsulation modules, and an intermediate pool used in the final linear encapsulation module (Figure 4). Each inception module uses 1 × 1 convolution, and a dimensionality reduction operation is performed before the multi-dimensional 3 × 3 and 5 × 5 convolutions. In GoogLeNet, since an efficient inception model can be implemented with very small convolutions, the number of parameters is reduced. Compared to AlexNet, the computational cost is two times less.
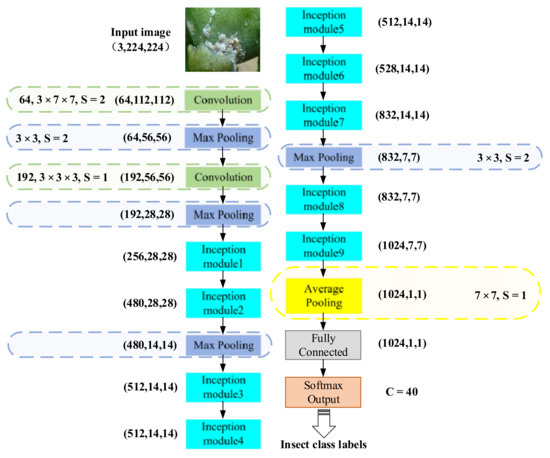
Figure 4.
GoogLeNet architecture using transfer learning (S—stride).
- 4
- Modified MobileNetV3
CNN networks for mobile terminals have experienced rapid growth over the past few years. From 2017 to 2019, three versions of a mobile network were continuously improved in terms of architecture. MobileNetV1 [30] was developed based on the conventional VGG architecture combined with depth-separable convolutions. After one year since the introduction of MobileNetV2 [31], there has been a linear bottleneck and an inverse residual characteristic. As MobileNetV3 was developed with NAS and NetAdapt optimization, expensive layers were discarded, and the nonlinear functions of h-swish were replaced by ReLU, which is a modified version of swish nonlinearity with a faster calculation speed and better quantization effect. The main idea is to use the piecewise linear hard analog to replace the sigmod, where the nuance occurs in the use of ReLU6 instead of regular clipping constants. Therefore, h-swish is defined as follows [32]:
First of all, judging from the actual measurement results, using ReLU6 optimization is applicable to almost all software and hardware frameworks. Second, in quantized mode, it removes the potential loss of numerical precision caused by different implementations of the approximate sigmoid. Finally, in practice, h-swish can be implemented as a piecewise function that reduces the number of memory accesses, thus greatly reducing the latency cost.
In addition, MobileNetV3 introduces the SE module after the 3 × 3 depth-separable convolution in the inverse residual module, and firstly performs global pooling compression (Squeeze) to obtain a 1 × 1 × C vector. Then, after two “fully connected layer-activation (Excitation)” operations (in order to reduce the calculation time, the number of output channels of the first “fully connected layer-activation” operation is compressed to 1/4 of the original), it outputs the 1 × 1 × C vector. Finally, the obtained vector is bitwise multiplied with the result of the depthwise separable convolution to adjust the weight of each channel to improve the network accuracy. In the design of the overall network structure of MobileNetV3, firstly, the NAS algorithm is used to search and optimize the network structure (such as the arrangement and structure of blocks in the network) to obtain the general network structure, and finally, the NetAdapt algorithm is used to determine the number of channels for each filter. Figure 5 shows the MobileNetV3 architecture for feature extraction from citrus pest images.
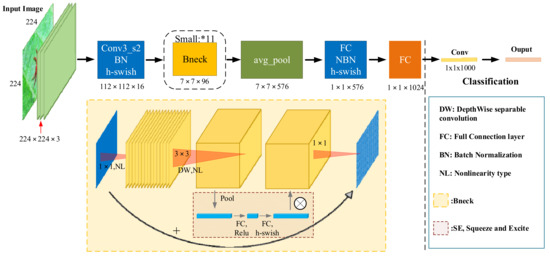
Figure 5.
Modified MobileNetV3 architecture.
2.2.2. Predictive Convolution Kernel Miniaturization
Through the analysis of [33], it was found that the accuracy of the model using the 1 × 1 convolution kernel of the SSD network residual block is not much different from the accuracy of the model when using the 3 × 3 convolution kernel, but it can greatly reduce the calculation cost. Before the model performs prediction, we added a residual block of a 1 × 1 convolution kernel to each feature map used for prediction to predict category scores and frame offsets. We named it residual prediction block miniaturization (RPBM), and its structure is shown in Figure 6.
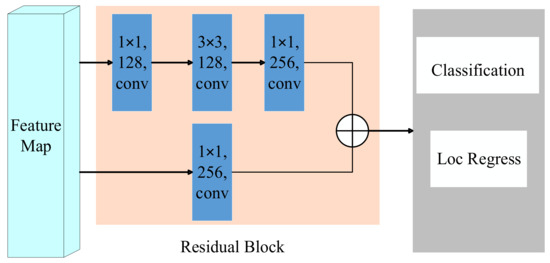
Figure 6.
Miniaturized residual prediction network.
2.2.3. Model Training Environment
Hardware configuration: The TIntel E5-2660 processor is a single-core device, with a memory size of 32 GB. The graphics processor used was a 3070ti graphics card (NVIDIA Corporation, Santa Clara, CA, USA).
Software environment: The OS used was Version 16.04 of Ubuntu, the integrated development environment was Anaconda3, and TensorFlow was used as the deep learning framework.
2.2.4. Model Evaluation Indicators
To objectively evaluate the characteristics of a variety of feature networks, this article evaluates from four perspectives: algorithm running speed, the number of model parameters, accuracy rate (AR), and mean average precision (mAP).
Usually, the time required for a classifier to train and predict an image is the computational time, which is also called latency [34]. To minimize the error, the mean of latency (moL) for multiple images was used as the speed indicator in this manuscript.
The number of model parameters is one of the important indicators for embedded devices to run deep learning models [35]. The weight parameters of each layer were added to obtain the total number of parameters, in which the model parameters were stored as a floating point type and the model parameters were obtained by calculating with 4 bytes.
The correct rate of sample indicates how many samples were included correctly in the total number of samples. A classification is generally better if the correct rate is more high. Therefore, a true positive implies that the number of positive samples is predicted to be the number of true positive samples. The number of negative samples is predicted to be the number of true negative samples. In false positives, the number of negative samples is predicted to be the number of positive samples. When a false negative occurs, the number of positive samples is predicted to be the number of negative samples. As a result, the AR can be expressed as follows [36]:
There are some instances in which a high accuracy rate is not enough to indicate that the performance of the algorithm is excellent, so mAP is introduced as a measurement index. As a result of target recognition, each class can draw a recall line that is accurate and fast. AP represents the area under the curve, whereas the map represents the average of multiple test lines’ AP, and its calculation formula is as follows [37]:
where represents the number of validation sets and represents a certain validation set.
The counting accuracy (CA) indicator is mainly used to record the correct identification and number of pest species counted by the detector. The correct identification of the pest species refers to the condition of predicting correct positive samples, and the calculation formula of its percentage in the actual total samples (true positive rate—TPR) is as follows:
Correct counting means that the number of a certain type of pest in the statistical sample is consistent with the actual number of this type of pest in the sample. We assume that the percentage of the number of samples with correct identification and counting of the pest species in the total number of samples is PP, and the percentage of the number of samples with correct identification of pest species but incorrect counting in the total number of samples is PN, then the formula for the counting accuracy rate is as follows:
2.3. Pest Detection Embedded Mobile System
To verify the usability of the above transfer learning model in embedded devices, we developed a citrus pest detector (Figure 7). The detector includes a processor, a high-definition camera (resolution: 1280 × 960 pixels, model: RER-USB4KHDR01, manufacturer: REVISION), a Beidou (Beidou Navigation Satellite System, BDS) positioning module, a LoRa communication module and a display module. The processor is a K510 AI chip (Beijing Canaan Jess Information Technology Co., Ltd., Beijing, China). The trained SSD model stored data using the memory of the K510 processor.
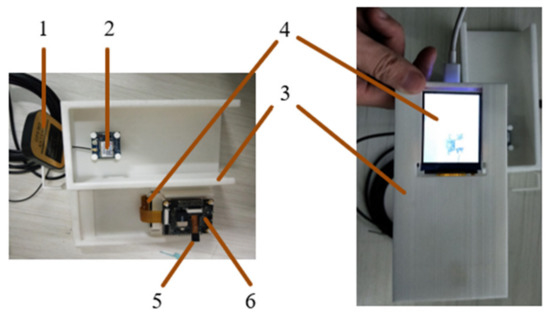
Figure 7.
Citrus pest detector (1. BDS module; 2. LoRa; 3. package shell; 4. LCD screen; 5. camera; 6. K510 AI controller).
Regarding the model deployment process, first, we converted the PyTorch model into a model described by the Open Neural Network Exchange (ONNX) intermediate representation and formed an .onnx file, which contains the name and data type of the model input and output. Next, we used the inference engine-ONNX Runtime to run the .onnx file to complete model deployment.
The software workflow of the detector is shown in Figure 8. Firstly, the pest image information is obtained through the camera. After preprocessing, the trained modified SSD embedded in K510 is used to identify whether there are pests. For images with pests, feature extraction and classification are performed to identify the type and to count the pests. Then, the location information is obtained through the BDS module, and output is displayed with the pest identification results. Finally, the detection information is sent to the server through the LoRa communication module, which is convenient for users to predict the development trend of pests, and thus facilitate the overall control and prevention of pests.
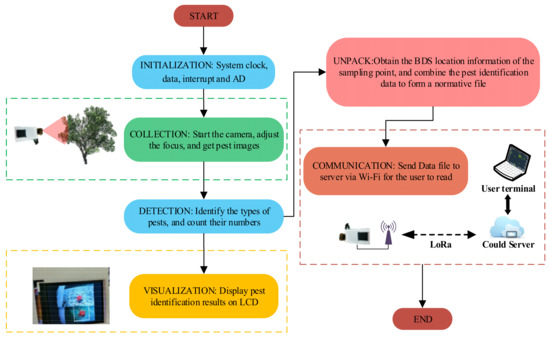
Figure 8.
Detector software flow chart.
3. Results
We evaluated the modified SSD model on our PCM and aphid datasets. we analyzed the model training process and compared various feature extraction networks such as ResNet50, InceptionV3, VGG16, MobileNetV3, and modified MobileNetV3, and optimized the best feature extraction model. In order to verify the advantages of the modified SSD model in reducing the amount of computations needed and improving the accuracy, we compared the modified SSD model with other popular frameworks. Finally, we transplanted our model into the embedded detector that we developed, and analyzed its accuracy and efficiency.
3.1. Results of Citrus Pest Identification Model
3.1.1. Analysis of Model Training Process
Two kinds of pest training set and validation set sample data were selected for training, and changes to the loss function in the first 40 epochs were recorded, as shown in Figure 9. In the first 10 iterations, the loss of the training sets and the validation sets decreased rapidly, and then gradually stabilized between 10 and 25 iterations, indicating that no more features could be obtained. After 25 iterations, there was no change in the loss of training sets, but there was a slow and fluctuating increase in the loss of test sets, indicating that an overfitting phenomenon occurred; in other words, the model becomes too strict to ideally suit the features of the training sets, which causes the model to deviate from reality. In order to prevent the occurrence of over-fitting, an appropriate number of iterations should be selected, or a weight decay method should be used, that is, a small factor is used to reduce the weight during each epoch.
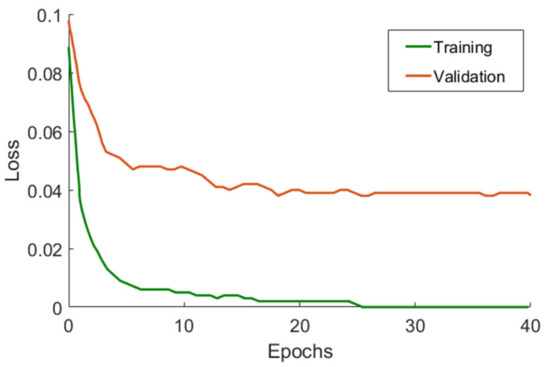
Figure 9.
Convergence trend of loss during training.
The sample images of the training sets were input into the SSD network model with epochs of 1, 2, 3, 4, 5, 10, 15, 20, 25, 50, 75, 100, 125, and 150. The accuracy curves of the detection and classification of the two pests are shown in Figure 10. From the perspective of the accuracy rate, after the network model is stabilized, the training effect of PCM is better as the accuracy rate reaches 91.7%, and the accuracy rate of Aphids is 91.1%. The main reason for this is that PCM is relatively fixed in its morphology, while Aphids are changeable in their morphology, and so the model generalization ability is slightly insufficient.
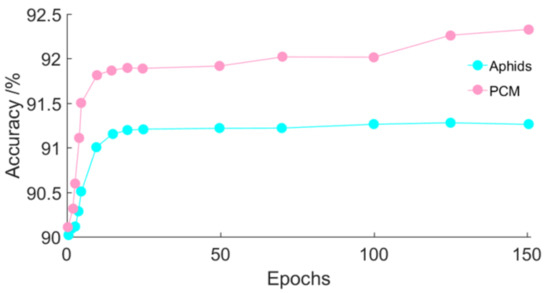
Figure 10.
Accuracy of pest detection under different epochs.
3.1.2. Optimization Results and Analysis of Feature Network
The training set samples of two pests, using ResNet50, InceptionV3, VGG16, MobileNetV3 and MobileNetV3 +RPBM, were compared and analyzed to determine their detection effects. The curve changes in the loss of different feature extraction networks with the increase in the number of iterations are shown in Figure 11.
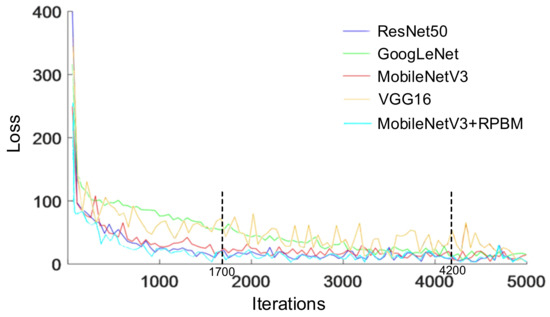
Figure 11.
The loss value of SSD under different feature networks.
According to the loss curve from Figure 11, as the number of iterations increases, the loss of the five models may converge rapidly, but MobileNetV3+RPBM is the fastest. When the network iterates 1700 times, the loss of ResNet50, MobileNetV3, and MobileNetV3+RPBM gradually becomes stable, while the GoogLeNet model is stable after 4200 iterations, and the training time is relatively long. The loss of VGG16 converges the slowest.
As shown in Table 1, we observed that the Params of MobileNetV3 are only 15.147 M, which is approximately 1/38 of that of VGG16, and its mAP and AR scores are 86.40% and 91.07%, respectively, which are lower than VGG16 but higher than GoogleNet. The moL of VGG16 is 679 ms higher than that of GoogLeNet (459 ms), while that of MobileNetV3 is low at 286 ms. Although the AR and mAP of MobileNetV3 are lower than those of VGG16, the former has absolute advantages over MobileNetV3 in latency and efficiency. If we only compare whether to add the RPBM after MobileNetV3, we can find that the AR and mAP of MobileNetV3+RPBM and MobileNetV3 are not that different, but the Params of MobileNetV3+RPBM are much smaller than those of MobileNetV3, suggesting that MobileNetV3+RPBM is more suitable for use in our Citrus pest detector as a light feature extraction network.

Table 1.
Comparison of performance parameters of different models.
3.1.3. Comparison with Other Frameworks
As can be seen from Table 2, the mAP of MobileNetV3+RPBM+SSD is higher than that of YOLOv7-tiny by 17.44%. It is even higher than that of FFSSD at 73.41% of the moL cost of the FFSSD. Although the Params of Pelee, proposed in [38], are lower than that of our model, it only achieves an 84.44% mAP when we take the model trained on our datasets.
Table 2.
Comparison of performance parameters of different models.
3.2. Analysis of the Practical Validation Results of Citrus Pest Identification Model
The test sets of the two pests were collected, and the PP, PN, and NN values were recorded. The results are shown in Table 3.
Table 3.
Detector experimental results.
From the perspective of successful identification, the identification rates of PCM and Aphids are relatively high, as the sampling characteristics were correctly selected in 91.0% and 89.0% of cases. PCM has a CA value of 90.1%, while Aphids have a CA value of 43.8%. Essentially, Aphids densely inhabit areas, stay close to each other, and are more aggressive. Thus, an overlapping phenomenon occurs. It is difficult to mark all of the pests during marking, resulting in some aphid samples becoming negative samples during training, and the accuracy is reduced. The visual detection results of the LCD display are shown in Figure 12.
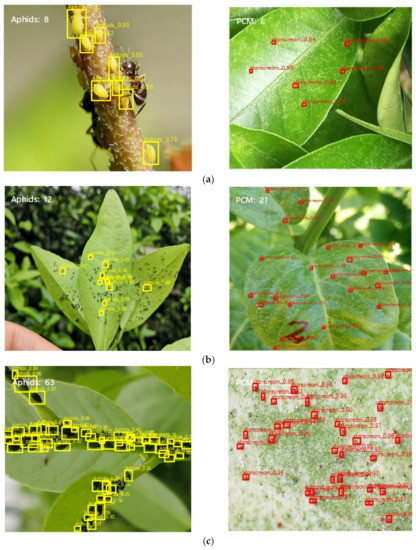
Figure 12.
Mobile pest detector test results: (a) low-density detection results, (b) middle-density detection results, (c) high-density detection results (note: the number of pests less than 10 is low density, and between 11 and 50 is middle- density, otherwise, it is high density).
From the perspective of the detection characteristics of the number of pests, when the density of pests is small, the counting results are more accurate. When the density is high, there may be dozens of pests on leaf veins and stems, which leads to problems such as mutual covering and difficulty in focusing, resulting in a low counting accuracy.
4. Discussion
This paper takes Panonychus citri Mcgregor and Aphids as the research objects, and compares and analyzes the performance of the SSD model under the pre-training of various transfer learning feature extraction networks in citrus pest recognition. In order to further test the applicability of the model in a mobile embedded terminal, a prediction convolution kernel miniaturization method is proposed to improve the SSD model, and the advantages of this method in terms of computational cost and accuracy are compared and analyzed.
Through the comparative analysis of the parameters, the accuracy, and the execution efficiency of VGG16, GoogLeNet, ResNet50, MobileNetV3, and MobileNetV3+RPBM, we selected MobileNetV3+RPBM as the feature extraction network for citrus pest images as the mAP and AR reach up to 86.10% and 91.00%, respectively, and the moL is as low as 185 ms, which is invaluable for embedded devices with limited computing resources, and which is favorable for running the pest detection model in the embedded system. Although the moL of MobileNetV3+RPBM+SSD is relatively high, the mAP of it is highest when compared with YOLOv7-tiny, FFSSD, and Pelee. Therefore, we used MobileNetV3+RPBM+SSD as the detection model in the citrus pest detector.
The classification and counting of PCM and Aphids were achieved by using MobileNetV3+RPBM+ SSD, and the identification accuracy rate reached up to 91.0% and 89.0%, respectively. In terms of CA, PCM reaches 90.1%, while Aphids were only at 43.8%. The main reason for this is that the dense colony characteristics of Aphids lead to serious overlapping in the image data, which affects the counting accuracy.
The convolution kernel miniaturization method proposed in this paper only plays a role in improving the processing speed. The future optimization of our model may be necessary to further improve the accuracy of pest detection and counting.
5. Conclusions
In order to realize the rapid and accurate detection of pest information in citrus orchards and improve intelligent management in this field, this paper designed a portable intelligent detection system to obtain pest information by combining the advantages of deep learning technology and embedded devices. In the design of the detection model, reducing the amount of model parameters, improving the detection speed, and ensuring the accuracy were the comprehensive goals. To this end, this paper improved the SSD model from two aspects: feature extraction network optimization and prediction convolution kernel miniaturization. The parameters of the proposed novel MobileNetV3+RPBM model were reduced by 5.122 M compared with the optimal MobileNetV3 parameters, while the mAP and AR detection accuracy indicators for the two citrus pests were still maintained above 85%, which shows that our modified SSD model can indeed reduce the number of parameters and latency, which is of great significance for the intelligent target detection of mobile portable devices with limited computing power.
Author Contributions
Conceptualization, X.H. and Z.L.; methodology, L.W. and W.S.; software and algorithm, L.W.; validation, H.X.; formal analysis, H.X.; investigation, Y.Y. and L.W.; resources, Y.T.; data curation, H.X.; writing—original draft preparation, L.W.; writing—review and editing, X.H., W.S. and Y.T.; visualization, L.W.; supervision, Z.L.; project administration, X.H.; funding acquisition, X.H. and L.W. All authors have read and agreed to the published version of the manuscript.
Funding
This research was funded by the Scientific Research Project of Hunan Provincial Department of Education, grant number 21B0741. This research was also partly supported by the Sanya Institute of China Agricultural University Guiding Fund Project, grant number SYND-2021-06; the 2015 Talent Development Program of China Agricultural University; the Natural Science Foundation of Hunan Province, grant number 2020JJ2015; the Yongzhou Guiding Science and Technology Plan Project, grant number 2021-YZKJZD-007; and the stable support project of Guangdong Academy of Sciences, grant number 2022-SSGAS-05. Xiongkui He is the corresponding author.
Institutional Review Board Statement
Not applicable.
Informed Consent Statement
Not applicable.
Data Availability Statement
Not applicable.
Conflicts of Interest
The authors declare no conflict of interest.
References
- Khanramaki, M.; Askari Asli-Ardeh, E.; Kozegar, E. Citrus pests classification using an ensemble of deep learning models. Comput. Electron. Agric. 2021, 186, 106192. [Google Scholar] [CrossRef]
- He, X.; Bonds, J.; Herpbmt, A.; Langenakens, J. Recent development of unmanned aerial vehicle for plant protection in East Asia. Int. J. Agric. Biol. Eng. 2017, 10, 18–30. [Google Scholar]
- Yang, J.; Guo, X.; Li, Y.; Marinello, F.; Ercisli, S.; Zhang, Z. A survey of few-shot learning in smart agriculture: Developments, applications, and challenges. Plant Methods 2022, 18, 28. [Google Scholar] [CrossRef] [PubMed]
- Njoroge, A.W.; Mankin, R.W.; Smith, B.; Baributsa, D. Effects of hypoxia on acoustic activity of two stored-product pests, adult emergence, and grain quality. J. Econ. Entomol. 2019, 112, 1989–1996. [Google Scholar] [CrossRef] [PubMed]
- Zhang, R.R. PEDS-AI: A Novel Unmanned Aerial Vehicle Based Artificial Intelligence Powered Visual-Acoustic Pest Early Detection and Identification System for Field Deployment and Surveillance. In Proceedings of the 2023 IEEE Conference on Technologies for Sustainability (SusTech), Portland, OR, USA, 23 May 2023. [Google Scholar]
- Zhou, B.; Dai, Y.; Li, C.; Wang, J. Electronic nose for detection of cotton pests at the flowering stage. Trans. Chin. Soc. Agric. Eng. 2020, 36, 194–200. [Google Scholar]
- Zheng, Z.; Zhang, C. Electronic noses based on metal oxide semiconductor sensors for detecting crop diseases and insect pests. Comput. Electron. Agric. 2022, 197, 106988. [Google Scholar] [CrossRef]
- Wu, X.; Zhang, W.; Qiu, Z.; Cen, H.; He, Y. A novel method for detection of Pieris rapae larvae on cabbage leaves using NIR hyperspectral imaging. Appl. Eng. Agric. 2016, 32, 311–316. [Google Scholar]
- Qin, Y.; Wu, Y.; Wang, Q.; Yu, S. Method for pests detecting in stored grain based on spectral residual saliency edge detection. Grain Oil Sci. Technol. 2019, 2, 33–38. [Google Scholar] [CrossRef]
- Yang, X.; Liu, M.; Xu, J.; Zhao, L.; Wei, S.; Li, W.; Chen, M.; Chen, M.; Li, M. Image segmentation and recognition algorithm of greenhouse whitefly and thrip adults for automatic monitoring device. Trans. Chin. Soc. Agric. Eng. 2018, 34, 164–170. [Google Scholar]
- Song, L. Recognition model of disease image based on discriminative deep belief networks. Comput. Eng. Appl. 2017, 53, 32–36. [Google Scholar]
- Martineau, M.; Conte, D.; Raveaux, R.; Arnault, I.; Munier, D.; Venturini, G. A survey on image-based pest classification. Pattern Recognit. 2017, 65, 273–284. [Google Scholar] [CrossRef]
- Deng, L.; Wang, Y.; Han, Z.; Yu, R. Research on pest pest image detection and recognition based on bio-inspired methods. Biosyst. Eng. 2018, 169, 139–148. [Google Scholar] [CrossRef]
- Mukhiddinov, M.; Muminov, A.; Cho, J. Improved Classification Approach for Fruits and Vegetables Freshness Based on Deep Learning. Sensors 2022, 22, 8192. [Google Scholar] [CrossRef] [PubMed]
- Lu, Y.; Yi, S.; Zeng, N.; Liu, Y.; Zhang, Y. Identification of rice diseases using deep convolutional neural networks. Neurocomputing 2017, 267, 378–384. [Google Scholar] [CrossRef]
- Liu, B.; Zhang, Y.; He, D.J.; Li, Y.X. Identification of Apple Leaf Diseases Based on Deep Convolutional Neural Networks. Symmetry 2018, 10, 11. [Google Scholar] [CrossRef]
- Li, H.; Long, C.; Zeng, M.; Shen, J. A detecting method for the rape pests based on deep convolutional neural network. J. Hunan Agric. Univ. (Nat. Sci.) 2019, 45, 560–564. [Google Scholar]
- Kuzuhara, H.; Takimoto, H.; Sato, Y.; Kanagawa, A. pest detection and identification method based on deep learning for realizing a pest control system. In Proceedings of the 2020 59th Annual Conference of the Society of Instrument and Control Engineers of Japan (SICE), Chiang Mai, Thailand, 23–26 September 2020. [Google Scholar]
- He, Y.; Zeng, H.; Fan, Y.Y.; Ji, S.; Wu, J. Application of deep learning in integrated pest management: A real-time system for detection and diagnosis of oilseed rape pests. Mob. Inf. Syst. 2019, 2019, 4570808. [Google Scholar] [CrossRef]
- Qiu, G.; Tao, W.; Huang, Y.; Zhang, F. Research on farm pest monitoring and early warning system under the NB-IoT Framework. J. Fuqing Branch Fujian Norm. Univ. 2020, 162, 1–7. [Google Scholar]
- Luo, Q.; Huang, R.; Zhu, Y. Real-time monitoring and prewarning system for grain storehouse pests based on deep learning. J. Jiangsu Univ. (Nat. Sci. Ed.) 2019, 40, 203–208. [Google Scholar]
- Ghazi, M.M.; Yanikoglu, B.; Aptoula, E. Plant identification using deep neural networks via optimization of transfer learning parameters. Neurocomputing 2017, 235, 228–235. [Google Scholar] [CrossRef]
- Khan, M.A.; Akram, T.; Sharif, M.; Awais, M.; Javed, K.; Ali, H.; Saba, T. CCDF: Automatic system for segmentation and recognition of fruit crops diseases based on correlation coefficient and deep CNN features. Comput. Electron. Agric. 2018, 155, 220–236. [Google Scholar] [CrossRef]
- Liu, Z.; Gao, J.; Yang, G.; Zhang, H.; He, Y. Localization and Classification of Paddy Field Pests using a Saliency Map and Deep Convolutional Neural Network. Sci. Rep. 2016, 6, 20410. [Google Scholar] [CrossRef] [PubMed]
- He, K.; Zhang, X.; Ren, S.; Sun, J. Deep residual learning for image recognition. In Proceedings of the IEEE Conference on Computer Vision and Pattern Recognition, Las Vegas, NV, USA, 27–30 June 2016. [Google Scholar]
- Al-Qizwini, M.; Barjasteh, I.; Al-Qassab, H.; Radha, H. Deep learning algorithm for autonomous driving using GoogLeNet. In Proceedings of the 2017 IEEE Intelligent Vehicles Symposium (IV), Los Angeles, CA, USA, 11–14 June 2017. [Google Scholar]
- Wang, D.; Deng, L.; Ni, J.; Gao, J.; Zhu, H.; Han, Z. Recognition pest by image-based transfer learning. J. Sci. Food Agric. 2019, 99, 4524–4531. [Google Scholar]
- Suh, H.K.; Ijsselmuiden, J.; Hofstee, J.W.; Henten, E.J. Transfer learning for the classification of sugar beet and volunteer potato under field conditions. Biosyst. Eng. 2018, 174, 50–65. [Google Scholar] [CrossRef]
- Simonyan, K.; Zisserman, A. Very deep convolutional networks for large-scale image recognition. In Proceedings of the International Conference on Learning Representations 2015, San Diego, CA, USA, 7–9 May 2015. [Google Scholar]
- Gavai, N.R.; Jakhade, Y.A.; Tribhuvan, S.A.; Bhattad, R. MobileNets for flower classification using TensorFlow. In Proceedings of the 2017 International Conference on Big Data, IoT and Data Science (BID), Pune, India, 20–22 December 2017. [Google Scholar]
- Sandler, M.; Howard, A.; Zhu, M.; Zhmoginov, A.; Chen, L.C. MobileNetv2: Inverted residuals and linear bottlenecks. In Proceedings of the IEEE Conference on Computer Vision and Pattern Recognition, Salt Lake City, UT, USA, 18–22 June 2018. [Google Scholar]
- Howard, A.; Sandler, M.; Chu, G.; Chen, L.C.; Chen, B.; Tan, M.; Wang, W.; Zhu, Y.; Pang, R.; Vasudevan, V.; et al. Searching for MobileNetV3. In Proceedings of the IEEE International Conference on Computer Vision, Seoul, Korea, 27 October–2 November 2019. [Google Scholar]
- Zou, Z.; Chen, K.; Shi, Z.; Guo, Y.; Ye, J. Object Detection in 20 Years: A Survey. Proc. IEEE 2023, 111, 257–276. [Google Scholar] [CrossRef]
- Wang, L.; Lan, Y.; Liu, Z.; Yue, X.; Deng, S.; Guo, Y. Development and experiment of the portable real-time detection system for citrus pests. Trans. Chin. Soc. Agric. Eng. 2021, 37, 282–288. [Google Scholar]
- Wang, S.; Han, Y.; Chen, J.; He, X.; He, X.; Zhang, Z.; Liu, X.; Zhang, K. Weed Density Extraction Based on Few-Shot Learning Through UAV Remote Sensing RGB and Multispectral Images in Ecological Irrigation Area. Front. Plant Sci. 2022, 12, 735230. [Google Scholar] [CrossRef]
- Mohamed, E.K.; Fahad, A.; Sultan, A.; Sultan, A. A new mobile application of agricultural pests recognition using deep learning in cloud computing system. Alex. Eng. J. 2021, 60, 4423–4432. [Google Scholar]
- Jin, X.; Sun, Y.; Che, J.; Bagavathiannan, M.; Yu, J.; Chen, Y. A novel deep learning-based method for detection of weeds in vegetables. Pest Manag. Sci. 2022, 78, 1861–1869. [Google Scholar] [CrossRef]
- Robert, J.W.; Li, X.; Charles, X.L. Pelee: A Real-Time Object Detection System on Mobile Device. In Proceedings of the Advances in Neural Information Processing Systems 31 (NeurIPS 2018), Palais des Congrès de Montréal, Montréal, QC, Canada, 2–8 December 2018. [Google Scholar]
- Wang, C.; Bochkovskiy, A.; Liao, H.M. YOLOv7: Trainable bag-of-freebies sets new state-of-the-art for real-time object detectors. In Proceedings of the IEEE/CVF Conference on Computer Vision and Pattern Recognition (CVPR), Vancouver, BC, Canada, 18–22 June 2023. [Google Scholar]
- Cao, G.; Xie, X.; Yang, W.; Liao, Q.; Shi, G.; Wu, J. Feature-fused SSD: Fast detection for small objects. Proc. SPIE 2018, 10615, 381–388. [Google Scholar]
Disclaimer/Publisher’s Note: The statements, opinions and data contained in all publications are solely those of the individual author(s) and contributor(s) and not of MDPI and/or the editor(s). MDPI and/or the editor(s) disclaim responsibility for any injury to people or property resulting from any ideas, methods, instructions or products referred to in the content. |
© 2023 by the authors. Licensee MDPI, Basel, Switzerland. This article is an open access article distributed under the terms and conditions of the Creative Commons Attribution (CC BY) license (https://creativecommons.org/licenses/by/4.0/).