
Effect of Phosphorus, Iron, Zinc, and Their Combined Deficiencies on Photosynthetic Characteristics of Rice (Oryza sativa L.) Seedlings
 ,
,
Abstract
:1. Introduction
2. Materials and Methods
2.1. Experimental Design
2.2. Sample Determination and Collection
2.2.1. Dry Matter Weight (DW)
2.2.2. Total Chl Content (T Chl)
2.2.3. Rapid A–Ci Response
2.2.4. Chl a Fluorescence Transient
2.3. Statistical Analyses
3. Results
3.1. Phenotypes and Dry Weight
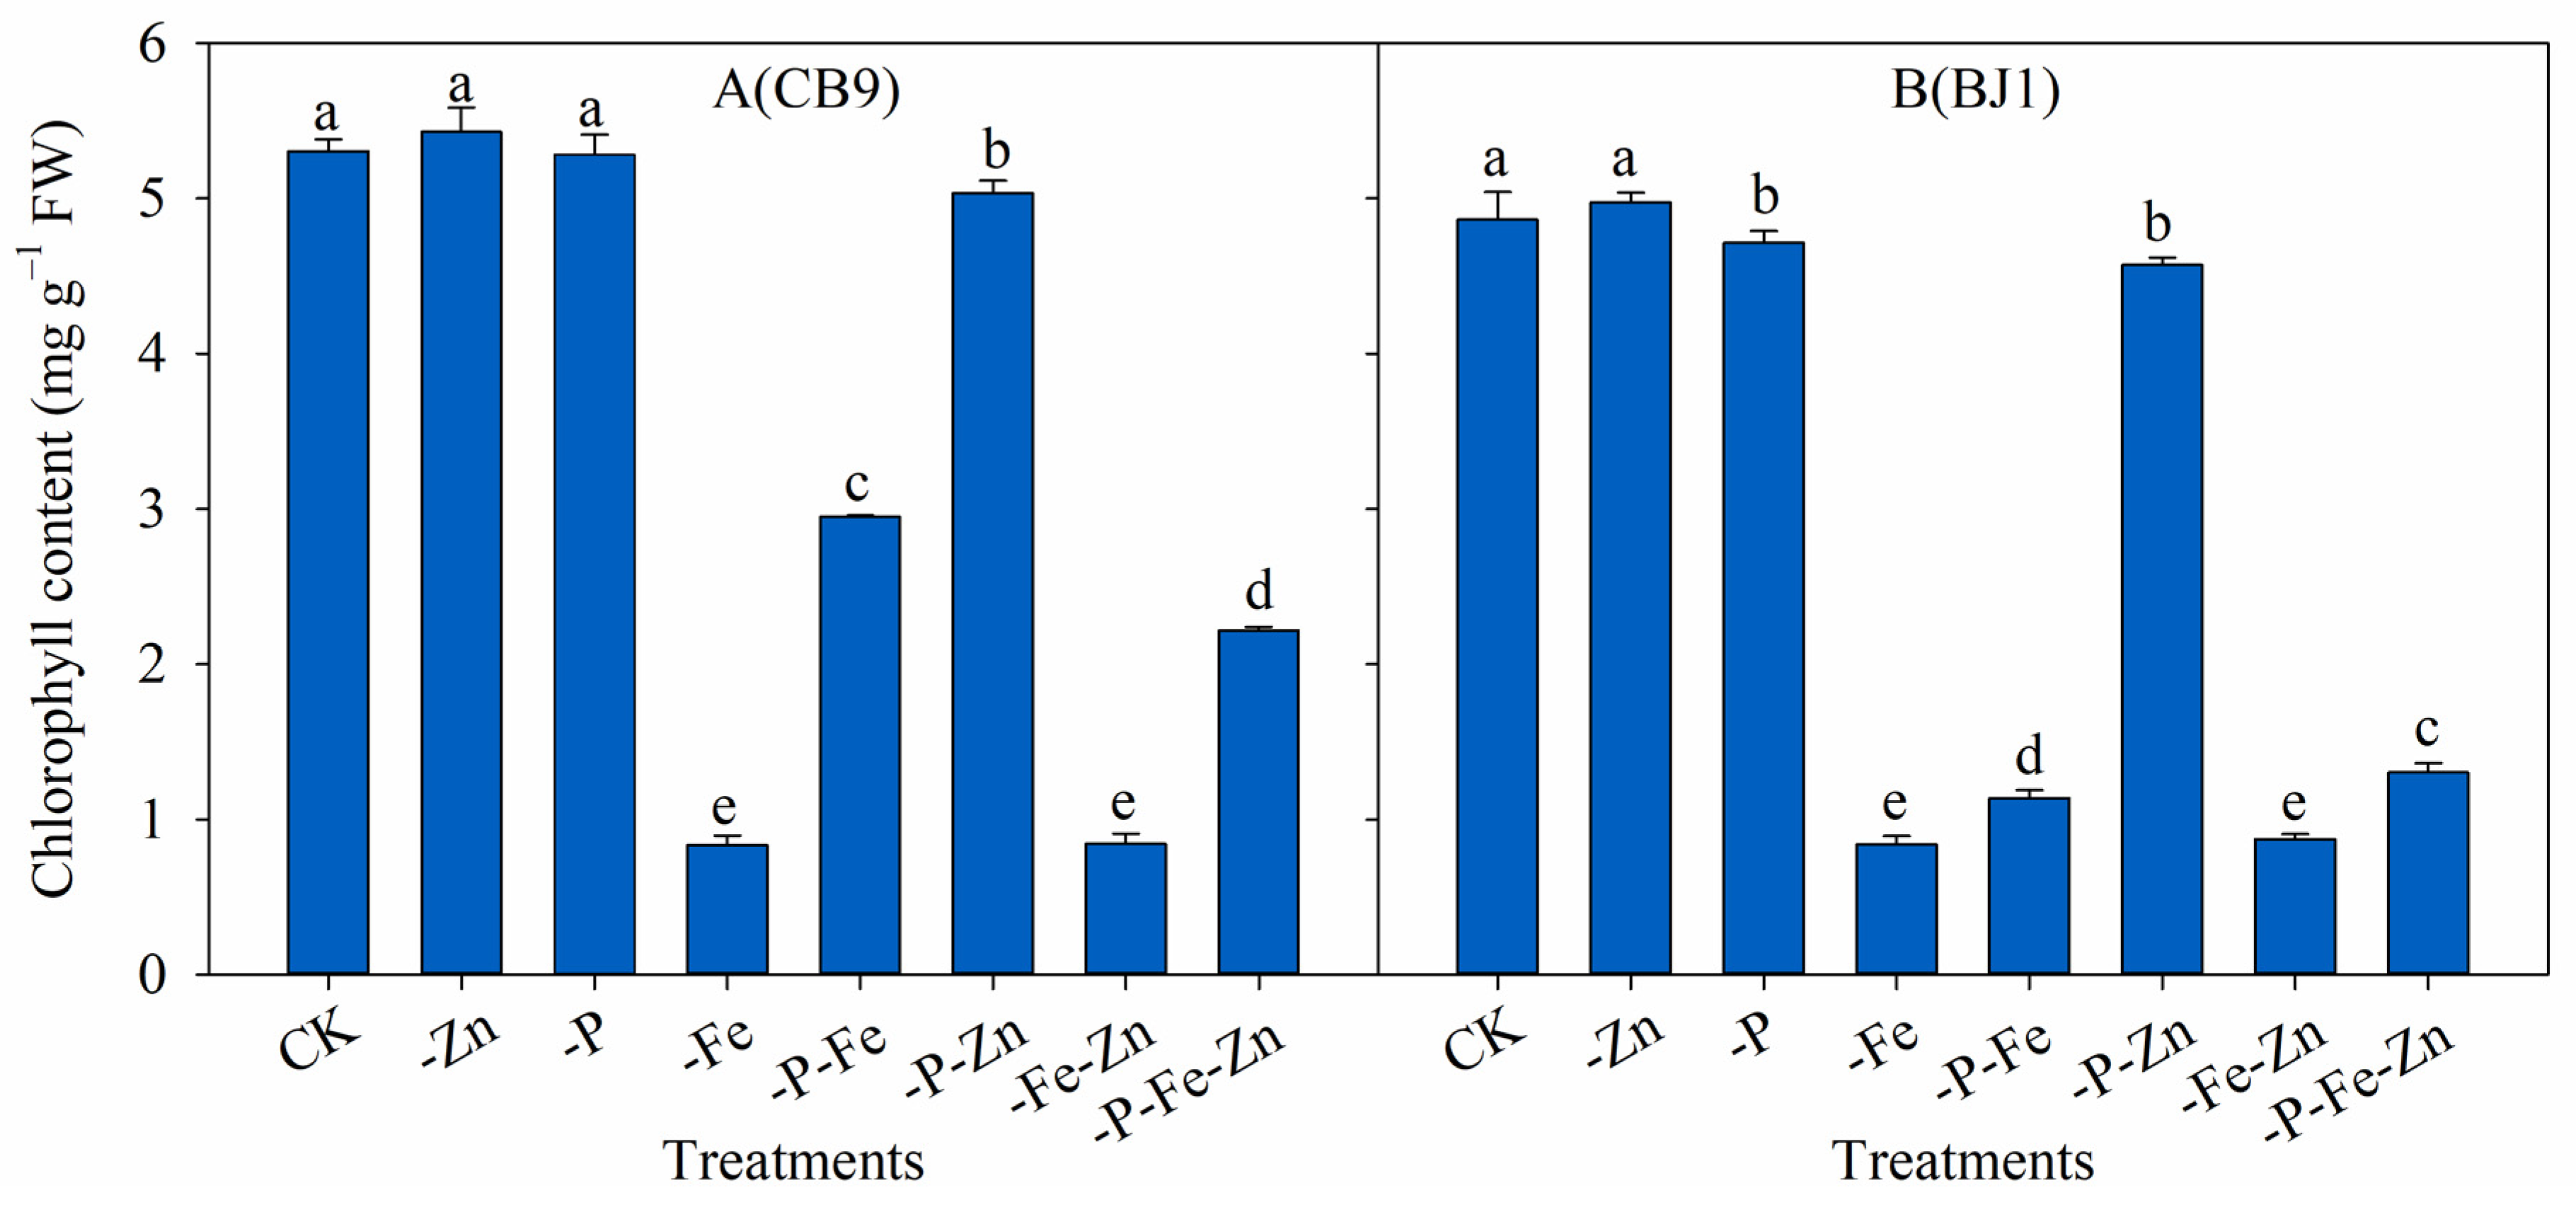
3.2. Total Chl Content
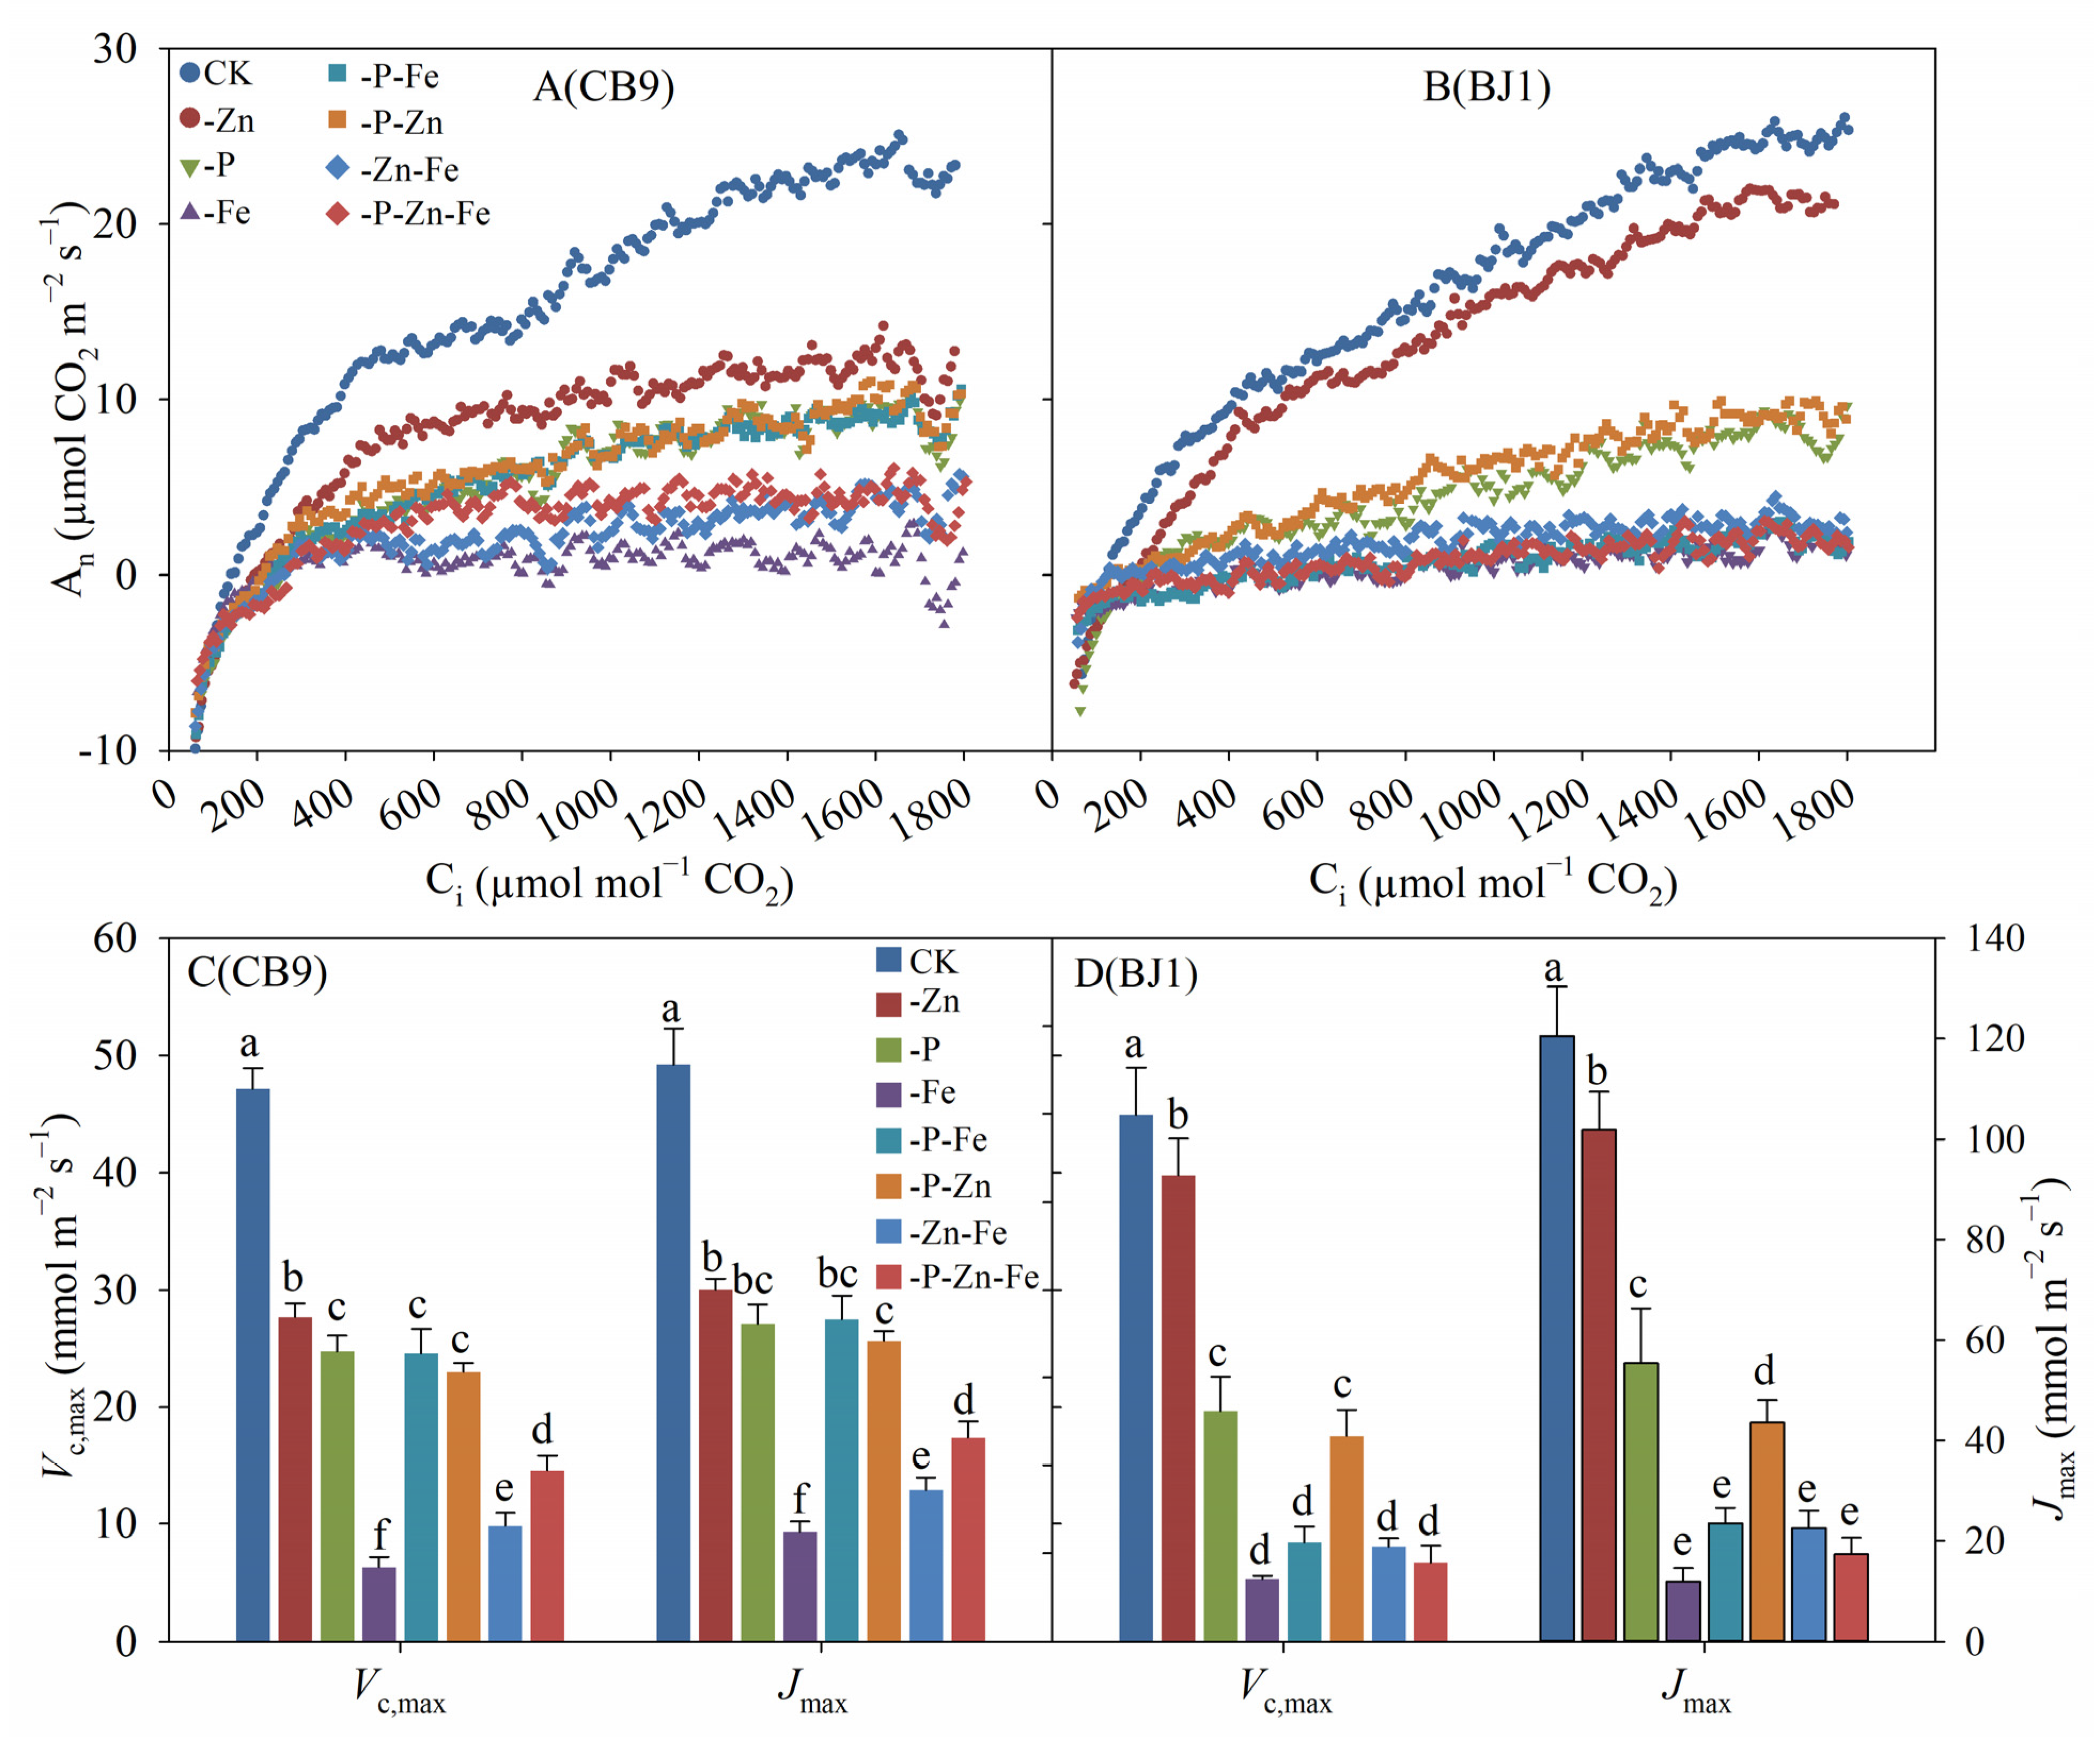
3.3. The Rapid A–Ci Response
3.4. Chl a Fluorescence Induction Kinetic Curve and JIP-Test Analysis
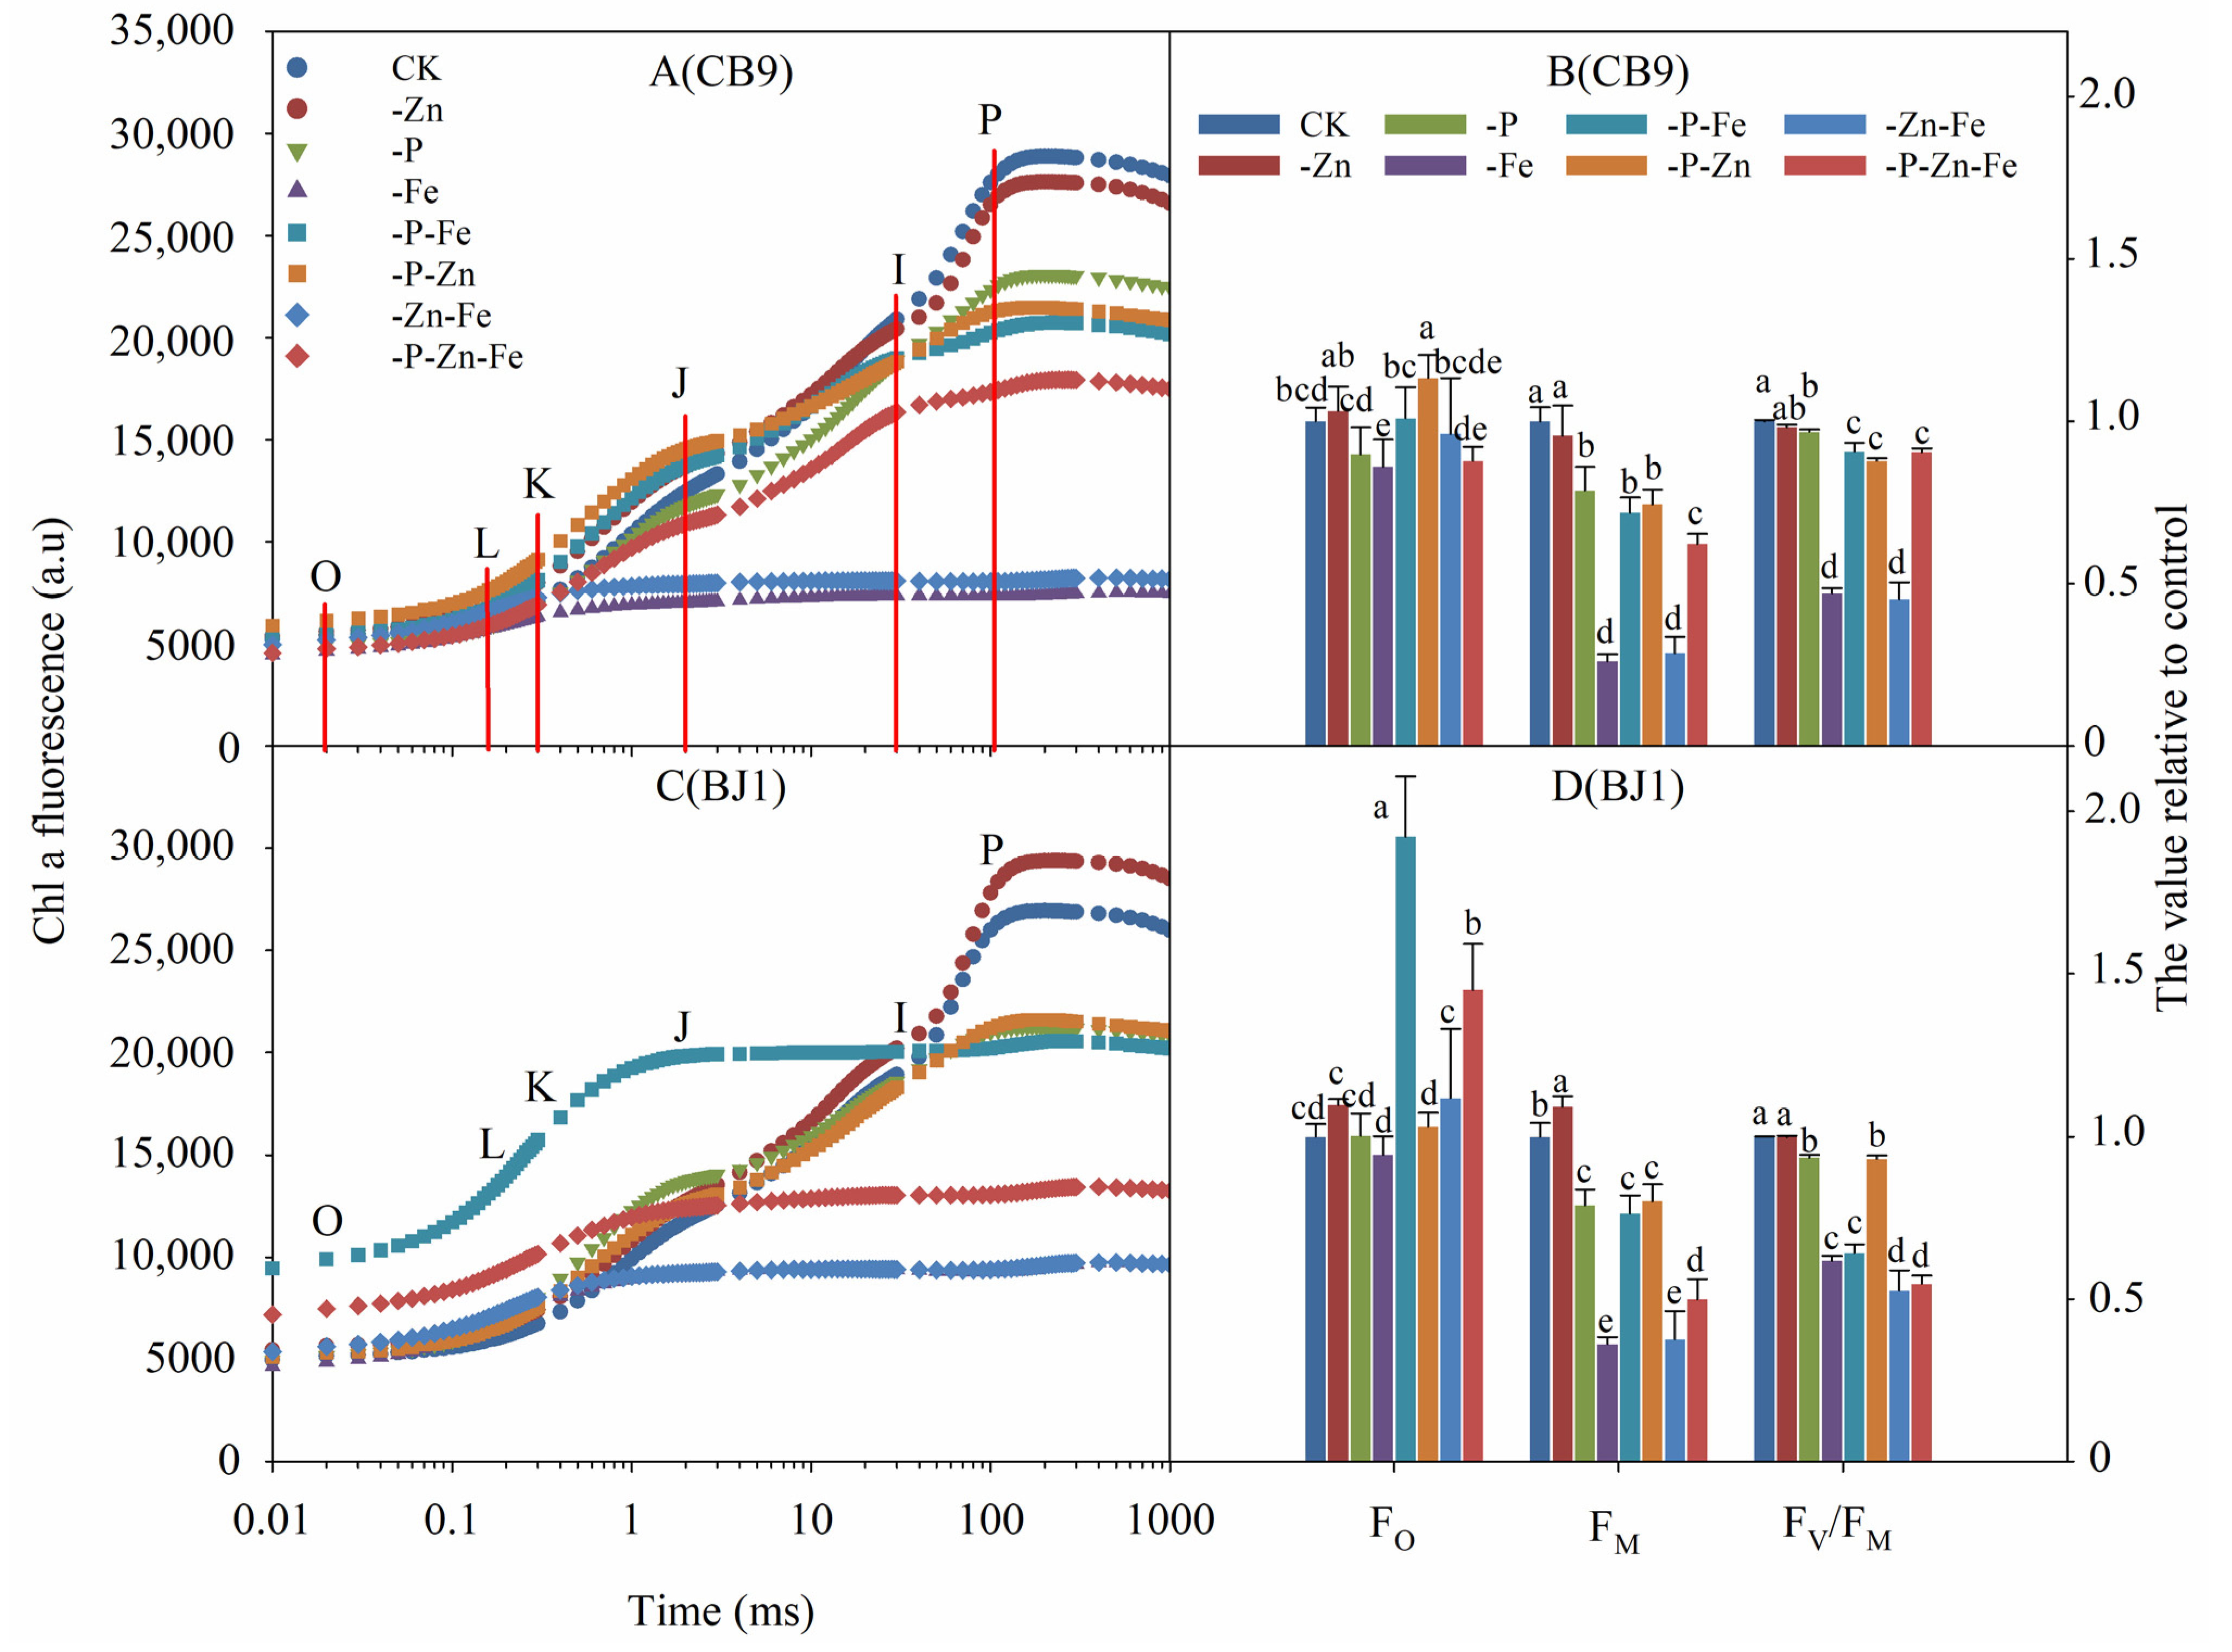
3.4.1. Chl Fluorescence Induction Kinetics Raw Curve
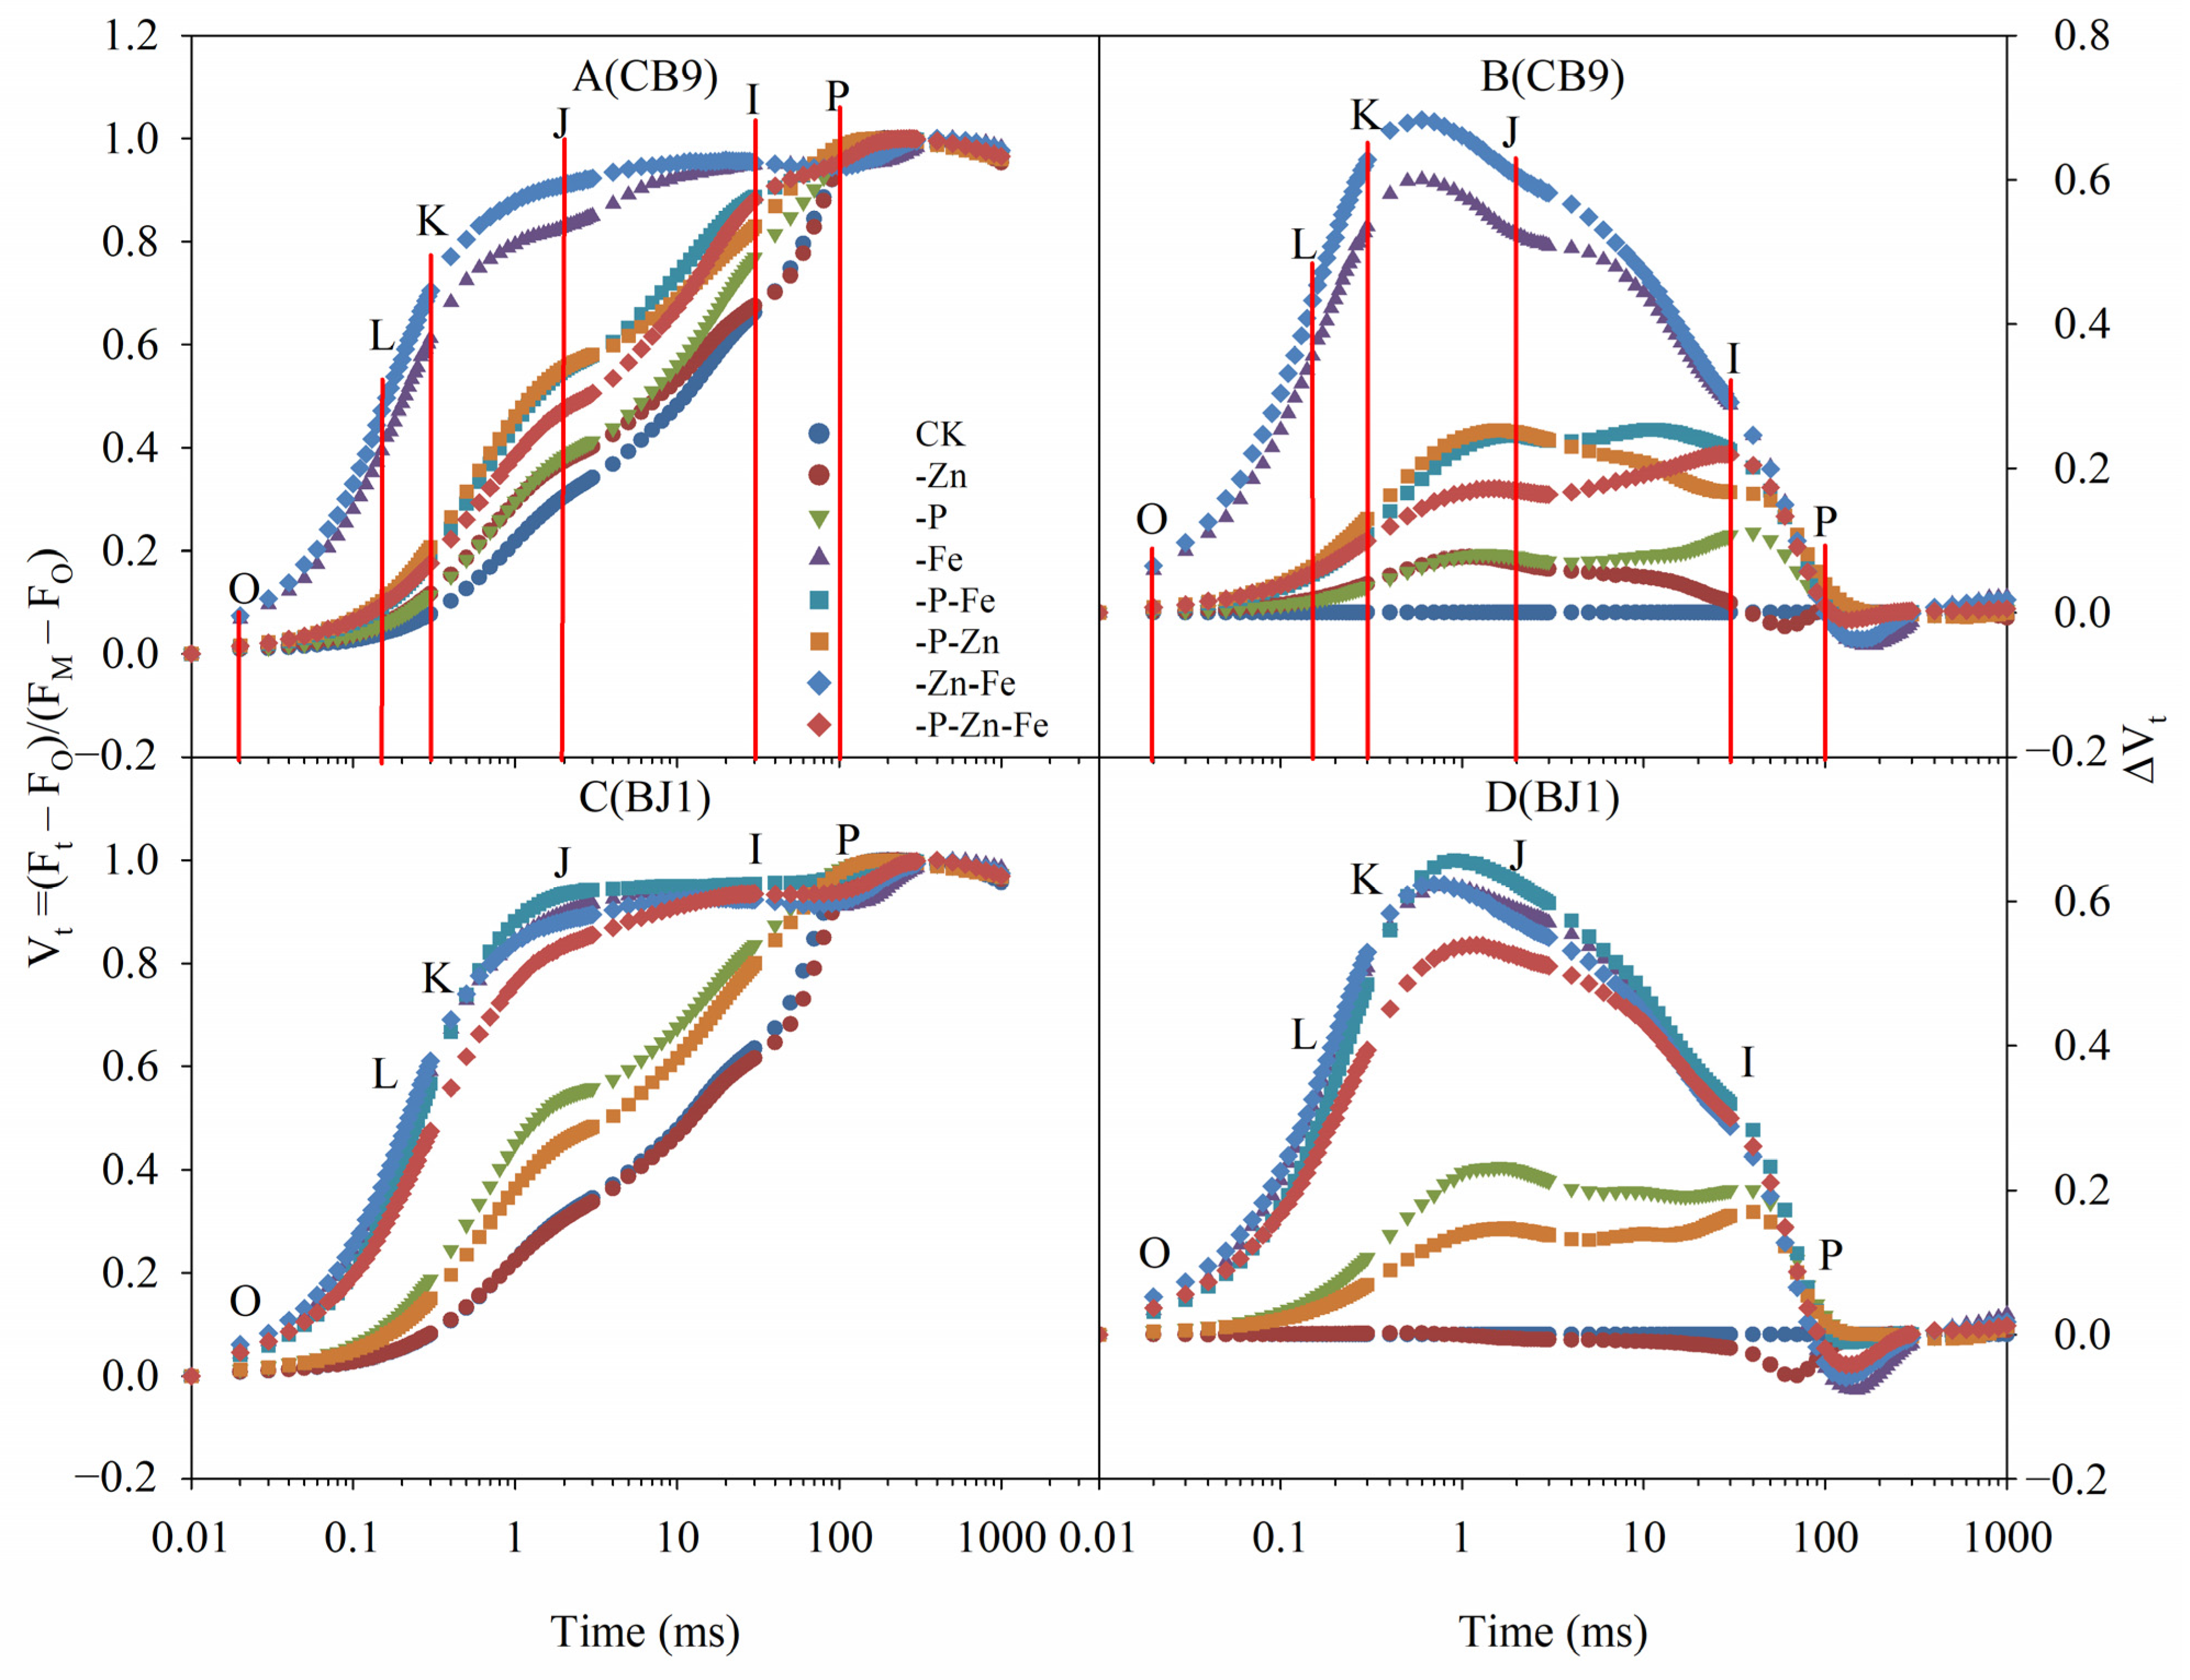
3.4.2. Standardized Kinetic Curve of Chl Fluorescence
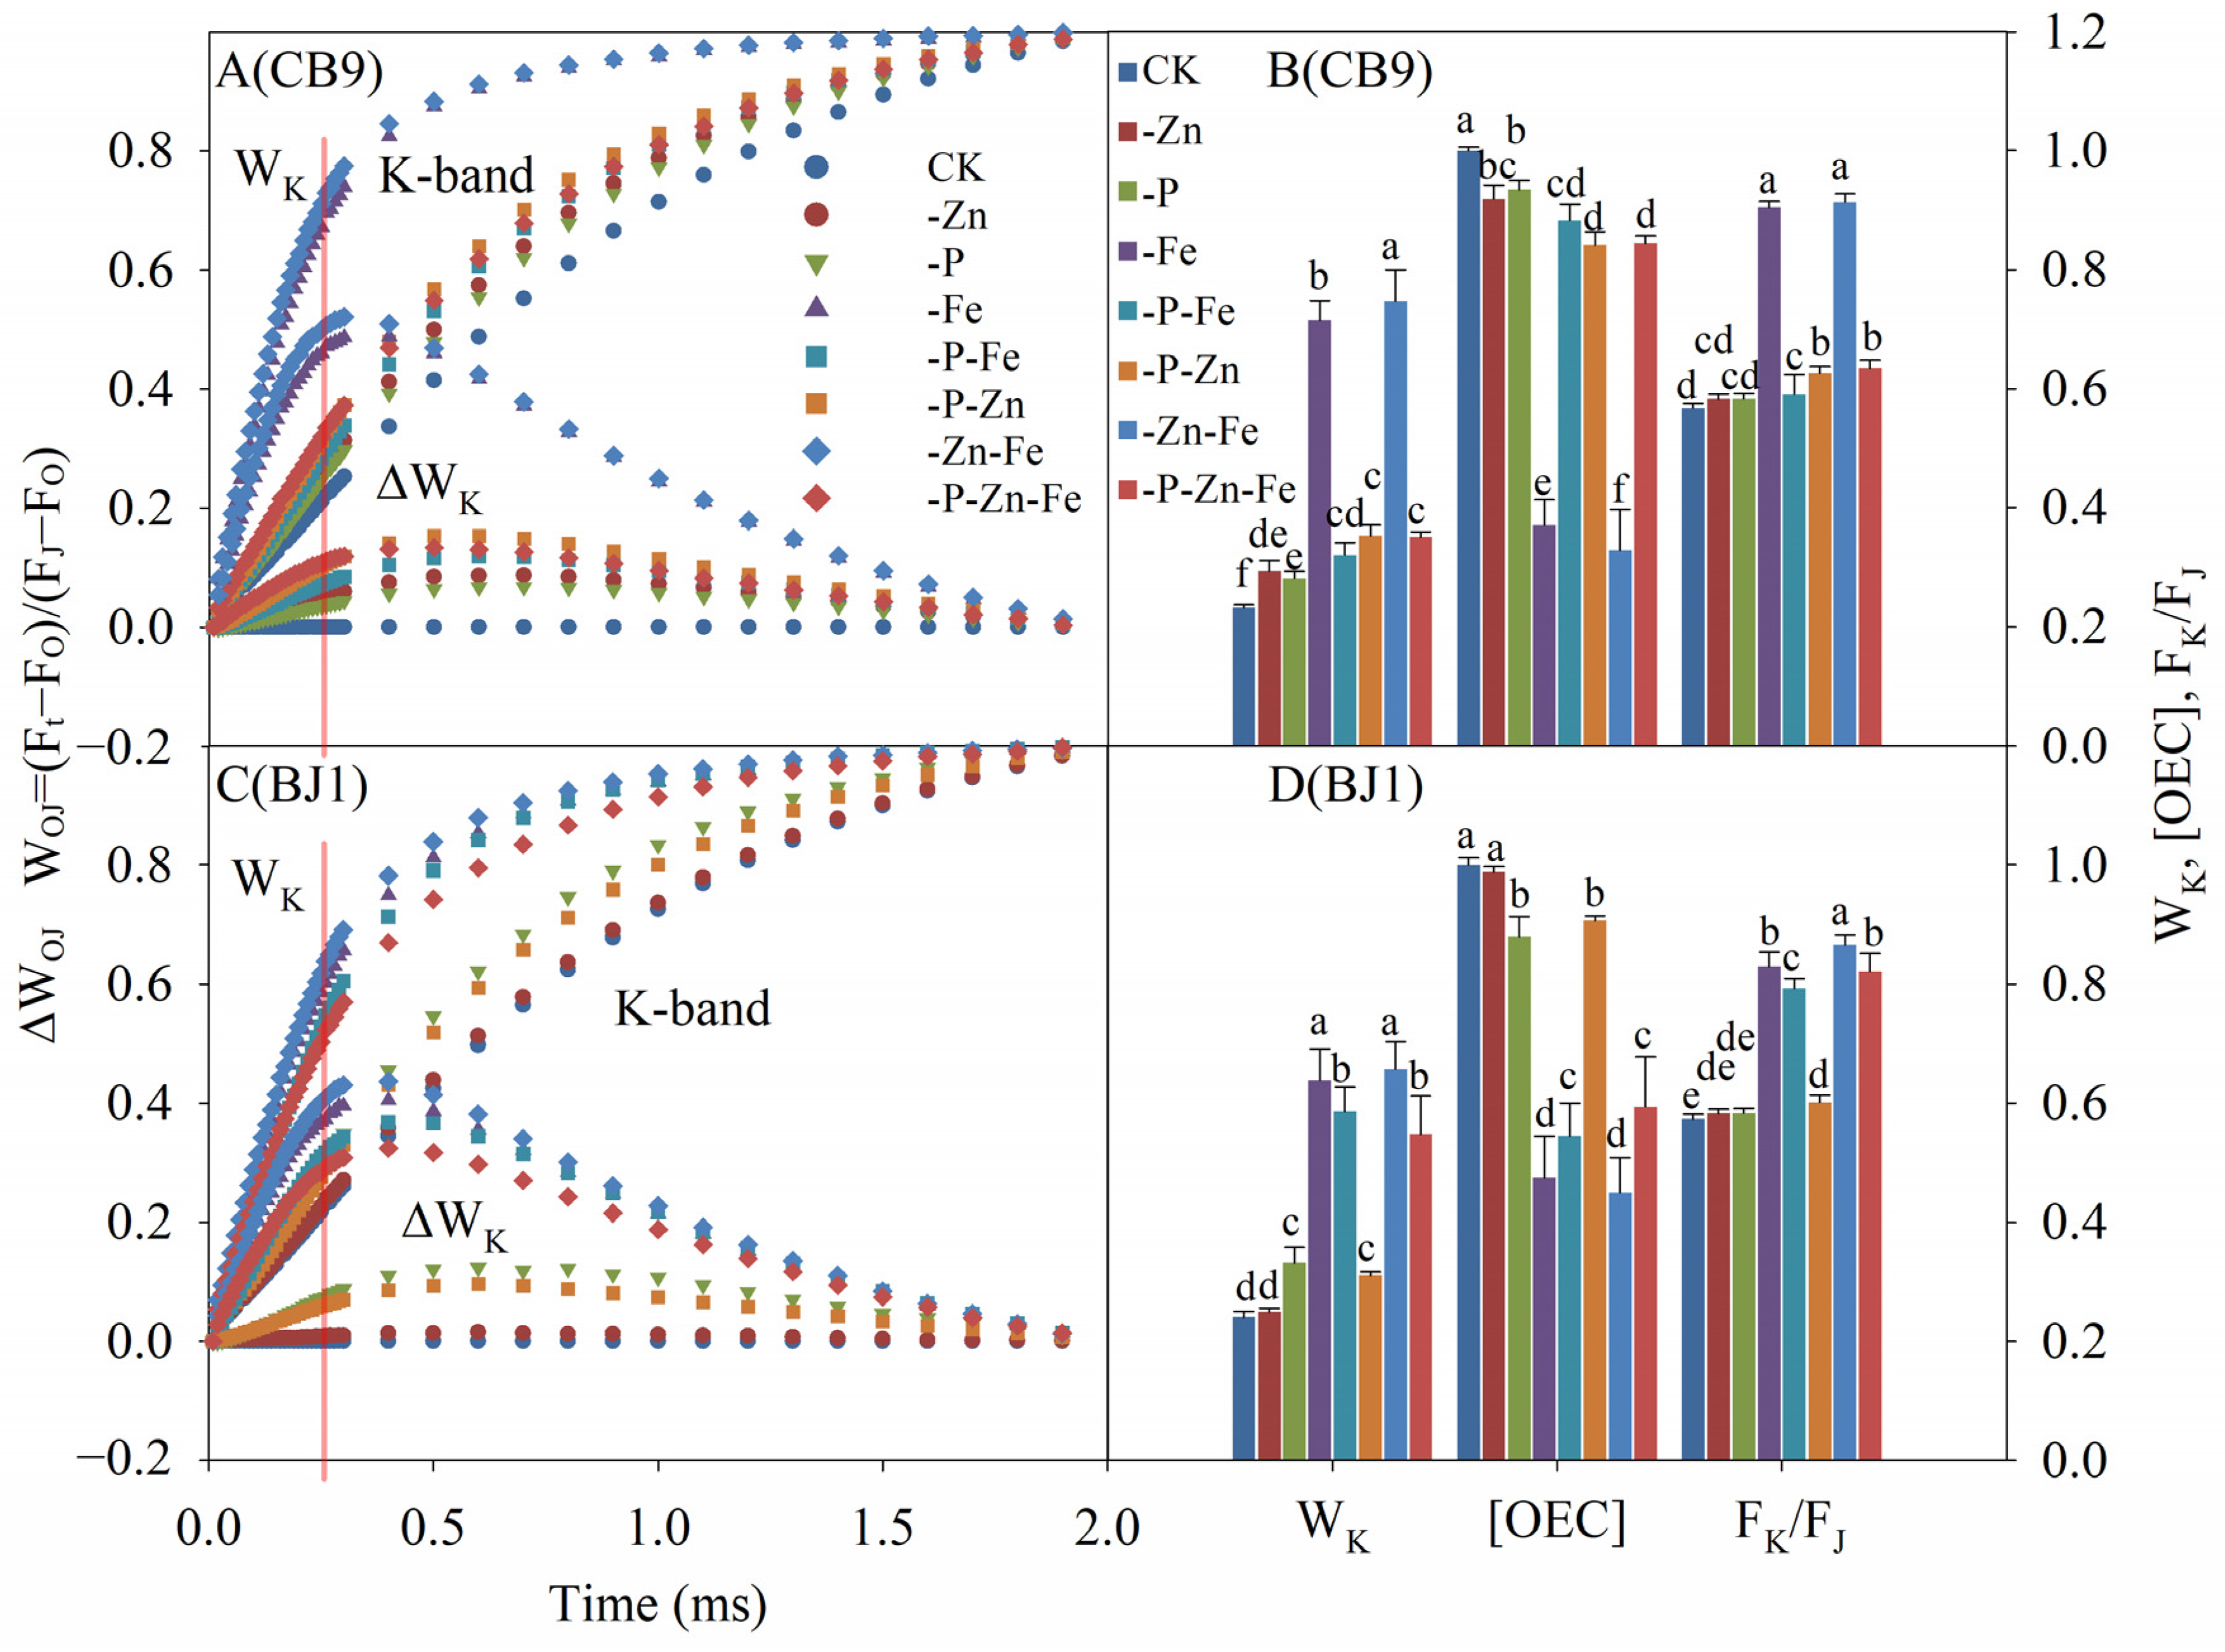
3.4.3. OK Phase
3.4.4. OJ Phase
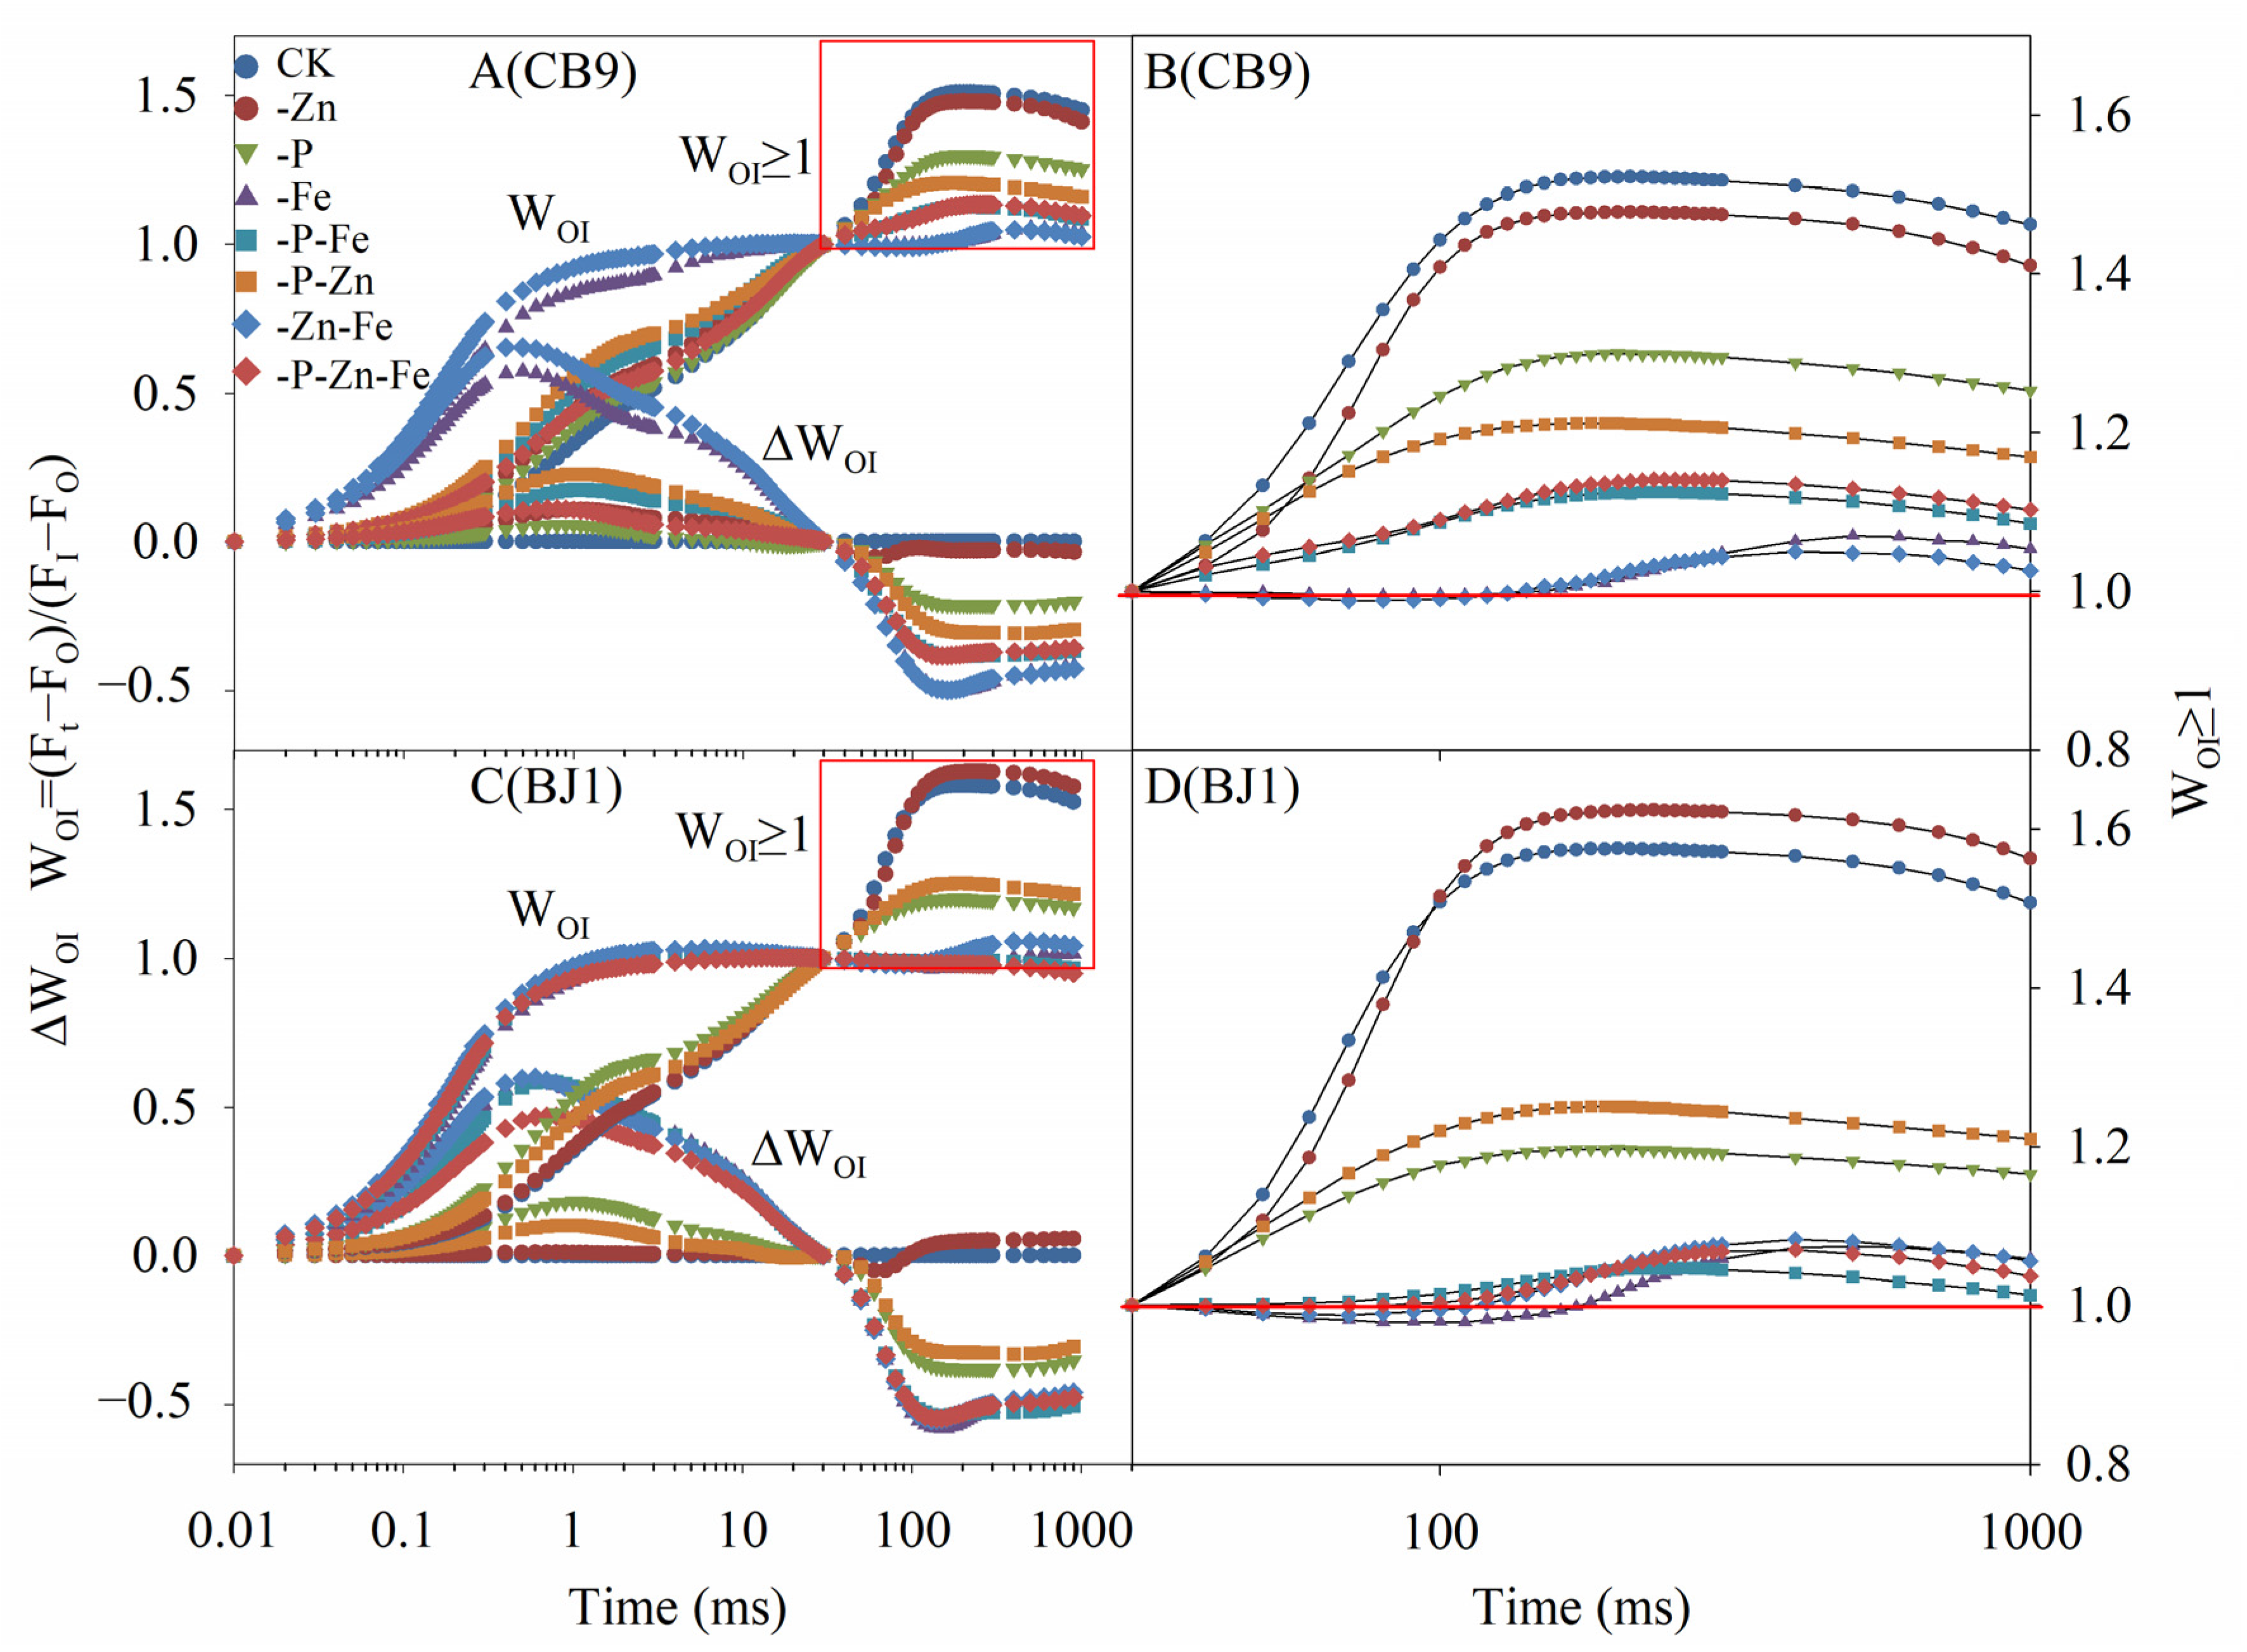
3.4.5. OI Phase
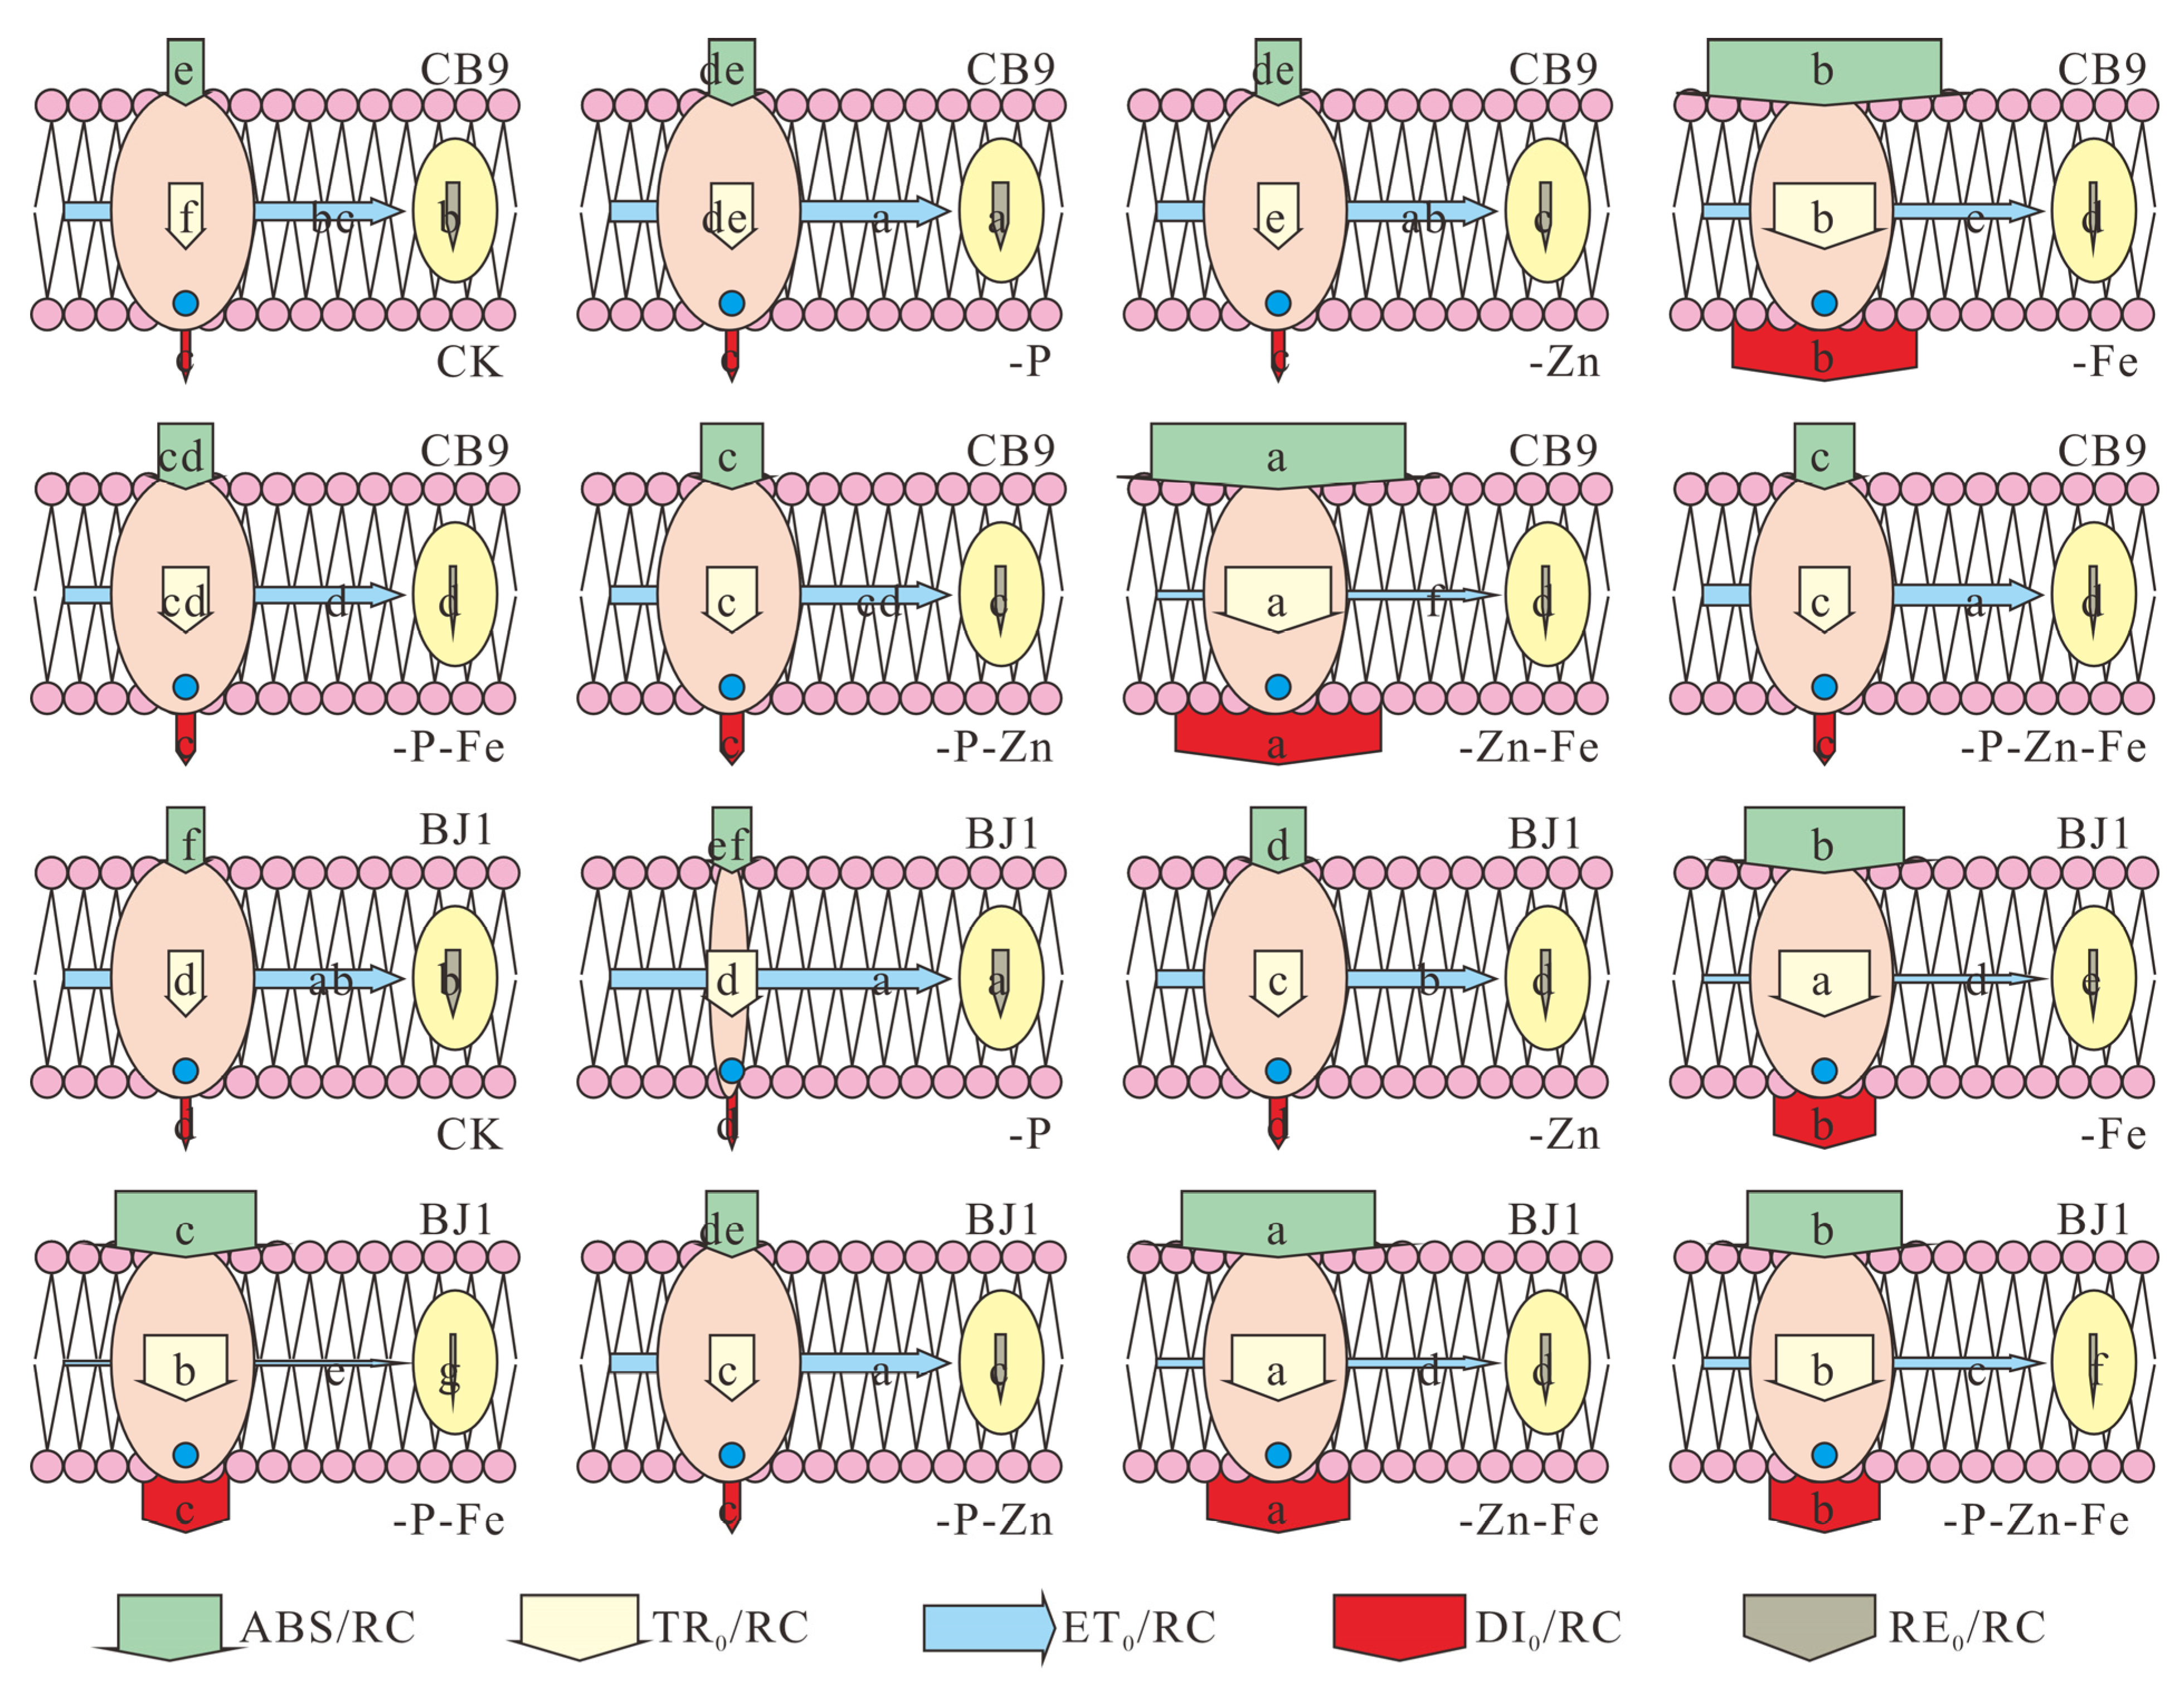
3.4.6. Specific Fluxes Membrane Model
3.4.7. Important Parameters of the Photosystem
3.5. Correlation between Growth Parameters and Photosynthesis-Related Indicators
4. Discussion
5. Conclusions
Author Contributions
Funding
Data Availability Statement
Acknowledgments
Conflicts of Interest
Appendix A

| Technical Fluorescence Parameters | |
|---|---|
| Ft | fluorescence at time t after onset of actinic illumination |
| FO = F20μs | minimal fluorescence, when all PSII RCs are open |
| FL = F150μs | fluorescence intensity at the L step (150 μs) of OJIP |
| FK = F300μs | fluorescence intensity at the K step (300 μs) of OJIP |
| FJ = F2ms | fluorescence intensity at the J step (2 ms) of OJIP |
| FI = F30ms | fluorescence intensity at the I step (30 ms) of OJIP |
| FM (=FP) | maximal recorded fluorescence intensity, at the peak P of OJIP |
| Vt = (Ft − FO)/(FM − FO) | relative variable fluorescence at time t |
| VJ = (FJ − FO)/(FM − FO) | relative variable fluorescence at the J step |
| WL = (F150µs − FO)/(FL − FO) | relative variable fluorescence at the L step to the amplitude FK − FO |
| WK = (F300µs − FO)/(FJ − FO) | relative variable fluorescence at the K step to the amplitude FJ − FO |
| WOJ = (Ft − FO)/(FJ − FO) | ratio of variable fluorescence Ft − FO to the amplitude FJ − FO |
| WOI = (Ft − FO)/(FI − FO) | ratio of variable fluorescence Ft − FO to the amplitude FI − FO |
| Quantum efficiencies or flux ratios | |
| φPo = TR0/ABS = 1 − FO/FM | maximum quantum yield for primary photochemistry |
| ψEo = ET0/TR0 = 1 − VJ | Efficiency with which a PSII trapped electron is transferred from QA− to PQ |
| φEo = ET0/ABS = (1 − FO/FM) (1 − VJ) | quantum yield for electron transport (ET) |
| φDo = 1-φPo = FO/FM | quantum yield (at t = 0) of energy dissipation |
| φRo = RE0/ABS = φPo•ψEo•δRo = φPo•(1 − VI) | quantum yield for reduction of the end electron acceptors at the PSI acceptor side (RE) |
| ψRo = RE0/TR0 = ψEo•δRo = 1 − VI | Efficiency with which a PSII trapped electron is transferred to final PSI acceptors |
| δRo = RE0/ET0 = (1 − VI)/(1 − VJ) | probability that an electron is transported from the reduced intersystem electron acceptors to the final electron acceptors of PSI (RE) |
| Specific energy fluxes (per QA reducing PSII reaction centre–RC) | |
| ABS/RC = M0(1/VJ)(1/φPo) | Absorbed photon flux per active PSII |
| TR0/RC = M0(1/VJ) | Trapped energy flux per active PSII |
| DI0/RC = ABS/RC-TR0/RC | Dissipated energy (as heat and fluorescence) flux per active PSII |
| ET0/RC = M0(1/VJ)(1 − VJ) | Electron flux from QA− to the PQ pool per active PSII |
| RE0/RC = M0(1/VJ)(1 − VI) | Electron flux from QA− to the final electron acceptors of PSI per active PSII |
| Performance indexes | |
| PIABS = γRC(1 − γRC)•φPo(1 − φPo)•ψEo(1 − ψEo) = (RC/ABS)•φPo(1 − φPo)•ψEo(1 − ψEo) | performance index (potential) for energy conservation from photons absorbed by PSII to the reduction of intersystem electron acceptors |
References
- Tian, S.; Liang, S.; Qiao, K.; Wang, F.; Zhang, Y.; Chai, T. Co-Expression of Multiple Heavy Metal Transporters Changes the Translocation, Accumulation, and Potential Oxidative Stress of Cd and Zn in Rice (Oryza sativa). J. Hazard. Mater. 2019, 380, 120853. [Google Scholar] [CrossRef] [PubMed]
- Hussain, M.; Ahmad, S.; Hussain, S.; Lal, R.; Ul-Allah, S.; Nawaz, A. Rice in Saline Soils: Physiology, Biochemistry, Genetics, and Management. Adv. Agron. 2018, 148, 231–287. [Google Scholar] [CrossRef]
- Mahender, A.; Swamy, B.P.M.; Anandan, A.; Ali, J. Tolerance of Iron-Deficient and -Toxic Soil Conditions in Rice. Plants 2019, 8, 31. [Google Scholar] [CrossRef] [PubMed] [Green Version]
- Chaiwong, N.; Prom, U.T.C.; Bouain, N.; Lacombe, B.; Rouached, H. Individual Versus Combinatorial Effects of Silicon, Phosphate, and Iron Deficiency on the Growth of Lowland and Upland Rice Varieties. Int. J. Mol. Sci. 2018, 19, 899. [Google Scholar] [CrossRef] [PubMed] [Green Version]
- Liu, C.; Gao, T.; Liu, Y.; Liu, J.; Li, F.; Chen, Z.; Li, Y.; Lv, Y.; Song, Z.; Reinfelder, J.R.; et al. Isotopic Fingerprints Indicate Distinct Strategies of Fe Uptake in Rice. Chem. Geol. 2019, 524, 323–328. [Google Scholar] [CrossRef]
- Muller, C.; Silveira, S.; Daloso, D.M.; Mendes, G.C.; Merchant, A.; Kuki, K.N.; Oliva, M.A.; Loureiro, M.E.; Almeida, A.M. Ecophysiological Responses to Excess Iron in Lowland and Upland Rice Cultivars. Chemosphere 2017, 189, 123–133. [Google Scholar] [CrossRef]
- Wang, Y.; Zhang, B.; Jiang, D.; Chen, G. Silicon Improves Photosynthetic Performance by Optimizing Thylakoid Membrane Protein Components in Rice Under Drought Stress. Environ. Exp. Bot. 2019, 158, 117–124. [Google Scholar] [CrossRef]
- Li, Y.T.; Xu, W.W.; Ren, B.Z.; Zhao, B.; Zhang, J.; Liu, P.; Zhang, Z.S. High Temperature Reduces Photosynthesis in Maize Leaves by Damaging Chloroplast Ultrastructure and Photosystem II. J. Agron. Crop Sci. 2020, 206, 548–564. [Google Scholar] [CrossRef]
- Mongon, J.; Chaiwong, N.; Bouain, N.; Prom, U.T.C.; Secco, D.; Rouached, H. Phosphorus and Iron Deficiencies Influences Rice Shoot Growth in an Oxygen Dependent Manner: Insight from Upland and Lowland Rice. Int. J. Mol. Sci. 2017, 18, 607. [Google Scholar] [CrossRef] [Green Version]
- Kalaji, H.M.; Jajoo, A.; Oukarroum, A.; Brestic, M.; Zivcak, M.; Samborska, I.A.; Cetner, M.D.; Łukasik, I.; Goltsev, V.; Ladle, R.J. Chlorophyll a Fluorescence as a Tool to Monitor Physiological Status of Plants under Abiotic Stress Conditions. Acta Physiol. Plant. 2016, 38, 102. [Google Scholar] [CrossRef] [Green Version]
- Ding, Y.; Wang, Z.; Ren, M.; Zhang, P.; Li, Z.; Chen, S.; Ge, C.; Wang, Y. Iron and Callose Homeostatic Regulation in Rice Roots under Low Phosphorus. BMC Plant Biol. 2018, 18, 326. [Google Scholar] [CrossRef] [PubMed] [Green Version]
- Nam, H.I.; Shahzad, Z.; Dorone, Y.; Clowez, S.; Zhao, K.; Bouain, N.; Lay-Pruitt, K.S.; Cho, H.; Rhee, S.Y.; Rouached, H. Interdependent Iron and Phosphorus Availability Controls Photosynthesis through Retrograde Signaling. Nat. Commun. 2021, 12, 7211. [Google Scholar] [CrossRef] [PubMed]
- Yadavalli, V.; Neelam, S.; Rao, A.S.; Reddy, A.R.; Subramanyam, R. Differential Degradation of Photosystem I Subunits under Iron Deficiency in Rice. J. Plant Physiol. 2012, 169, 753–759. [Google Scholar] [CrossRef] [PubMed]
- Msilini, N.; Essemine, J.; Zaghdoudi, M.; Harnois, J.; Lachaal, M.; Ouerghi, Z.; Carpentier, R. How Does Iron Deficiency Disrupt the Electron Flow in Photosystem I of Lettuce Leaves? J. Plant Physiol. 2013, 170, 1400–1406. [Google Scholar] [CrossRef]
- Therby-Vale, R.; Lacombe, B.; Rhee, S.Y.; Nussaume, L.; Rouached, H. Mineral Nutrient Signaling Controls Photosynthesis: Focus on Iron Deficiency-Induced Chlorosis. Trends Plant Sci. 2022, 27, 502–509. [Google Scholar] [CrossRef]
- Plant Nutrition 3: Micronutrients and metals. Plant Cell 2015, 27. [CrossRef]
- Ji, C.; Li, J.; Jiang, C.; Zhang, L.; Shi, L.; Xu, F.; Cai, H. Zinc and Nitrogen Synergistic Act on Root-to-Shoot Translocation and Preferential Distribution in Rice. J. Adv. Res. 2022, 35, 187–198. [Google Scholar] [CrossRef]
- Zhang, J.; Wang, S.; Song, S.; Xu, F.; Pan, Y.; Wang, H. Transcriptomic and Proteomic Analyses Reveal New Insight into Chlorophyll Synthesis and Chloroplast Structure of Maize Leaves under Zinc Deficiency Stress. J. Proteom. 2019, 199, 123–134. [Google Scholar] [CrossRef]
- Bouain, N.; Krouk, G.; Lacombe, B.; Rouached, H. Getting to the Root of Plant Mineral Nutrition: Combinatorial Nutrient Stresses Reveal Emergent Properties. Trends Plant Sci. 2019, 24, 542–552. [Google Scholar] [CrossRef]
- Hanikenne, M.; Esteves, S.M.; Fanara, S.; Rouached, H. Coordinated Homeostasis of Essential Mineral Nutrients: A Focus on Iron. J. Exp. Bot. 2021, 72, 2136–2153. [Google Scholar] [CrossRef]
- Medici, A.; Szponarski, W.; Dangeville, P.; Safi, A.; Dissanayake, I.M.; Saenchai, C.; Emanuel, A.; Rubio, V.; Lacombe, B.; Ruffel, S.; et al. Identification of Molecular Integrators Shows that Nitrogen Actively Controls the Phosphate Starvation Response in Plants. Plant Cell. 2019, 31, 1171–1184. [Google Scholar] [CrossRef] [PubMed]
- Ding, Y.; Wang, Z.; Mo, S.; Liu, J.; Xing, Y.; Wang, Y.; Ge, C.; Wang, Y. Mechanism of Low Phosphorus Inducing the Main Root Lengthening of Rice. J. Plant Growth Regul. 2020, 40, 1032–1043. [Google Scholar] [CrossRef]
- Khaliq, M.A.; James, B.; Chen, Y.H.; Ahmed Saqib, H.S.; Li, H.H.; Jayasuriya, P.; Guo, W. Uptake, Translocation, and Accumulation of Cd and Its Interaction with Mineral Nutrients (Fe, Zn, Ni, Ca, Mg) in Upland Rice. Chemosphere 2019, 215, 916–924. [Google Scholar] [CrossRef] [PubMed]
- Niyigaba, E.; Twizerimana, A.; Mugenzi, I.; Ngnadong, W.A.; Ye, Y.P.; Wu, B.M.; Hai, J.B. Winter Wheat Grain Quality, Zinc and Iron Concentration Affected by a Combined Foliar Spray of Zinc and Iron Fertilizers. Agronomy 2019, 9, 250. [Google Scholar] [CrossRef] [Green Version]
- Yoshida, S.; Forno, D.A.; Cock, J.H. Laboratory Manual for Physiological Studies of Rice; The International Rice Research Institute: Los Baños, Philippines, 1976. [Google Scholar]
- Stinziano, J.R.; Morgan, P.B.; Lynch, D.J.; Saathoff, A.J.; McDermitt, D.K.; Hanson, D.T. The Rapid A-Ci Response: Photosynthesis in the Phenomic Era. Plant Cell Environ. 2017, 40, 1256–1262. [Google Scholar] [CrossRef] [PubMed] [Green Version]
- Farquhar, G.D.; von Caemmerer, S.; Berry, J.A. A Biochemical Model of Photosynthetic CO2 Assimilation in Leaves of C3 Species. Planta 1980, 149, 78–90. [Google Scholar] [CrossRef] [PubMed] [Green Version]
- Strasser, R.J.; Tsimilli-Michael, M.; Srivastava, A. Analysis of the Chlorophyll a Fluorescence Transient. In Chlorophyll a Fluorescence; Advances in Photosynthesis and Respiration; Papageorgiou, G.C., Govindjee, J., Eds.; Springer: Dordrecht, The Netherlands, 2004; Volume 19. [Google Scholar] [CrossRef]
- Strasser, R.J.; Tsimilli-Michael, M.; Dangre, D.; Rai, M. Biophysical Phenomics Reveals Functional Building Blocks of Plants Systems Biology: A Case Study for the Evaluation of the Impact of Mycorrhization with Piriformospora indica. In Advanced Techniques in Soil Microbiology; Soil Biology; Varma, A., Oelmüller, R., Eds.; Springer: Berlin/Heidelberg, Germany, 2007; Volume 11. [Google Scholar] [CrossRef]
- Guo, Y.; Lu, Y.; Goltsev, V.; Strasser, R.J.; Kalaji, H.M.; Wang, H.; Wang, X.; Chen, S.; Qiang, S. Comparative Effect of Tenuazonic Acid, Diuron, Bentazone, Dibromothymoquinone and Methyl Viologen on the Kinetics of Chl a Fluorescence Rise OJIP and The MR820 Signal. Plant Physiol. Biochem. 2020, 156, 39–48. [Google Scholar] [CrossRef]
- Strasser, R.J.; Tsimilli-Michael, M.; Qiang, S.; Goltsev, V. Simultaneous in vivo Recording of Prompt and Delayed Fluorescence and 820-nm Reflection Changes During Drying and after Rehydration of the Resurrection Plant Haberlea Rhodopensis. Biochim. Biophys. Acta 2010, 1797, 1313–1326. [Google Scholar] [CrossRef] [Green Version]
- Kalaji, H.M.; Schansker, G.; Ladle, R.J.; Goltsev, V.; Bosa, K.; Allakhverdiev, S.I.; Brestic, M.; Bussotti, F.; Calatayud, A.; Dabrowski, P.; et al. Frequently Asked Questions about in vivo Chlorophyll Fluorescence: Practical Issues. Photosynth. Res. 2014, 122, 121–158. [Google Scholar] [CrossRef] [Green Version]
- Kalaji, H.M.; Oukarroum, A.; Alexandrov, V.; Kouzmanova, M.; Brestic, M.; Zivcak, M.; Samborska, I.A.; Cetner, M.D.; Allakhverdiev, S.I.; Goltsev, V. Identification of Nutrient Deficiency in Maize and Tomato Plants by in Vivo Chlorophyll a Fluorescence Measurements. Plant Physiol. Biochem. 2014, 81, 16–25. [Google Scholar] [CrossRef]
- Kalaji, H.M.; Baba, W.; Gediga, K.; Goltsev, V.; Samborska, I.A.; Cetner, M.D.; Dimitrova, S.; Piszcz, U.; Bielecki, K.; Karmowska, K.; et al. Chlorophyll Fluorescence as a Tool for Nutrient Status Identification in Rapeseed Plants. Photosynth. Res. 2018, 136, 329–343. [Google Scholar] [CrossRef] [PubMed] [Green Version]
- Saenchai, C.; Bouain, N.; Kisko, M.; Prom, U.T.C.; Doumas, P.; Rouached, H. The Involvement of OsPHO1;1 in the Regulation of Iron Transport Through Integration of Phosphate and Zinc Deficiency Signaling. Front. Plant Sci. 2016, 7, 396. [Google Scholar] [CrossRef] [PubMed] [Green Version]
- Szerement, J.; Szatanik-Kloc, A.; Mokrzycki, J.; Mierzwa-Hersztek, M. Agronomic Biofortification with Se, Zn, and Fe: An Effective Strategy to Enhance Crop Nutritional Quality and Stress Defense—A Review. J. Soil Sci. Plant Nut. 2021, 22, 1129–1159. [Google Scholar] [CrossRef]
- Shen, J.; Li, X.; Zhu, X.; Ding, Z.; Huang, X.; Chen, X.; Jin, S. Molecular and Photosynthetic Performance in the Yellow Leaf Mutant of Torreya grandis According to Transcriptome Sequencing, Chlorophyll a Fluorescence, and Modulated 820 nm Reflection. Cells 2022, 11, 431. [Google Scholar] [CrossRef]
- Bano, H.; Athar, H.U.; Zafar, Z.U.; Kalaji, H.M.; Ashraf, M. Linking changes in chlorophyll a fluorescence with drought stress susceptibility in mung bean [Vigna radiata (L.) Wilczek]. Physiol. Plant. 2021, 172, 1244–1254. [Google Scholar] [CrossRef] [PubMed]
- Yoneyama, T.; Ishikawa, S.; Fujimaki, S. Route and Regulation of Zinc, Cadmium, and IronTransport in Rice Plants (Oryza sativa L.) during Vegetative Growth and Grain Filling: Metal Transporters, Metal Speciation, Grain Cd Reduction and Zn and Fe Biofortification. Int. J. Mol. Sci. 2015, 16, 19111–19129. [Google Scholar] [CrossRef] [PubMed] [Green Version]
- Paunov, M.; Koleva, L.; Vassilev, A.; Vangronsveld, J.; Goltsev, V. Effects of Different Metals on Photosynthesis: Cadmium and Zinc Affect Chlorophyll Fluorescence in Durum Wheat. Int. J. Mol. Sci. 2018, 19, 787. [Google Scholar] [CrossRef] [Green Version]
- Adil, M.F.; Sehar, S.; Han, Z.; Wa Lwalaba, J.L.; Jilani, G.; Zeng, F.; Chen, Z.H.; Shamsi, I.H. Zinc Alleviates Cadmium Toxicity by Modulating Photosynthesis, ROS Homeostasis, and Cation Flux Kinetics in Rice. Environ. Pollut. 2020, 265 Pt B, 114979. [Google Scholar] [CrossRef]
- Chen, S.; Strasser, R.J.; Qiang, S. In vivo assessment of effect of phytotoxin tenuazonic acid on PSII reaction centers. Plant Physiol. Biochem. 2014, 84, 10–21. [Google Scholar] [CrossRef]


| Cultivar | Treatments | FO/FV | φPo | φEo | φDo | φRo | ψEo | ψRo | δRo | RC/ABS | PIABS |
|---|---|---|---|---|---|---|---|---|---|---|---|
| CB9 | CK | 5.32 ± 0.10 a | 0.81 ± 0.00 a | 0.57 ± 0.01 a | 0.19 ± 0.00 d | 0.28 ± 0.01 a | 0.70 ± 0.01 a | 0.34 ± 0.02 a | 0.49 ± 0.02 ab | 0.87 ± 0.02 a | 8.88 ± 0.48 a |
| -Zn | 4.92 ± 0.17 b | 0.80 ± 0.01 ab | 0.50 ± 0.01 b | 0.20 ± 0.01 cd | 0.26 ± 0.02 b | 0.63 ± 0.01 b | 0.33 ± 0.03 a | 0.52 ± 0.04 a | 0.68 ± 0.04 b | 4.58 ± 0.34 b | |
| -P | 4.66 ± 0.13 c | 0.79 ± 0.01 b | 0.49 ± 0.00 c | 0.21 ± 0.01 c | 0.18 ± 0.01 c | 0.62 ± 0.01 b | 0.23 ± 0.01 b | 0.37 ± 0.02 c | 0.70 ± 0.03 b | 4.21 ± 0.28 c | |
| -Fe | 1.62 ± 0.04 f | 0.38 ± 0.01 d | 0.07 ± 0.01 g | 0.62 ± 0.01 a | 0.02 ± 0.00 f | 0.18 ± 0.02 e | 0.05 ± 0.01 e | 0.30 ± 0.07 cd | 0.13 ± 0.01 e | 0.02 ± 0.00 g | |
| -P-Fe | 3.81 ± 0.31 d | 0.74 ± 0.02 c | 0.34 ± 0.01 e | 0.26 ± 0.02 b | 0.08 ± 0.01 e | 0.46 ± 0.02 d | 0.11 ± 0.02 d | 0.25 ± 0.04 d | 0.57 ± 0.05 c | 1.36 ± 0.21 d | |
| -P-Zn | 3.49 ± 0.07 e | 0.71 ± 0.01 c | 0.32 ± 0.01 f | 0.29 ± 0.01 b | 0.12 ± 0.01 d | 0.45 ± 0.01 d | 0.17 ± 0.01 c | 0.38 ± 0.02 bc | 0.50 ± 0.02 d | 1.04 ± 0.07 f | |
| -Fe-Zn | 1.59 ± 0.11 f | 0.37 ± 0.04 d | 0.04 ± 0.01 h | 0.63 ± 0.04 a | 0.02 ± 0.01 f | 0.10 ± 0.02 f | 0.05 ± 0.02 e | 0.55 ± 0.21 a | 0.12 ± 0.01 e | 0.01 ± 0.00 g | |
| -P-Fe-Zn | 3.77 ± 0.16 d | 0.73 ± 0.01 c | 0.39 ± 0.00 d | 0.27 ± 0.01 b | 0.09 ± 0.01 e | 0.53 ± 0.01 c | 0.12 ± 0.02 d | 0.23 ± 0.03 d | 0.52 ± 0.02 d | 1.66 ± 0.05 e | |
| BJ1 | CK | 5.22 ± 0.03 a | 0.81 ± 0.00 a | 0.56 ± 0.01 a | 0.19 ± 0.00 d | 0.30 ± 0.02 b | 0.70 ± 0.01 a | 0.37 ± 0.02 b | 0.53 ± 0.03 b | 0.84 ± 0.03 a | 8.14 ± 0.64 a |
| -Zn | 5.20 ± 0.10 a | 0.81 ± 0.00 a | 0.57 ± 0.01 a | 0.19 ± 0.00 d | 0.31 ± 0.01 a | 0.70 ± 0.01 a | 0.39 ± 0.01 a | 0.55 ± 0.02 b | 0.81 ± 0.02 b | 8.02 ± 0.60 a | |
| -P | 4.11 ± 0.12 b | 0.76 ± 0.01 b | 0.35 ± 0.01 c | 0.24 ± 0.01 c | 0.13 ± 0.01 d | 0.47 ± 0.01 c | 0.17 ± 0.01 d | 0.36 ± 0.02 c | 0.57 ± 0.04 d | 1.56 ± 0.14 c | |
| -Fe | 2.00 ± 0.05 c | 0.50 ± 0.01 c | 0.05 ± 0.00 e | 0.50 ± 0.01 b | 0.04 ± 0.01 e | 0.11 ± 0.01 e | 0.07 ± 0.01 e | 0.68 ± 0.10 a | 0.20 ± 0.02 e | 0.02 ± 0.00 d | |
| -P-Fe | 2.08 ± 0.09 c | 0.52 ± 0.02 c | 0.04 ± 0.00 f | 0.48 ± 0.02 b | 0.03 ± 0.00 e | 0.07 ± 0.01 f | 0.05 ± 0.01 f | 0.70 ± 0.10 a | 0.22 ± 0.01 e | 0.02 ± 0.00 d | |
| -P-Zn | 4.06 ± 0.15 b | 0.75 ± 0.01 b | 0.42 ± 0.01 b | 0.25 ± 0.01 c | 0.15 ± 0.02 c | 0.55 ± 0.02 b | 0.20 ± 0.02 c | 0.37 ± 0.03 c | 0.61 ± 0.01 c | 2.29 ± 0.17 b | |
| -Fe-Zn | 1.75 ± 0.15 d | 0.43 ± 0.05 d | 0.05 ± 0.00 e | 0.57 ± 0.05 a | 0.04 ± 0.01 e | 0.12 ± 0.02 e | 0.08 ± 0.01 e | 0.71 ± 0.17 a | 0.16 ± 0.02 f | 0.02 ± 0.00 d | |
| -P-Fe-Zn | 1.80 ± 0.07 d | 0.44 ± 0.02 d | 0.08 ± 0.01 d | 0.56 ± 0.02 a | 0.03 ± 0.00 e | 0.18 ± 0.03 d | 0.07 ± 0.01 e | 0.41 ± 0.07 c | 0.20 ± 0.03 e | 0.04 ± 0.00 d |
Disclaimer/Publisher’s Note: The statements, opinions and data contained in all publications are solely those of the individual author(s) and contributor(s) and not of MDPI and/or the editor(s). MDPI and/or the editor(s) disclaim responsibility for any injury to people or property resulting from any ideas, methods, instructions or products referred to in the content. |
© 2023 by the authors. Licensee MDPI, Basel, Switzerland. This article is an open access article distributed under the terms and conditions of the Creative Commons Attribution (CC BY) license (https://creativecommons.org/licenses/by/4.0/).
Share and Cite
Gao, D.; Ran, C.; Dang, K.; Wang, X.; Zhang, Y.; Geng, Y.; Liu, S.; Guan, Z.; Guo, L.; Shao, X. Effect of Phosphorus, Iron, Zinc, and Their Combined Deficiencies on Photosynthetic Characteristics of Rice (Oryza sativa L.) Seedlings. Agronomy 2023, 13, 1657. https://doi.org/10.3390/agronomy13061657
Gao D, Ran C, Dang K, Wang X, Zhang Y, Geng Y, Liu S, Guan Z, Guo L, Shao X. Effect of Phosphorus, Iron, Zinc, and Their Combined Deficiencies on Photosynthetic Characteristics of Rice (Oryza sativa L.) Seedlings. Agronomy. 2023; 13(6):1657. https://doi.org/10.3390/agronomy13061657
Chicago/Turabian StyleGao, Dapeng, Cheng Ran, Kun Dang, Xiaolei Wang, Yunhe Zhang, Yanqiu Geng, Shuying Liu, Zhengwen Guan, Liying Guo, and Xiwen Shao. 2023. "Effect of Phosphorus, Iron, Zinc, and Their Combined Deficiencies on Photosynthetic Characteristics of Rice (Oryza sativa L.) Seedlings" Agronomy 13, no. 6: 1657. https://doi.org/10.3390/agronomy13061657