

CH4 and N2O Emission and Grain Yield Performance of Three Main Rice-Farming Patterns in Central China
Abstract
:1. Introduction
2. Materials and Methods
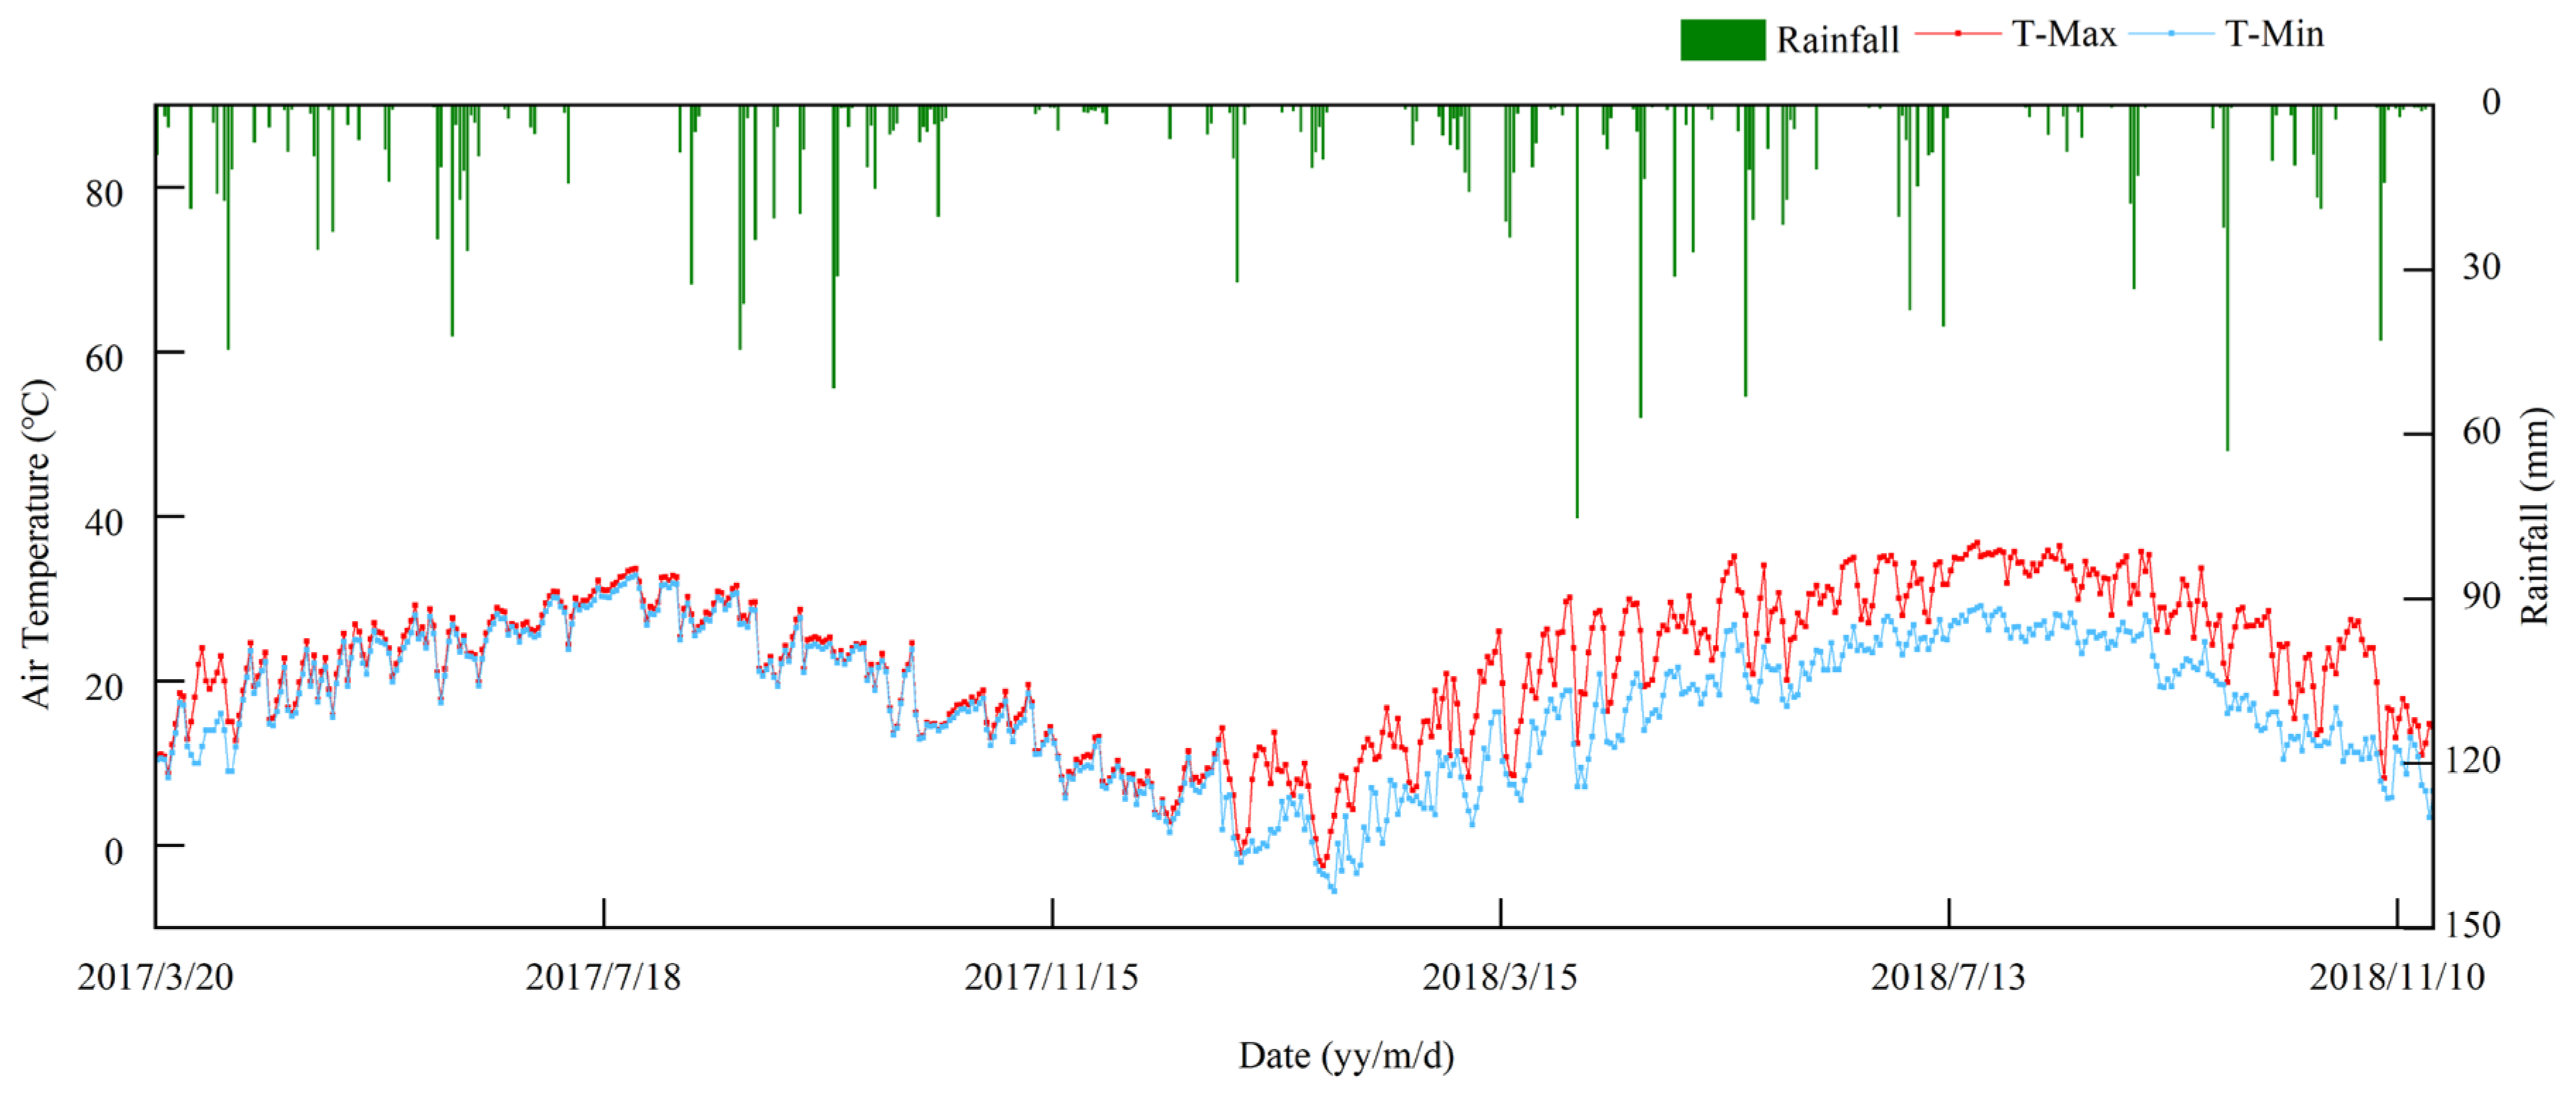
2.1. Experimental Site
2.2. Experimental Design
2.3. Gas Sample Collection and Analysis
2.4. Yield Measurement, Soil Sampling and Analysis
2.5. Statistical Analysis
3. Results
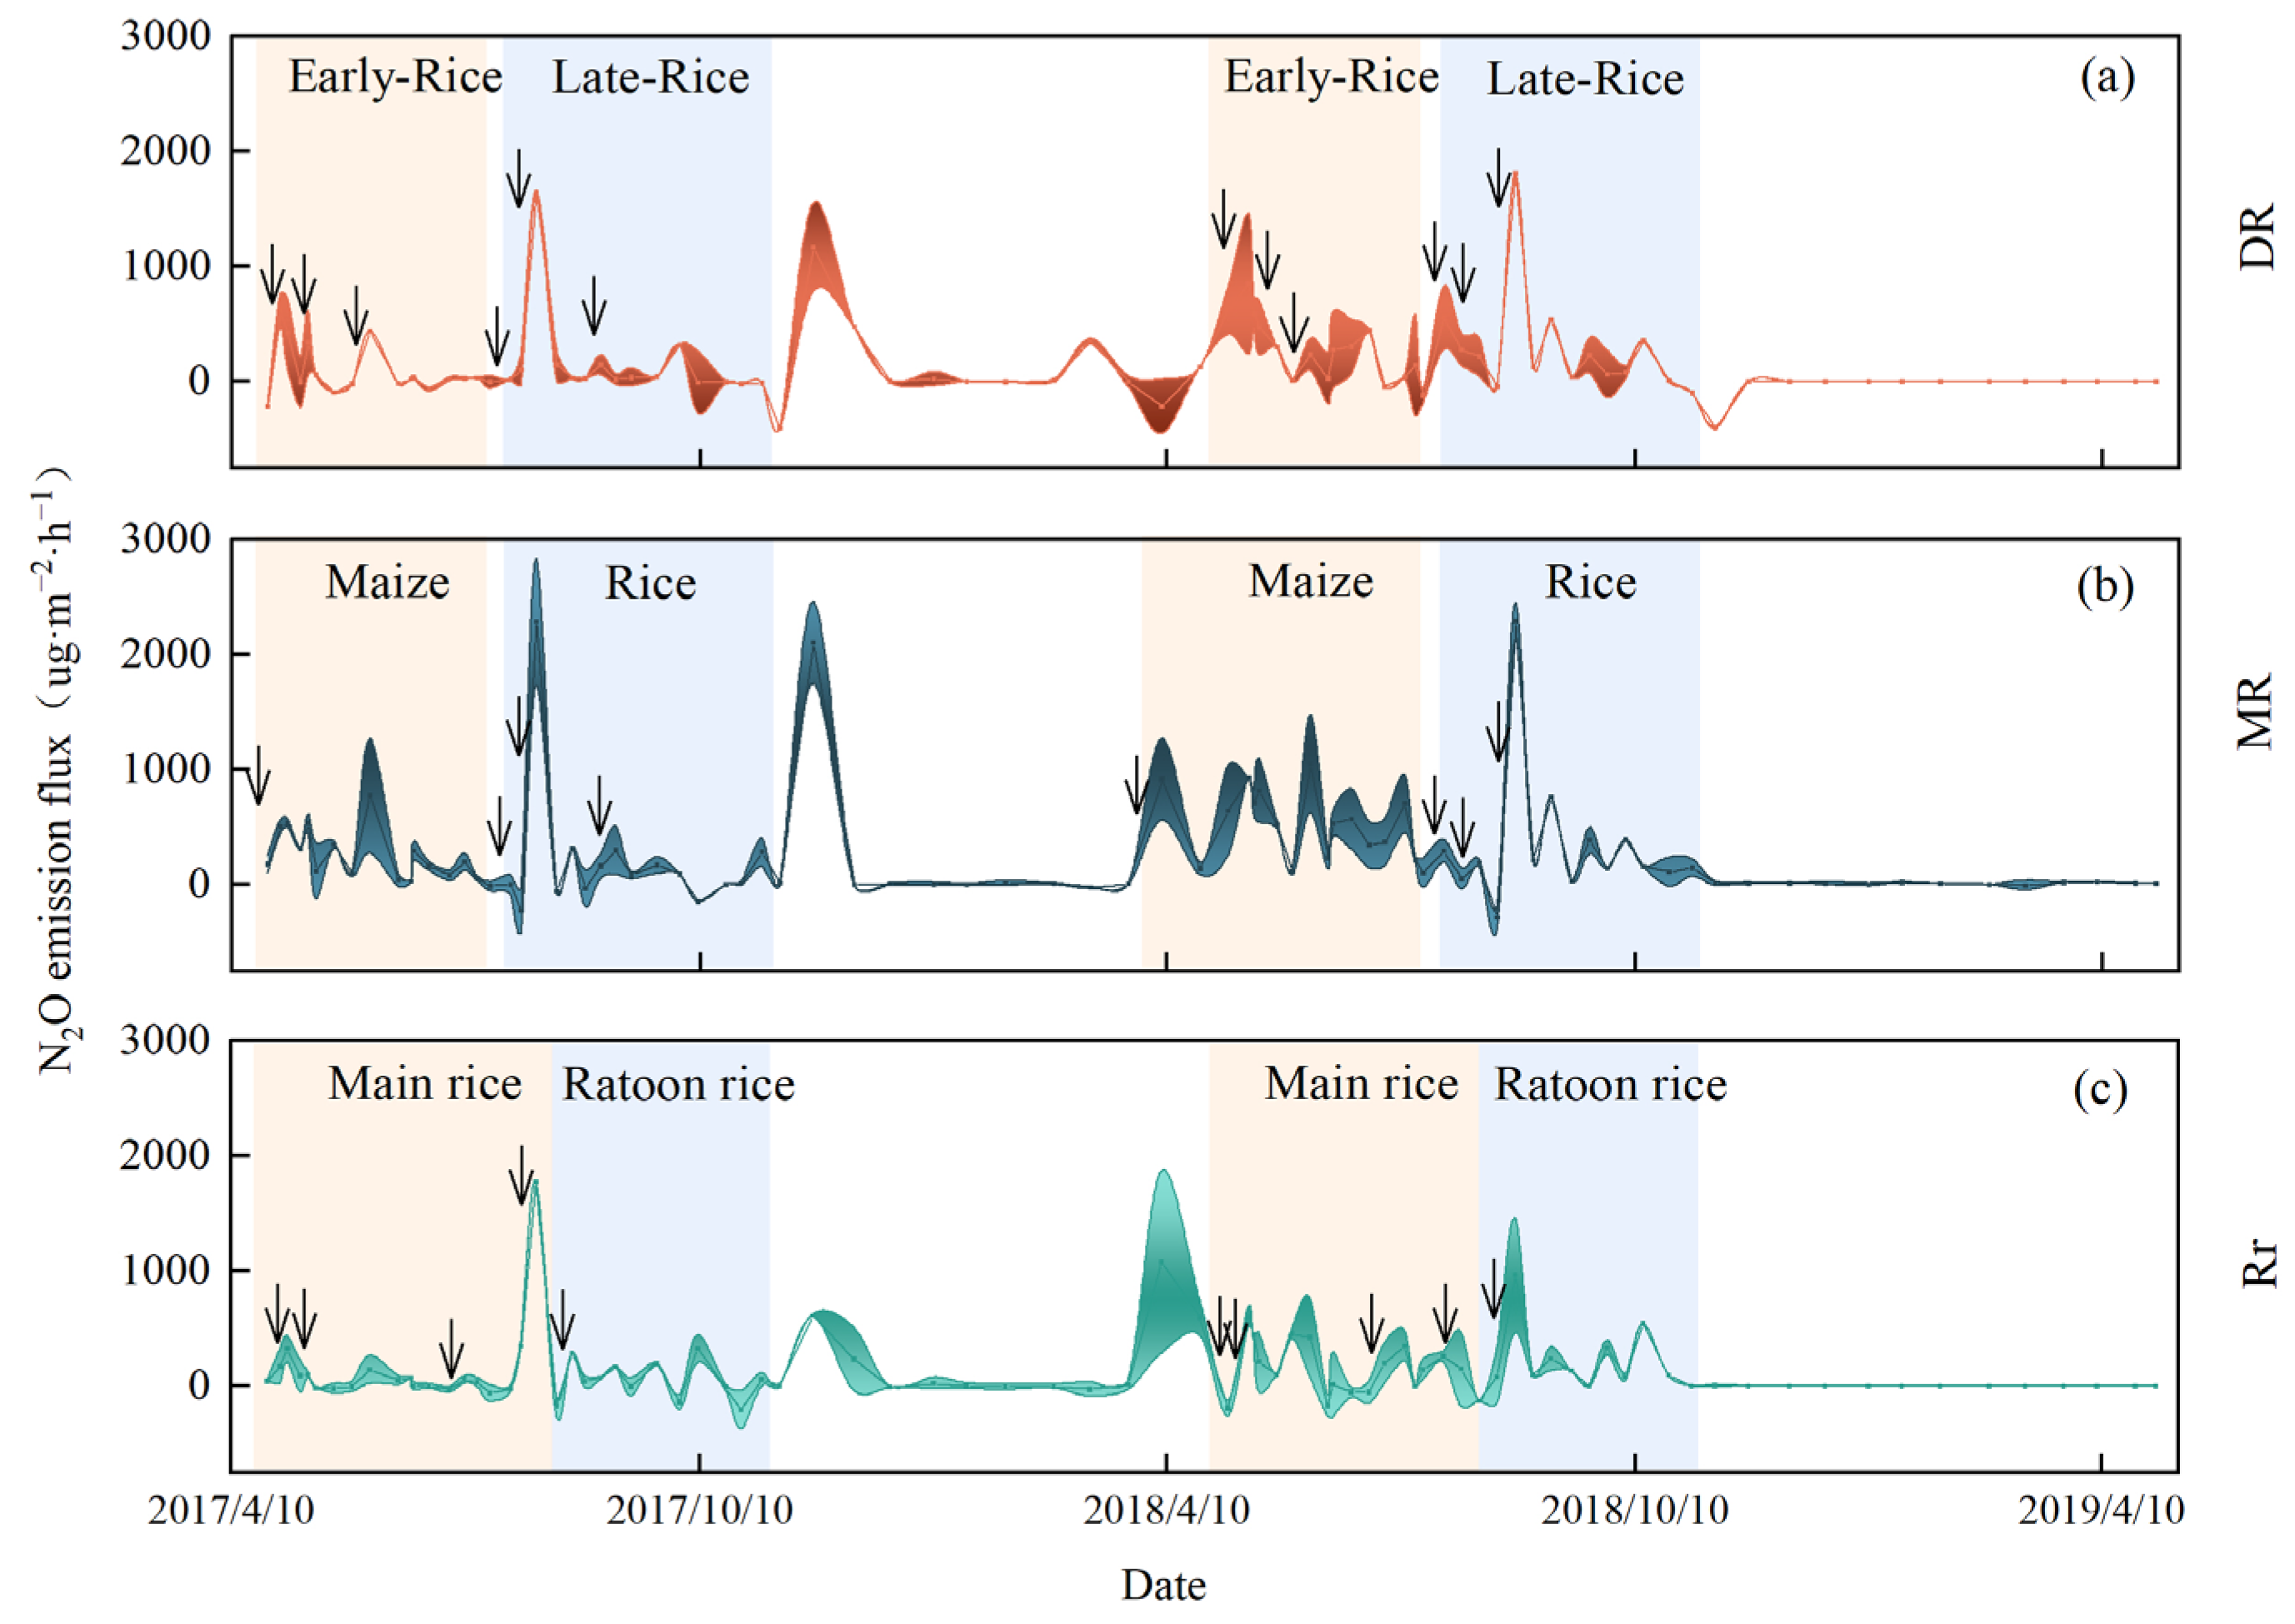
3.1. CH4 Emissions
3.2. N2O Emissions
3.3. Crop Yield
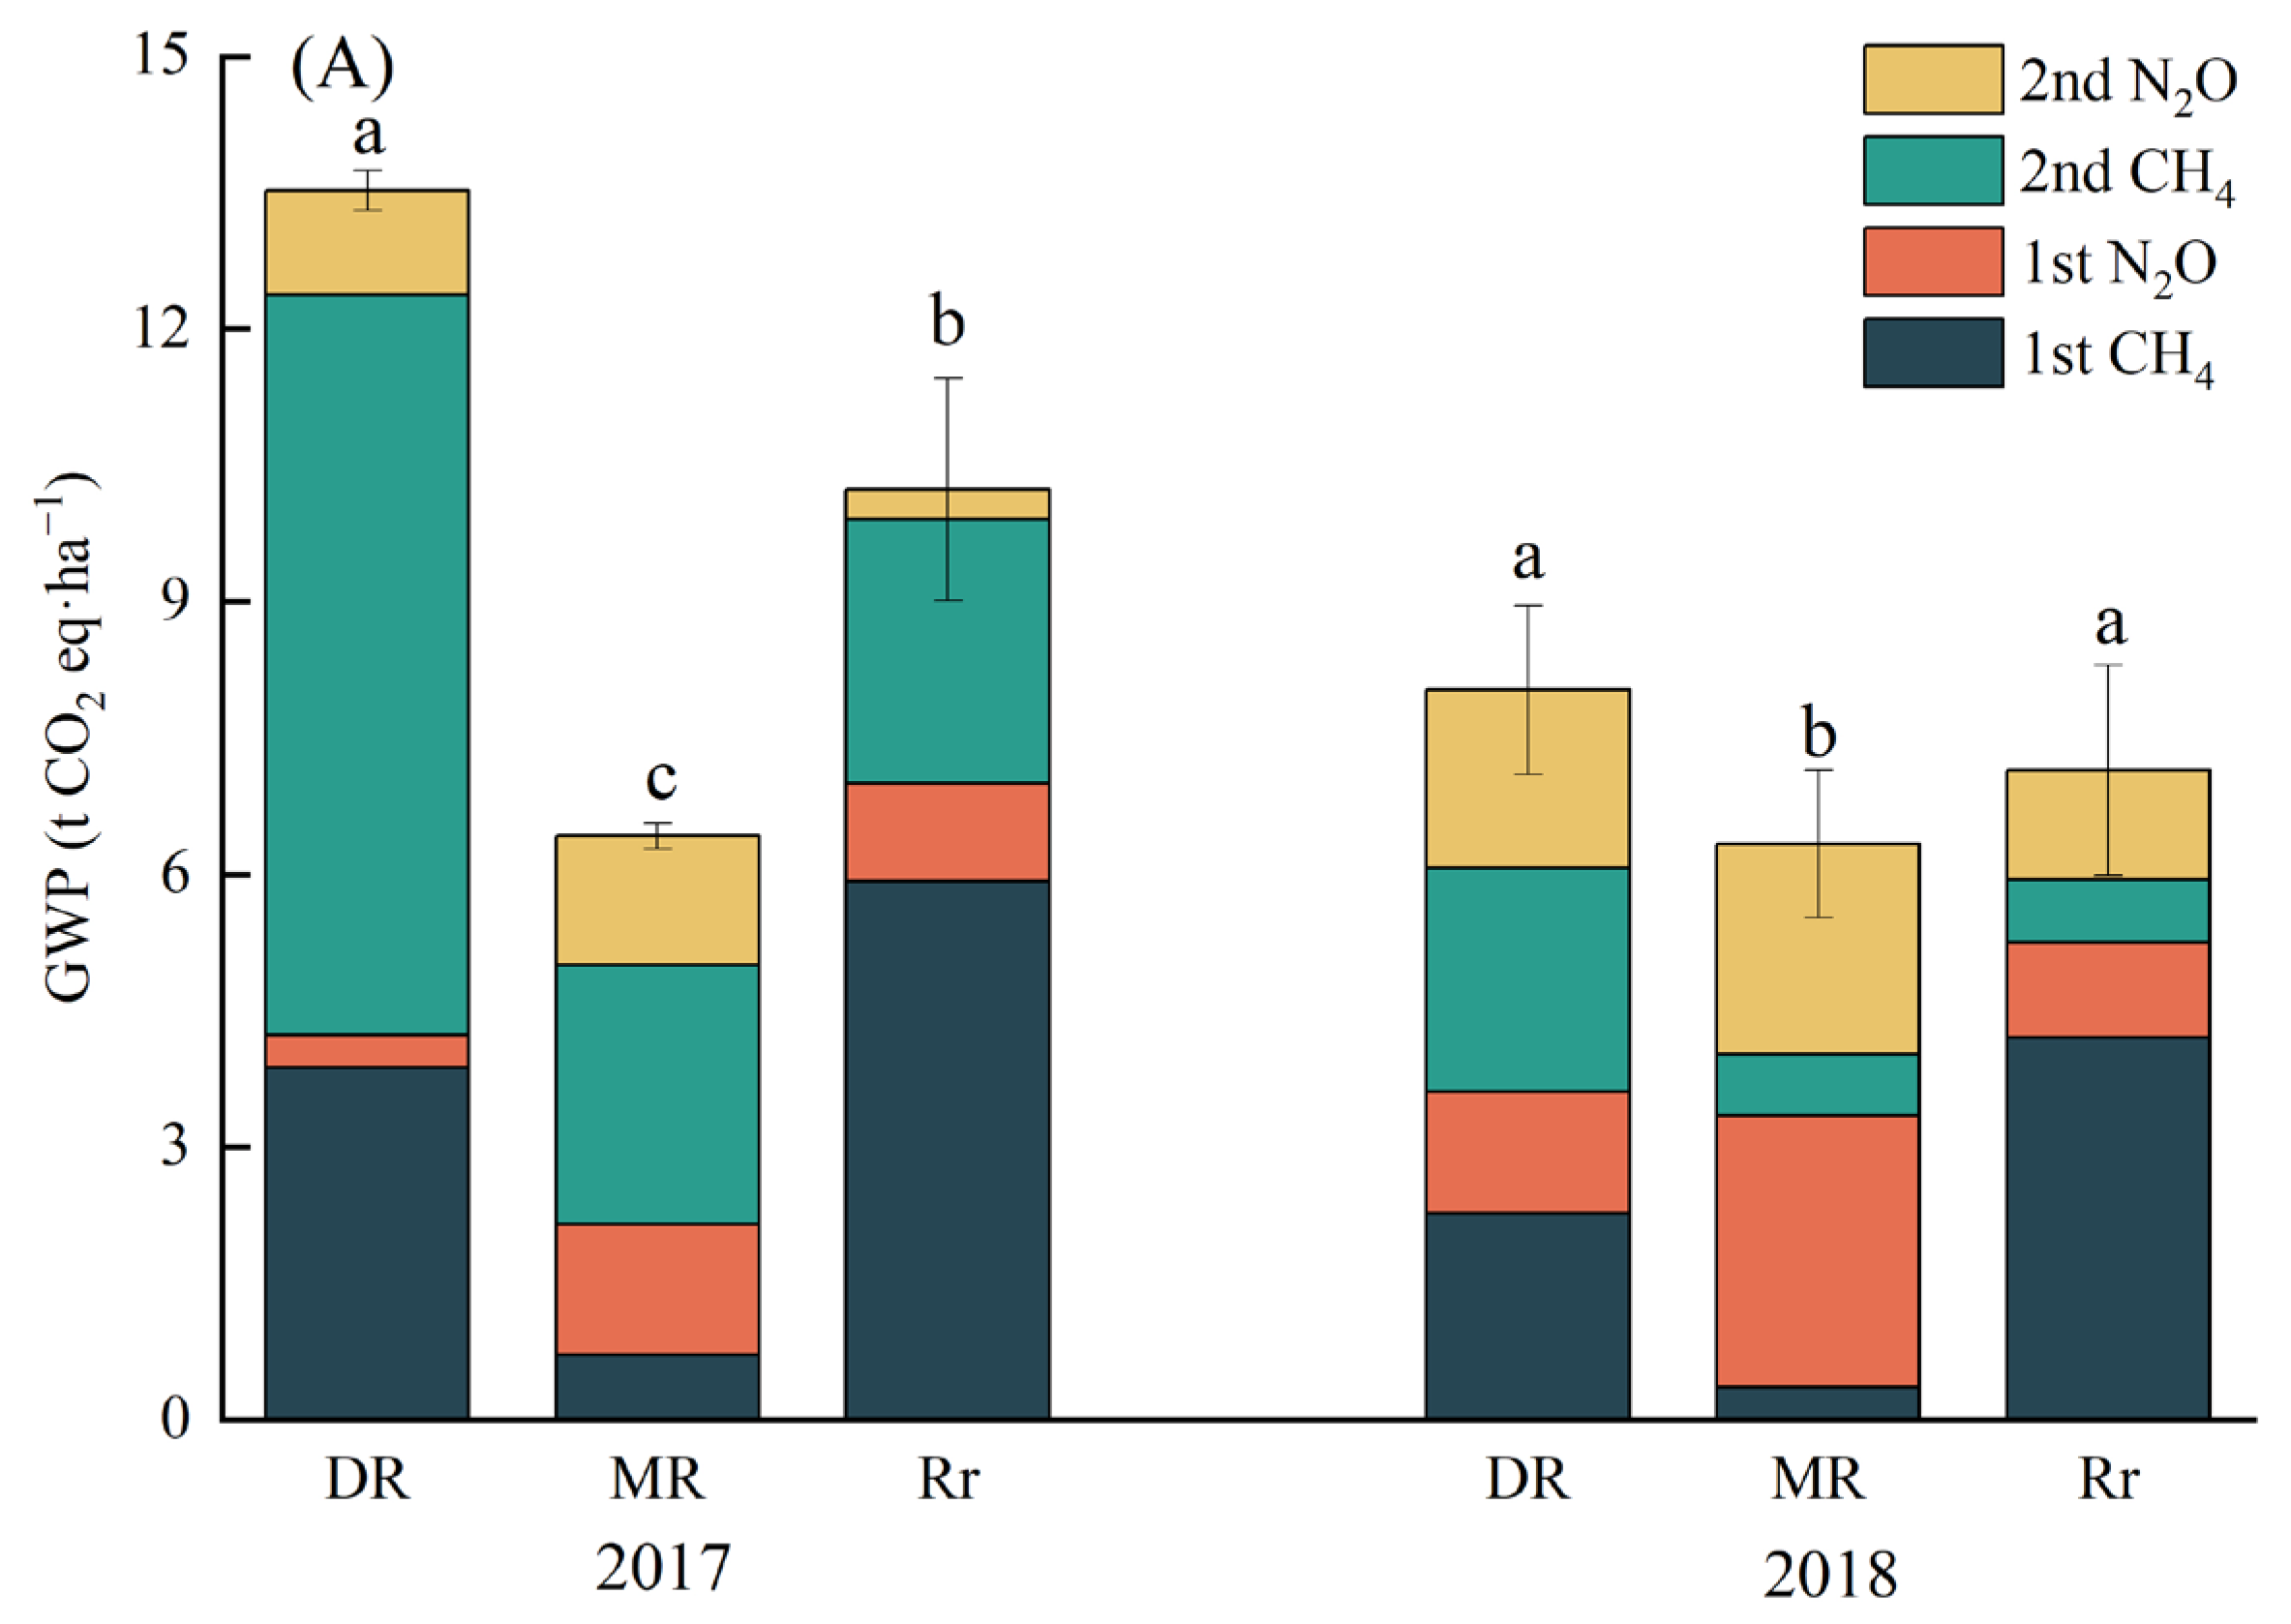
3.4. GWP and Yield-Scaled GWP
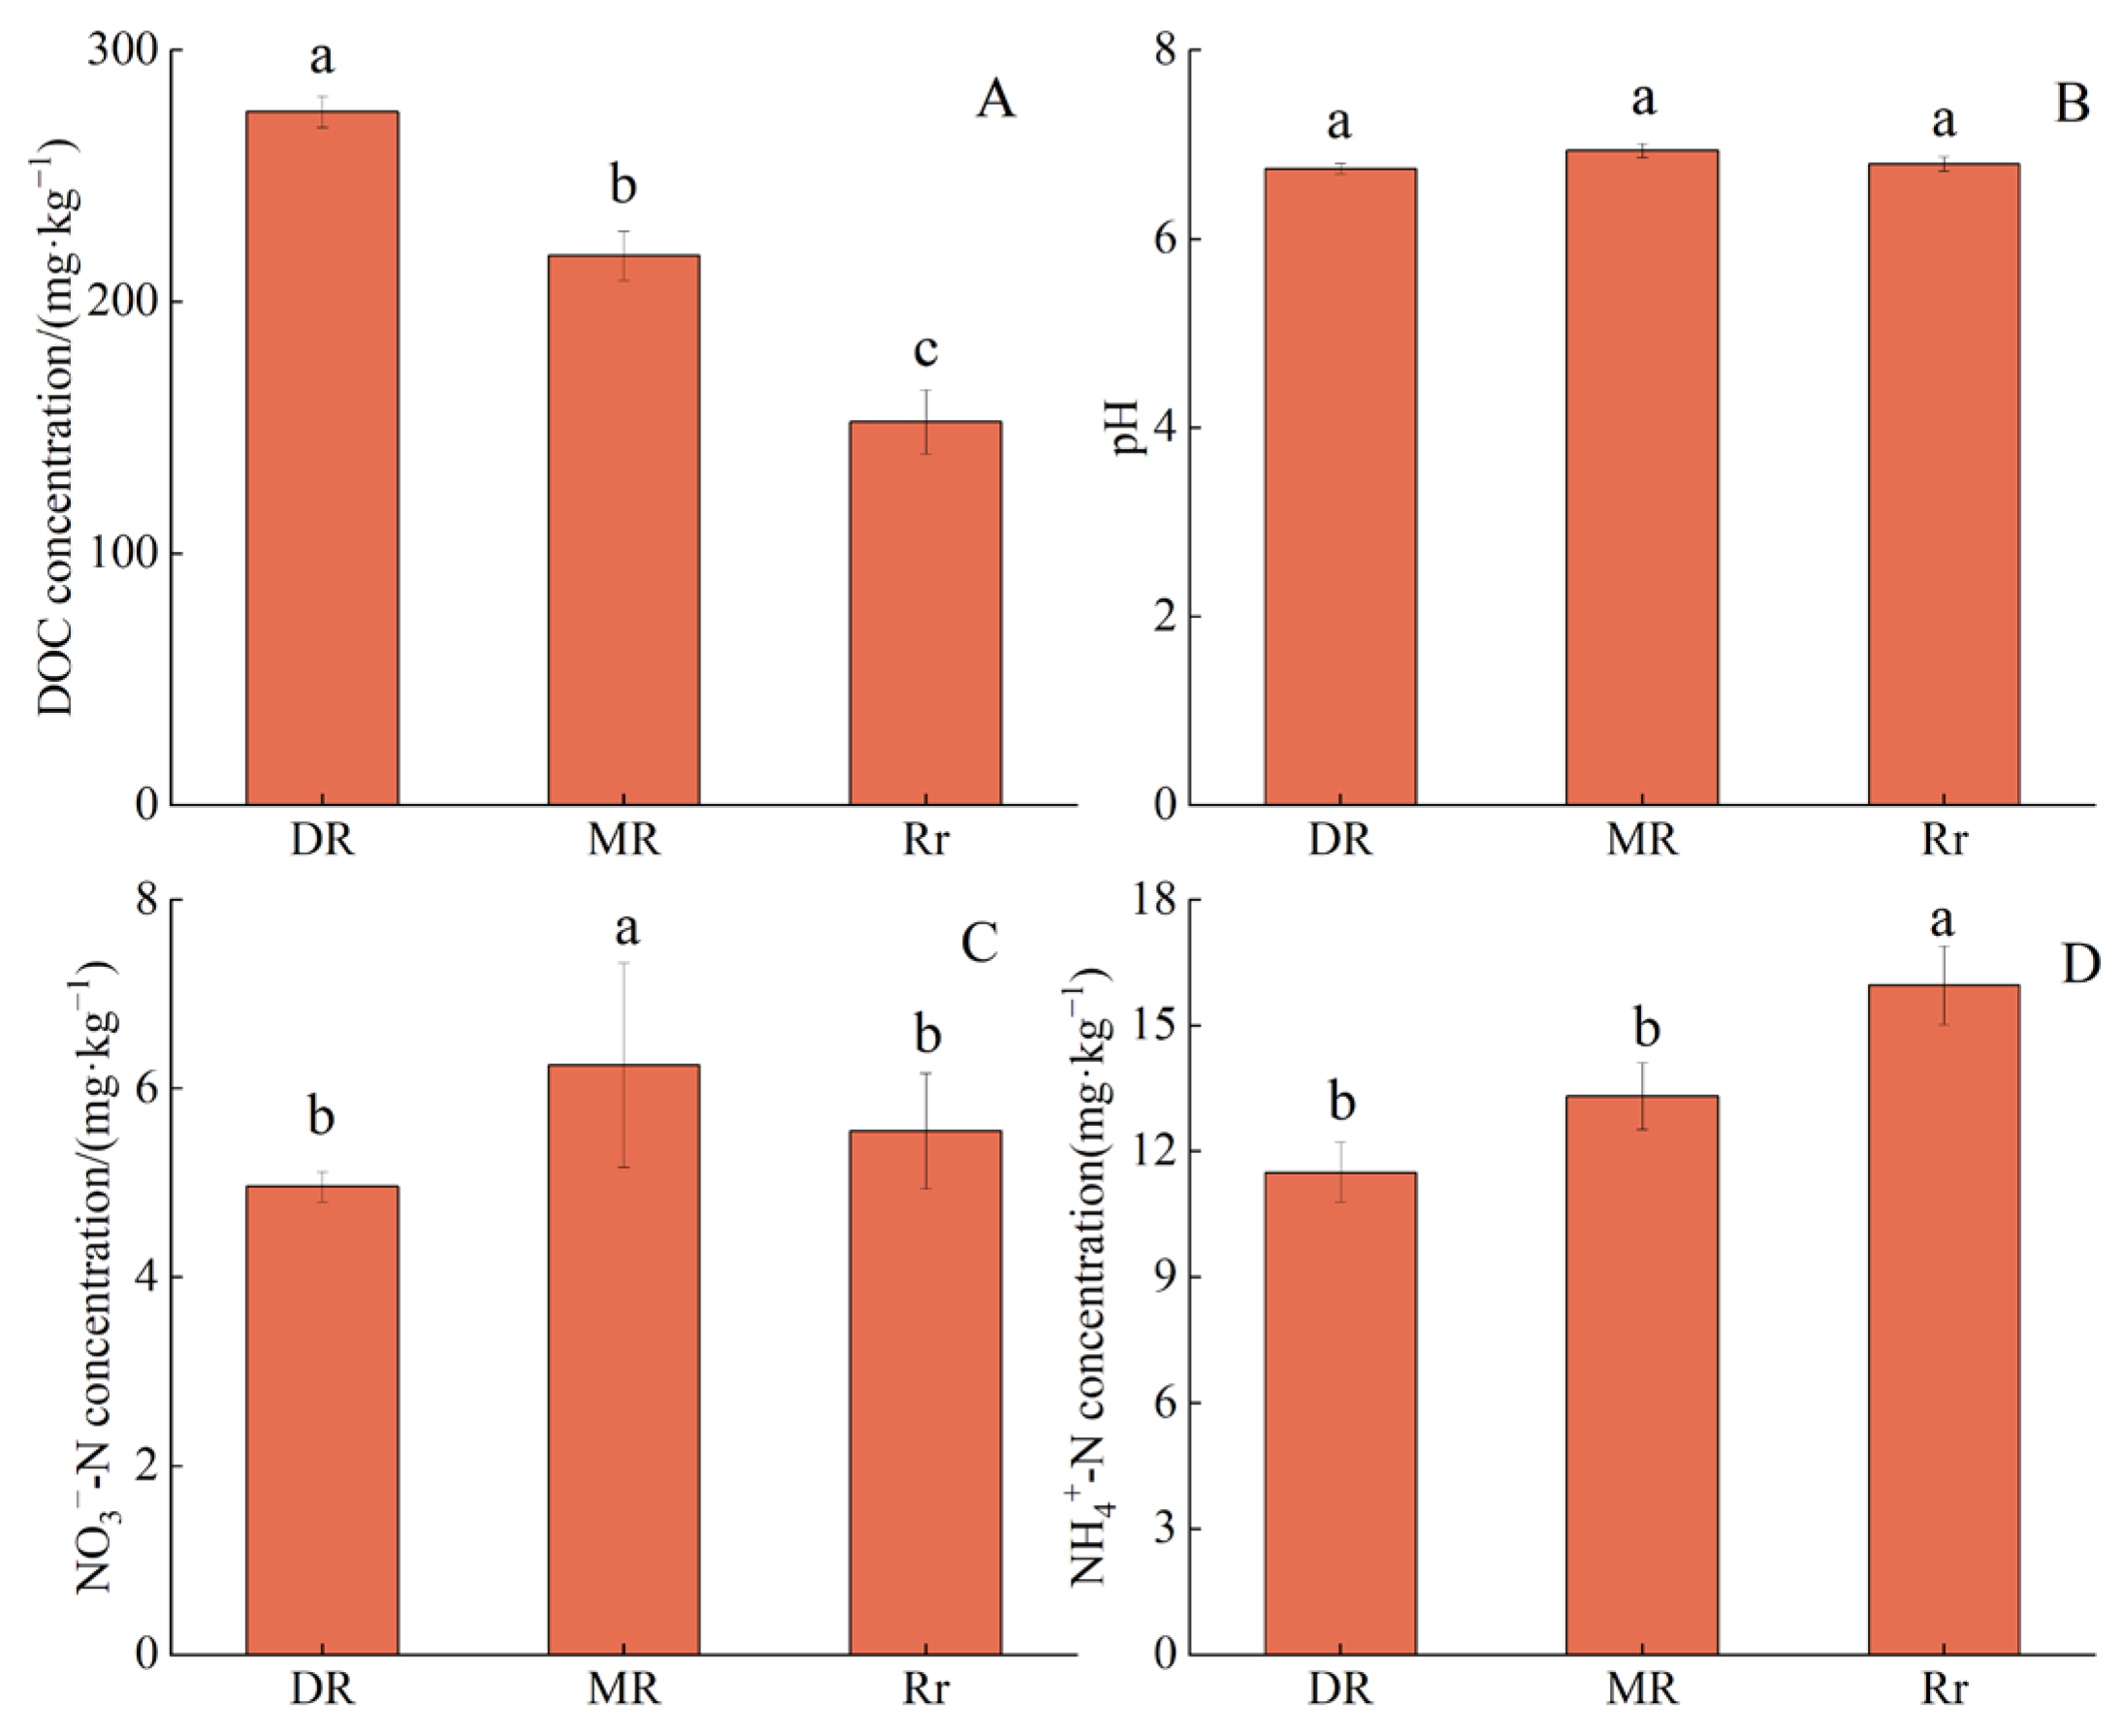
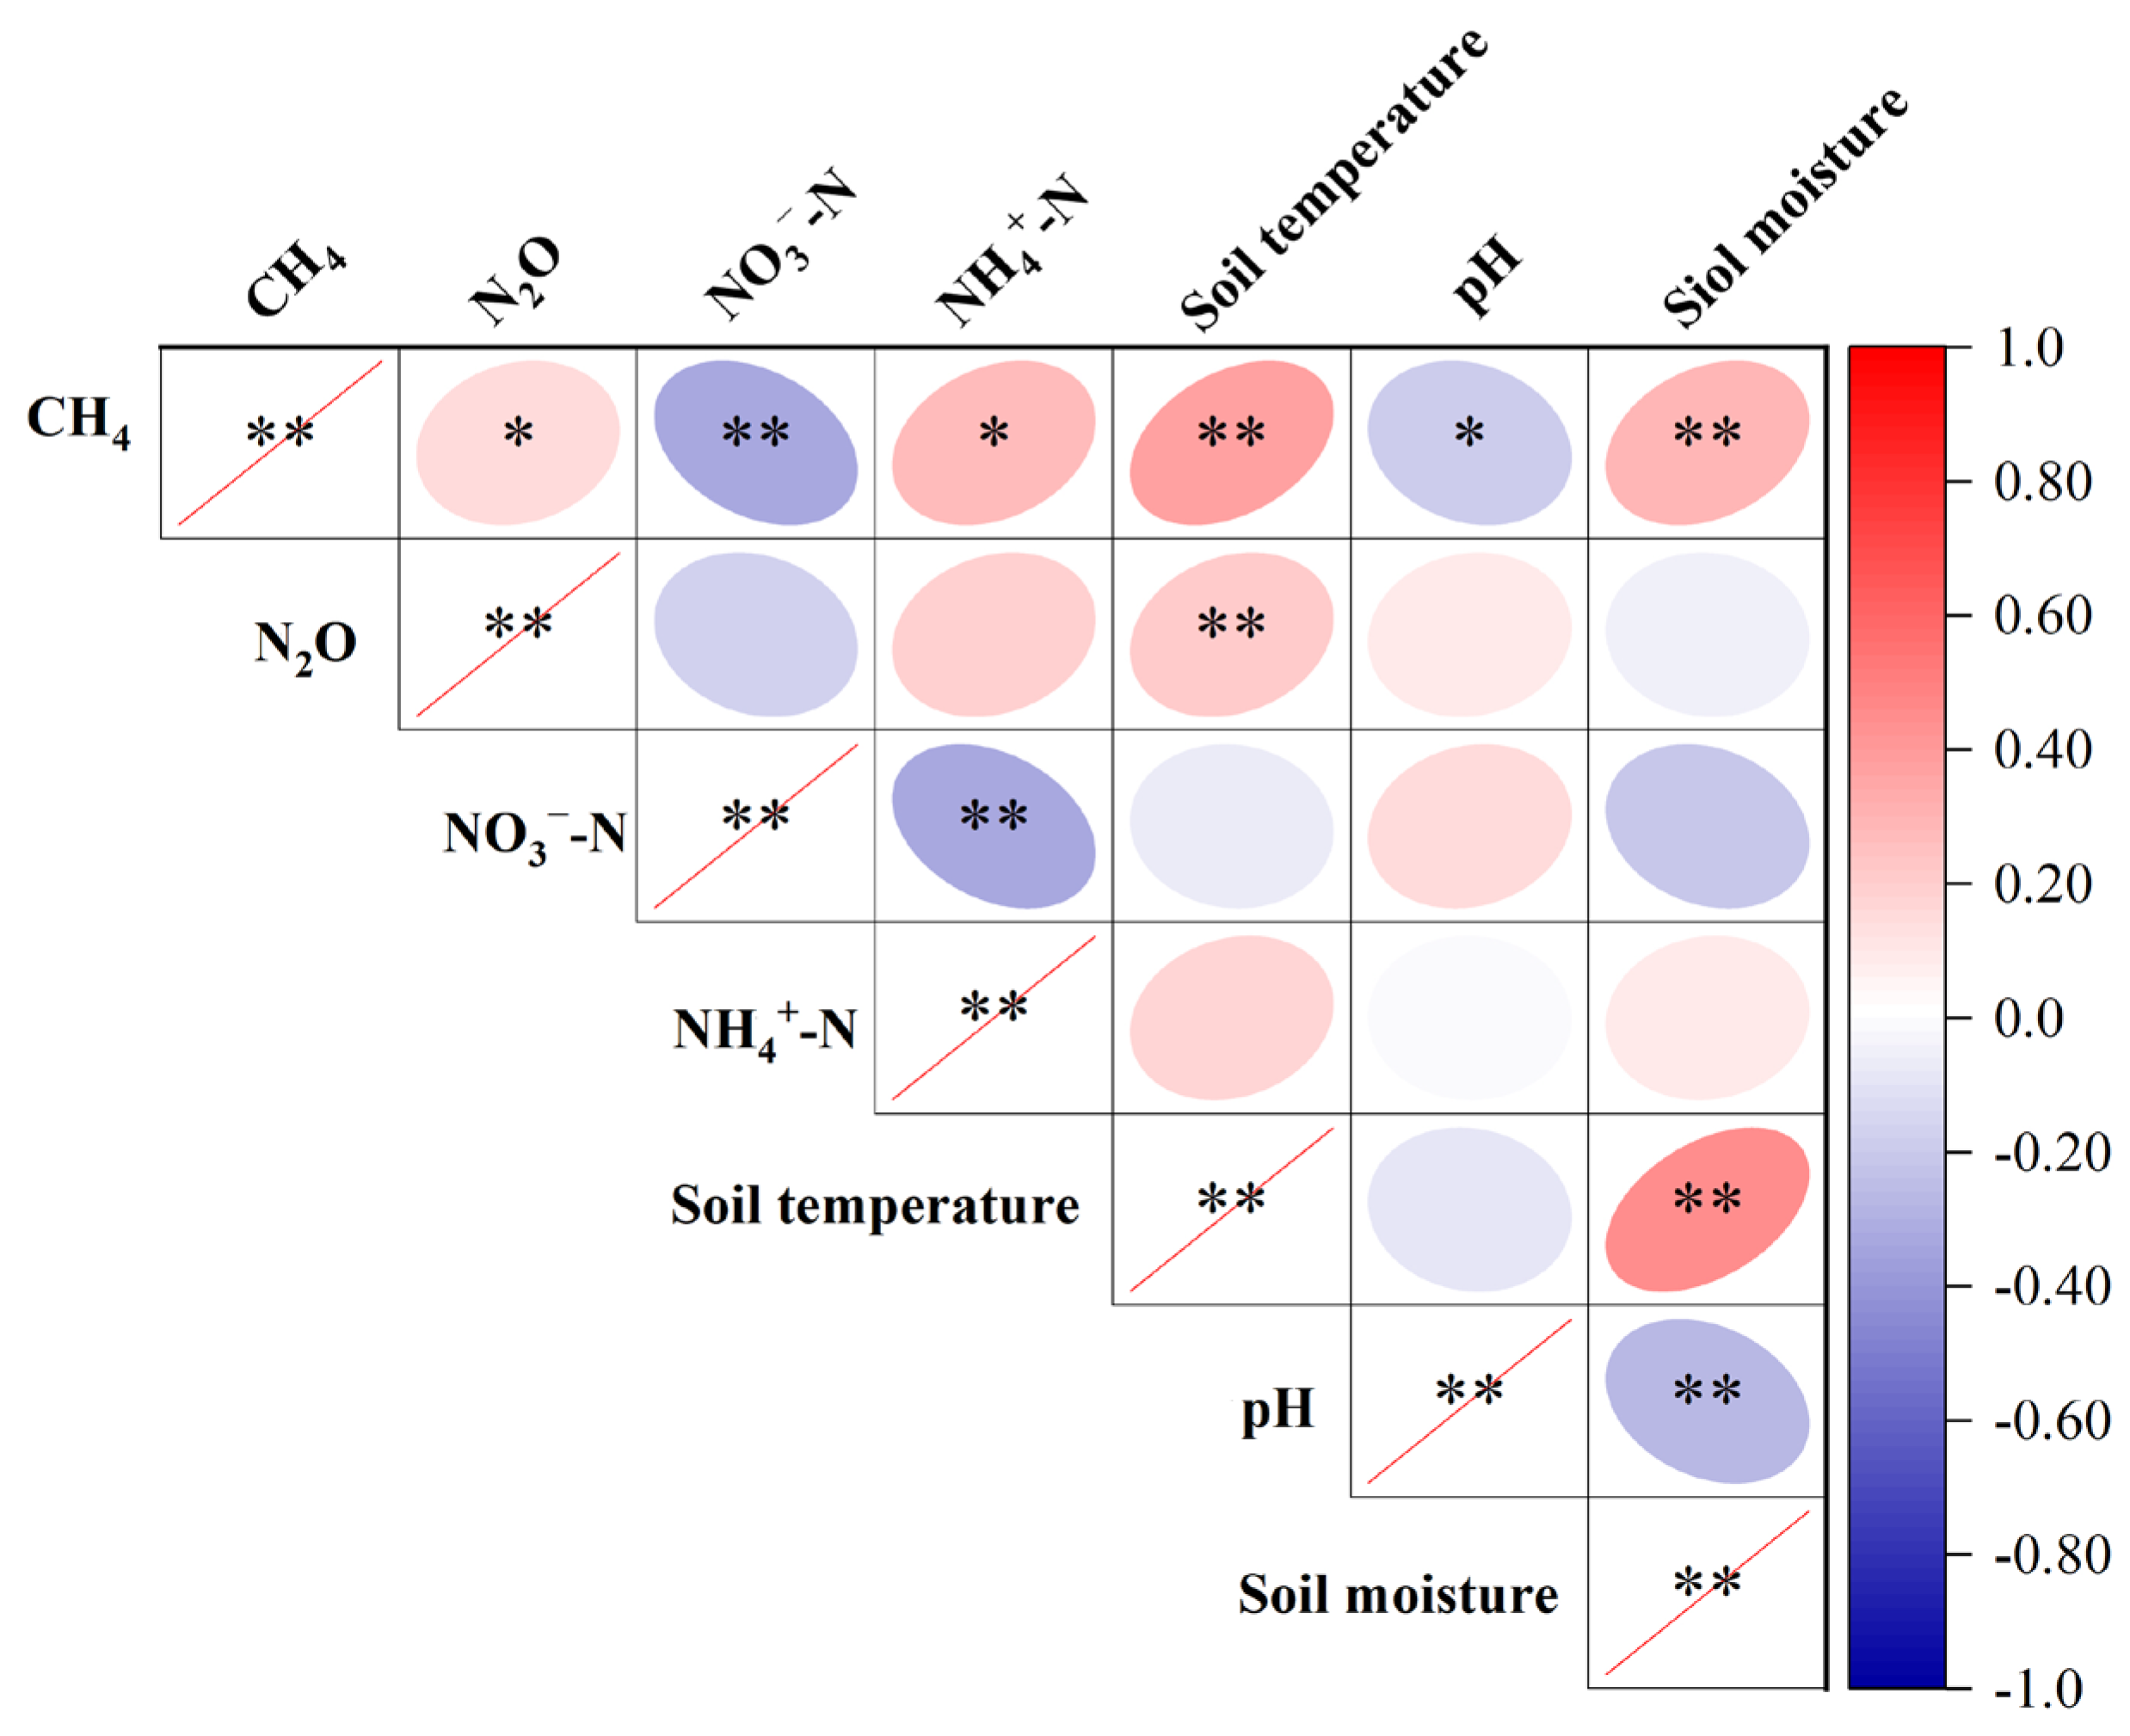
3.5. Soil Characteristics and Correlation between CH4 and N2O Emissions
4. Discussion
4.1. Impact of Crop Pattern on CH4 Emissions
4.2. Impact of Crop Pattern on N2O Emissions
4.3. Impact of Crop Pattern on Yield, GWP and Yield-Scaled GWP
5. Conclusions
Author Contributions
Funding
Data Availability Statement
Conflicts of Interest
References
- Zhang, Y.M.; Hu, C.S.; Zhang, J.B.; Dong, W.X.; Wang, Y.Y.; Song, L.N. Research advances on source/sink intensities and greenhouse effects of CO2, CH4 and N2O in agricultural soils. Chin. J. Eco-Agric. 2011, 19, 966–975. [Google Scholar] [CrossRef]
- Wang, C.; Shen, J.L.; Zheng, L.; Liu, J.Y.; Qin, H.L.; Li, Y.; Wu, J.S. Effects of combined applications of pig manure and chemical fertilizers on CH4 and N2O emissions and their global warming potentials in paddy fields with double-rice cropping. Environ. Sci. 2014, 35, 3120–3127. [Google Scholar]
- IPCC. Climate Change 2021: The Physical Science Basis: Working Group I Contribution to the Sixth Assessment Report of the Intergovernmental Panel on Climate Change; Cambridge University Press: Cambridge, UK; New York, NY, USA, 2021. [Google Scholar]
- Liu, H.J.; Guo, Z.; Zhang, L.P.; Zhu, X.L.; Sun, G.F.; Chen, L.G.; Zheng, J.C. Effects of different combined application ratio of organic-inorganic fertilization on CH4 and N2O emissions in paddy season. Ecol. Environ. Sci. 2016, 25, 808–814. [Google Scholar]
- Liang, K.M.; Zhong, X.H.; Huang, N.R.; Rubennito, M.L.; Pan, J.F.; Tian, K.; Liu, Y.Z. Grain yield, water productivity and CH4 emission of irrigated rice in response to water management in south China. Agric. Water Manag. 2016, 163, 319–331. [Google Scholar] [CrossRef]
- Zhang, W.; Yu, Y.; Li, T.; Sun, W.; Huang, Y. Net greenhouse gas balance in China’s croplands over the last three decades and its mitigation potential. Environ. Sci. Technol. 2014, 48, 2589–2597. [Google Scholar] [CrossRef]
- Liu, K.; Harrison, M.T.; Yan, H.; Liu, D.L.; Meinke, H.; Hoogenboom, G.; Wang, B.; Peng, B.; Guan, K.Y.; Jaegermeyr, J.; et al. Silver lining to a climate crisis in multiple prospects for alleviating crop waterlogging under future climates. Nat. Commun. 2023, 14, 765. [Google Scholar] [CrossRef]
- Zhou, W.; Lv, T.F.; Chen, Y.; Westby, A.P.; Ren, W.J. Soil physicochemical and biological properties of paddy-upland rotation: A review. Sci. World J. 2014, 2014, 856352. [Google Scholar] [CrossRef]
- Wang, T.Y.; Fan, D.; Song, K.F.; Zhang, G.B.; Xu, H.; Ma, J. Reduced methane and nitrous oxide emissions from ratoon rice paddy in Chaohu polder area. J. Agro-Environ. Sci. 2021, 40, 1829–1838. [Google Scholar]
- Zhang, L.; Xu, H.Q.; Li, L.L.; Chen, Y.W.; Zheng, H.B.; Tang, Q.Y.; Tang, J.W. Comparative study on CH4 emission from ratoon rice and double-cropping rice fields. Sci. Agric. Sin. 2019, 52, 2101–2113. [Google Scholar]
- Pittelkow, C.M.; Adviento-Borbe, M.A.; van Kessel, C.; Hill, J.E.; Linquist, B.A. Optimizing rice yields while minimizing yield-scaled global warming potential. Glob. Chang. Biol. 2014, 20, 1382–1393. [Google Scholar] [CrossRef] [PubMed]
- Strakova, P.; Penttilä, T.; Laine, J.; Laiho, R. Disentangling direct and indirect effects of water table drawdown on above-and belowground plant litter decomposition: Consequences for accumulation of organic matter in boreal peatlands. Glob. Chang. Biol. 2012, 18, 322–335. [Google Scholar] [CrossRef]
- Cha-un, N.; Chidthaisong, A.; Yagi, K.; Sudo, S.; Towprayoon, S. Greenhouse gas emissions, soil carbon sequestration and crop yields in a rain-fed rice field with crop rotation management. Agric. Ecosyst. Environ. 2017, 237, 109–120. [Google Scholar] [CrossRef]
- Yvon-Durocher, G.; Allen, A.P.; Bastviken, D.; Conrad, R.; Gudasz, C.; Stpierre, A.; Thanh-Duc, N.; Giorgio, P.A. Methane fluxes show consistent temperature dependence across microbial to ecosystem scales. Nature 2014, 507, 488–491. [Google Scholar] [CrossRef] [PubMed]
- Zhou, M.H.; Zhu, B.; Wang, X.G.; Wang, Y.Q. Long-term field measurements of annual methane and nitrous oxide emissions from a Chinese subtropical wheat-rice rotation system. Soil Biol. Biochem. 2017, 115, 21–34. [Google Scholar] [CrossRef]
- Linquist, B.; Groenigen, K.J.; Adviento-Borbe, M.A.; Pittelkow, C.; Kessel, C.V. An agronomic assessment of greenhouse gas emissions from major cereal crops. Glob. Chang. Biol. 2012, 18, 194–209. [Google Scholar] [CrossRef]
- Carlson, K.M.; Gerber, J.S.; Mueller, N.D.; Herrero, M.; MacDonald, G.K.; Brauman, K.A.; Havlik, P.; O’Connell, S.; Johnson, J.A.; Saatchi, S.; et al. Greenhouse gas emissions intensity of global croplands. Nat. Clim. Chang. 2017, 7, 63–68. [Google Scholar] [CrossRef]
- Zhou, M.H.; Zhu, B.; Bruggemann, N.; Wang, X.G.; Zheng, X.H.; Butterbach-Bahl, K. Nitrous oxide and methane emissions from a subtropical rice-rapeseed rotation system in China: A 3-year field case study. Agric. Ecosyst. Environ. 2015, 212, 297–309. [Google Scholar] [CrossRef]
- Zhang, G.B.; Yang, Y.T.; Huang, Q.; Ma, J.; Yu, H.Y.; Song, K.F.; Dong, Y.J.; Lv, S.H.; Xu, H. Reducing yield-scaled global warming potential and water use by rice plastic film mulching in a winter flooded paddy field. Eur. J. Agron. 2020, 114, 126007. [Google Scholar] [CrossRef]
- Kraus, D.; Weller, S.; Klatt, S.; Haas, E.; Wassmann, R.; Kiese, R.; Butterbach-Bahl, K. A new Landscape DNDC biogeochemical module to predict CH4 and N2O emissions from lowland rice and upland cropping systems. Plant Soil. 2015, 386, 125–149. [Google Scholar] [CrossRef]
- Towprayoon, S.; Smakgahn, K.; Poonkaew, S. Mitigation of methane and nitrous oxide emissions from drained irrigated rice fields. Chemosphere 2005, 59, 1547–1556. [Google Scholar] [CrossRef]
- Feng, X.; Jiang, C.S.; Peng, X.L.; Li, Y.P.; Hao, Q.J. Effects of the Crop Rotation on Greenhouse Gases from Flooded Paddy Fields. Eco. Environ. 2019, 40, 392–400. [Google Scholar]
- Singh, S.K.; Bharadwaj, V.; Thakur, T.C.; Singh, P.P.; Mishra, A.K. Influence of crop establishment methods on methane emission from rice fields. Researchgate 2009, 97, 84–89. [Google Scholar]
- Wang, N.; Chang, Z.Z.; Xue, X.M.; Yu, J.G.; Shi, X.X.; Lena, Q.M.; Li, H.B. Biochar decreases nitrogen oxide and enhances methane emissions via altering microbial community composition of anaerobic paddy soil. Sci. Total Environ. 2017, 581–582, 689–696. [Google Scholar] [CrossRef]
- Qin, X.B.; Li, Y.E.; Wang, H.; Li, J.L.; Wan, Y.F.; Li, Y.; Liao, Y.L.; Fan, M.R.; Zhu, J.M.; Gao, Z.Q.; et al. Impact of biochar amendment on carbon emissions intensity in double rice field in South China. Trans. CSAE 2015, 31, 226–234. [Google Scholar]
- Weller, S.; Janz, B.; Jorg, L.; Kraus, D.; Racela, H.S.U.; Wassmann, R.; Butterbach-Bahl, K.; Kiese, R. Greenhouse gas emissions and global warming potential of traditional and diversified tropical rice rotation systems. Glob. Chang. Biol. 2016, 22, 432–448. [Google Scholar] [CrossRef] [PubMed]
- Breidenbach, B.; Blaser, M.B.; Klose, M.; Conrad, R. Crop rotation of flooded rice with upland maize impacts the resident and active methanogenic microbial community. Environ. Microbiol. 2015, 18, 2868–2885. [Google Scholar] [CrossRef]
- Breidenbach, B.; Brenzinger, K.; Brandt, F.B.; Blaser, M.B.; Conrad, R. The effect of crop rotation between wetland rice and upland maize on the microbial communities associated with roots. Plant Soil. 2017, 419, 435–445. [Google Scholar] [CrossRef]
- Conrad, R. Control of microbial methane production in wetland rice fields. Nutr. Cycl. Agroecosyst. 2002, 64, 59–69. [Google Scholar] [CrossRef]
- Cai, Z.C.; Xing, G.X.; Shen, G.Y.; Xu, H.; Yan, X.Y.; Tsuruta, H.; Minami, K. Measurements of CH4 and N2O emissions from rice paddies in Fengqiu, China. Soil. Sci. Plant. Nutr. 1999, 45, 1–13. [Google Scholar] [CrossRef]
- Zheng, X.H.; Wang, M.X.; Wang, Y.S.; Shen, R.X.; Gou, J.; Li, J.; Jin, J.S.; Li, L.T. Impacts of soil moisture on nitrous oxide emission from croplands: A case study on the rice-based agro-ecosystem in Southeast China. Chemosphere—Glob. Chang. Sci. 2000, 2, 207–224. [Google Scholar] [CrossRef]
- Shang, Q.Y.; Yang, X.X.; Gao, C.M.; Wu, P.P.; Liu, J.J.; Xu, Y.C.; Shen, Q.R.; Zou, J.W.; Guo, S.W. Net annual global warming potential and greenhouse gas intensity in Chinese double rice-cropping systems: A 3-year field measurement in long-term fertilizer experiments. Glob. Chang. Biol. 2011, 17, 2196–2210. [Google Scholar] [CrossRef]
- Baldur, J.; Sebastian, W.; David, K.; Heathcliff, S.R.; Reiner, W.; Klaus, B.B.; Ralf, K. Greenhouse gas footprint of diversifying rice cropping systems: Impacts of water regime and organic amendments. Agric. Ecosyst. Environ. 2019, 270–271, 41–54. [Google Scholar]
- Zou, J.; Huang, Y.; Zheng, X.; Wang, Y. Quantifying direct N2O emissions in paddy fields during rice growing season in mainland China: Dependence on water regime. Atmos. Environ. 2007, 41, 8030–8042. [Google Scholar] [CrossRef]
- Zhang, A.F.; Cheng, G.; Qaiser, H.; Zhang, M.; Feng, H.; Miles, D.; Sun, B.H.; Zhao, Y.; Chen, H.X.; Chen, J.; et al. Contrasting effects of straw and straw–derived biochar application on net global warming potential in the Loess Plateau of China. Field Crops Res. 2017, 205, 45–54. [Google Scholar] [CrossRef]
- Yao, Z.S.; Zheng, X.H.; Xie, B.H.; Mei, B.L.; Wang, R.; Butterbach-Bahl, K.; Zhu, J.G.; Yin, R. Tillage and crop residue management significantly affects N-trace gas emissions during the non-rice season of a subtropical rice–wheat rotation. Soil Biol. Biochem. 2009, 41, 2131–2140. [Google Scholar] [CrossRef]
- Wang, W.; Wu, X.; Chen, A.; Xie, X.; Wang, Y.; Yin, C. Mitigating effects of ex situ application of rice straw on CH4 and N2O emissions from paddy-upland coexisting system. Sci. Rep. 2016, 6, 37402. [Google Scholar] [CrossRef]
- Zheng, H.; Huang, H.; Yao, L.; Liu, J.; He, H.; Tang, J. Impacts of rice varieties and management on yield-scaled greenhouse gas emissions from rice fields in China: A meta-analysis. Biogeosciences 2014, 11, 3685–3693. [Google Scholar] [CrossRef]


| Crop Management Activities | 2017 | 2018 | |
|---|---|---|---|
| Crop cultivation | |||
| First season | Maize | 29 Mar: sowing, 23 Apr: transplanting, 15 Jul: harvesting | 30 Mar: sowing, 22 Apr: transplanting, 16 Jul: harvesting |
| Early rice | 29 Mar: sowing, 2 May: transplanting, 20 Jul: harvesting | 25 Mar: sowing, 3 May: transplanting, 18 Jul: harvesting | |
| Ratooning rice | 29 Mar: sowing, 2 May: transplanting, 15 Aug: harvesting | 25 Mar: sowing, 3 May: transplanting, 10 Aug: harvesting | |
| Second season | Late rice | 27 Jun: sowing, 27 Jul: transplanting, 3 Nov: harvesting | 22 Jun: sowing, 27 Jul: transplanting, 1 Nov: harvesting |
| Regeneration of season | 3 Nov: harvesting | 23 Oct: harvesting | |
| Fertilizer application | |||
| First season | Maize | 29 Mar: NPK (345 kg·ha−1) | 30 Mar: NPK (345 kg·ha−1) |
| Early rice | 1 May: NPK (563 kg·ha−1) | 2 May: NPK (750 kg·ha−1) | |
| 7 May: Urea (78 kg·ha−1) | 10 May: Urea (52 kg·ha−1) | ||
| 14 Jun: Urea (117 kg·ha−1) | 2 Jun: Urea (78 kg·ha−1) | ||
| Main rice | 1 May: NPK (628 kg·ha−1) | 2 May: NPK (750 kg·ha−1) | |
| 7 May: Urea (88 kg·ha−1) | 10 May: Urea (69 kg·ha−1) | ||
| 26 Jun: Urea (130 kg·ha−1) | 24 Jun: Urea (103 kg·ha−1) | ||
| 28 Jul: Urea (163 kg·ha−1) | 1 Aug: Urea (162 kg·ha−1) | ||
| Second season | Late rice | 26 Jul: NPK (450 kg·ha−1) | 26 Jul: NPK (450 kg·ha−1) |
| 4 Aug: Urea (157 kg·ha−1) | 4 Aug: Urea (155 kg·ha−1) | ||
| 30 Aug: Urea (78 kg·ha−1) | 23 Aug: Urea (78 kg·ha−1) | ||
| Ratooning rice | 25 Aug: Urea (163 kg·ha−1) | 20 Aug: Urea (162 kg·ha−1) |
| Year | Treatment | 1st Season | 2nd Season | Annual | |||
|---|---|---|---|---|---|---|---|
| CH4 | N2O | CH4 | N2O | CH4 | N2O | ||
| 2017 | DR | 129.96 ± 24.19 b | 1.32 ± 0.05 c | 273.18 ± 98.00 a | 4.19 ± 0.72 a | 403.15 ± 124.89 a | 5.51 ± 0.25 b |
| MR | 23.83 ± 4.00 c | 5.28 ± 1.35 a | 95.62 ± 2.57 b | 5.21 ± 1.88 a | 119.45 ± 11.22 c | 10.49 ± 0.05 a | |
| Rr | 198.69 ± 46.55 a | 3.94 ± 0.40 b | 97.58 ± 17.34 b | 1.21 ± 0.18 b | 296.27 ± 13.70 b | 5.15 ± 2.96 b | |
| 2018 | DR | 76.23 ± 5.14 b | 4.89 ± 2.02 b | 82.64 ± 11.50 a | 7.18 ± 0.30 a | 158.87 ± 16.64 a | 12.06 ± 2.44 b |
| MR | 11.94 ± 1.07 c | 10.96 ± 2.50 a | 22.41 ± 3.26 b | 8.48 ± 2.21 a | 34.35 ± 7.95 b | 19.44 ± 2.58 a | |
| Rr | 140.88 ± 3.68 a | 3.85 ± 0.08 b | 23.06 ± 4.04 b | 4.41 ± 1.49 b | 163.94 ± 4.89 a | 8.27 ± 2.22 b | |
| Average | DR | 103.10 ± 9.53 b | 3.10 ± 0.99 b | 177.91 ± 43.25 a | 5.68 ± 1.51 a | 281.01 ± 52.78 a | 8.79 ± 1.04 b |
| MR | 17.89 ± 1.02 c | 8.12 ± 2.39 a | 59.01 ± 1.46 b | 6.85 ± 2.23 a | 76.90 ± 6.91 bc | 14.97 ± 3.43 a | |
| Rr | 169.79 ± 24.78 a | 3.90 ± 1.41 b | 60.32 ± 19.83 b | 2.81 ± 1.51 b | 230.10 ± 66.09 a | 6.71 ± 1.11 b | |
Disclaimer/Publisher’s Note: The statements, opinions and data contained in all publications are solely those of the individual author(s) and contributor(s) and not of MDPI and/or the editor(s). MDPI and/or the editor(s) disclaim responsibility for any injury to people or property resulting from any ideas, methods, instructions or products referred to in the content. |
© 2023 by the authors. Licensee MDPI, Basel, Switzerland. This article is an open access article distributed under the terms and conditions of the Creative Commons Attribution (CC BY) license (https://creativecommons.org/licenses/by/4.0/).
Share and Cite
Li, C.; Zhu, J.; Li, X.; Deng, J.; Yang, W.; Zhou, Y.; Li, S.; Yi, L.; Liu, Z.; Zhu, B. CH4 and N2O Emission and Grain Yield Performance of Three Main Rice-Farming Patterns in Central China. Agronomy 2023, 13, 1460. https://doi.org/10.3390/agronomy13061460
Li C, Zhu J, Li X, Deng J, Yang W, Zhou Y, Li S, Yi L, Liu Z, Zhu B. CH4 and N2O Emission and Grain Yield Performance of Three Main Rice-Farming Patterns in Central China. Agronomy. 2023; 13(6):1460. https://doi.org/10.3390/agronomy13061460
Chicago/Turabian StyleLi, Chengwei, Jie Zhu, Xinyu Li, Jiao Deng, Wei Yang, Yong Zhou, Shaoqiu Li, Lixia Yi, Zhangyong Liu, and Bo Zhu. 2023. "CH4 and N2O Emission and Grain Yield Performance of Three Main Rice-Farming Patterns in Central China" Agronomy 13, no. 6: 1460. https://doi.org/10.3390/agronomy13061460