Article

Cotton Blight Identification with Ground Framed Canopy Photo-Assisted Multispectral UAV Images

1
College of Natural Resources and Environment, South China Agricultural University, Guangzhou 510642, China
2
College of Horticulture, South China Agricultural University, Guangzhou 510642, China
3
College of Plant Protection, South China Agricultural University, Guangzhou 510642, China
4
Institute of Agricultural Economics and Information, Guangdong Academy of Agricultural Science, Guangzhou 510640, China
5
Department of Geography & Anthropology, Louisiana State University, Baton Rouge, LA 70803, USA
*
Author to whom correspondence should be addressed.
Agronomy 2023, 13(5), 1222; https://doi.org/10.3390/agronomy13051222
Submission received: 30 March 2023 / Revised: 22 April 2023 / Accepted: 23 April 2023 / Published: 26 April 2023
(This article belongs to the Special Issue Application of Remote Sensing and GIS Technology in Agriculture)

Abstract

:
Cotton plays an essential role in global human life and economic development. However, diseases such as leaf blight pose a serious threat to cotton production. This study aims to advance the existing approach by identifying cotton blight infection and classifying its severity at a higher accuracy. We selected a cotton field in Shihezi, Xinjiang in China to acquire multispectral images with an unmanned airborne vehicle (UAV); then, fifty-three 50 cm by 50 cm ground framed plots were set with defined coordinates, and a photo of its cotton canopy was taken of each and converted to the L*a*b* color space as either a training or a validation sample; finally, these two kinds of images were processed and combined to establish a cotton blight infection inversion model. Results show that the Red, Rededge, and NIR bands of multispectral UAV images were found to be most sensitive to changes in cotton leaf color caused by blight infection; NDVI and GNDVI were verified to be able to infer cotton blight infection information from the UAV images, of which the model calibration accuracy was 84%. Then, the cotton blight infection status was spatially identified with four severity levels. Finally, a cotton blight inversion model was constructed and validated with ground framed photos to be able to explain about 86% of the total variance. Evidently, multispectral UAV images coupled with ground framed cotton canopy photos can improve cotton blight infection identification accuracy and severity classification, and therefore provide a more reliable approach to effectively monitoring such cotton disease damage.

1. Introduction

Cotton (Gossypium hirsutum L.) is an important economic crop in the world and grown in more than 80 countries [1], which has a great impact on global socio-economic development and people’s livelihood [2]. Cotton is extremely vulnerable to the invasion of pests and diseases, especially diseases such as leaf blight [3], which badly impacts cotton yield and quality. Therefore, generating a rapid and accurate approach to identify cotton leaf blight and other diseases has been a challenging issue and research hotspot [4,5].
Digital image analysis, being able to quickly extract color change in crop leaves from their image and calculate the percentage of leaf area infected by diseases and insects (such as necrosis, yellowing or spore formation) is increasingly applied to identify crop pests and diseases [6,7,8]. So far, this kind of analysis mostly relies upon color space changes to determine the infection degree.
An unmanned airborne vehicle (UAV) is usually used to monitor the progress of crops’ infection by common diseases and insects [9,10,11]. These crops mainly include sugarcane, banana, cotton, etc. [12,13,14,15,16]. Because multispectral UAV images have advantages not only in high efficiency, sensitivity, and low cost, but also in providing unprecedented spatio-temporal spectral vegetation information [17,18], whose implementation, however, usually needs to be coupled with traditional ground survey data and experts, so as to build a cotton disease identification model. The latter is generally not only laborious, time consuming and impractical for large fields, but also of low accuracy due probably to large variations with individual experts. For instance, the sampling accuracy of human–machine remote sensing images has been documented to be quite different for identifying cotton diseases, which would hinder the application and development of UAV in the field of cotton disease identification [19,20]. Some efforts have been made to solve this issue in some ways. For example, Xavier et al. used UAV to monitor cotton leaf blight by obtaining multispectral images at different flight heights, which, despite an overall detecting accuracy of 79%, had some difficulties in classifying the blight infection severity [21]. A similar conclusion was drawn by Thomasson et al. [22] for classifying the cotton root rot infection.
How to improve image-inference accuracy of cotton blight infection by optimizing the procedure of either target spectral extraction from UAV images, training sample acquisition, or both, is what this study aimed to establish. In other words, this study was designed to face such a challenge by taking cotton canopy camera photos from the ground framed plots as training and validation samples to extract target spectral bands from multispectral UAV images, and then develop an inversion model for predicting cotton blight infection.

2. Materials and Methods

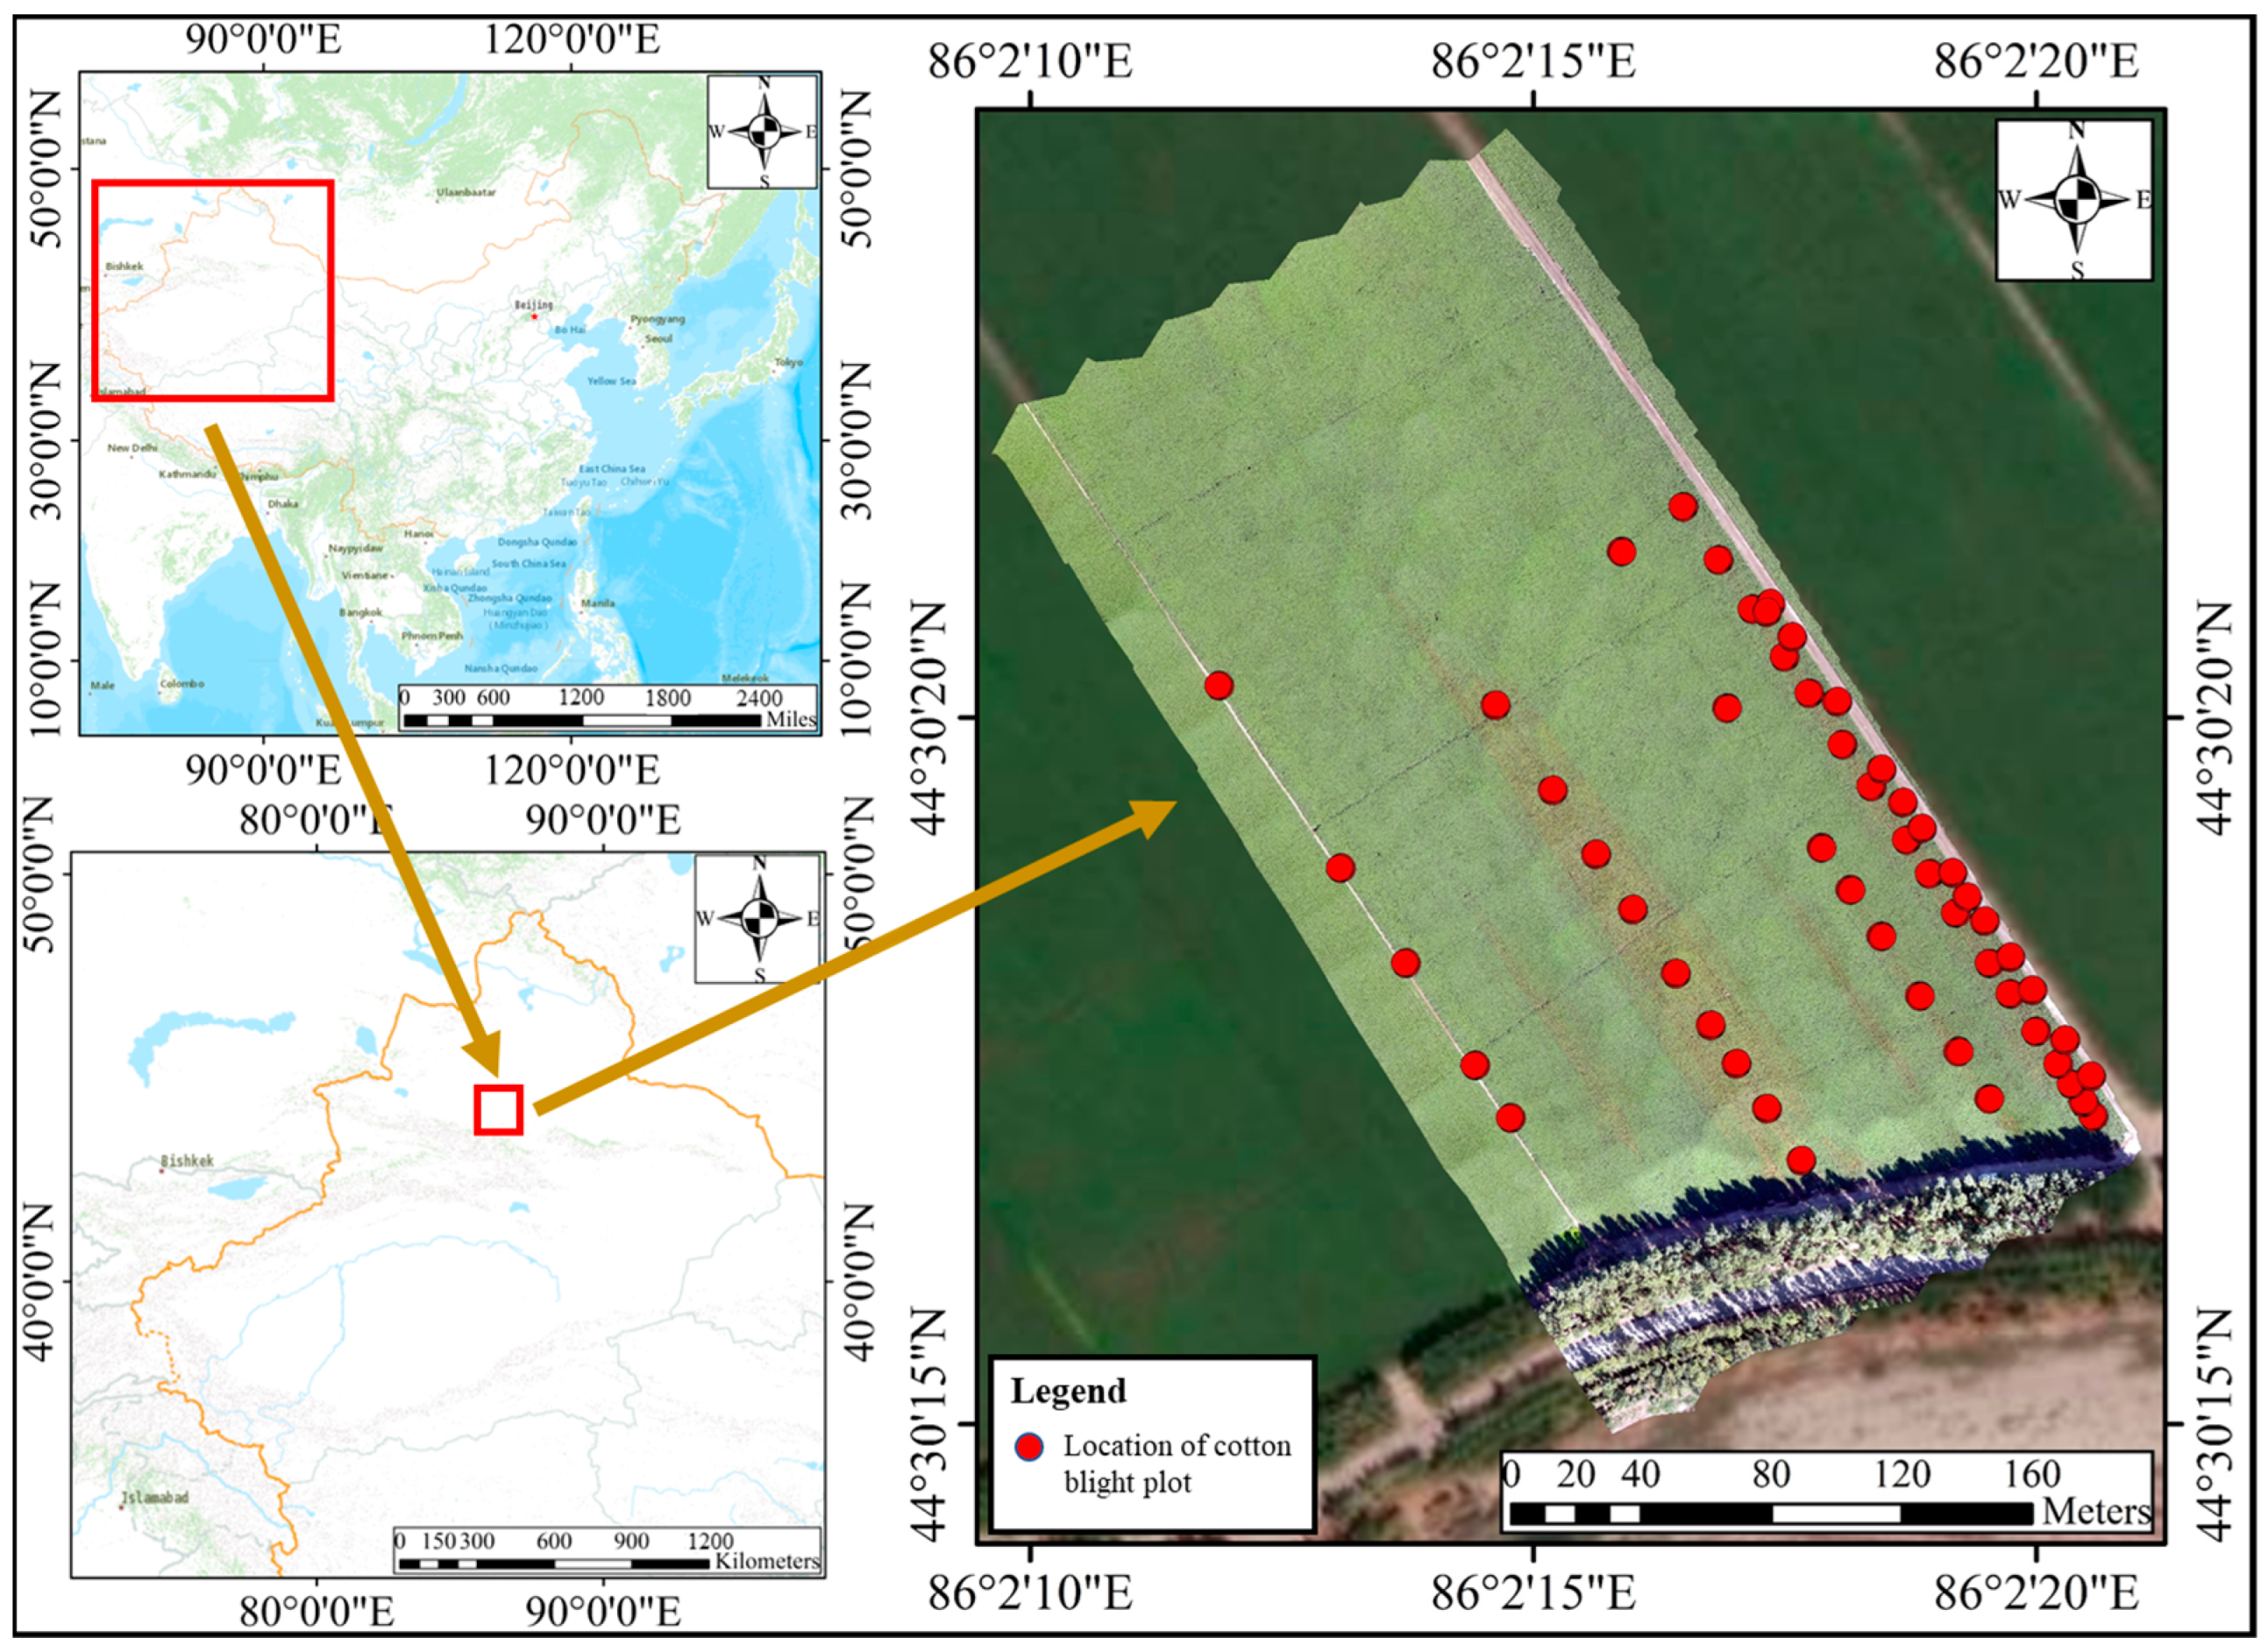
2.1. Overview of the Study Area

A cotton growing field (about 29,800 m2) was selected as our experimental area. It is located in Erlian, Sanfenchang, Shihezi City, Xinjiang Uygur Autonomous Region, China (86°1′~86°2′ E, 44°29′~44°30′ N) (see Figure 1). This area belongs to the temperate continental arid and semi-arid climate zone. It is sunny and less cloudy with an annual sunshine of about 3000 h and a large difference in temperature between day and night, which is very suitable for planting cotton [23,24].

2.2. Multispectral UAV Data Acquisition and Preprocessing

2.2.1. Data Acquisition

We used a DJI Phantom 4 multispectral UAV with an RGB camera and a multispectral camera. The multispectral camera includes 5 bands (Blue, Green, Red, Rededge and NIR), referring to the central wavelengths of 450 ± 16 nm (Blue), 560 ± 16 nm (Green), 650 ± 16 nm (Red), 730 ± 16 nm (Rededge), and 840 ± 26 nm (NIR), respectively.
The UAV images were obtained for the whole study area at 12:00−13:00 on 1 August 2021, when the weather was clear, with no strong wind, and the temperature of about 30 °C. The time interval was at the peak of the incidence of cotton blight. When the sun altitude angle was similar to that of the UAV cloud platform, the flight height of the UAV was set at 50 m to take images with a resolution of 27 mm, 75% forward overlap and 80% side overlap. Prior to the flight, six 30 cm × 30 cm positioning targets were set at each edge of the study area as ground control points, as illustrated by Figure 2A, and the RTK GNSS was used to measure the coordinates of its center point to calibrate the coordinates of the UAV images. In order to eliminate the influence of reflection characteristics and sunlight changes on the imagery, a set of corrected images was taken before and after the flight, with the camera on the aircraft, which was placed at a height of 5 meters from the diffuse reflection reference plate (SG series came with a reflectivity of 40%, and the reference plate was in the middle of the screen. See Figure 2B).

2.2.2. Data Preprocessing

The UAV images were preprocessed using DJI Terra (v3.0.2), including initialization processing, aerotriangulation, radiation correction, feature point matching (edge connection, color adjustment, mosaic, cropping), the calculation of spectral vegetation indices (SVIs), the generation of RGB images and vegetation index image. The ground target was used as the image control point for processing aerotriangulation, and two diffuse reflection reference plates (one was taken before the flight, and another was after the flight) were introduced for radiation correction so as to ensure the accuracy of geometric and radiation corrections of UAV images. Ultimately, the multispectral UAV digital orthophotos (DOM) with 27 mm spatial resolution were generated.

2.2.3. Collection of Blight-Infected Canopy Information from Ground Framed Plots

After the UAV images were acquired, an artificially made 50 cm × 50 cm frame was placed upon the cotton canopy (Figure 3A), and RTK GNSS equipment was used to measure the coordinates of the four corners of the frame as shown in Figure 3B; then, a 16-megapixel camera was used to shoot an RGB image (JPEG, being a resolution about 1 mm) as one of the ground sample images by covering the frame vertically downward from about 1 meter above the cotton canopy. Afterwards, 63 groups of cotton canopy images from all ground framed plots were sequentially acquired (see the right half of the image in Figure 1).

2.2.4. Training and Testing Samples

A total of 63 groups of cotton canopy data were obtained from all ground samples in this study, of which 10 groups of cotton canopy data had no blight infection, and since the uninfected data did not change, these data were not involved in the training and testing of the model, while the remaining 53 groups of cotton canopy data came with different infection levels (low infection, moderate infection, and severe infection), and these 53 groups would be involved in the training and testing of the model. Among the 53 groups, the samples were randomly selected according to the ratio of training to testing data of 8:3, so the training samples were 39 groups and the testing samples were 14 groups.

2.3. Methods

2.3.1. Extraction of Spectral Bands of Ground Framed Samples

Because of a high correlation of the R, G, and B color components with low infection, the RGB color space is not conducive to the extraction of cotton leaf blight information. According to [25], the a-component of the L*a*b* color space appears to be more suitable for extracting disease infection (where L* refers to the brightness of the color, a* to the color range from green to red, and b* to the color range from blue to yellow). Therefore, we tried to follow this color space model to convert the ground framed images from RGB space to L*a*b* color space with independent color and brightness information, and to perform the automatic identification of cotton leaf blight infection. In other words, the L*a*b* color space model converts an image into a set of color data to describe brightness and hue. Since an RGB image cannot be directly converted to an L*a*b* image, it is required firstly to convert the RGB color space to XYZ color space (CIE 1931 XYZ, being the basis of almost all color spaces), then to convert the XYZ color space to the L*a *b* color space [26].
The formula for converting RGB color space to XYZ color space are as follows:
X = 0.4124R + 0.3576G + 0.1805B
Y = 0.2126R + 0.7152G + 0.0722B
Z = 0.0193R + 0.1192G + 0.9505B
where X, Y, and Z are values of three color channels of the XYZ color space, respectively.
Then, convert the XYZ color space to the L*a*b* color space:
L = 116 f Y / Y n 16
a = 500 [ f X / X n f ( Y / Y n ) ]
b = 200 [ f Y / Y n f ( Z / Z n ) ]
where Xn, Yn, Zn are the CIE XYZ tristimulus values with reference to the white point, respectively, and take 95.0456, 100.0000, and 108.8754 for calculation; f is a function with the ratio of the color channel value to the stimulus value as a variable. The value of f is as follows:
f t = t 1 / 3 ,       i f   t > ( 6 29 ) 3 1 3 ( 29 6 ) 2 + 16 116 , o t h e r w i s e
where t is the ratio of the color channel value to the stimulus value in the XYZ color space.
Following the procedure and models described above, each of the original images was firstly converted to the XYZ color space, and then to L*a*b* color space for cotton blight infection identification, respectively.

2.3.2. Multiple Regression Analysis and Validation

The extraction of crop blight infection is usually achieved with vegetation indices such as NDVI [27,28], GNDVI [29], etc.
Because of its advantage in describing the dependency structure in isolation from the correlation coefficients of the underlying continuous variable distributions [30], a stepwise multiple regression model was preferentially used in this study to describe the relationship between multiple variables in which the entry probability was set to 0.05 and the removal probability to 0.1. Finally, of all 8 remote sensing variables (Red, Rededge, NIR, NDVI, GNDVI, LCI, OSAVI and NDRE), only NDVI and GNDVI were selected to build a multiple regression model as Equation (8), because these two indices together can make the highest contribution to explain 84% of the total variance.
Given the dependent variable (Y) is the severity of blight infection and the independent variable is a combination of multiple influencing factors, then
Y = β 0 + β 1 X 1 + β 2 X 2 + + β n X n
where β0 is the intercept, and βi and Xi (i = 0, 1, 2, …, n) are the slope coefficients and independent variables, respectively.
At present, the commonly used remote sensing variables for the cotton blight infection model include image band information and its related vegetation indices. In this study, five kinds of vegetation indices were extracted from the multispectral UAV images that correspond exactly to the size and position of each ground framed plot to form 39 groups of multispectral data corresponding to ground sample plots. The threshold (pixel) segmentation method was used to generate binary images for the interest area and consequently to generate 39 groups of cotton blight-infected data. Based on the analysis of significant correlations between 8 remote sensing variables and wilt incidence, the Red, Rededge, and NIR bands and their associated vegetation indices listed in Table 1 were therefore selected as independent variables, and the cotton blight-infected rates observed from 39 ground framed plots (excluding the plots with no blight infection) were considered as the dependent variable, and stepwise multiple regression models were constructed. Finally, a stepwise multiple regression model was used to establish the spatial relationship between the infected or uninfected cotton canopy and the SVIs extracted from images.

2.3.3. Classification of Blight Infection Severity

After treatment of each ground framed cotton canopy photo following the processes as described in Section 2.3.1, the artificial empirical threshold method was used to binarize the L component to obtain a binary image whose pixels were then divided into the blight-infected pixels and non-infected ones. The proportion of the blight-infected pixels in the total plot pixels was taken as the blight-infected rate in the plot and classified into four types: healthy or no-infected (D0), low or 0−5% infected (D1), moderate or 5−25% (D2), and severe or 25−50% (D3) according to the proportion of blight-infected pixels in the whole plot [21].

3. Results

3.1. Cotton Blight-Infected Severity and Distribution

The cotton canopy photo from each ground framed plot was converted to the L*a*b* color space, as shown in Figure 4A, and then the L component of the L*a*b* color space was binarized to become a binary image, as presented in Figure 4B.
According to the procedure and the classification of blight infection severity as described in the Section 2.3.3, the four levels of blight-infected severity samples are illustrated in Figure 5.
Finally, the cotton blight-infected portion of each ground framed plot was calculated to present in Table 2, from which the 63 groups of the ground framed plots were counted into groups as follows: 10 plots were classified into the no infection (D0), 13 plots into the low infection (D1), 33 plots into the moderate infection (D2), and 7 plots into the severe infection (D3). Of all ground framed plots, the total blight infection rate accounted for about 46.8%, of which the infection severity of D1, D2, and D3 was 3.5 ± 1.0%, 13.6 ± 5.2%, and 29.7 ± 2.9%, respectively.

3.2. Changes in Spectral Bands of Cotton Blight Infection

The reflectivity of five bands in the multispectral UAV images were extracted in correspondence to each ground framed area.
According to Figure 6, the difference between four blight-infected levels in the Blue band is not obvious; the reflectance of D0 in either Green or Rededge band is slightly higher than that of the other three types; the reflectance of D3 in the Red band is slightly higher than that of other three types. The reflectance of D0 is significantly larger than that of both D2 and D3 whose difference is not evident; and the characteristics in the NIR band are basically the same as those in the Rededge band, but the difference between D2 and D3 is obvious.
The observed cotton blight-infected rates in Table 2 were used to extract the reflectance of each of the five bands in the corresponding area of the multispectral UAV image. Then such reflectance and the corresponding cotton blight-infected rate were considered as the independent and the dependent variable, respectively, to run the Pearson correlation. The correlation coefficients and their significances from the Pearson correlation of the leaf blight-infected rate with bands of UAV imagery are presented in Table 3.
As presented in Table 3, the cotton blight-infected rate is significantly correlated to the Red, Rededge, and NIR bands at p < 0.001 level. In other words, Red, Rededge and NIR are the spectral bands most sensitive to the change in leaf color caused by blight infection.

3.3. The Cotton Blight Infection Inversion Model

After stepwise multiple regression analysis using 39 grounds of training samples, only both NDVI and GNDVI were verified to be able to make significant contribution to the cotton blight infection inversion model for the study area as follows:
Y = 2.001 − 4.244X1 + 2.218X2
where Y is the cotton leaf blight-infected rate, X1 and X2 are the independent variables NDVI, and GNDVI, respectively. This model was verified to have an accuracy as high as about 84%.
Meanwhile, we used the cotton blight-infected data from the remaining 14 grounds of framed plots (not included in building the Equation (9) model) to validate the prediction accuracy of the inversion model (Equation (9)), and the results are presented in Figure 7A and indicate an explainable variance of about 86% with an error < ±6% (see Figure 7B).
According to the inversion model, the distribution of cotton blight in the study area was inferred to illustrate in Figure 8. Of the total study area, 34.8% of the areas were the no infection area (green), 38.5% were low inflection (blue), 25.2% were moderate infection (yellow), and 1.5% were severe infection (red). The severely infected areas were relatively concentrated in a continuous strip and band, which could be the reason why the results from the inversion model simulation appear to differ from those observed from the ground framed plots.

4. Discussion

4.1. Improvement of UAV Image-Based Identification of Blight Infection

In this study, the DJI Phantom 4 multispectral UAV was used to obtain continuous cotton canopy images over the study area. Digital camera photos were obtained from each geographically positioned ground framed plot that was placed upon the cotton canopy as illustrated in Figure 3. These camera photos were then converted to the L*a*b* color space to exact blight-infected spots and their clusters. Of these photos, 39 (from 39 ground framed plots) were also used as the training samples for establishing the blight prediction model and 14 as the ground inspection points for validating the accuracy of the modeling outputs. Such an approach designed for this study has been demonstrated to be able to not only advance the extraction and interpretation of cotton blight information from multispectral UAV images, but also improve the accuracy of remote sensing variables-driven inversion model for identifying blight-infected rate and severity, which is of great significance for effectively monitoring cotton leaf blight disease. Generally, our approach can make it more accurate and reliable to detect and monitor blight infection at a farm field scale in comparison to the previously reported approaches. For example, Yang used airborne hyperspectral cameras and multispectral cameras to detect and map cotton root rot areas from 50 sample points cross cotton growing fields, and then manually judged them as either healthy or infected areas only (not able to classify the infection severity) [36]. Xavier et al. monitored cotton blight infection using multispectral UAV images acquired at different flight heights [21]. Although an optimal height was observed to acquire the best images for detecting blight infection with an overall accuracy of 79%, some limitations still remain to the infection severity classification.

4.2. Spectral Analysis of Cotton Diseases

The vegetation index is an enhancement of the original spectral reflectance. As shown in Figure 6 and Table 3, Red, Rededge, and NIR bands were observed to be significantly sensitive to the cotton blight infection. Most of the vegetation indices selected in this study were correlated with Red, Rededge, and NIR bands, while only NDVI and GNDVI were selected for the T-test by stepwise multiple regression analysis. The correlation between both NDVI and GNDVI and the cotton blight rate was higher, and both indices were more sensitive to cotton blight rate, so they were selected as more convincing variables for model construction. Previous studies documented that the main spectral bands sensitive to blight infection are the Green and Red-NIR bands. Zhang et al. observed that the featured spectrums of a blight-infected banana canopy are the Red and NIR bands; therefore, the multispectral UAV images were used to establish a classification model for inferring banana blight infection [37]. Dang et al. found that the NDVI extraction method is more direct and effective than the RGB-based learning methods for identifying radish blight infection [38]. The green chlorophyll index (CIgreen), red edge chlorophyll index (CIRE), NDVI, and NDRE SVIs were reported to be very suitable for identifying banana blight [39]. Although many different sensitive bands and vegetation indices were found in other studies on blight and the present study, similarities were found between the sensitive bands (Red, Rededge and NIR bands) and vegetation indices (NDVI, GNDVI) in the present study, which has proved that these remote sensing variables could be used for blight identification.
Evidently, Red, Rededge, and NIR bands and their associated NDVI and GNDVI are most sensitive to the changes in leaf color directly resulting from blight infection and can make a significant contribution to the identification of cotton blight infection, as illustrated in Figure 8.

4.3. Prospects for Agricultural Disease Identification

This study utilized an innovative ground framed sampling plot method to identify cotton blight. This method was mainly designed to make up for the deficiencies of previous researchers in the ground real survey of the disease and make it correspond accurately to the position on the UAV images, thus improve the identification accuracy of the disease. The approach used in this study did make the ground-observed blight infected information correspond accurately to the position on the UAV multispectral images. Inspired by this study, this survey method can be applied not only to crop disease identification but also to generate other phenotypic indicators of crops (e.g., crop canopy leaf SPAD, LAI, and water content, etc.) in the future, and the prediction accuracy of phenotypic indicators can be improved continuously [40].
The stepwise multiple regression analysis used in this study to construct the model did successfully invert the distribution of cotton blight, and the accuracy was improved to some extent. For the future progress in agricultural disease identification, further improvement or innovation is still needed, and we can try to combine various methods to realize the model construction, such as random forest, machine learning and support vector machine, all in order to identify crop diseases more accurately and quickly, and to provide important support for remote sensing in the field of agricultural diseases’ identification.

5. Conclusions

This study provides a new hypothesis for cotton blight identification by arranging ground framed plots. The results confirmed that the approach used in this study is feasible and can successfully establish a predictive model for cotton blight identification with a higher accuracy. This study used a multispectral UAV platform to acquire cotton canopy images for detecting blight infection, which was coupled with extra canopy photos taken with a higher spatial resolution camera from 53 geographically positioned ground framed plots, respectively. These extra photos were used as training and validation samples after their conversion to the L*a*b* color spaces. As a result, the Red, Rededge, and NIR bands of UAV imagery were observed to strongly correlate with the cotton blight-infected rate; both NDVI and GNDVI indices were confirmed to be major remote sensing variables driving an inversion model for identifying the blight infection. It is just the configuration of the geographically positioned ground framed plots that improves the inference accuracy of cotton blight infection information from UAV images by increasing the accuracy from the general 79% up to 86% explainable variance. More importantly, it is just the configuration that makes the blight infection severity able to be differentiated at more detailed levels because of a much higher spatial resolution of canopy photos. That is at least one of advantages of the approach proposed here.

Supplementary Materials

The following supporting information can be downloaded at: https://www.mdpi.com/article/10.3390/agronomy13051222/s1.

Author Contributions

C.W.: Conceptualization, Data curation, Formal analysis, Funding acquisition, Investigation, Methodology, Project administration, Software, Supervision, Writing—review & editing. Y.C.: Conceptualization, Data curation, Formal analysis, Investigation, Methodology, Resources, Validation, Visualization, Writing—original draft. Z.X.: Data curation, Investigation, Resources, Supervision. X.Z.: Data curation, Investigation, Resources, Supervision. S.T.: Data curation, Investigation, Resources, Supervision. F.L.: Conceptualization, Formal analysis, Methodology. L.Z.: Conceptualization, Supervision. X.M.: Conceptualization, Supervision. S.L.: Conceptualization, Funding acquisition, Methodology, Project administration, Writing—review & editing. All authors have read and agreed to the published version of the manuscript.

Funding

The first batch of key scientific and technological projects in Guangxi transportation industry in 2020 (Research and application of freeway construction management system based on UAV Technology). Key-Area Research and Development Program of Guangdong Province (2022B0202080001).

Data Availability Statement

The data presented in this study are available in the Supplemental Material.

Acknowledgments

Authors would like to take this opportunity to gratefully thank the editors and six anonymous reviewers for their outstanding comments and suggestions, which greatly helped us to improve the quality of our manuscript.

Conflicts of Interest

This research did not receive any specific grant from funding agencies in the public, commercial, or not-for-profit sectors. The authors declare that they have no known competing financial interests or personal relationships that could have appeared to influence the work reported in this paper.

References

  1. Xun, L.; Zhang, J.H.; Cao, D.; Yang, S.S.; Yao, F.M. A novel cotton mapping index combining Sentinel-1 SAR and Sentinel-2 multispectral imagery. ISPRS J. Photogramm. 2021, 181, 148–166. [Google Scholar] [CrossRef]
  2. Feng, L.; Chi, B.J.; Dong, H.Z. Cotton cultivation technology with Chinese characteristics has driven the 70-year development of cotton production in China. J. Integr. Agric. 2022, 21, 597–609. [Google Scholar] [CrossRef]
  3. Kalischuk, M.; Paret, M.L.; Freeman, J.H.; Raj, D.; Da Silva, S.; Eubanks, S.; Wiggins, D.J.; Lollar, M.; Marois, J.J.; Mellinger, H.C.; et al. An Improved Crop Scouting Technique Incorporating Unmanned Aerial Vehicle–Assisted Multispectral Crop Imaging into Conventional Scouting Practice for Gummy Stem Blight in Watermelon. Plant Dis. 2019, 103, 1642–1650. [Google Scholar] [CrossRef]
  4. Kevin, L.C.; Kevin, B.; Terry, W.; Ping, H.; Libo, S. Return of old foes—Recurrence of bacterial blight and Fusarium wilt of cotton. Curr. Opin. Plant Biol. 2019, 50, 95–103. [Google Scholar]
  5. Chen, B.H.; Ouyang, Y.C.; Ou-Yang, M.; Guo, H.Y.; Liu, T.S.; Chen, H.M.; Wu, C.C.; Wen, C.H.; Chang, C.I.; Shih, M.S. Fusarium Wilt Inspection for Phalaenopsis Using Uniform Interval Hyperspectral Band Selection Techniques. In Proceedings of the IGARSS 2020—2020 IEEE International Geoscience and Remote Sensing Symposium, Waikoloa, HI, USA, 26 September–2 October 2020; pp. 2831–2834. [Google Scholar]
  6. Gregorio-Cipriano, R.; De Luna, E.; Gonzalez, D. An assay for the quantification of pathogenicity and virulence of two strains of Podosphaera xanthii (Erysiphaceae) on different hosts from digital images. Sydowia 2022, 74, 277–286. [Google Scholar]
  7. Zhang, S.W.; Wu, X.W.; You, Z.H.; Zhang, L.Q. Leaf image based cucumber disease recognition using sparse representation classification. Comput. Electron. Agric. 2017, 134, 135–141. [Google Scholar] [CrossRef]
  8. Trivedi, V.K.; Shukla, P.K.; Pandey, A. Automatic segmentation of plant leaves disease using min-max hue histogram and k-mean clustering. Multimed. Tools Appl. 2022, 81, 20201–20228. [Google Scholar] [CrossRef]
  9. Soubry, I.; Patias, P.; Tsioukas, V. Monitoring vineyards with UAV and multi-sensors for the assessment of water stress and grape maturity. Unmanned Syst. 2017, 5, 37–50. [Google Scholar] [CrossRef]
  10. Pádua, L.; Marques, P.; Hruška, J.; Adão, T.; Peres, E.; Morais, R.; Sousa, J. Multi-Temporal Vineyard Monitoring through UAV-Based RGB Imagery. Remote Sens. 2018, 10, 1907. [Google Scholar] [CrossRef]
  11. Ampatzidis, Y.; Partel, V.; Meyering, B.; Albrecht, U. Citrus rootstock evaluation utilizing UAV-based remote sensing and artificial intelligence. Comput Electron Agric. 2019, 164, 104900. [Google Scholar] [CrossRef]
  12. Ahmadi, P.; Mansor, S.; Farjad, B.; Ghaderpour, E. Unmanned Aerial Vehicle (UAV)-Based Remote Sensing for Early-Stage Detection of Ganoderma. Remote Sens. 2022, 14, 1239. [Google Scholar] [CrossRef]
  13. Heidarian Dehkordi, R.; El Jarroudi, M.; Kouadio, L.; Meersmans, J.; Beyer, M. Monitoring Wheat Leaf Rust and Stripe Rust in Winter Wheat Using High-Resolution UAV-Based Red-Green-Blue Imagery. Remote Sens. 2020, 12, 3696. [Google Scholar] [CrossRef]
  14. Yang, C.; Odvody, G.N.; Fernandez, C.J.; Landivar, J.A.; Minzenmayer, R.R.; Nichols, R.L. Evaluating unsupervised and supervised image classification methods for mapping cotton root rot. Precis Agric. 2015, 16, 201–215. [Google Scholar] [CrossRef]
  15. Wang, T.; Thomasson, J.A.; Yang, C.; Isakeit, T.; Nichols, R.L. Automatic Classification of Cotton Root Rot Disease Based on UAV Remote Sensing. Remote Sens. 2020, 12, 1310. [Google Scholar] [CrossRef]
  16. Wang, T.; Thomasson, J.A.; Isakeit, T.; Yang, C.; Nichols, R.L. A Plant-by-Plant Method to Identify and Treat Cotton Root Rot Based on UAV Remote Sensing. Remote Sens. 2020, 12, 2453. [Google Scholar] [CrossRef]
  17. Almeida, D.R.A.D.; Broadbent, E.N.; Ferreira, M.P.; Meli, P.; Zambrano, A.M.A.; Gorgens, E.B.; Resende, A.F.; de Almeida, C.T.; Do Amaral, C.H.; Corte, A.P.D.; et al. Monitoring restored tropical forest diversity and structure through UAV-borne hyperspectral and lidar fusion. Remote Sens. Environ. 2021, 264, 112582. [Google Scholar] [CrossRef]
  18. Liu, W.; Ji, X.; Liu, J.; Guo, F.; Yu, Z. A Novel Unsupervised Change Detection Method with Structure Consistency and GFLICM Based on UAV Images. J. Geod. Geoinf. Sci. 2022, 5, 91–102. [Google Scholar]
  19. Stewart, E.L.; Wiesner-Hanks, T.; Kaczmar, N.; DeChant, C.; Wu, H.; Lipson, H.; Nelson, R.J.; Gore, M.A. Quantitative Phenotyping of Northern Leaf Blight in UAV Images Using Deep Learning. Remote Sens. 2019, 11, 2209. [Google Scholar] [CrossRef]
  20. Gomez Selvaraj, M.; Vergara, A.; Montenegro, F.; Alonso Ruiz, H.; Safari, N.; Raymaekers, D.; Ocimati, W.; Ntamwira, J.; Tits, L.; Omondi, A.B.; et al. Detection of banana plants and their major diseases through aerial images and machine learning methods: A case study in DR Congo and Republic of Benin. ISPRS J. Photogramm. 2020, 169, 110–124. [Google Scholar] [CrossRef]
  21. Xavier, T.W.F.; Souto, R.N.V.; Statella, T.; Galbieri, R.; Santos, E.S.; Suli, G.S.; Zeilhofer, P. Identification of Ramularia Leaf Blight Cotton Disease Infection Levels by Multispectral, Multiscale UAV Imagery. Drones 2019, 3, 33. [Google Scholar] [CrossRef]
  22. Thomasson, J.A.; Wang, T.; Wang, X.; Collett, R.; Yang, C.; Nichols, R.L. Disease detection and mitigation in a cotton crop with UAV remote sensing. Commer. Sci. Sens. Imaging 2018, 10664, 150–156. [Google Scholar]
  23. Yan, Z.; Hou, F.; Hou, F. Energy Balances and Greenhouse Gas Emissions of Agriculture in the Shihezi Oasis of China. Atmosphere 2020, 11, 781. [Google Scholar] [CrossRef]
  24. Wang, C.; Chen, Q.; Fan, H.; Yao, C.; Sun, X.; Chan, J.; Deng, J. Evaluating satellite hyperspectral (Orbita) and multispectral (Landsat 8 and Sentinel-2) imagery for identifying cotton acreage. Int. J. Remote Sens. 2021, 42, 4042–4063. [Google Scholar] [CrossRef]
  25. Xu, G.J.; Shen, J.; Xu, H.Y. Image segmentation of wheat scab based on lab color space. J. China Agric. Univ. 2021, 26, 149–156. [Google Scholar]
  26. Kahu, S.; Bhurchandi, K.M. JPEG-based Variable Block-Size Image Compression using CIE La*b* Color Space. KSII Trans. Internet Inf. Syst. (TIIS) 2018, 12, 5056–5078. [Google Scholar]
  27. Fern, R.R.; Foxley, E.A.; Bruno, A.; Morrison, M.L. Suitability of NDVI and OSAVI as estimators of green biomass and coverage in a semi-arid rangeland. Ecol. Indic. 2018, 94, 16–21. [Google Scholar] [CrossRef]
  28. Bhandari, M.; Ibrahim, A.M.H.; Xue, Q.; Jung, J.; Chang, A.; Rudd, J.C.; Maeda, M.; Rajan, N.; Neely, H.; Landivar, J. Assessing winter wheat foliage disease severity using aerial imagery acquired from small Unmanned Aerial Vehicle (UAV). Comput. Electron. Agric. 2020, 176, 105665. [Google Scholar] [CrossRef]
  29. Wójtowicz, A.; Piekarczyk, J.; Czernecki, B.; Ratajkiewicz, H. A random forest model for the classification of wheat and rye leaf rust symptoms based on pure spectra at leaf scale. J. Photochem. Photobiol. B Biol. 2021, 223, 112278. [Google Scholar] [CrossRef] [PubMed]
  30. Ebrahimi Kalan, M.; Jebai, R.; Zarafshan, E.; Bursac, Z. Distinction Between Two Statistical Terms: Multivariable and Multivariate Logistic Regression. Nicotine Tob. Res. 2021, 23, 1446–1447. [Google Scholar] [CrossRef] [PubMed]
  31. Rouse, J.W., Jr.; Haas, R.H.; Schell, J.A.; Deering, D.W. Monitoring Vegetation Systems in the Great Plains with Erts; NASA: Washington, DC, USA, 1973; Volume 1, pp. 309–317.
  32. Gitelson, A.A.; Kaufman, Y.J.; Merzlyak, M.N. Use of a green channel in remote sensing of global vegetation from EOS-MODIS. Remote Sens. Environ. 1996, 58, 289–298. [Google Scholar] [CrossRef]
  33. Datt, B. A New Reflectance Index for Remote Sensing of Chlorophyll Content in Higher Plants: Tests using Eucalyptus Leaves. J. Plant Physiol. 1999, 154, 30–36. [Google Scholar] [CrossRef]
  34. Rondeaux, G.; Steven, M.; Baret, F. Optimization of soil-adjusted vegetation indices. Remote Sens. Environ. 1996, 55, 95–107. [Google Scholar] [CrossRef]
  35. Gitelson, A.; Merzlyak, M.N. Spectral Reflectance Changes Associated with Autumn Senescence of Aesculus hippocastanum L. and Acer platanoides L. Leaves. Spectral Features and Relation to Chlorophyll Estimation. J. Plant Physiol. 1994, 143, 286–292. [Google Scholar] [CrossRef]
  36. Yang, C. Assessment of the severity of bacterial leaf blight in rice using canopy hyperspectral reflectance. Precis Agric. 2010, 11, 61–81. [Google Scholar] [CrossRef]
  37. Zhang, S.; Li, X.; Ba, Y.; Lyu, X.; Zhang, M.; Li, M. Banana Fusarium Wilt Disease Detection by Supervised and Unsupervised Methods from UAV-Based Multispectral Imagery. Remote Sens. 2022, 14, 1231. [Google Scholar] [CrossRef]
  38. Dang, L.M.; Wang, H.; Li, Y.; Min, K.; Kwak, J.T.; Lee, O.N.; Park, H.; Moon, H. Fusarium Wilt of Radish Detection Using RGB and Near Infrared Images from Unmanned Aerial Vehicles. Remote Sens. 2020, 12, 2863. [Google Scholar] [CrossRef]
  39. Ye, H.; Huang, W.; Huang, S.; Cui, B.; Dong, Y.; Guo, A.; Ren, Y.; Jin, Y. Recognition of Banana Fusarium Wilt Based on UAV Remote Sensing. Remote Sens. 2020, 12, 938. [Google Scholar] [CrossRef]
  40. Torres, R.; Ferrara, G.; Soto, F.; López, J.A.; Sanchez, F.; Mazzeo, A.; Pérez-Pastor, A.; Domingo, R. Effects of soil and climate in a table grape vineyard with cover crops. Irrigation management using sensors networks. Ciência e Técnica Vitivinícola 2017, 32, 72–81. [Google Scholar] [CrossRef]
Figure 1. Study area and the spatial distribution of ground sampling framed plots in a cotton field in Sanfenchang, Erlian, Shihezi City, Xinjiang in China.
Agronomy 13 01222 g001
Figure 2. Positioning targets set as ground control points to measure the coordinates for calibrating UAV images. (A) the 30 cm by 30 cm positioning target; (B) SG series diffuse reflection reference plate.
Agronomy 13 01222 g002
Figure 3. Establishment of the ground framed plot upon cotton canopy. (A) artificially made 50 cm × 50 cm frame; (B) RTK GNSS equipment set to define each corner coordinates of ground framed plot.
Agronomy 13 01222 g003
Figure 4. Extraction of blight-infected spots on cotton canopy (leaves). (A) the L*a*b* color space converted from an original RGB image (L: Red band; a: Green band; b: Blue band); (B) the binary image by binarizing the L component (Black areas represent non-infected cotton. White areas represent infected cotton).
Agronomy 13 01222 g004
Figure 5. Binary sample images of cotton blight-infected levels: (A) No infection; (B) low infection; (C) moderate infection; (D) severe infection.
Agronomy 13 01222 g005
Figure 6. Reflectance of bands of cotton in association with the cotton blight-infected levels. (Note: D0 refers to the no blight-infected; D1 to the low blight-infected; D2 to the moderate blight-infected; and D3 to the severe blight-infected).
Agronomy 13 01222 g006
Figure 7. Accuracy test of cotton blight infection with an inversion model for the study area. (A) The accuracy of predicting the infection rate of cotton blight-infected rate at 14 inspection points (The Xobs in the formula represents the observed value, Ypred represents the predicted value); (B) Difference of the predicted cotton blight-infected rate from the observed one (# indicates no unit).
Agronomy 13 01222 g007
Figure 8. Cotton blight-infected areas at various infection levels identified from multispectral UAV images and their spatial distribution across the study area (no infection is green, low inflection is blue, moderate infection is yellow, and severe infection is red).
Agronomy 13 01222 g008
Table 1. Special vegetation indices (SVIs) used in this study.
Vegetation IndexDescriptionBandFormulationReference
NDVINormalized difference
vegetation index
Red-NIR(NIR − Red)/
(NIR + Red)
[31]
GNDVIGreen normailized difference
vegetation index
Green-NIR(NIR − Green)/
(NIR + Green)
[32]
LCILeaf chlorophyll indexRed-Rededge-NIR(NIR − Rededge)/
(NIR + Red)
[33]
OSAVIOptimized Soil Adjusted
Vegetation Index
Red-NIR(NIR − Red)/
(NIR + Red + 0.16)
[34]
NDRENormalized difference red
edge index
Rededge-NIR(NIR − Rededge)/
(NIR + Rededge)
[35]
Table 2. Cotton blight-infected proportion observed from each ground framed plot.
Sample Plot #Blight (%)Sample Plot #Blight (%)Sample Plot #Blight (%)Sample Plot #Blight (%)Sample Plot #Blight (%)
Type D1:0–5%Type D2:5–25%Type D3:25–50%
361.9385.32311.01216.52626.4
252.3166.64211.22917.5526.6
522.5407.32112.01317.91128.8
192.6477.43312.22719.2729.0
182.6417.53112.7919.7329.7
353.6517.74312.9119.8432.3
203.9497.83413.71419.9235.3
373.9448.42413.8620.4Mean: 29.7 ± 2.9
504.2229.34814.11522.2
534.3179.41014.42822.4
464.53010.73214.8824.6
394.8Mean: 13.6 ± 5.2
454.8
Mean: 3.5 ± 1.0
# indicates no unit.
Table 3. Pearson correlation of the cotton blight-infected rates to the reflectance of UAV five multispectral bands.
BandCorrelation Coeff. (r)Significance (p)Smaple Size
Blue−0.2740.04739
Green−0.1120.42339
Red0.725039
Rededge−0.4460.00139
NIR−0.537039
p < 0.001 indicates a highly significant correlation and p < 0.01 indicates a significant correlation.
Disclaimer/Publisher’s Note: The statements, opinions and data contained in all publications are solely those of the individual author(s) and contributor(s) and not of MDPI and/or the editor(s). MDPI and/or the editor(s) disclaim responsibility for any injury to people or property resulting from any ideas, methods, instructions or products referred to in the content.

